Annual Gantt Chart
What do you think of this template?


 (2.50/ 5)
10 ratings

 4 Slides
 File size: 16:9
 Fonts: Lato, Calibri
 Supported version
PPT 2010, PPT 2013, PPT 2016
Supported version
PPT 2010, PPT 2013, PPT 2016

Product details
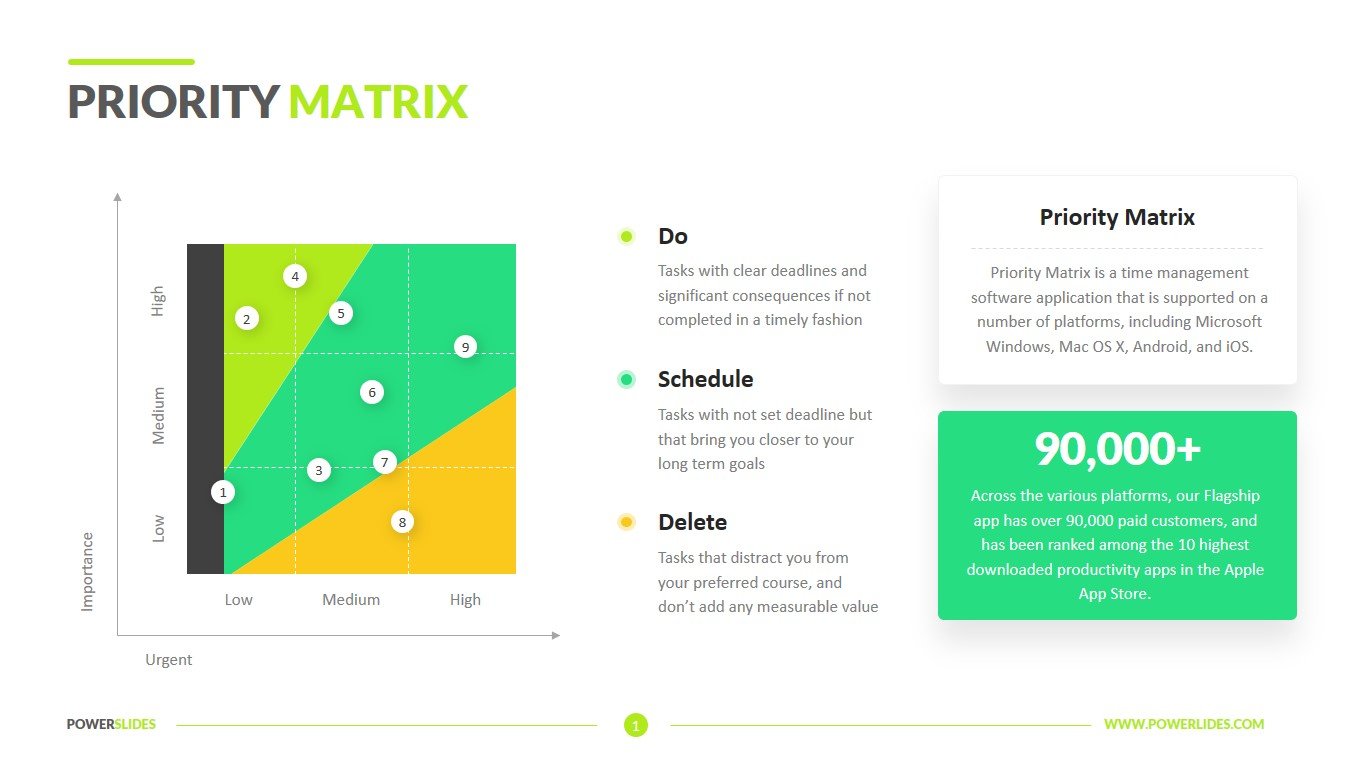
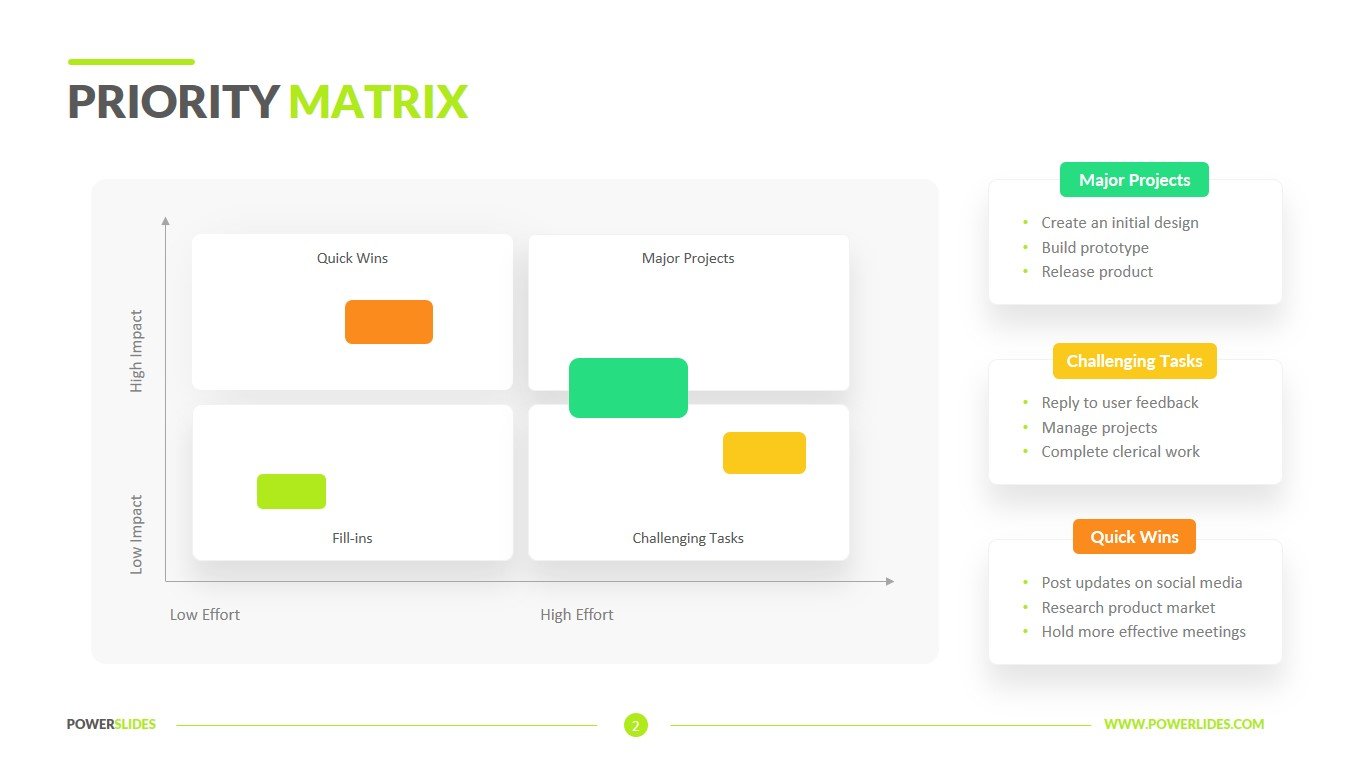
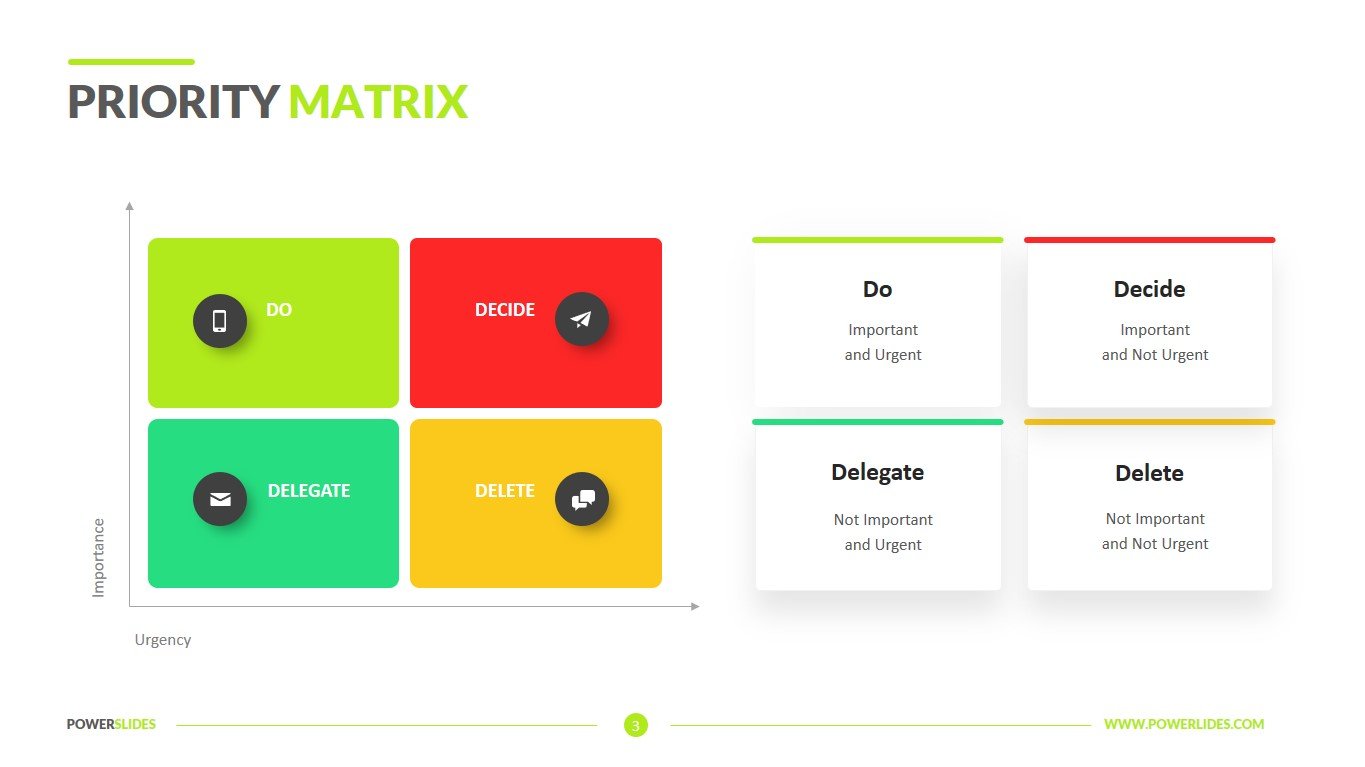
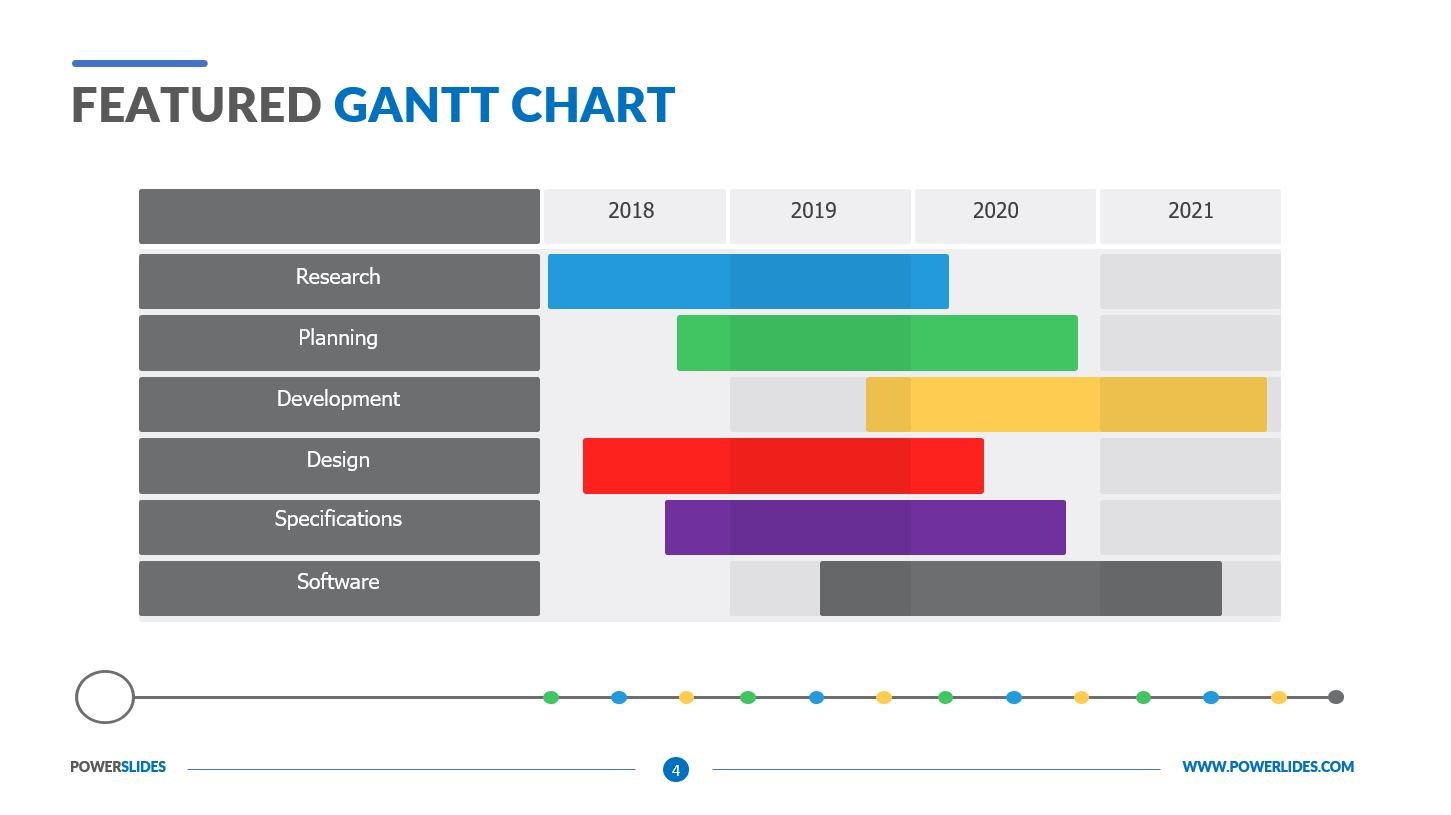
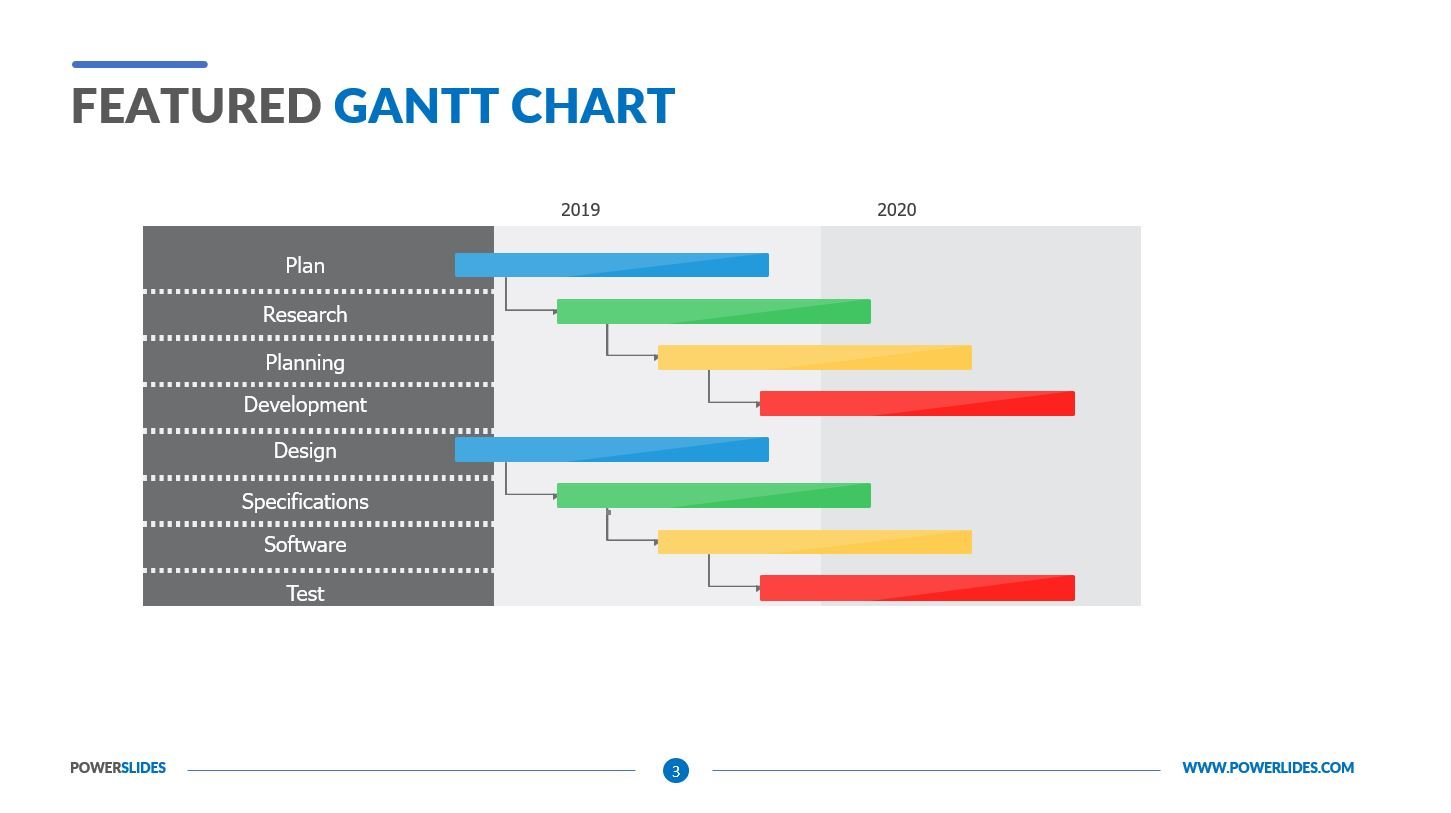
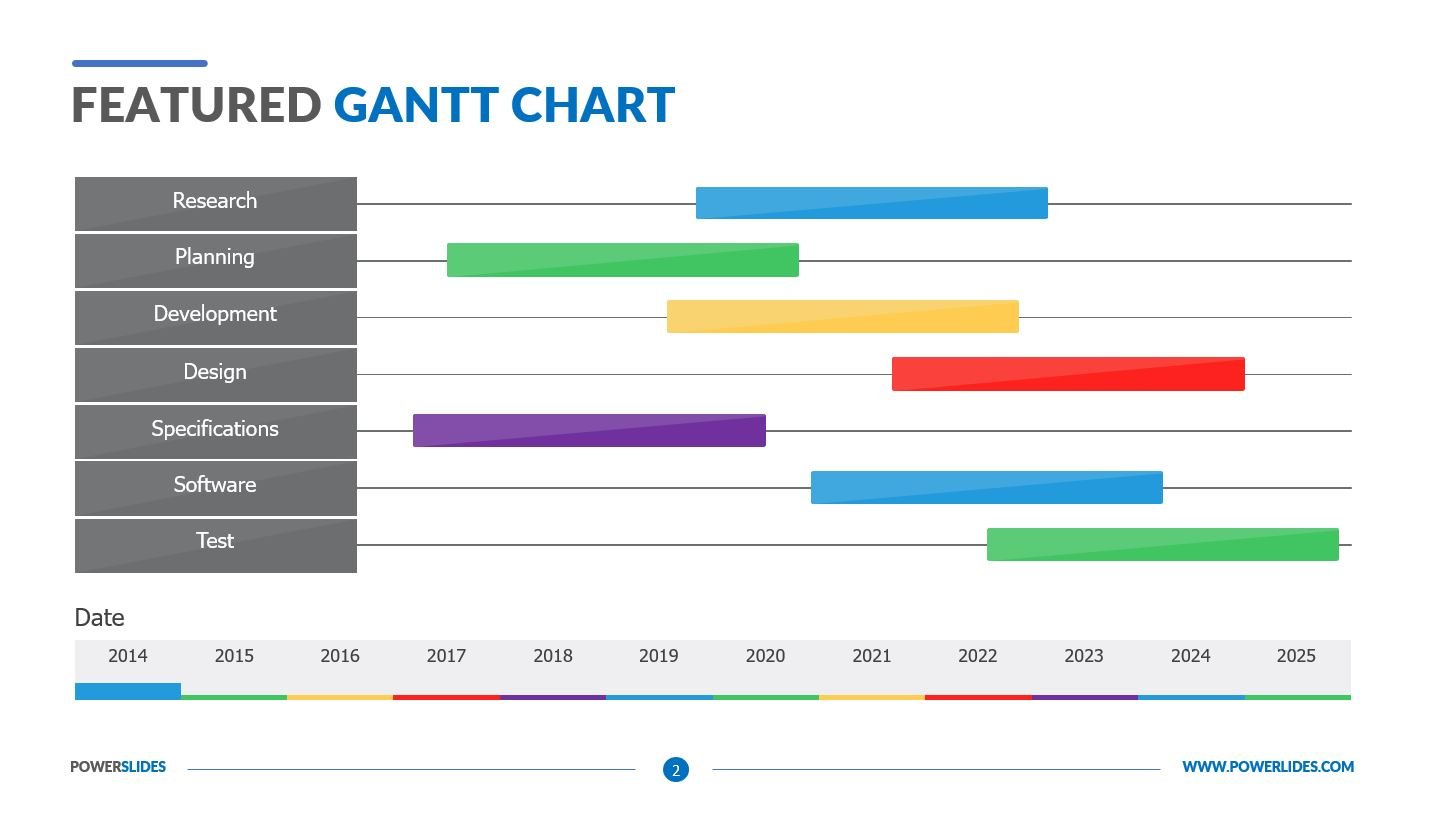
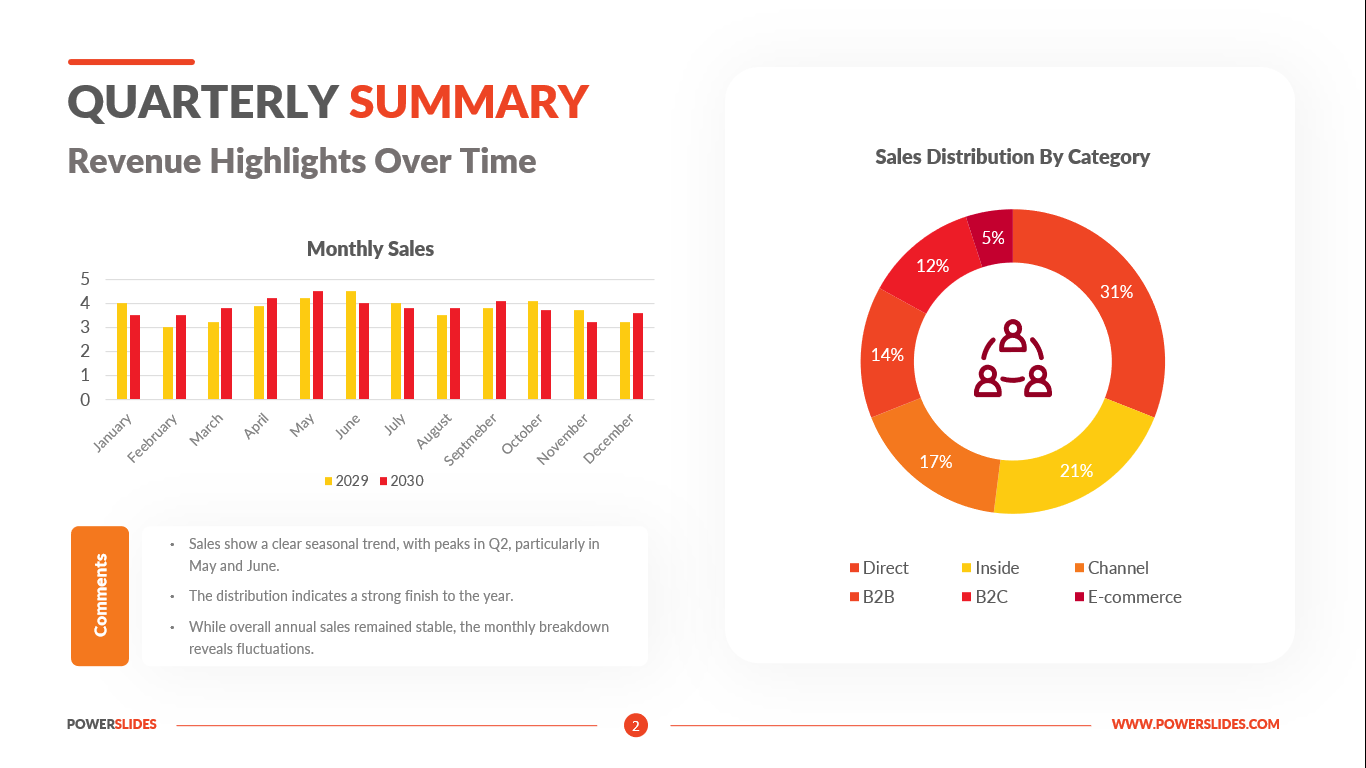
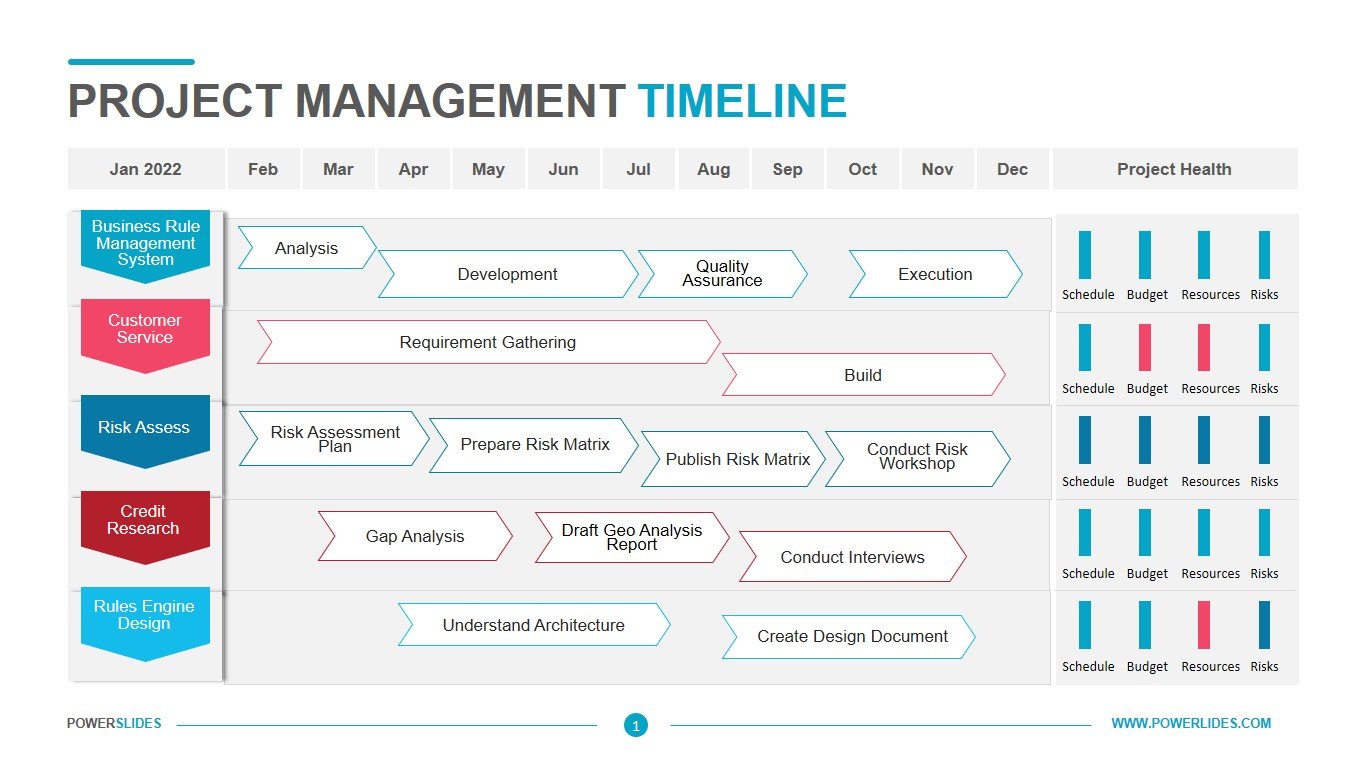
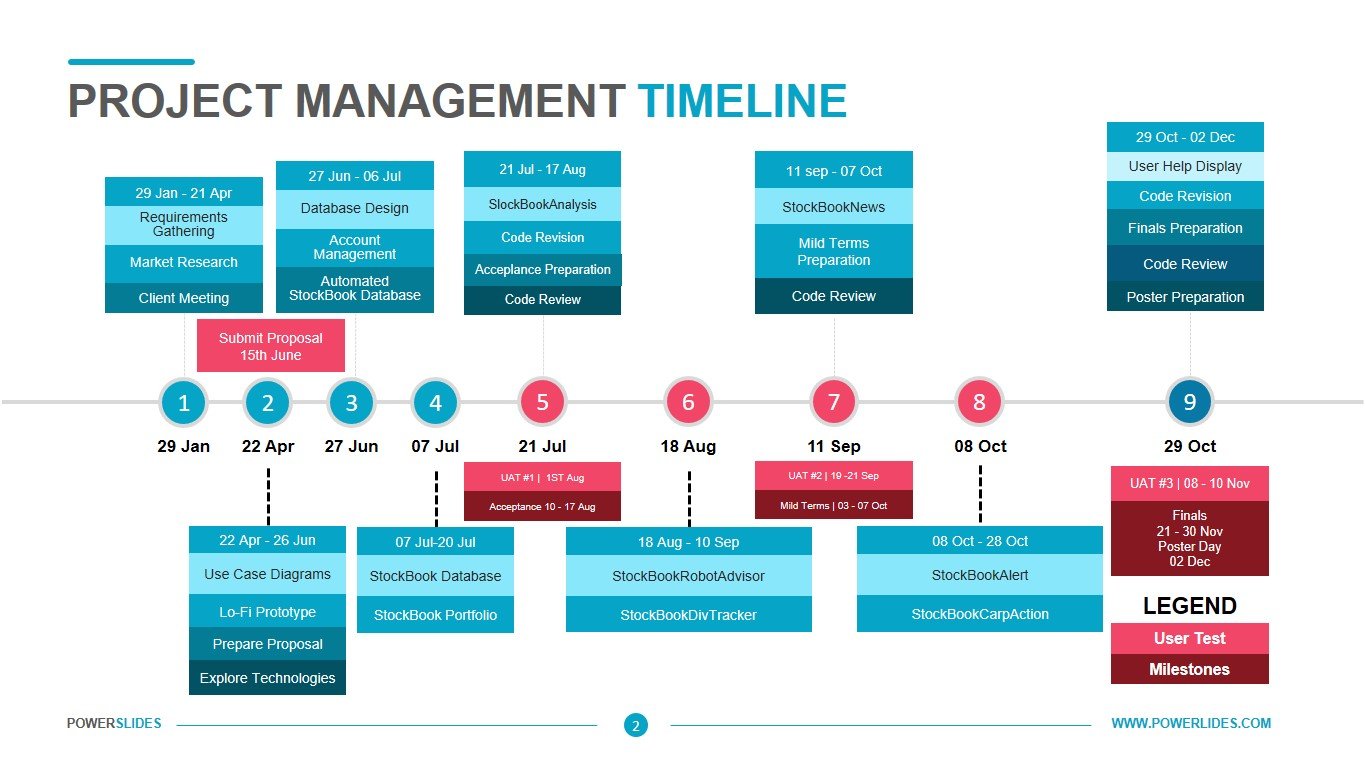
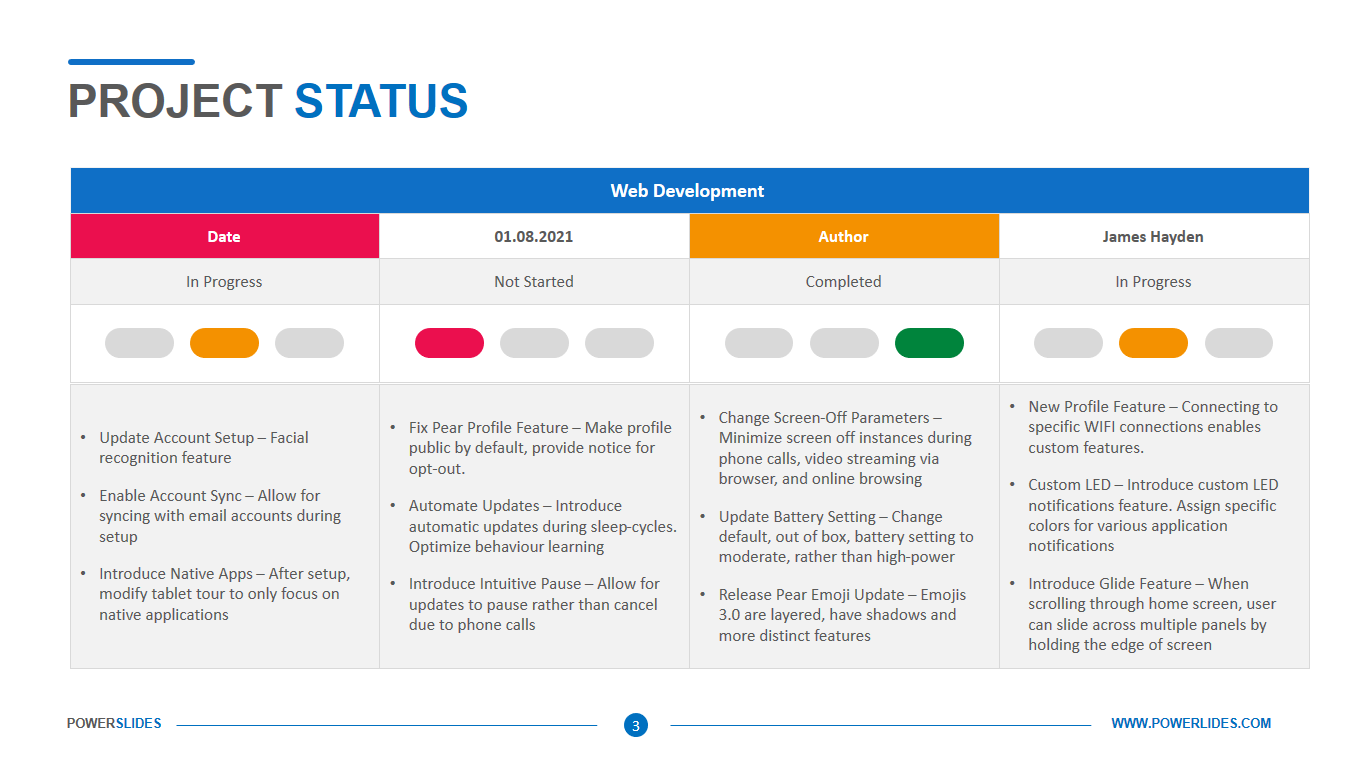
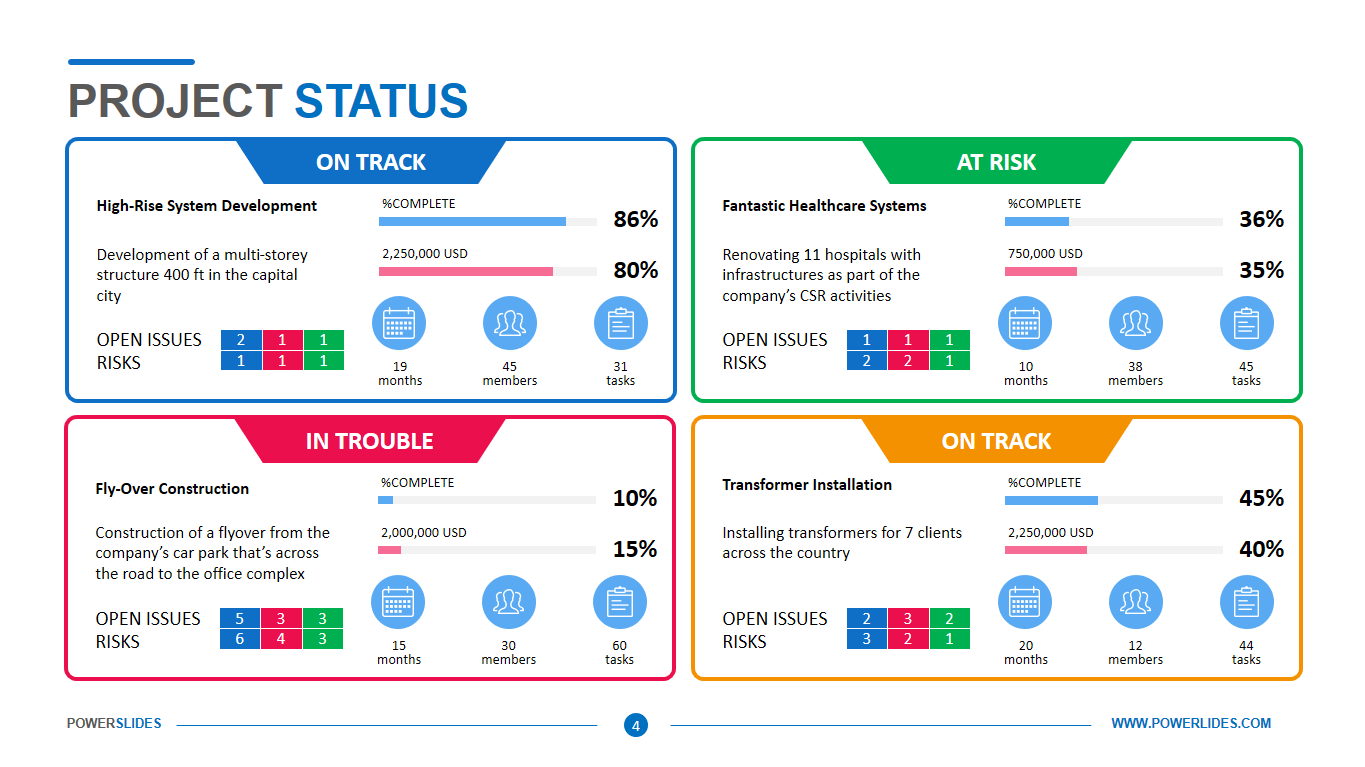
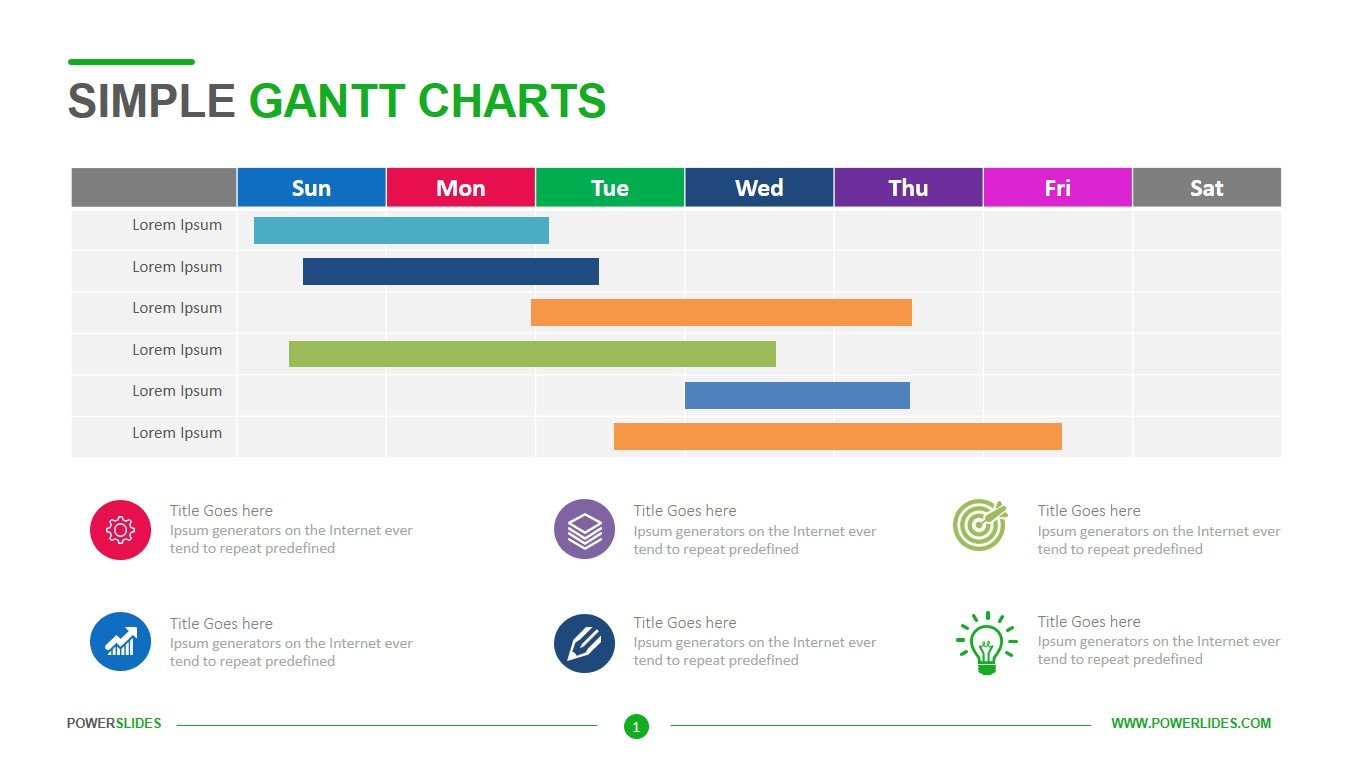
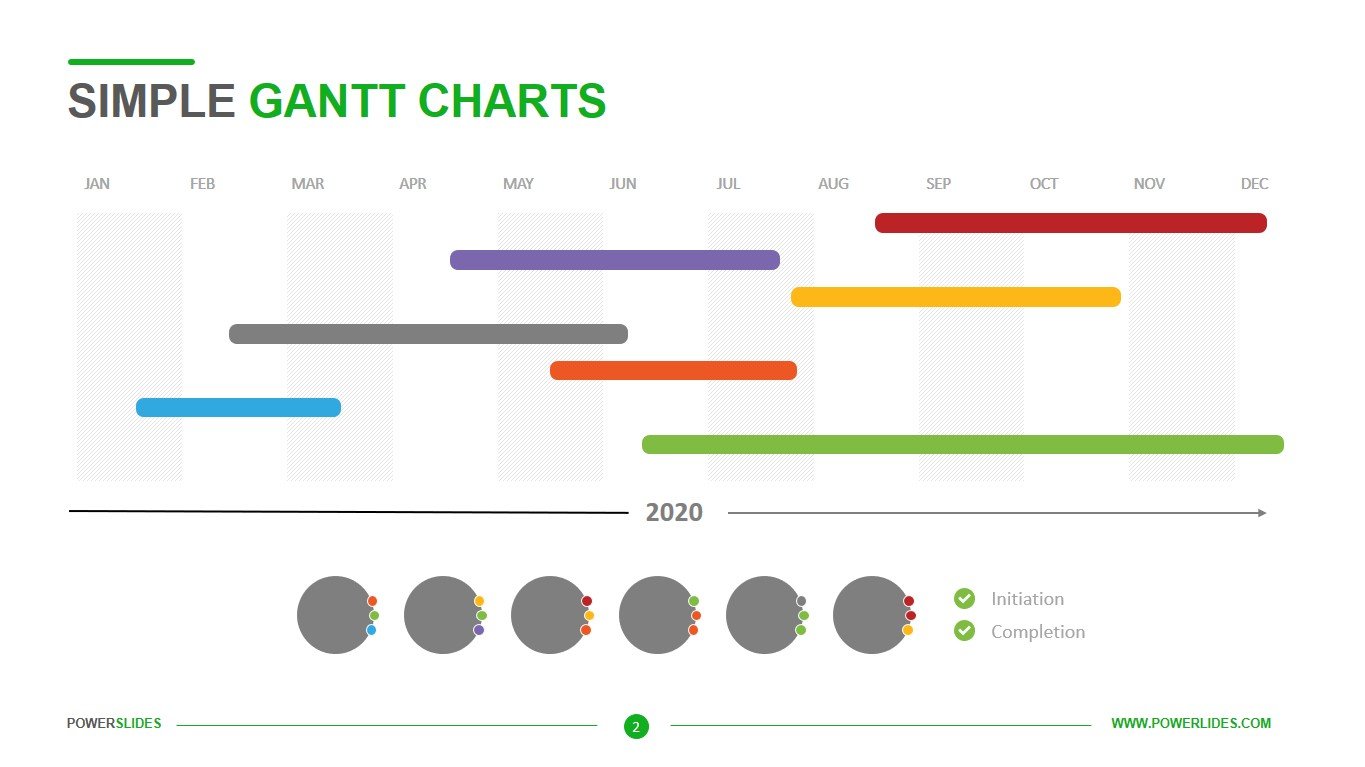
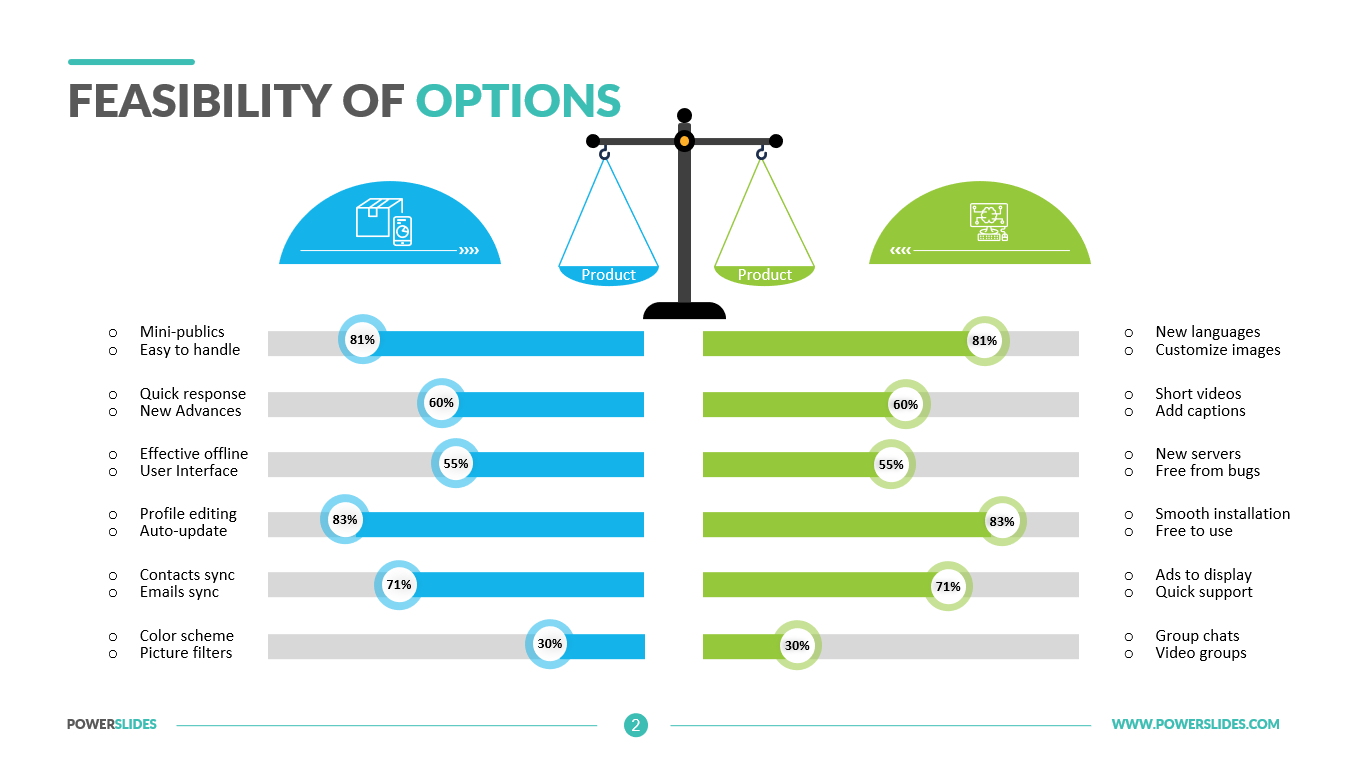
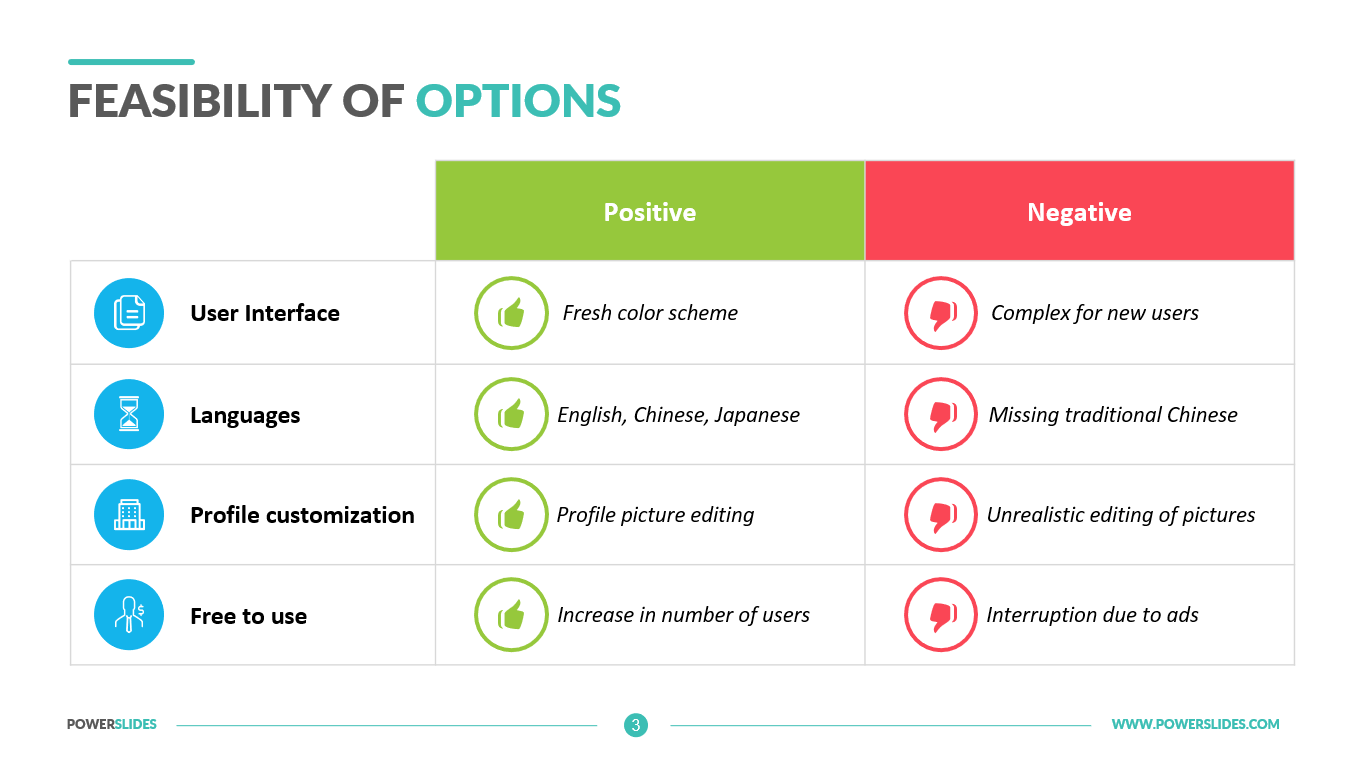
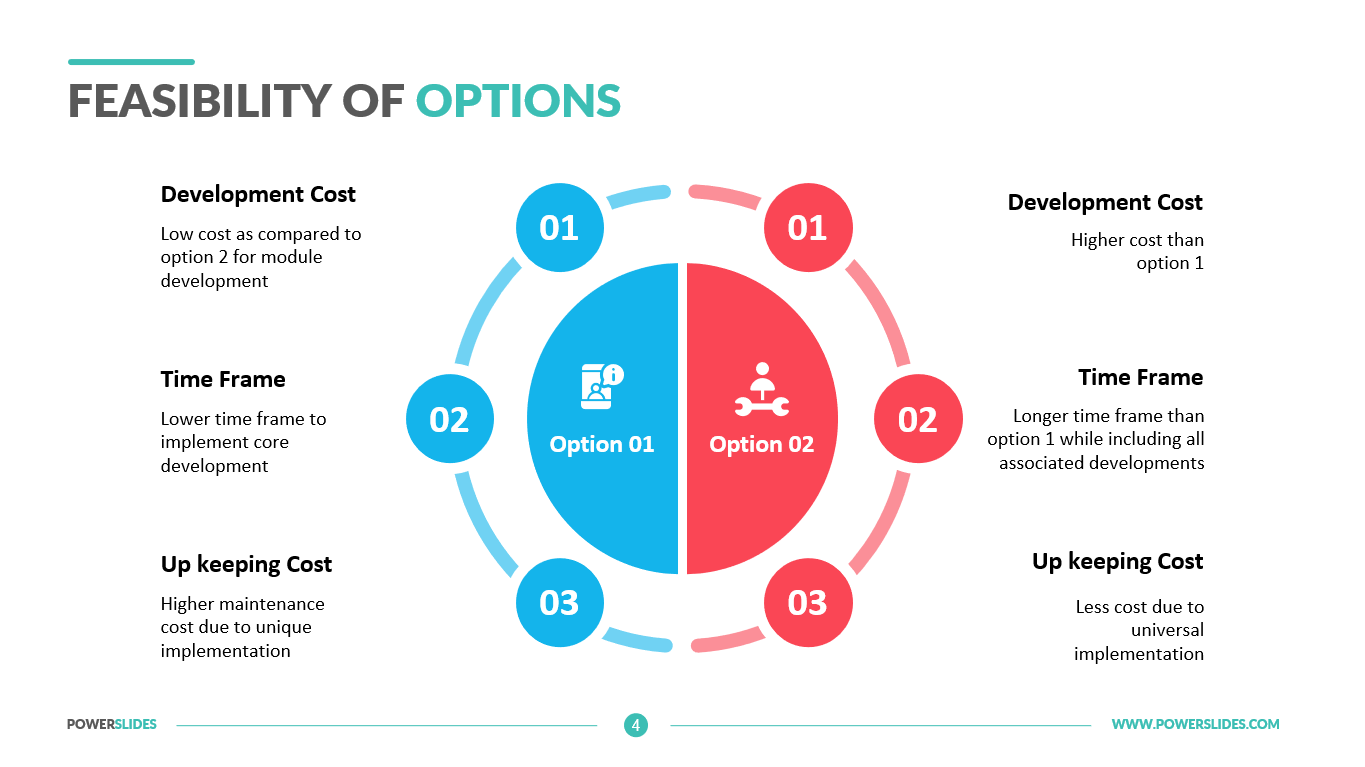
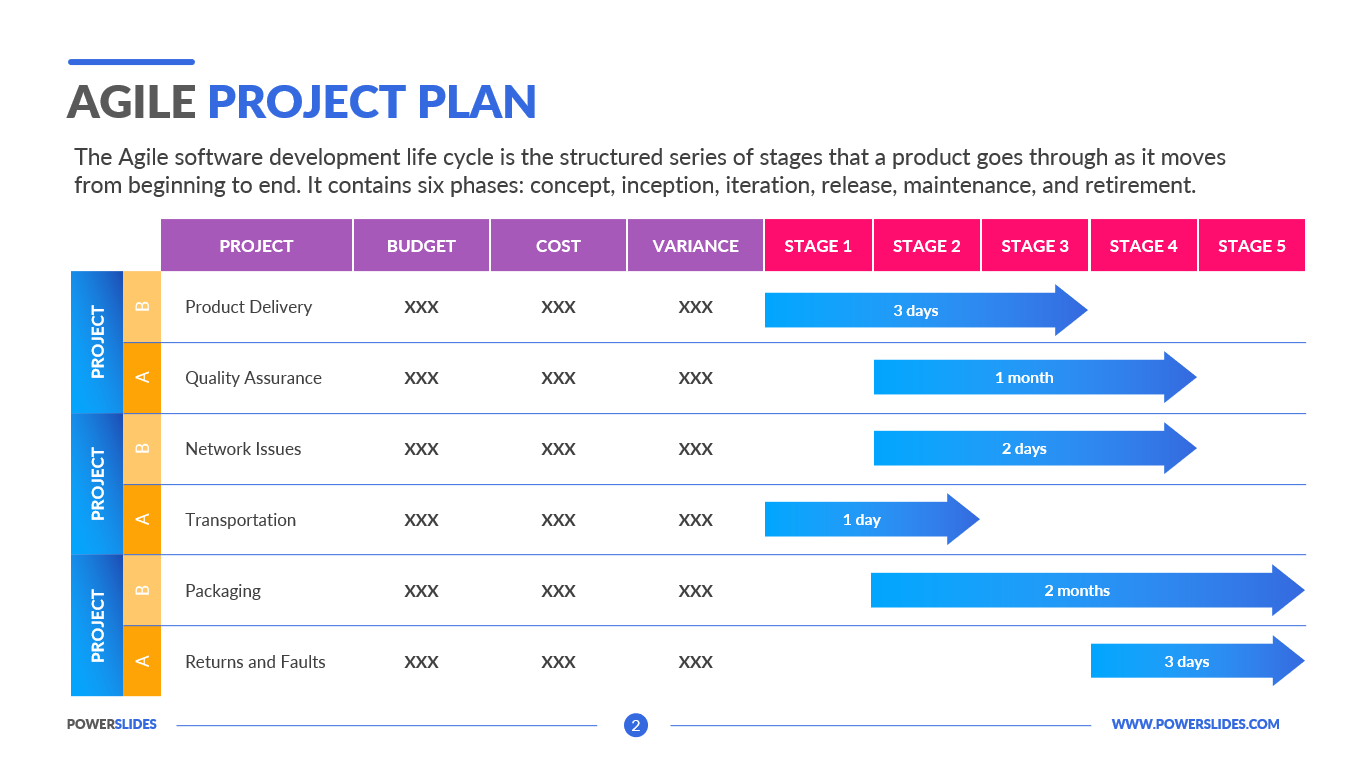
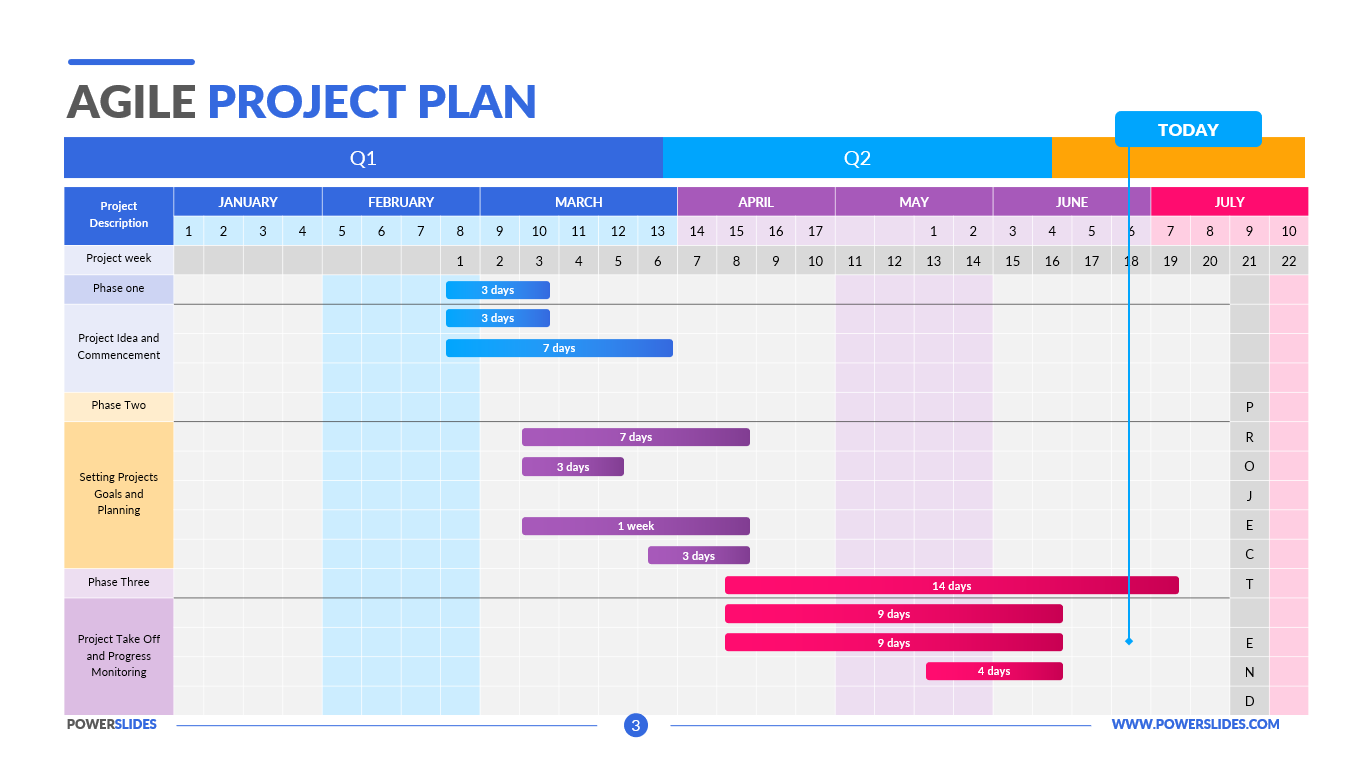
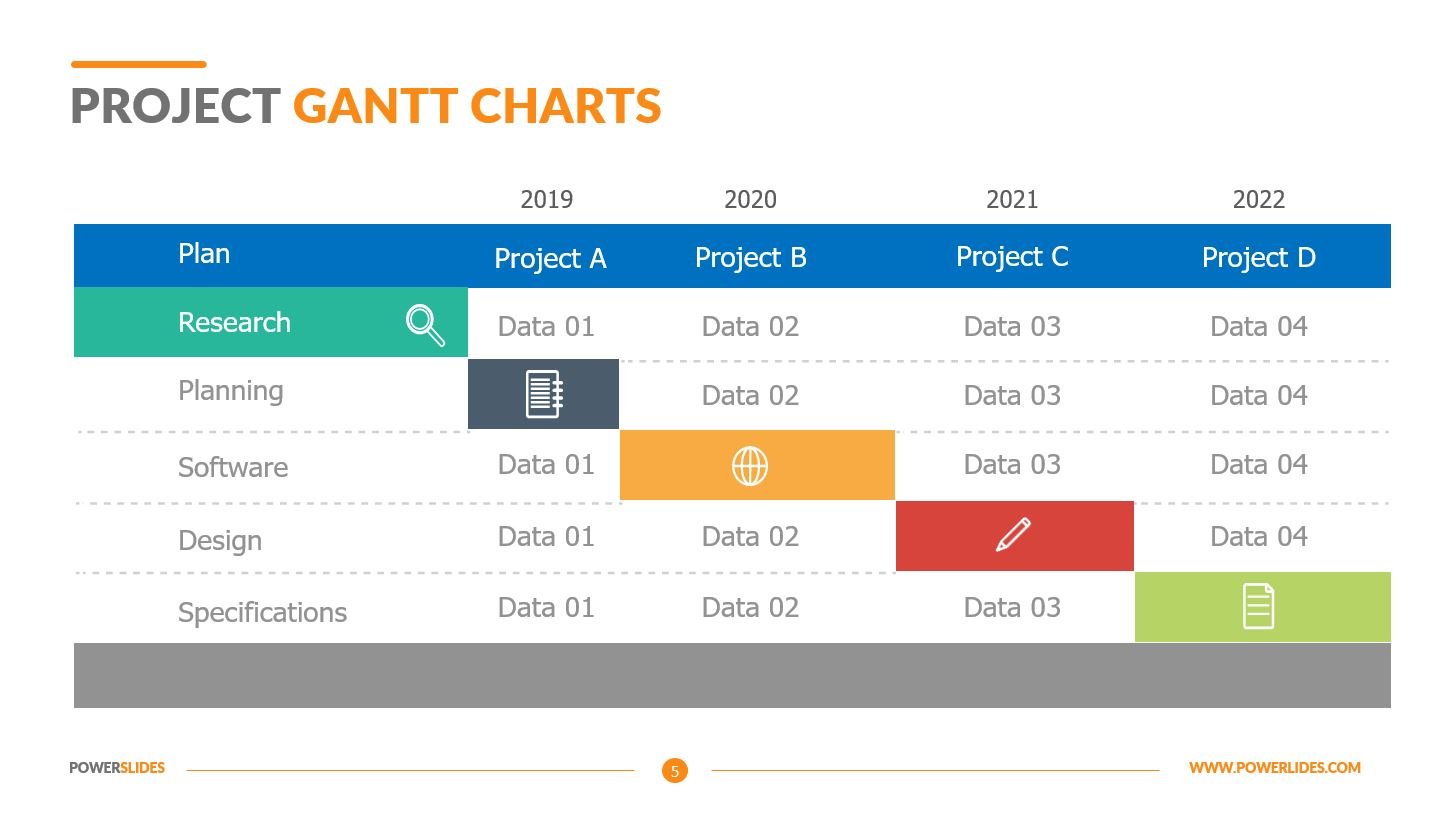
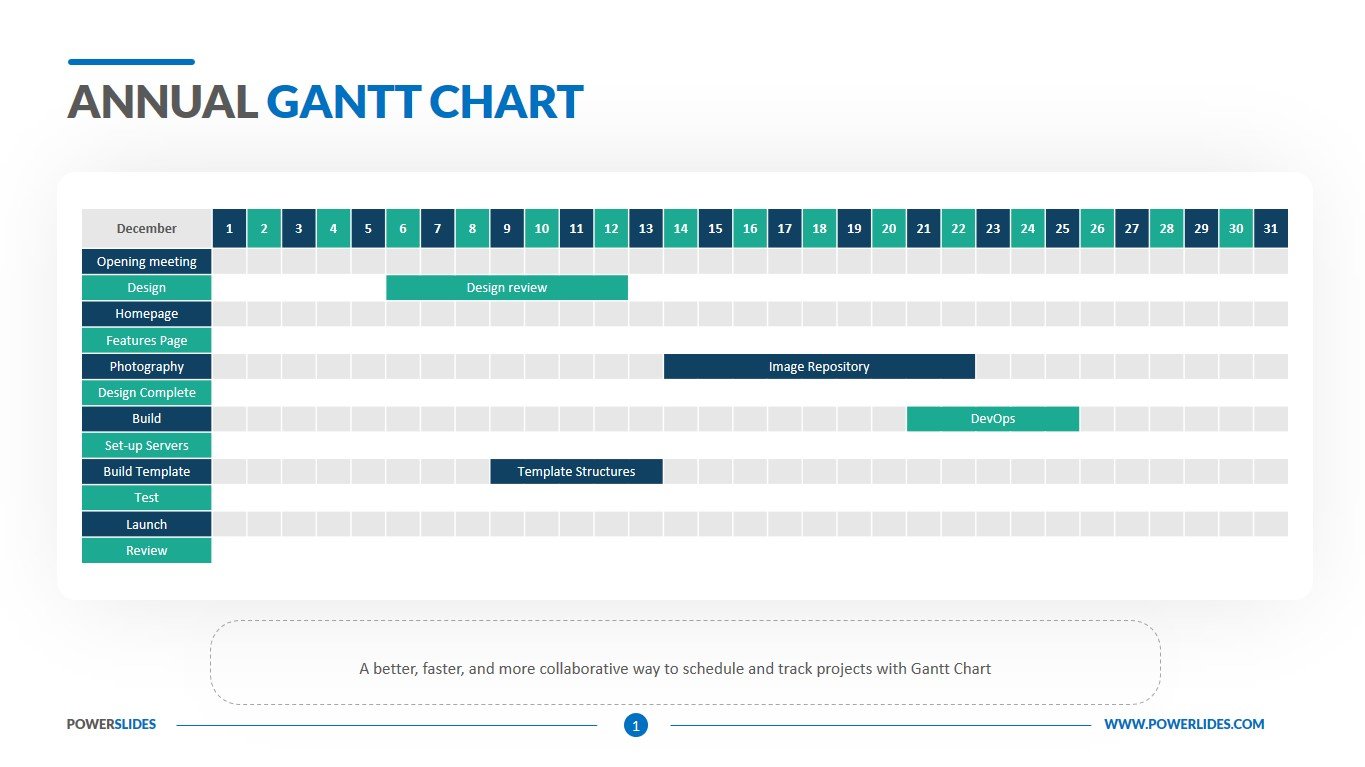
A Gantt chart, commonly used in project management, is one of the most popular and useful ways of showing activities displayed against time. On the left of the chart is a list of the activities and along the top is a suitable time scale. Each activity is represented by a bar, the position and length of the bar reflects the start date, duration and end date of the activity. Today, Gantt charts are most commonly used for tracking project schedules. For this it is useful to be able to show additional information about the various tasks or phases of the project, for example how the tasks relate to each other, how far each task has progressed, what resources are being used for each task and so on. Annual Gantt chart is a great way to report the annual growth and progress a company or an organization makes. The completion of tasks, their duration, success rate and the number of projects received in a year, everything is represented through a single bar. For the very reason, this annual Gantt chart template is of great use to you. Consisting of 4 slides, this template is very sophistically made. This template remains completely editable so to fill the data sets according to your demand.
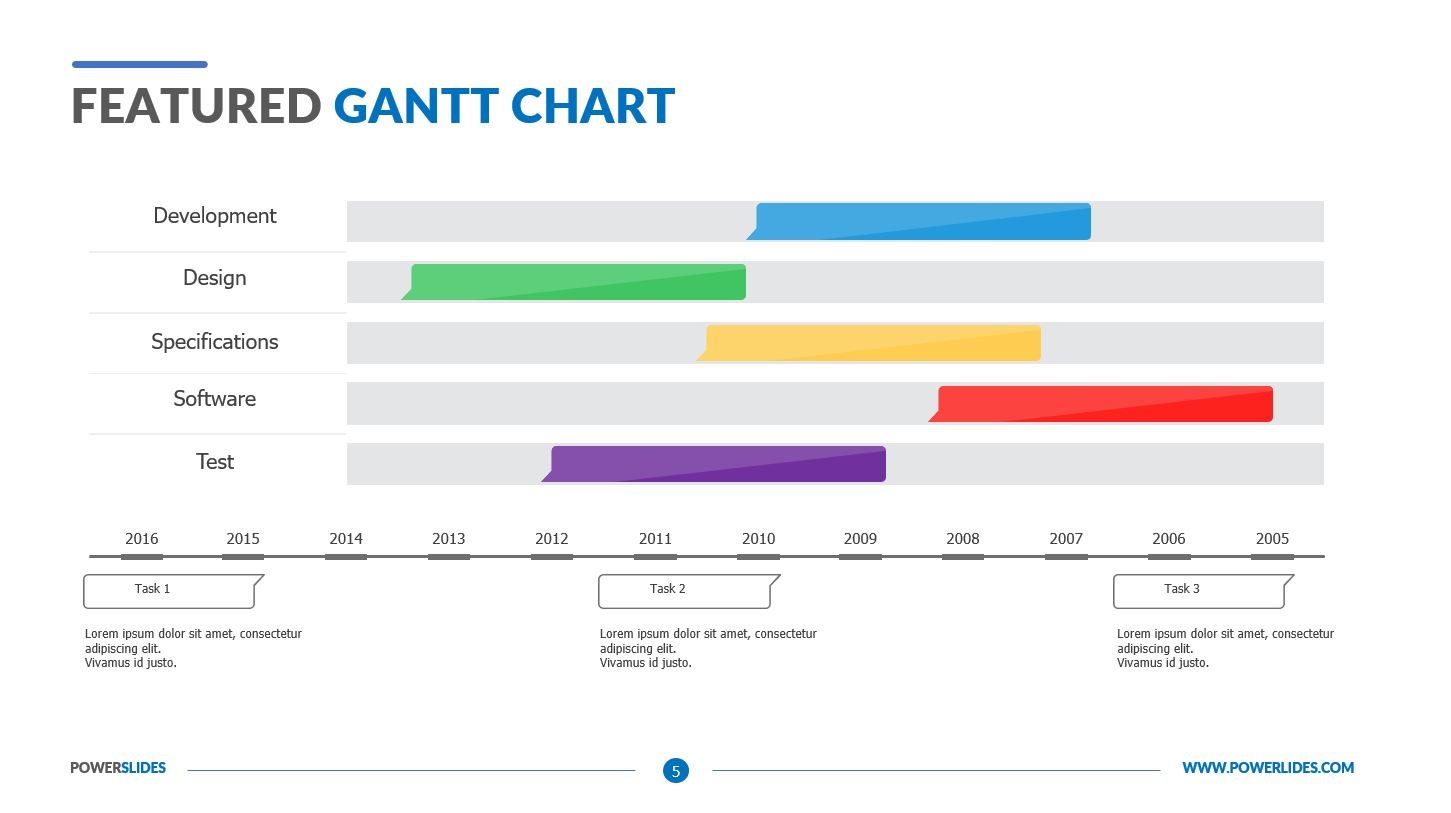
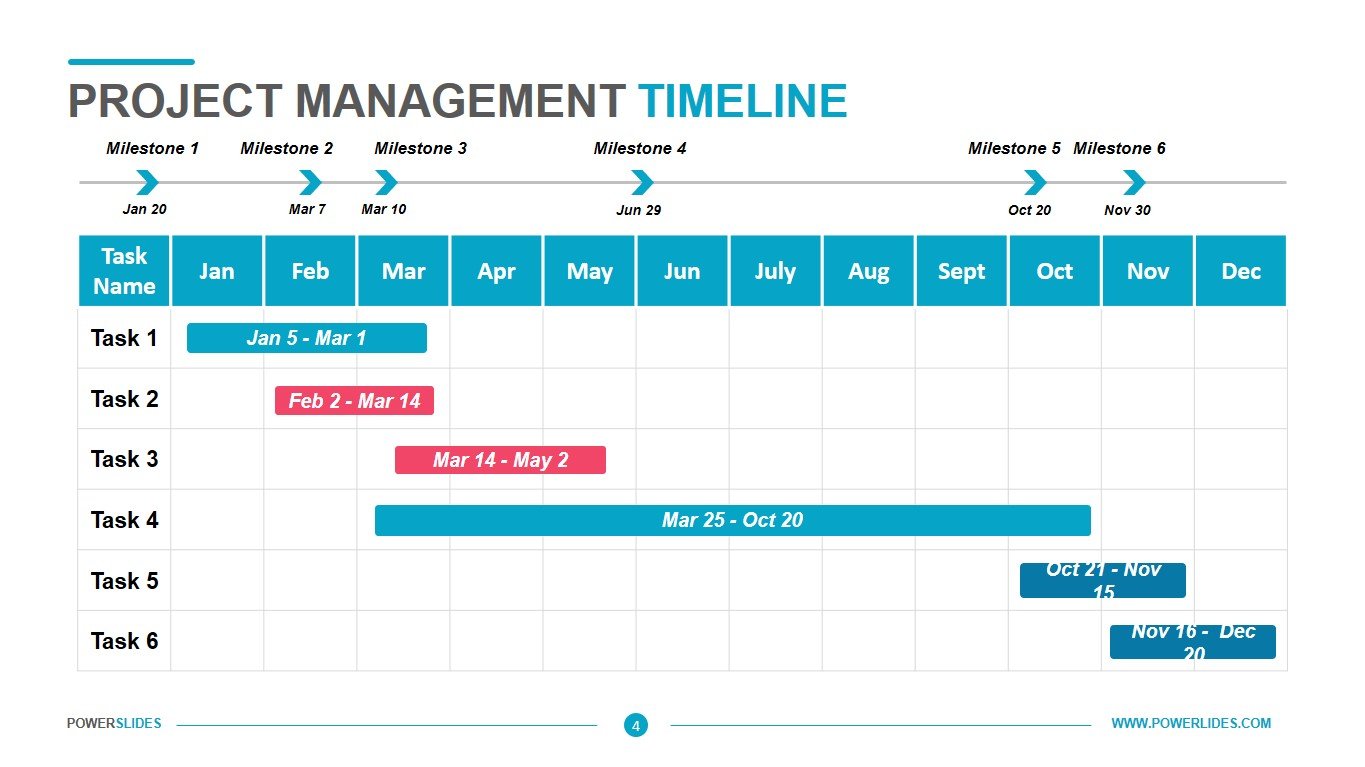
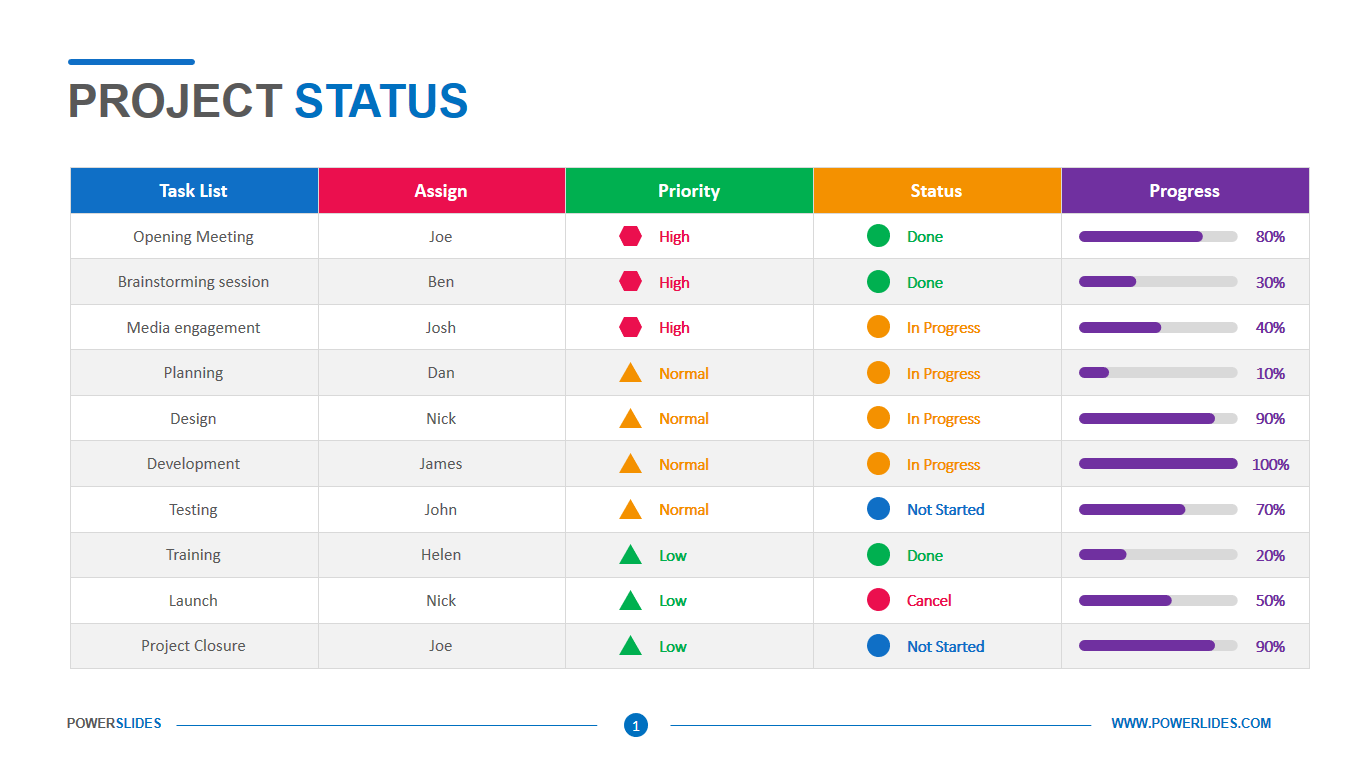
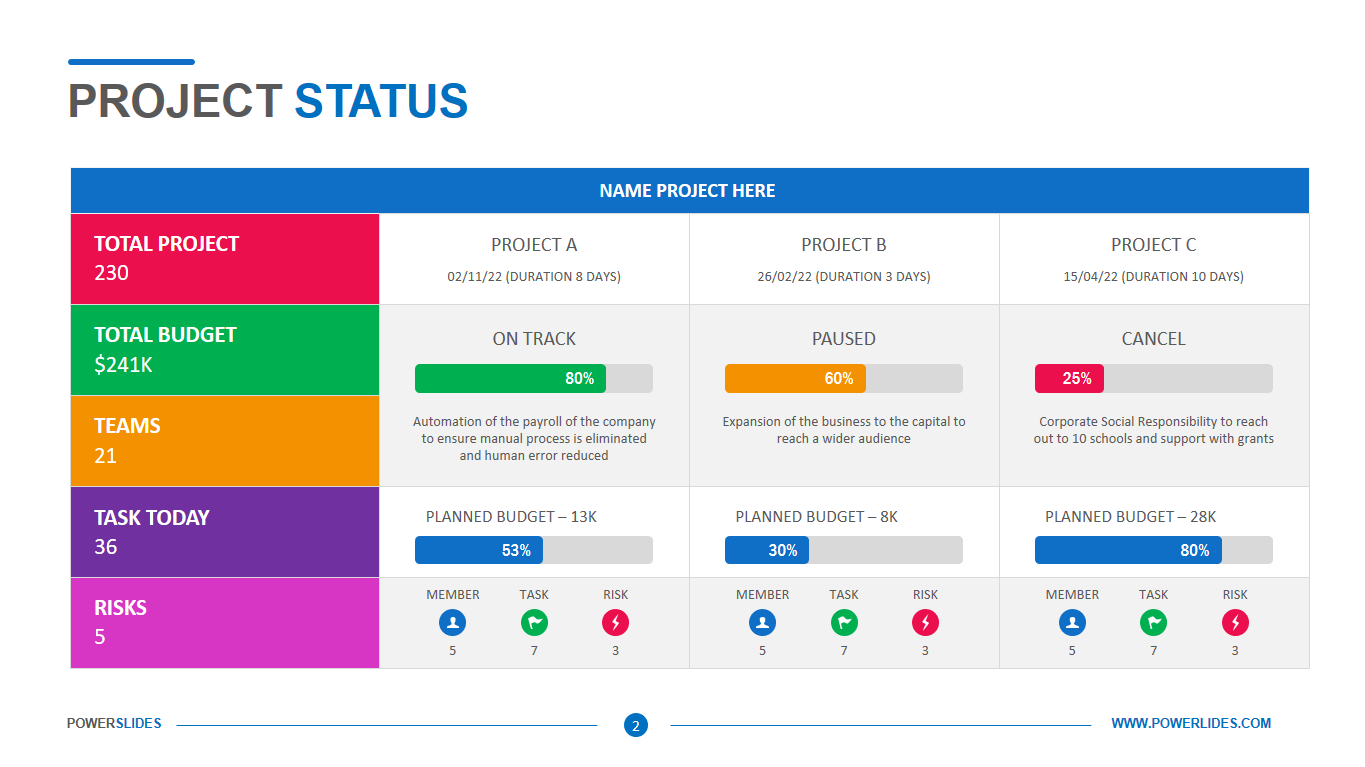
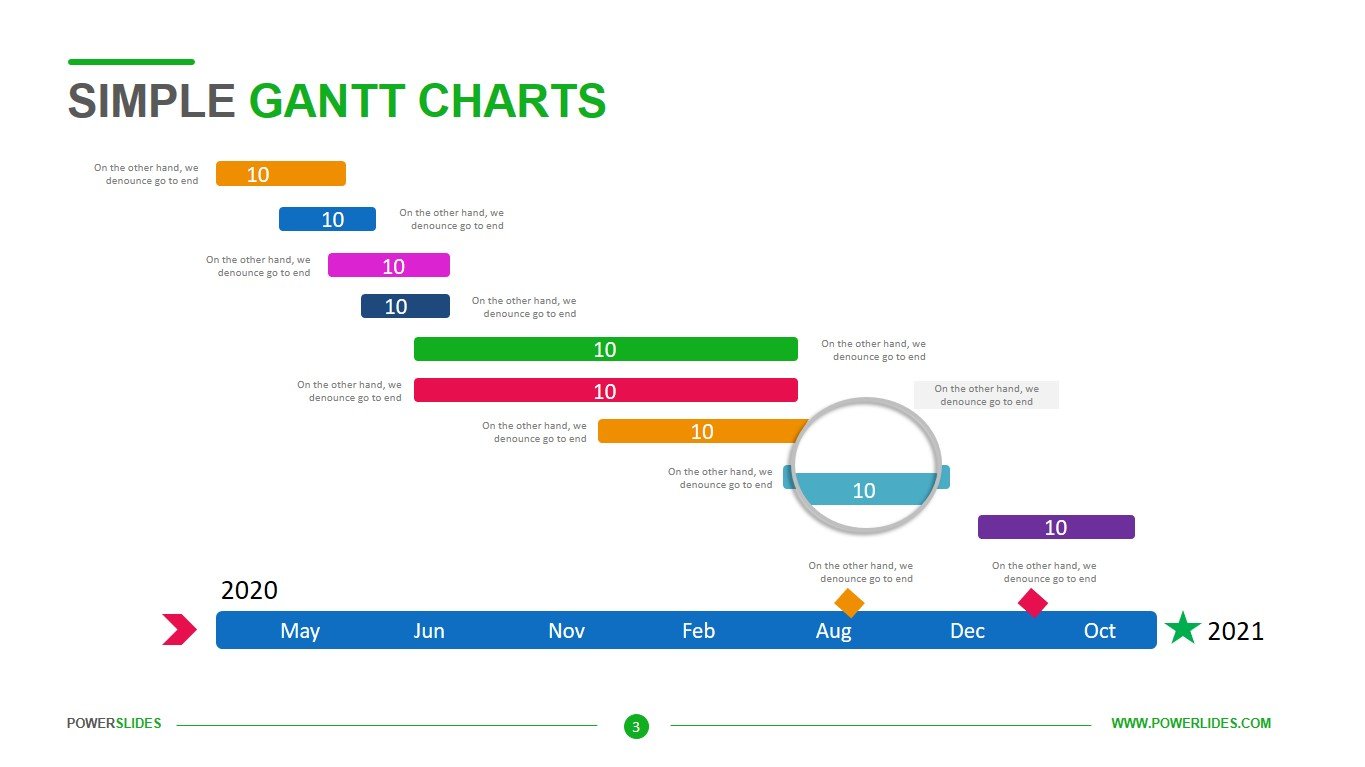
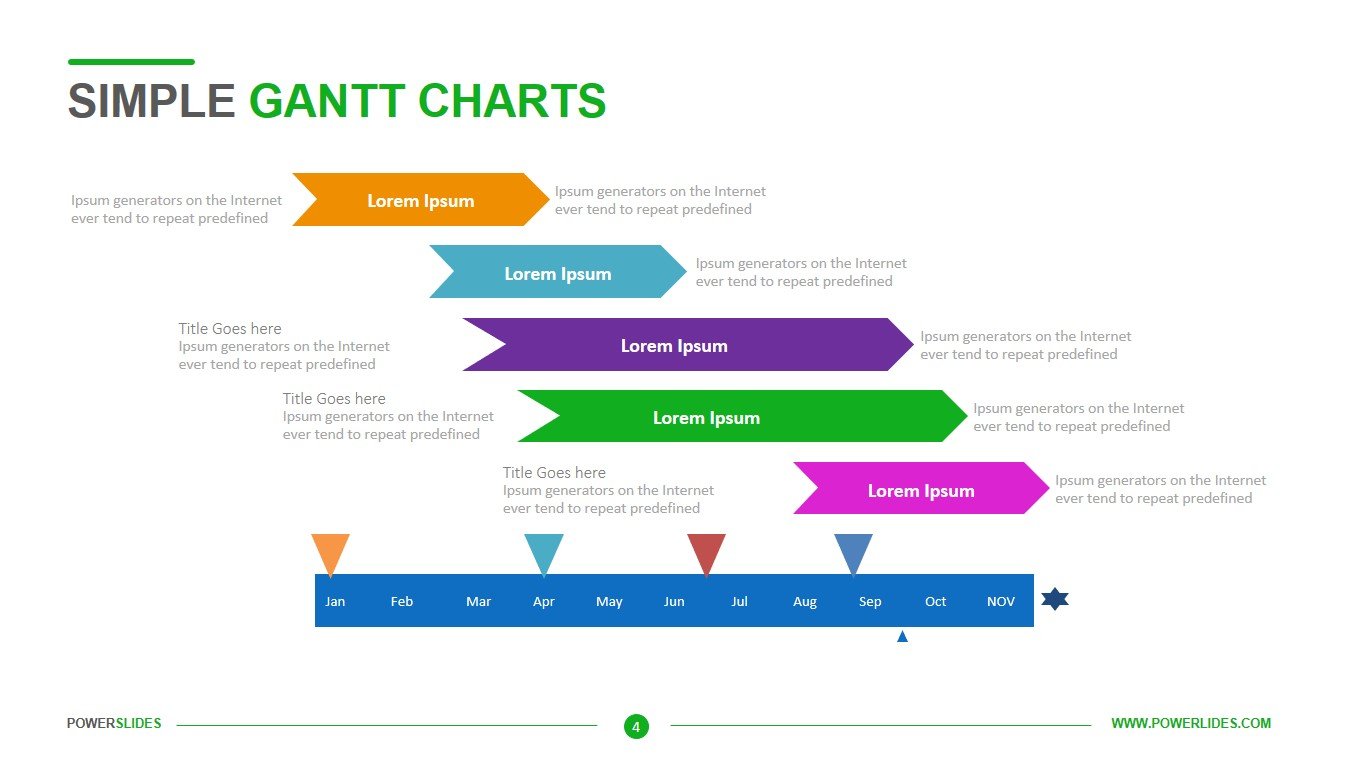
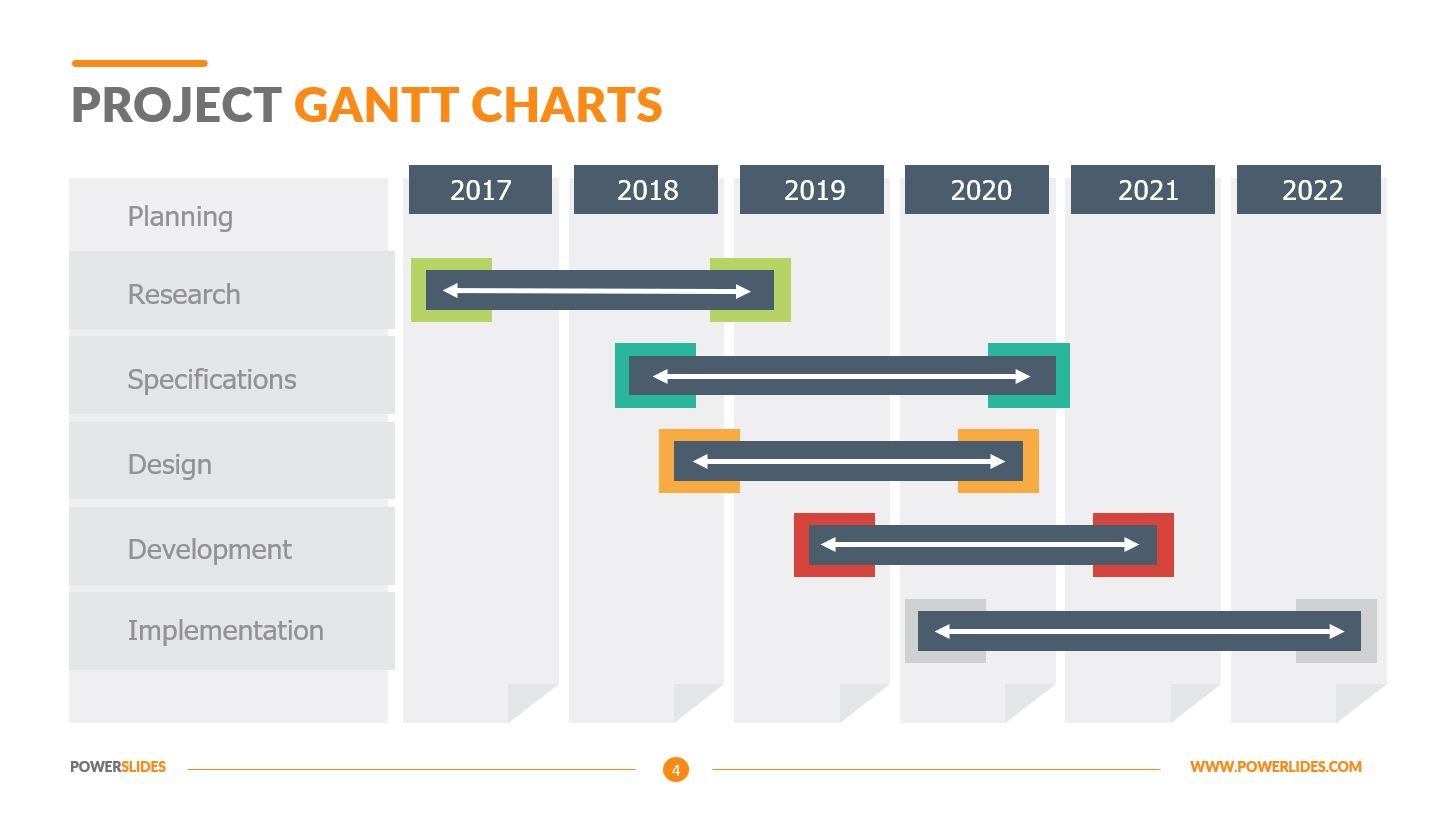
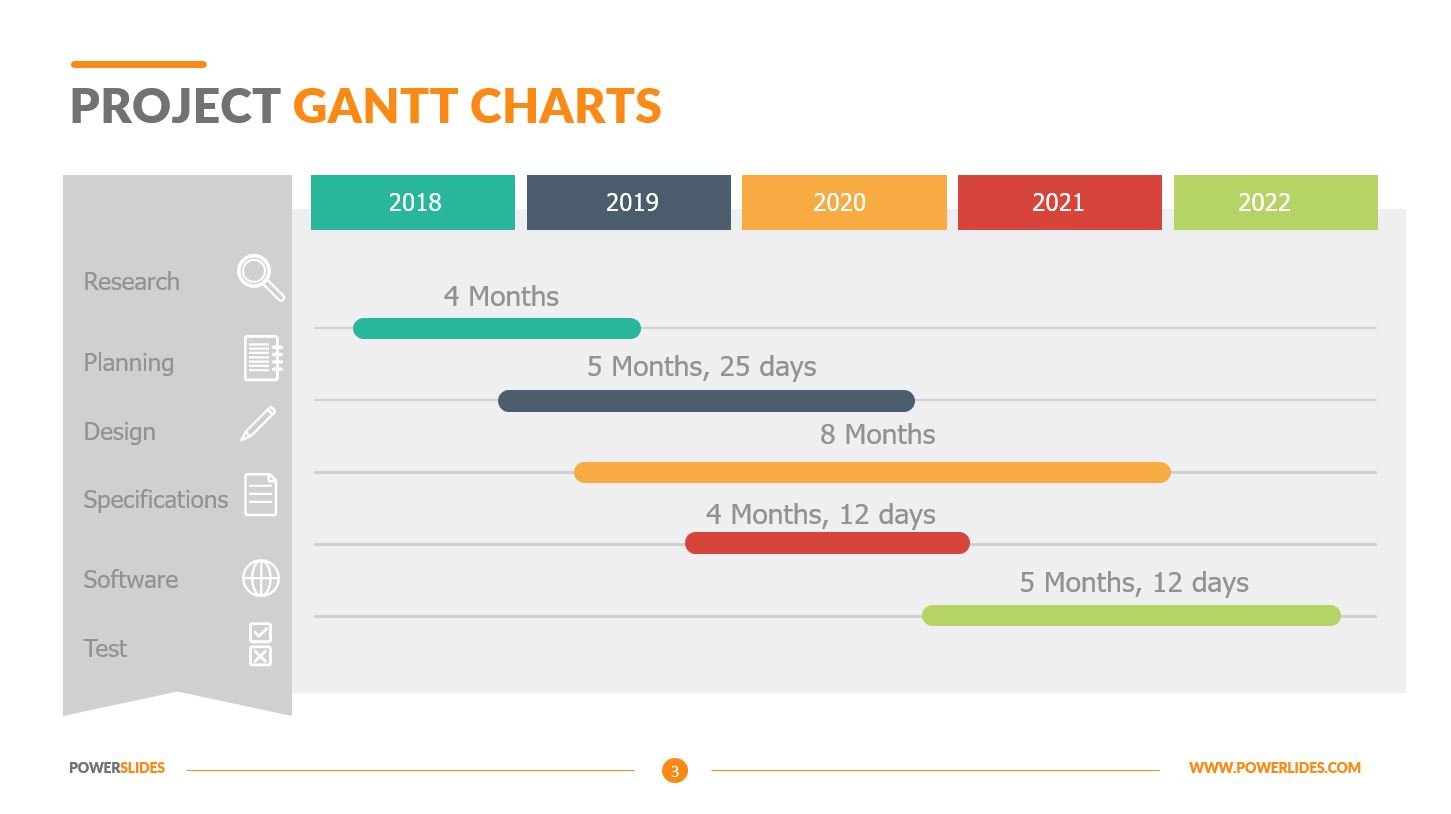
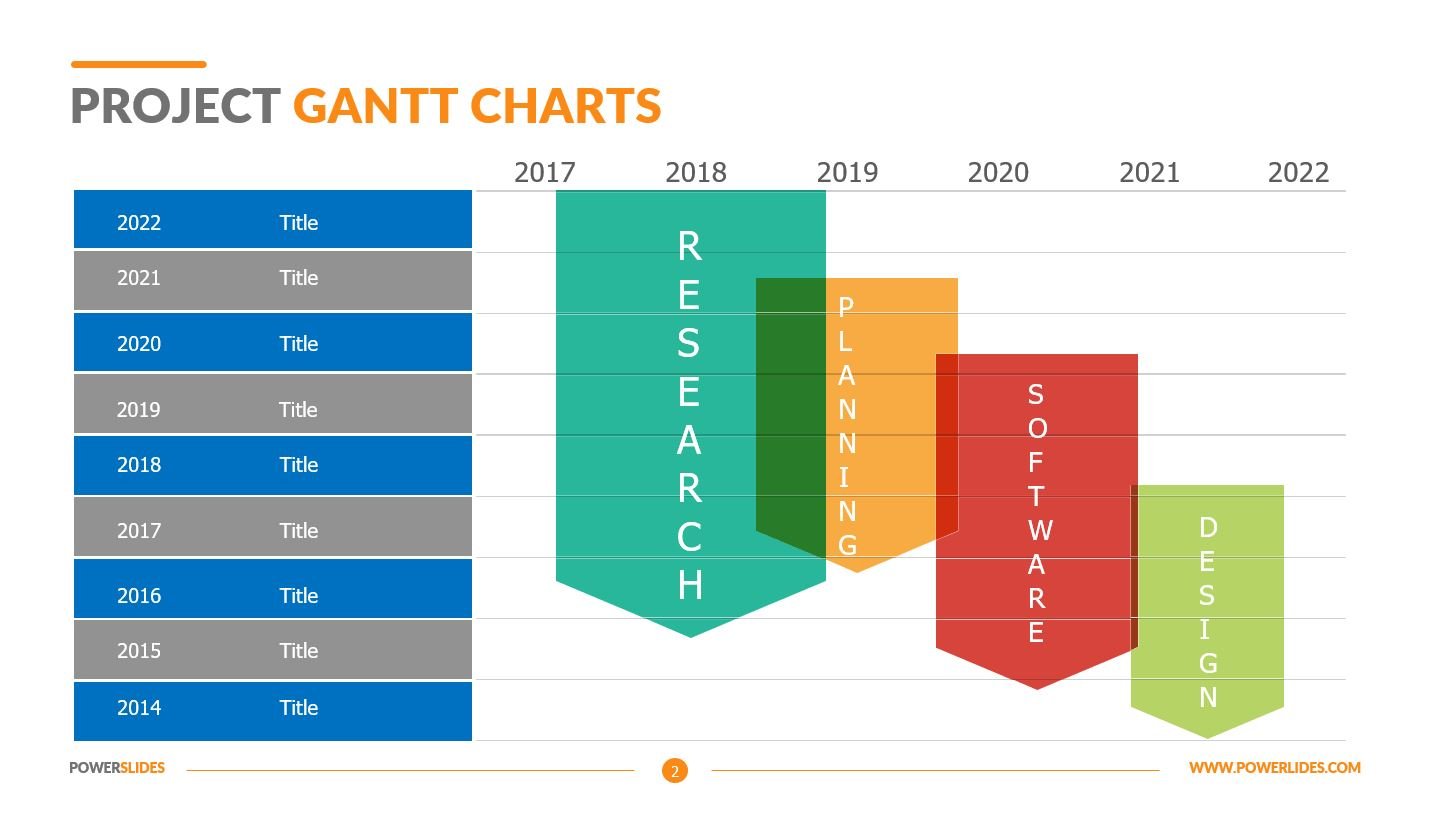
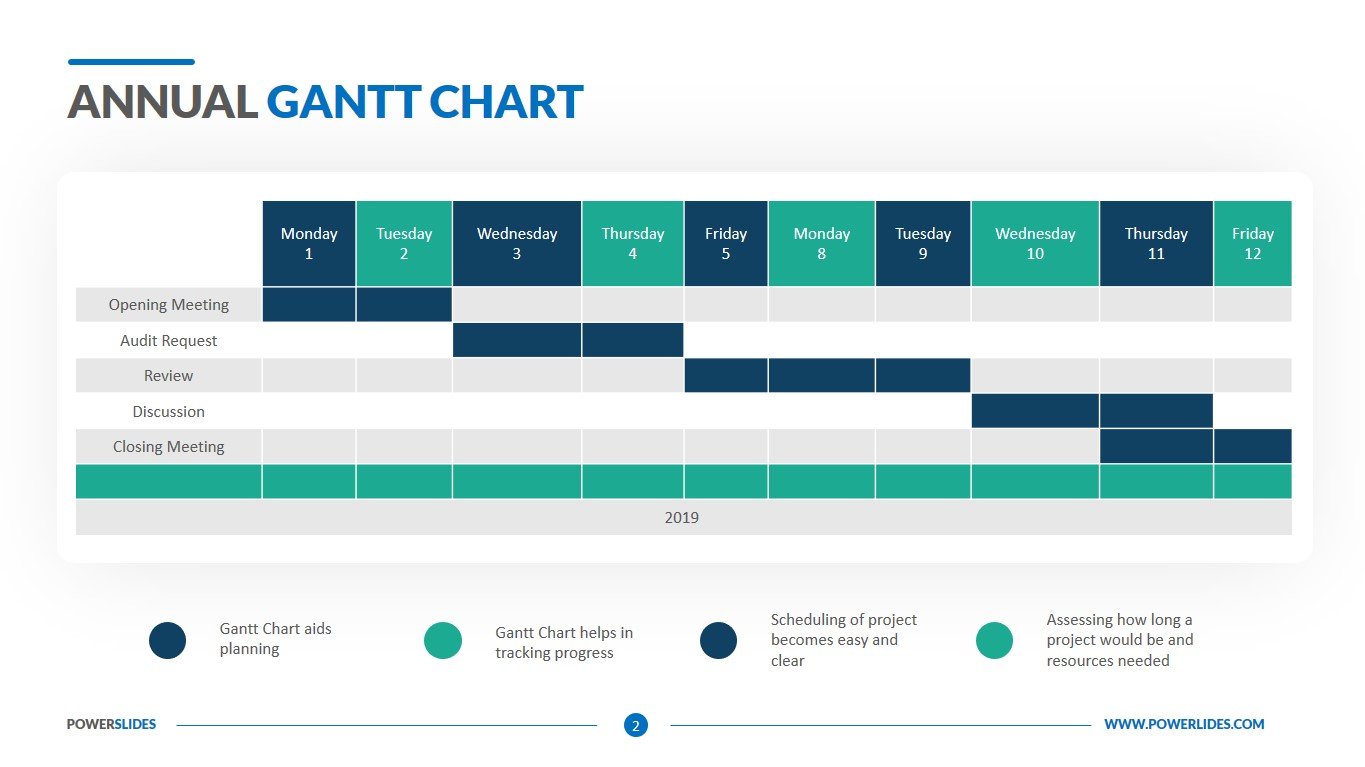
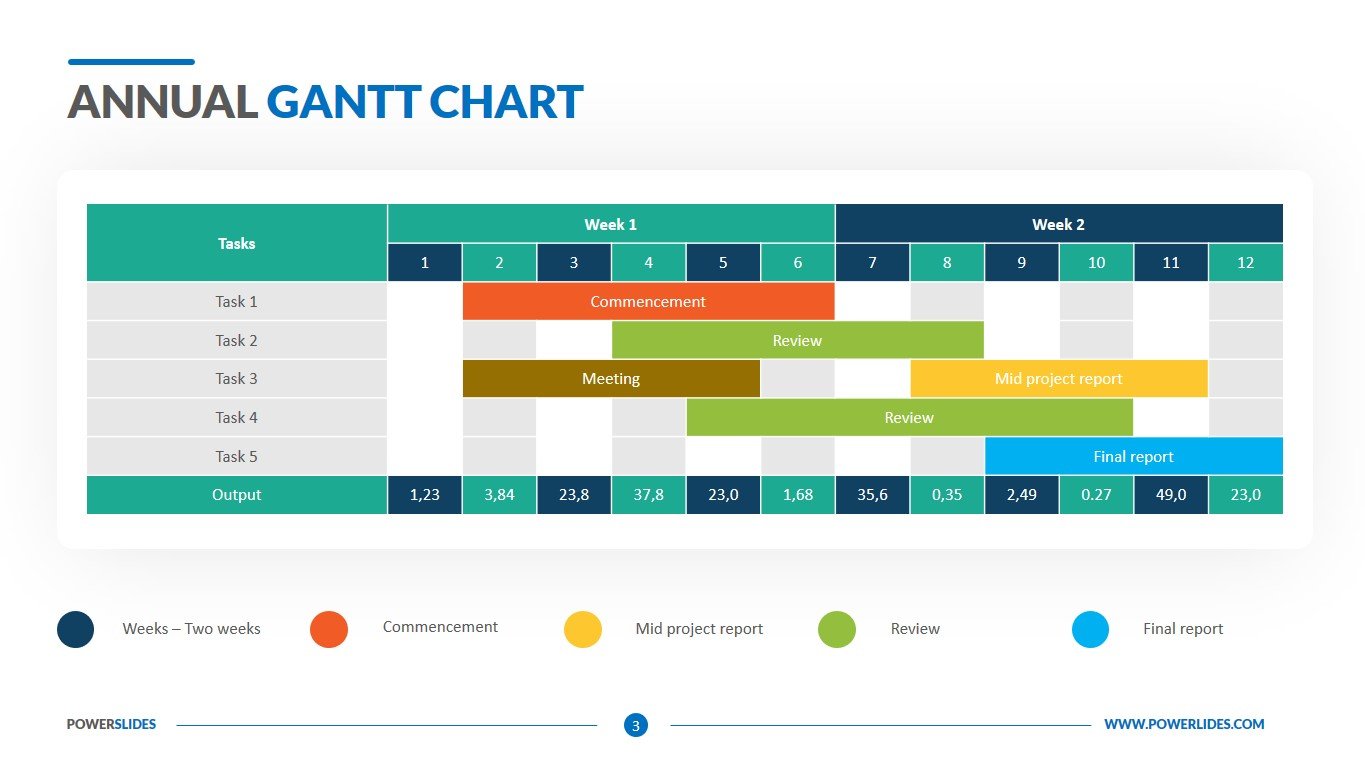
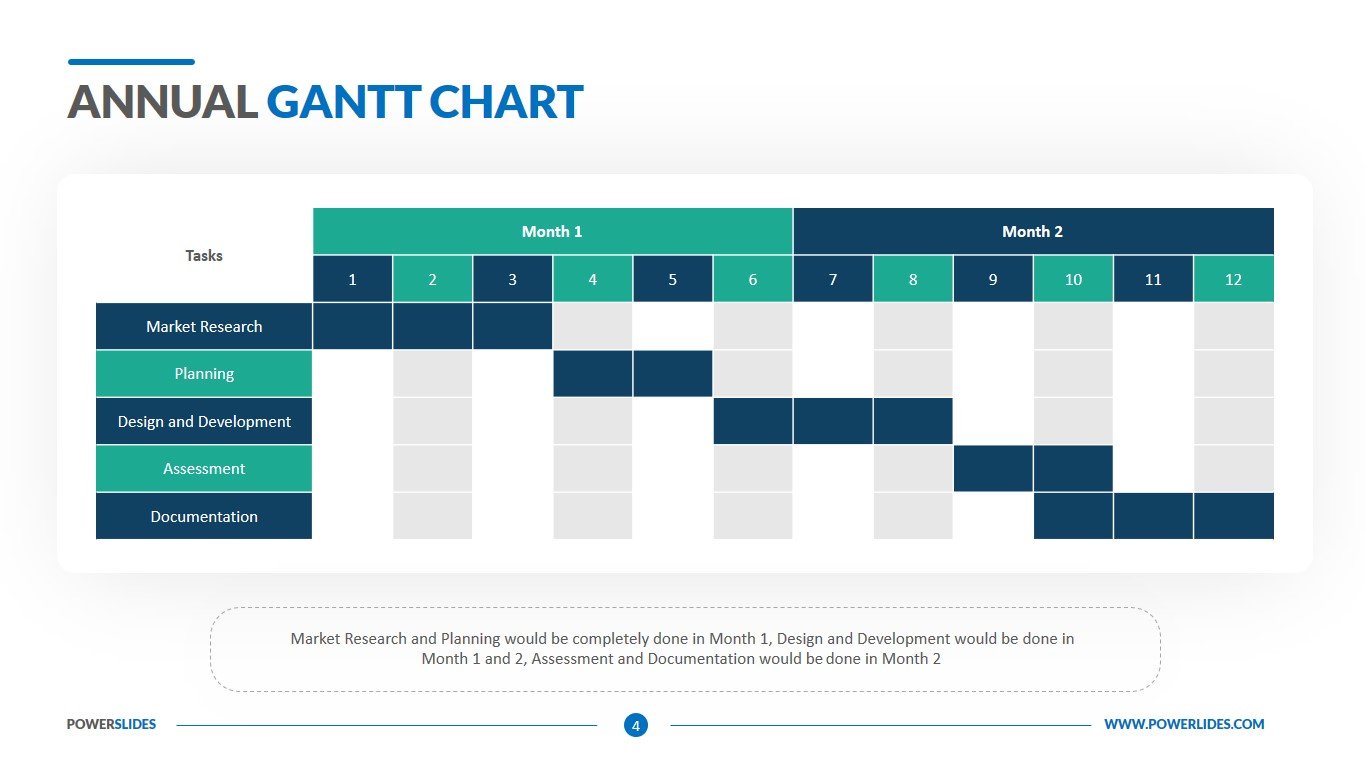
The first slide consists of yearly division on the left and average monthly division on the top. The second slide is completely customizable meaning you can set your desired scales. Either year on the top and months on the left or vice Versa. However, it especially remains for years’ Gantt chart but on a monthly basis with distinctive blue and green colored separations. The third slide is quite similar to the second one but has a 6-month division in between with sky blue, light green and yellowish base for projects’ representations and dialogue boxes. The fourth slide remains simple and straightforward in its design with only blue and green colors and 6-month division. The Annual Gantt Chart template is made in a cool color scheme and has all the necessary tools to build a professional presentation. If necessary, you can independently change the size, color and position of infographics and blocks.
This template will primarily be useful for project managers who can use the slides of this template in their daily work. For example, you can prepare a weekly report on all projects that you are managing using the slides in this template. Also, this template will be useful for construction companies and architectural firms. For example, you can use the slides in this template when preparing a work plan and approving a project timeline with a client. Also, you can control the project execution using the tools of this template. The slides of this template will also be useful for business trainers and university teachers when preparing a course on project management or planning work in production. Plant managers and engineers can also use this template in their work when preparing a work plan for the launch of a new conveyor or planned equipment repairs. Logistics and supply chain managers can use the template to schedule the delivery of products by different modes of transport. The Annual Gantt Chart Template will be a great addition to your professional presentations and will take its rightful place in your collection of professional templates.


