Economic Value Added
What do you think of this template?


 (3.50/ 5)
7 ratings

 4 Slides
 File size: 16:9
 Fonts: Lato Black, Calibri
 Supported version
PPT 2010, PPT 2013, PPT 2016
Supported version
PPT 2010, PPT 2013, PPT 2016

Product details
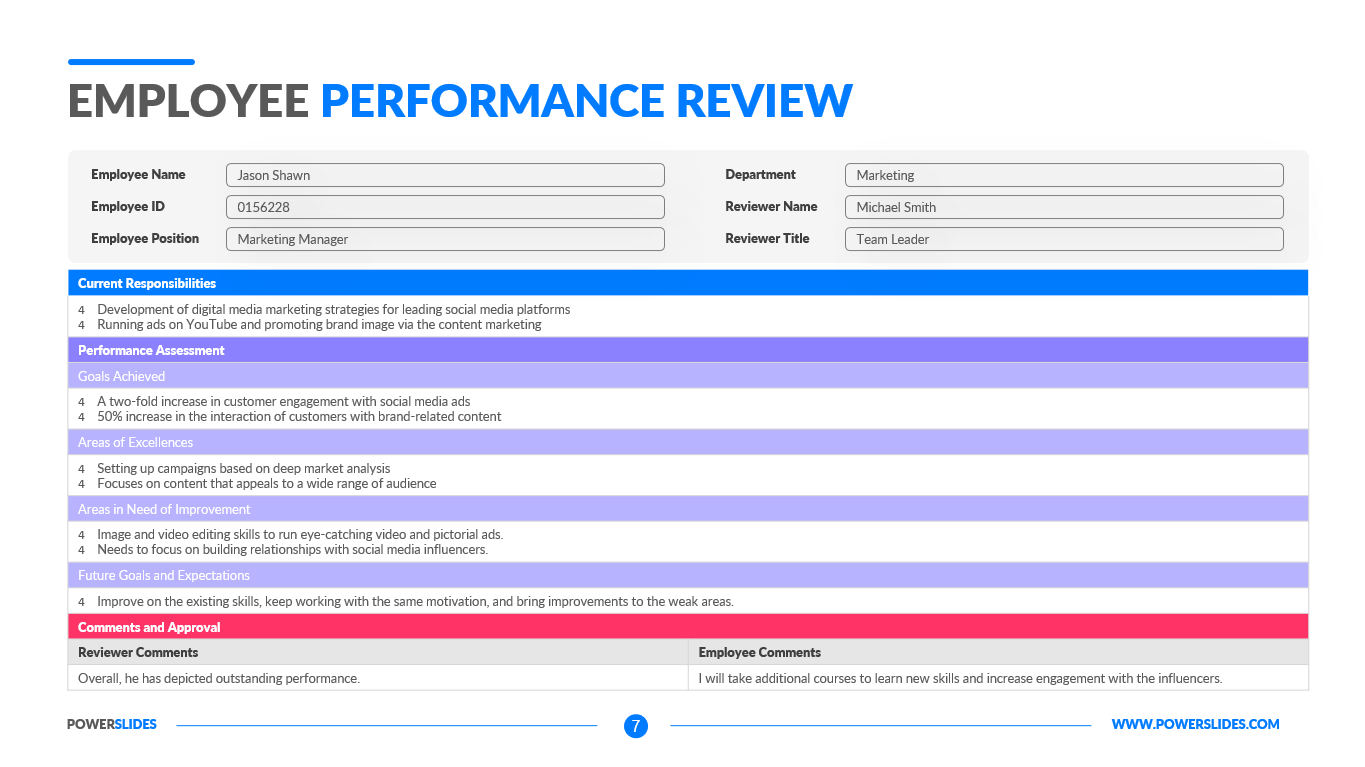
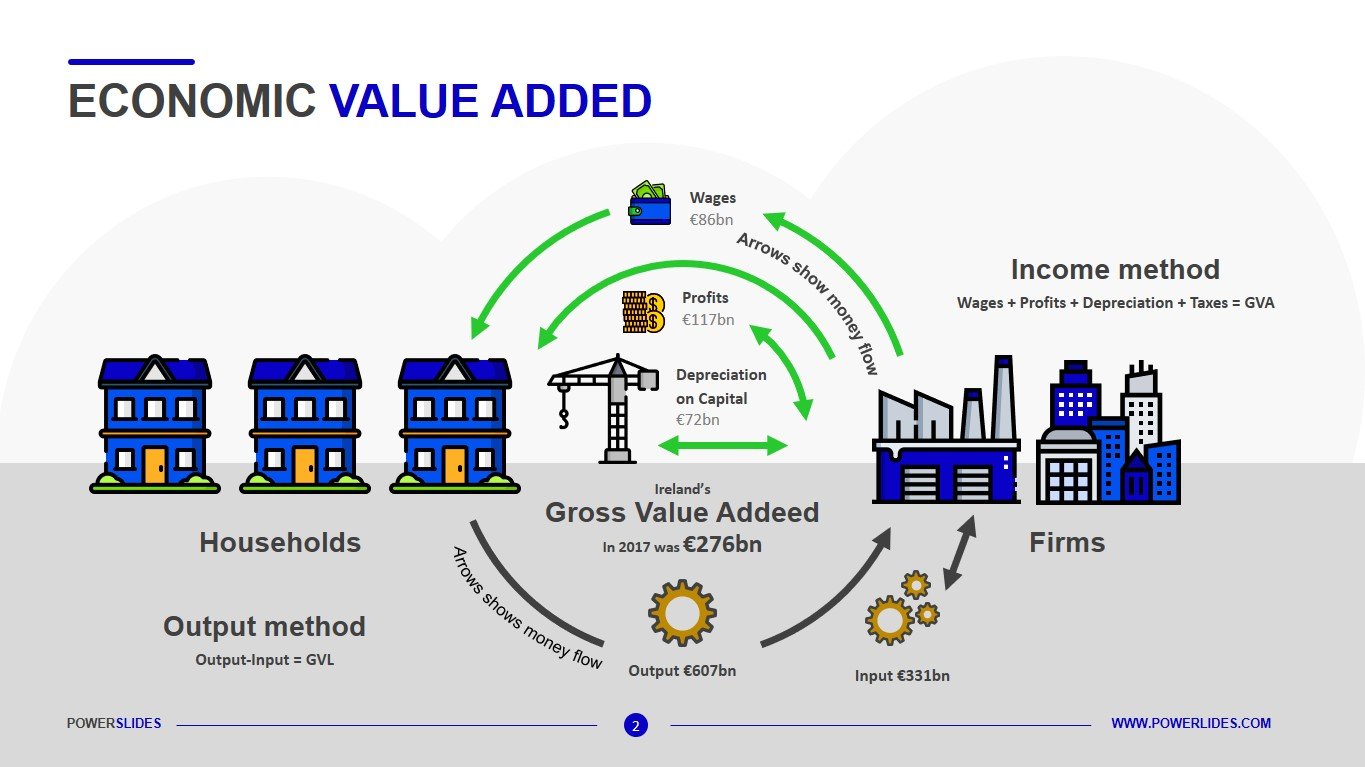
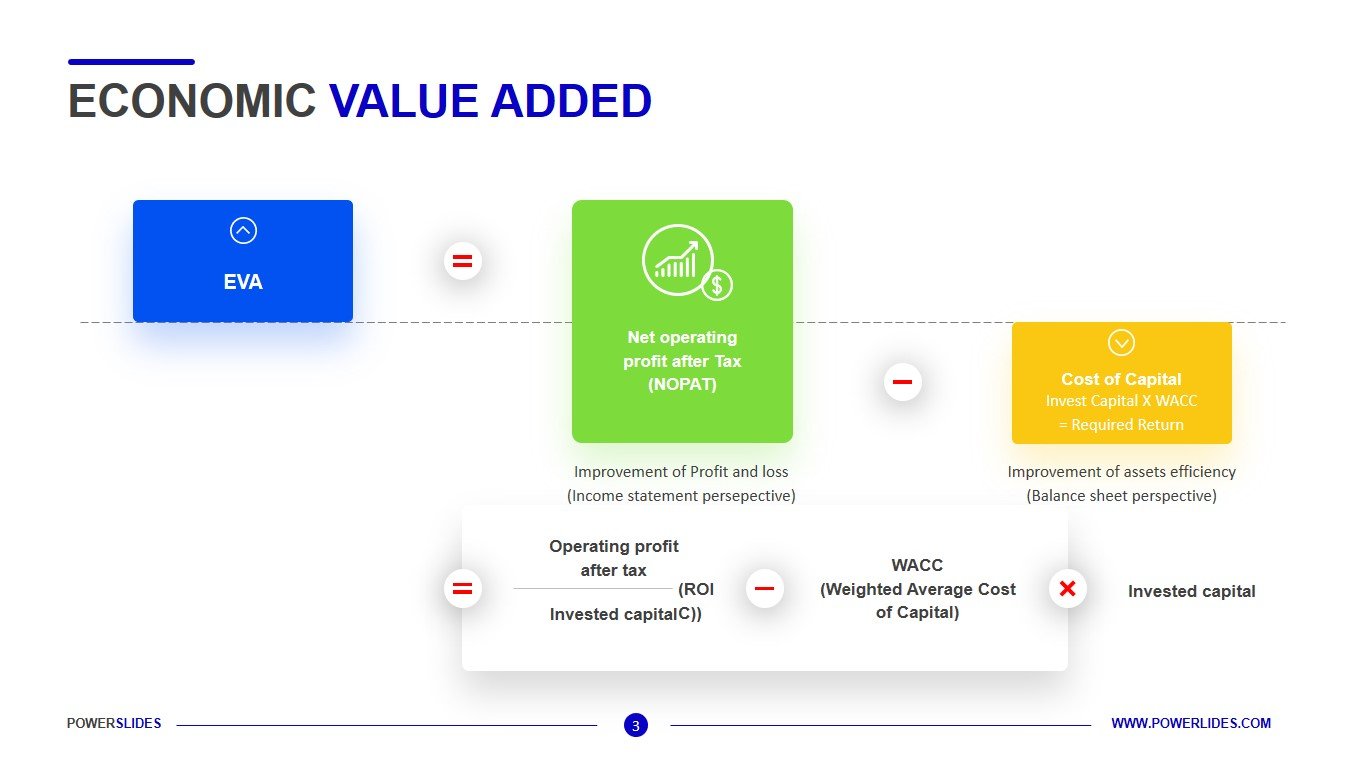
Economic value added (EVA) is a measure of a company’s financial performance based on the residual wealth calculated by deducting its cost of capital from its operating profit, adjusted for taxes on a cash basis. EVA can also be referred to as economic profit, as it attempts to capture the true economic profit of a company. EVA is the incremental difference in the rate of return (RoR) over a company’s cost of capital. Essentially, it is used to measure the value a company generates from funds invested in it. If a company’s EVA is negative, it means the company is not generating value from the funds invested into the business. Conversely, a positive EVA shows a company is producing value from the funds invested in it. The equation for EVA shows that there are three key components to a company’s EVA — NOPAT, the amount of capital invested, and the WACC. NOPAT can be calculated manually but is normally listed in a public company’s financials. Capital invested is the amount of money used to fund a company or a specific project. WACC is the average rate of return a company expects to pay its investors; the weights are derived as a fraction of each financial source in a company’s capital structure. EVA assesses the performance of a company and its management through the idea that a business is only profitable when it creates wealth and returns for shareholders, thus requiring performance above a company’s cost of capital. The calculation shows how and where a company created wealth, through the inclusion of balance sheet items. This forces managers to be aware of assets and expenses when making managerial decisions.
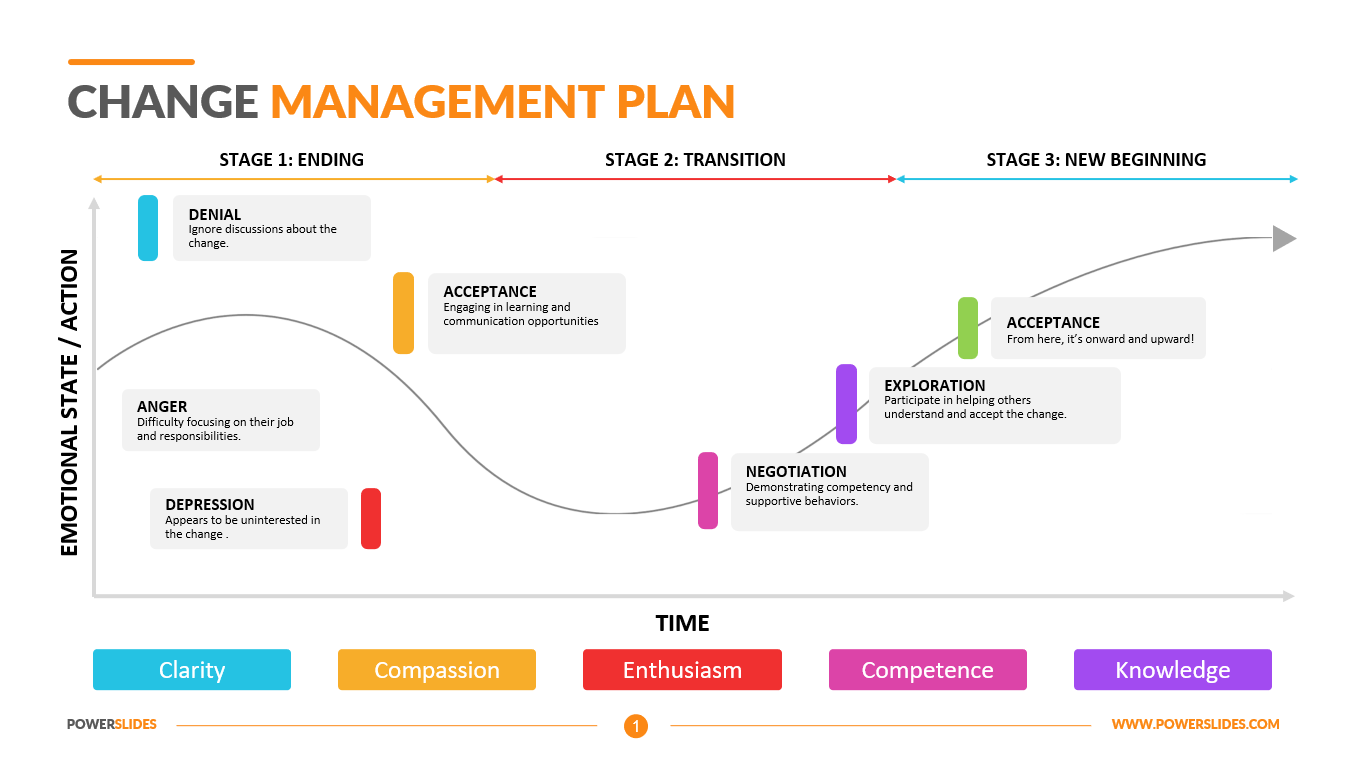
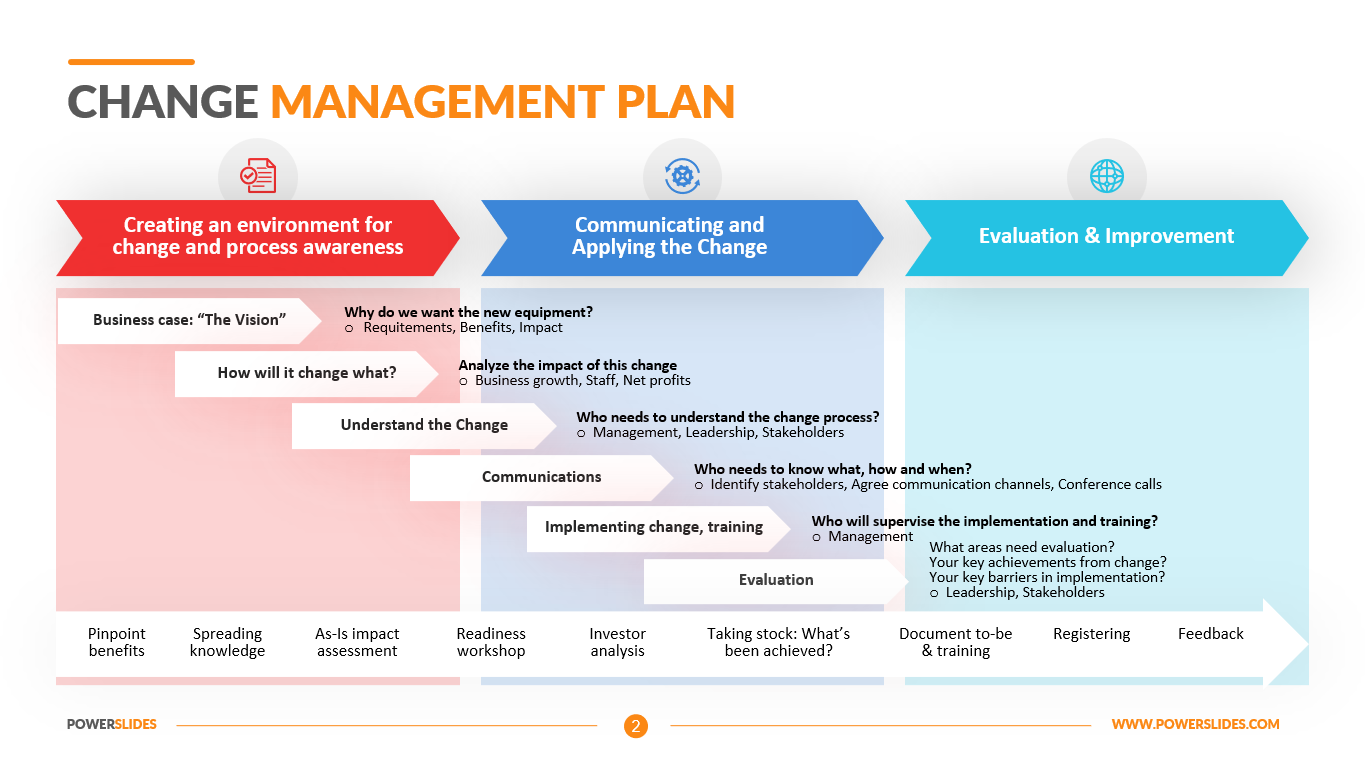
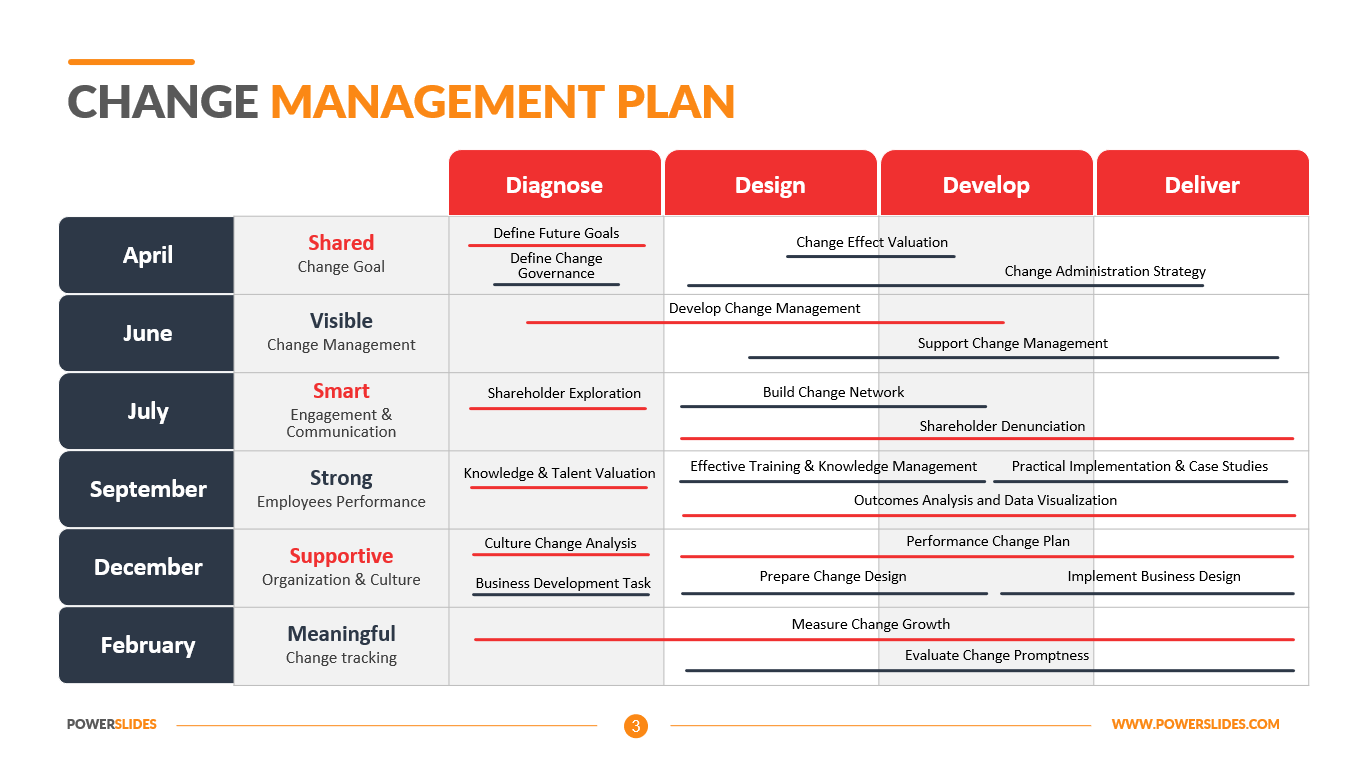
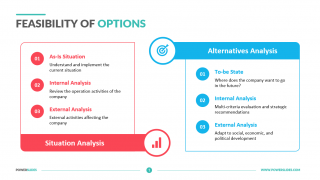
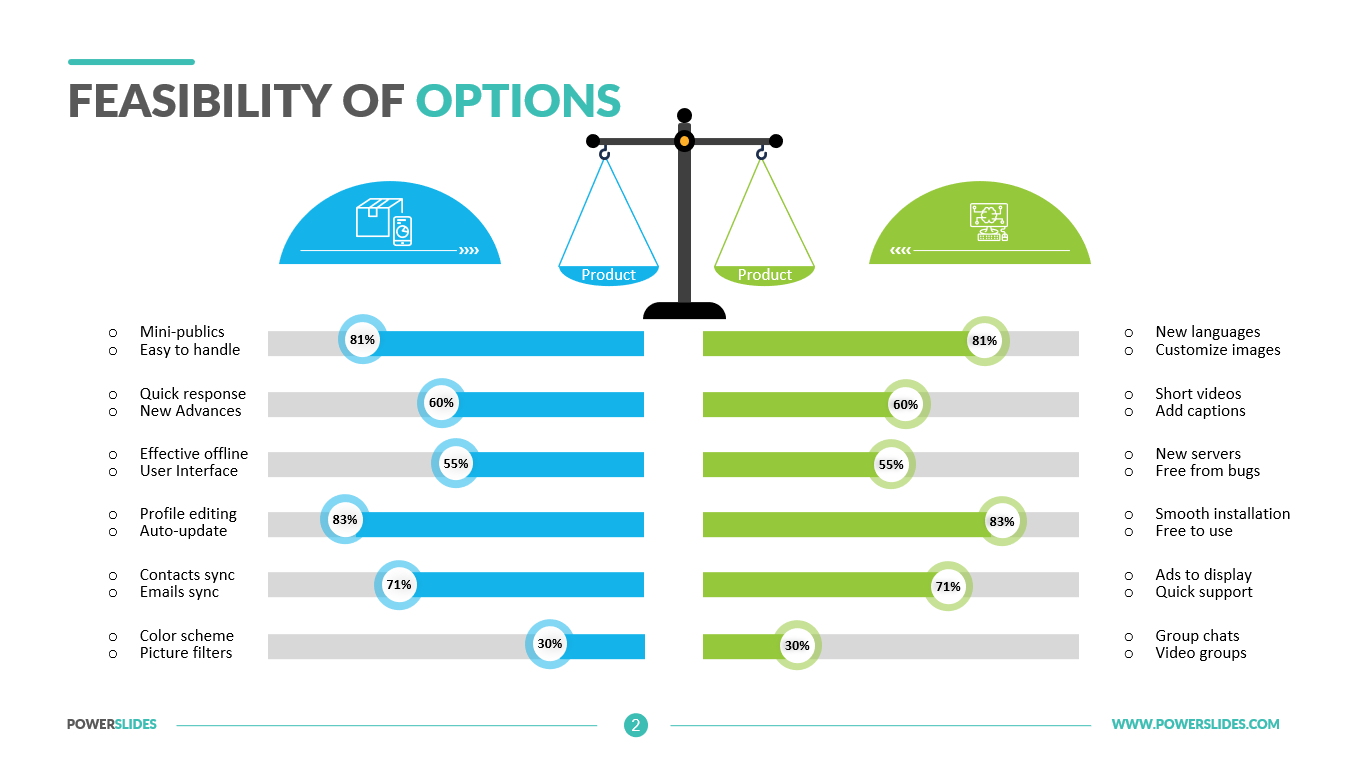
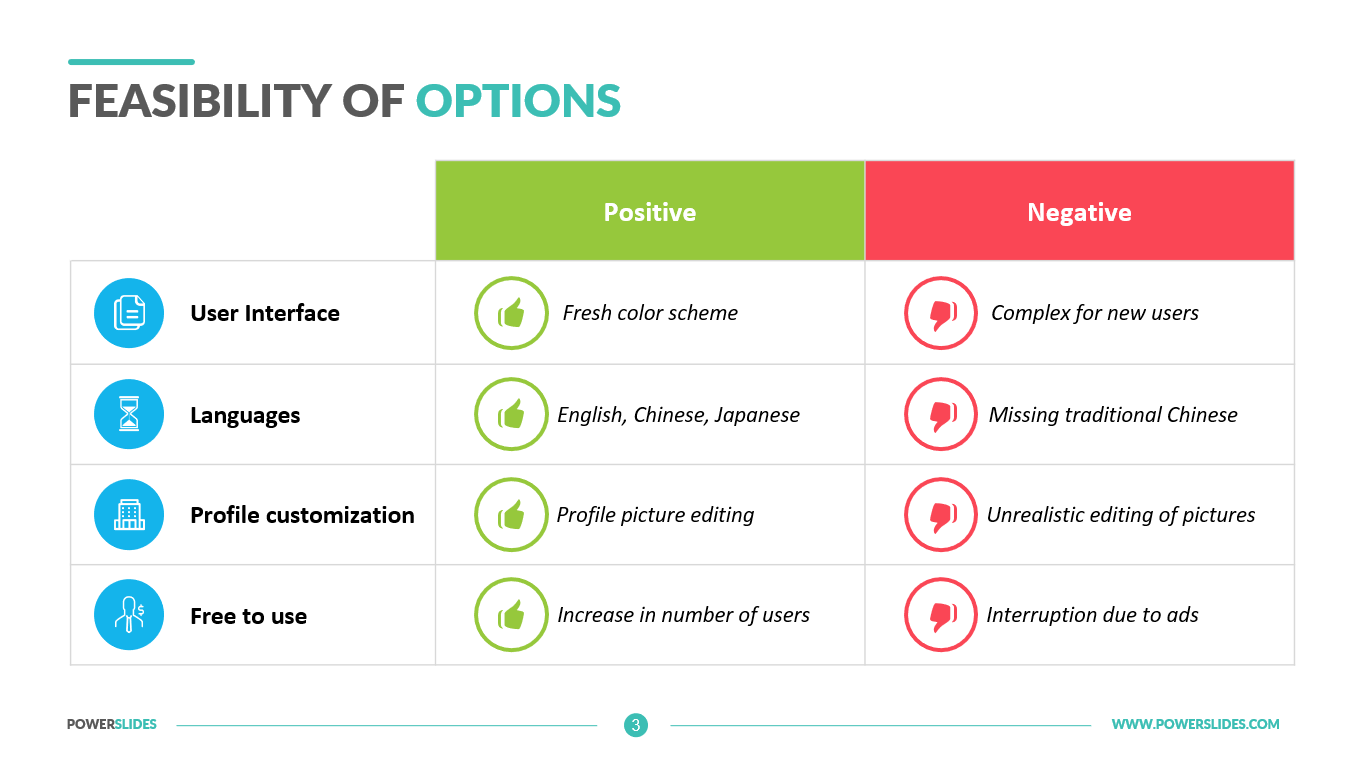
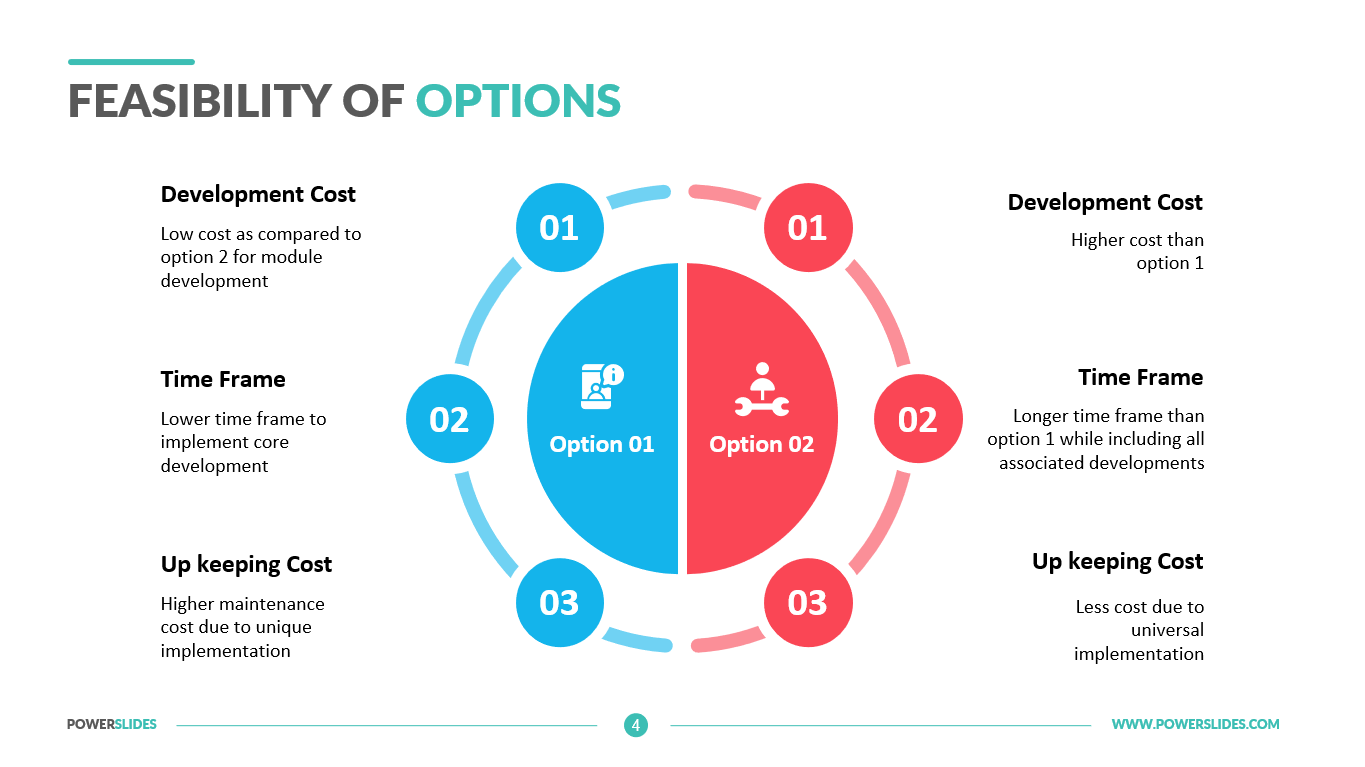
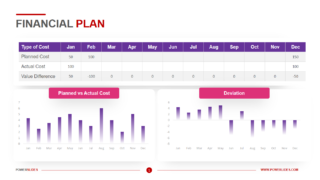
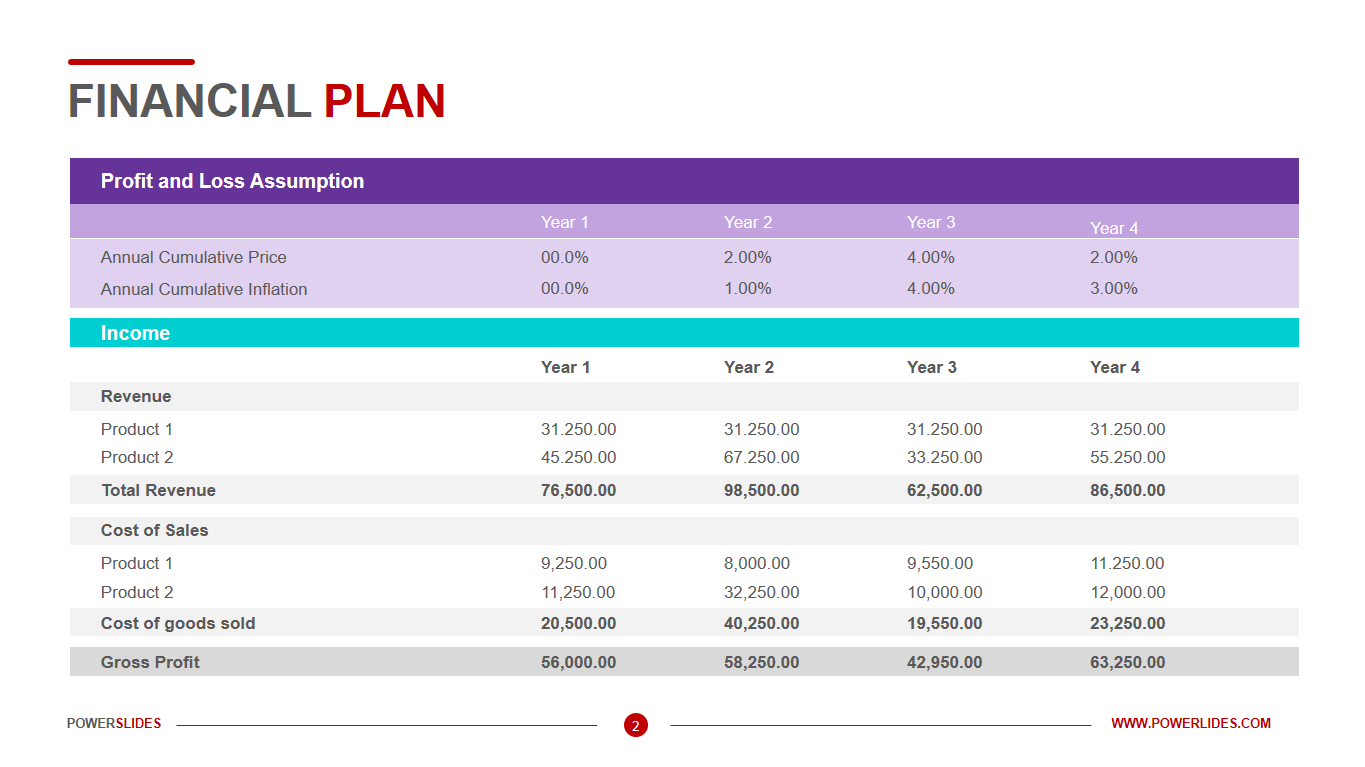
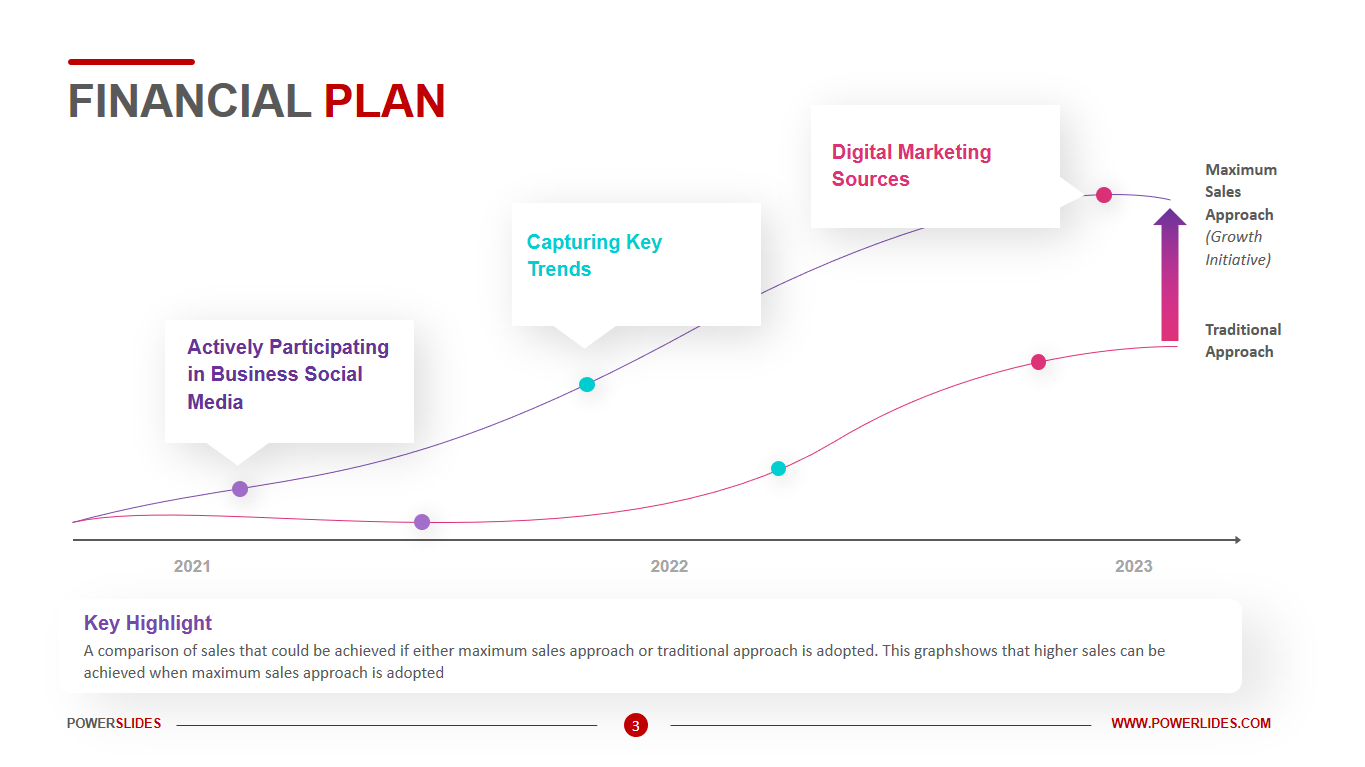
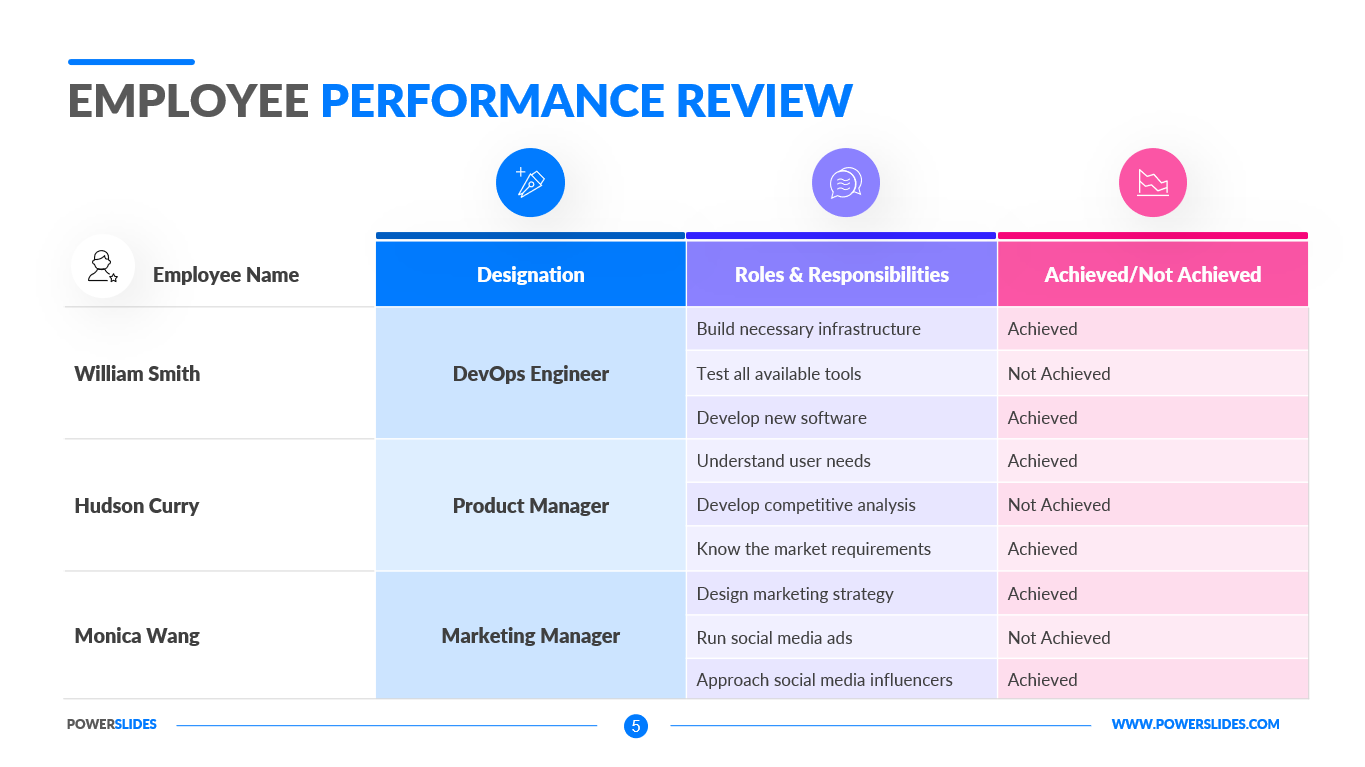
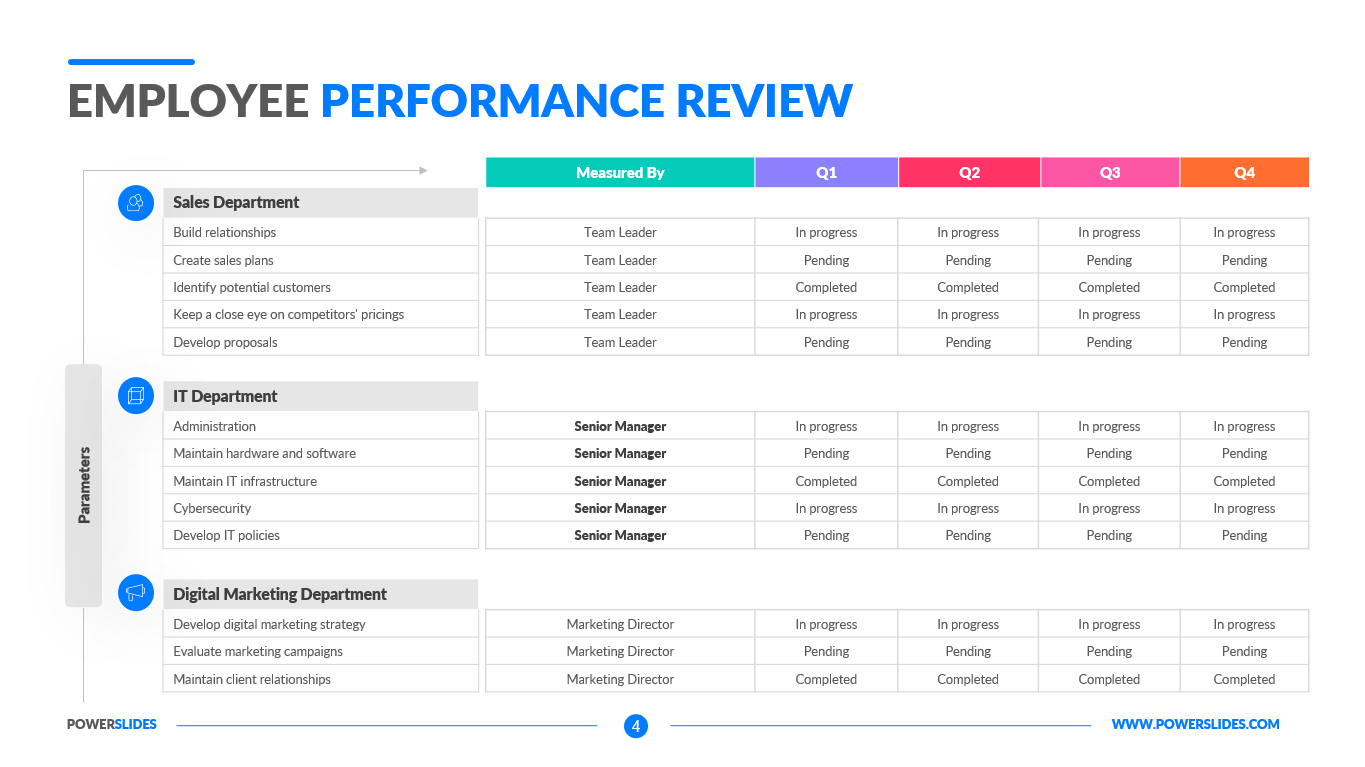
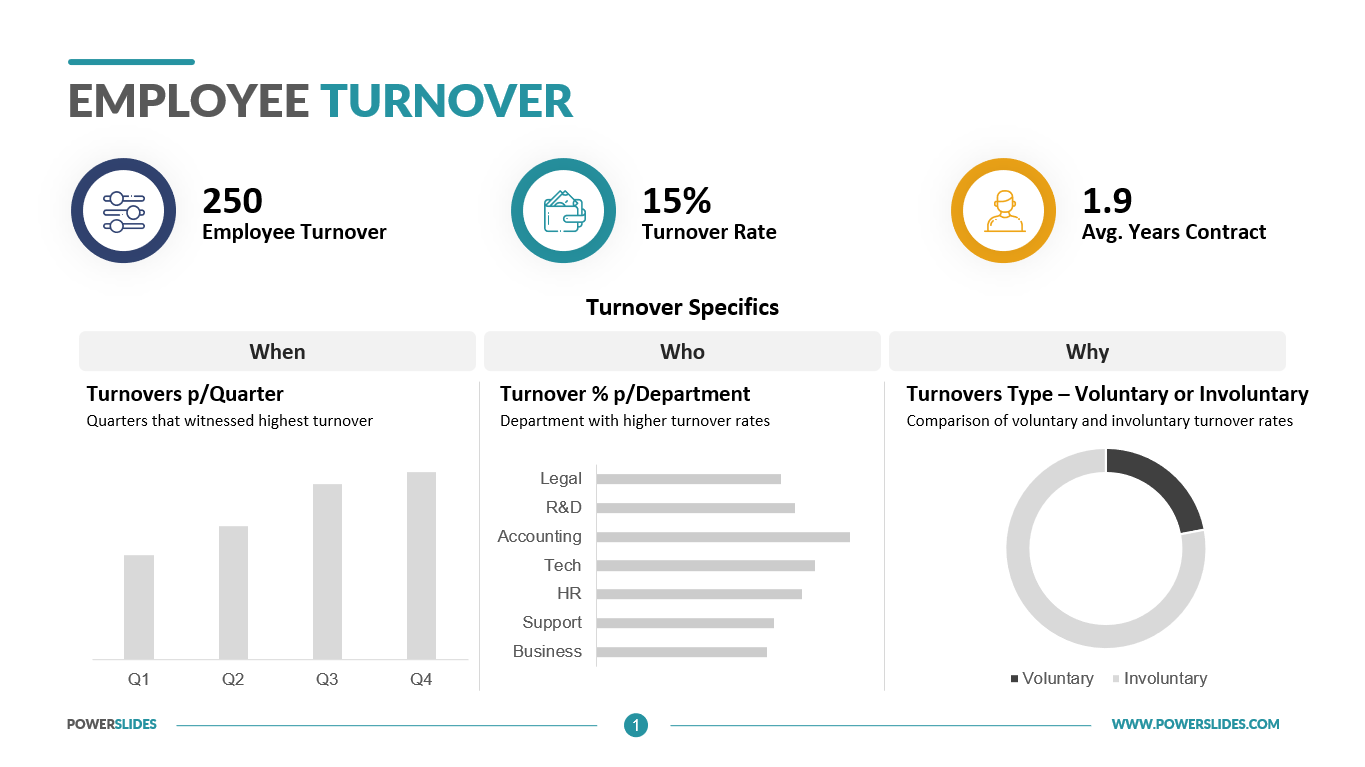
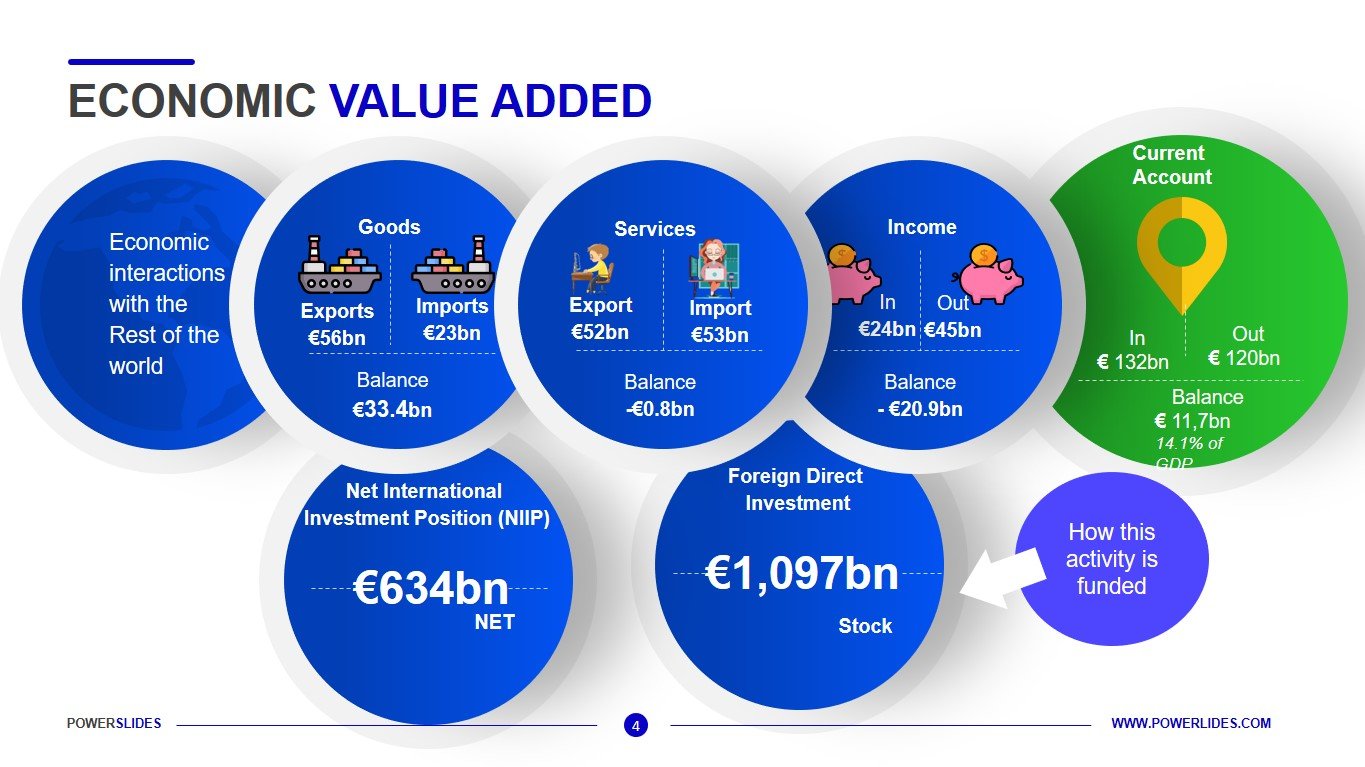
The first slide of the Economic Value Added template contains a lot of infographics. This slide is adapted for the medical industry and will primarily be useful to pharmaceutical companies. You use this slide when preparing a startup to launch a new drug or medical service. You can use a graph to show the break-even point or the dependence of fixed costs on an increase in production. The next slide can be used when reinvesting funds from main production in commercial real estate. You can map the increase in return on investment and return on cash reinvestment. The last slide gives you an opportunity to compare the economic value added from various business projects of the company. For example, you can compare economic value added from a core business and a related area that provides consumer services. This slide will be useful for employees of investment companies, crisis managers, financiers and company executives.
You can independently change the Economic Value Added template by changing the colors, sizes and fonts to match your corporate colors. This template will be useful when preparing a report on the investment of profits in new projects. Also, this template can be used by business trainers when preparing a course on investing, stock exchanges and financial management.


