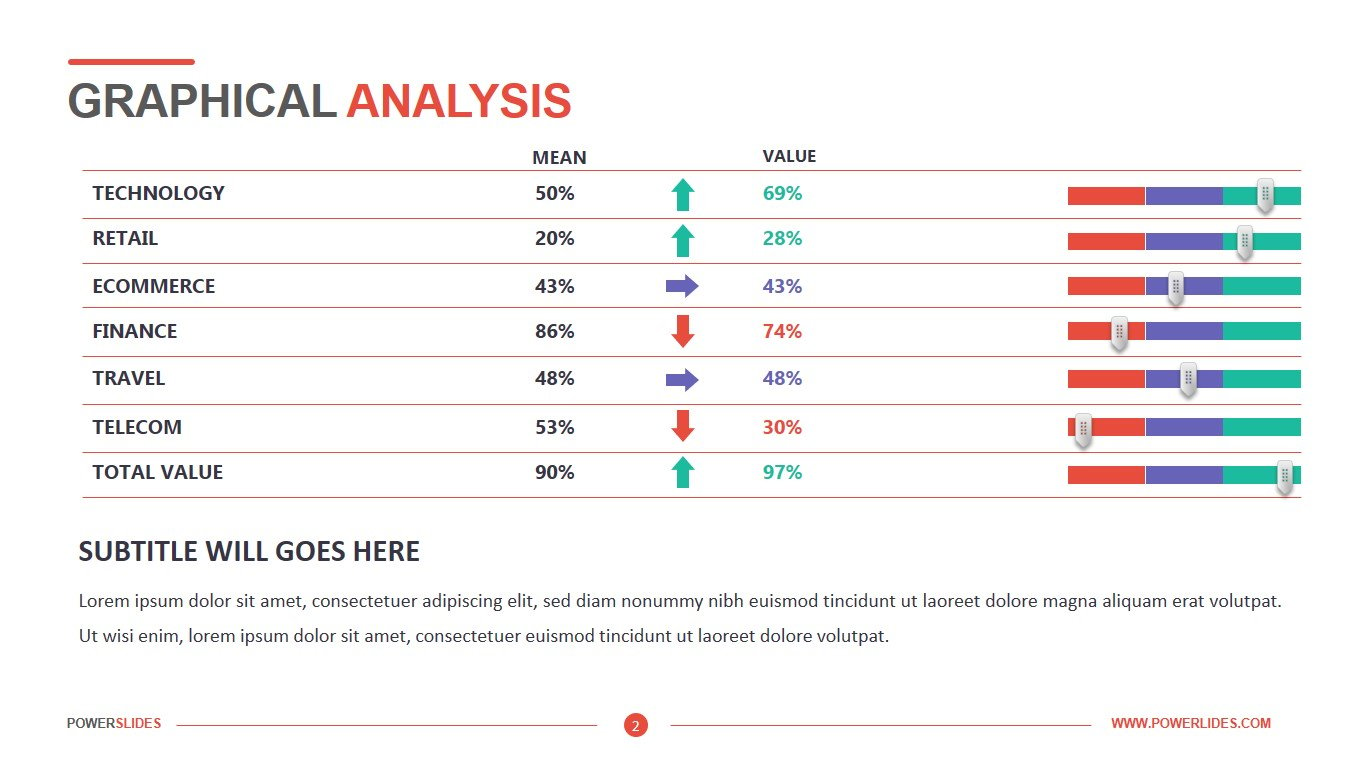
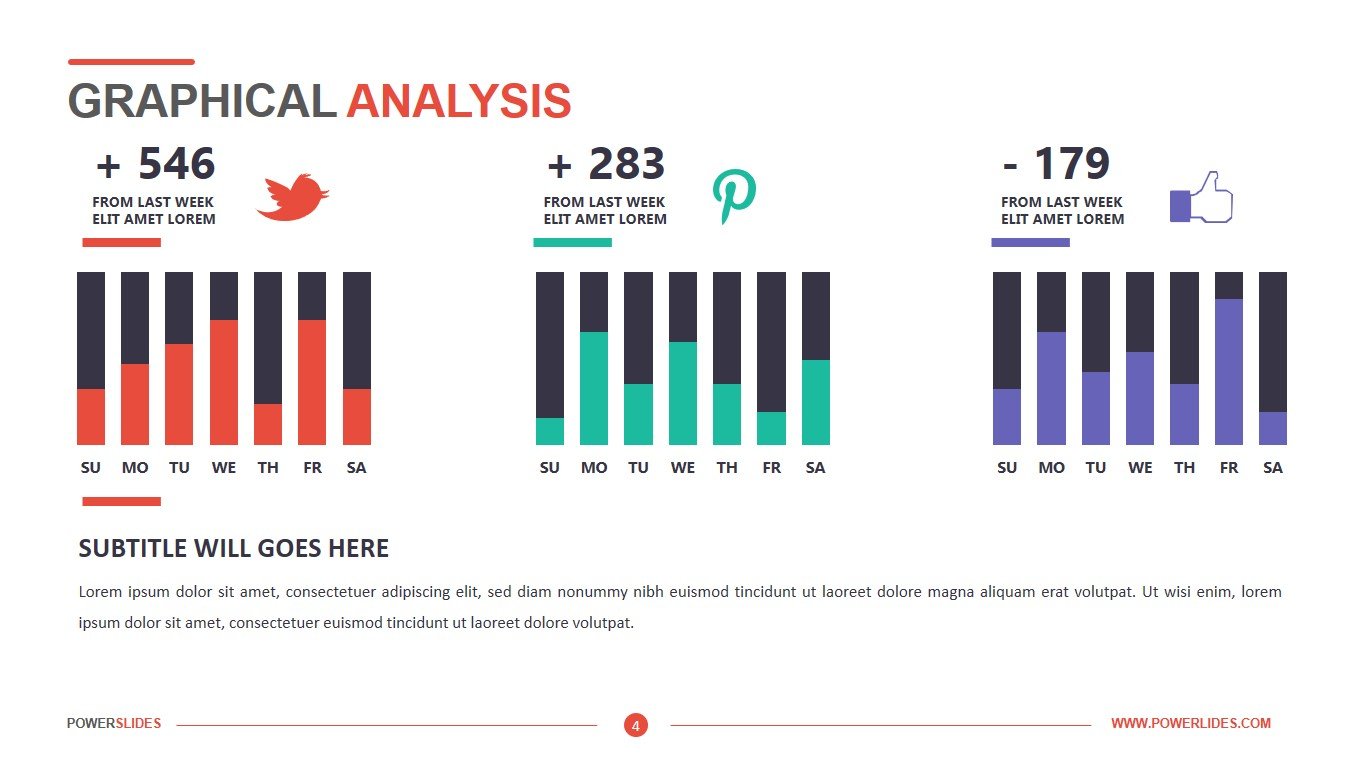
Business KPI Dashboards
What do you think of this template?

 (4.67/ 5)
14 ratings

 5 Slides
 File size: 16:9
 Fonts: Lato Black, Calibri
 Supported version
PPT 2010, PPT 2013, PPT 2016
Supported version
PPT 2010, PPT 2013, PPT 2016

Product details
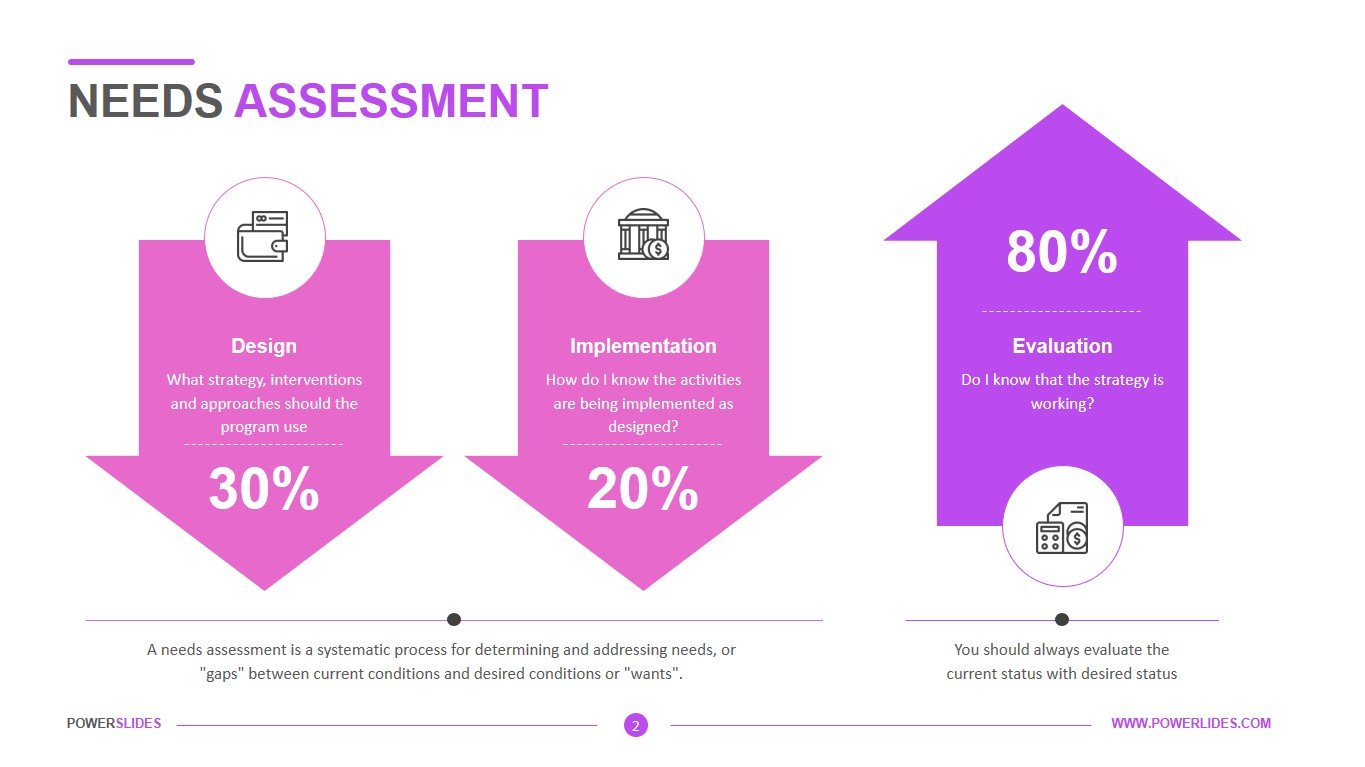
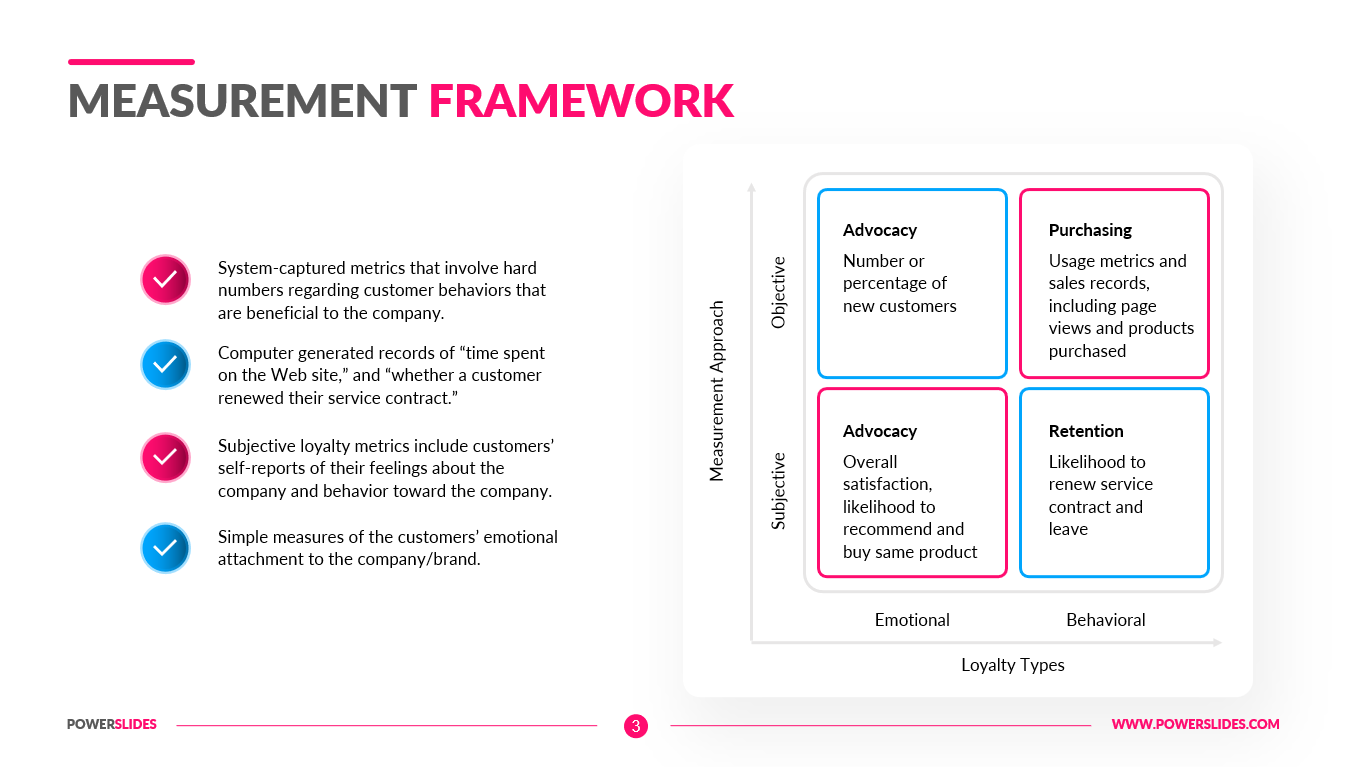
Key performance indicators have always been the most critical part of a company. Without KPIs, a company roams blindly into uncontrollable performance management issues and risks losing its business. But utilizing KPIs is not the only thing an organization should focus on. Choosing the right KPI and connecting it to others to create a proper data-story is one of the crucial elements that will enable managers and team members to stay on track for reaching and outperforming company’s goals and objectives.
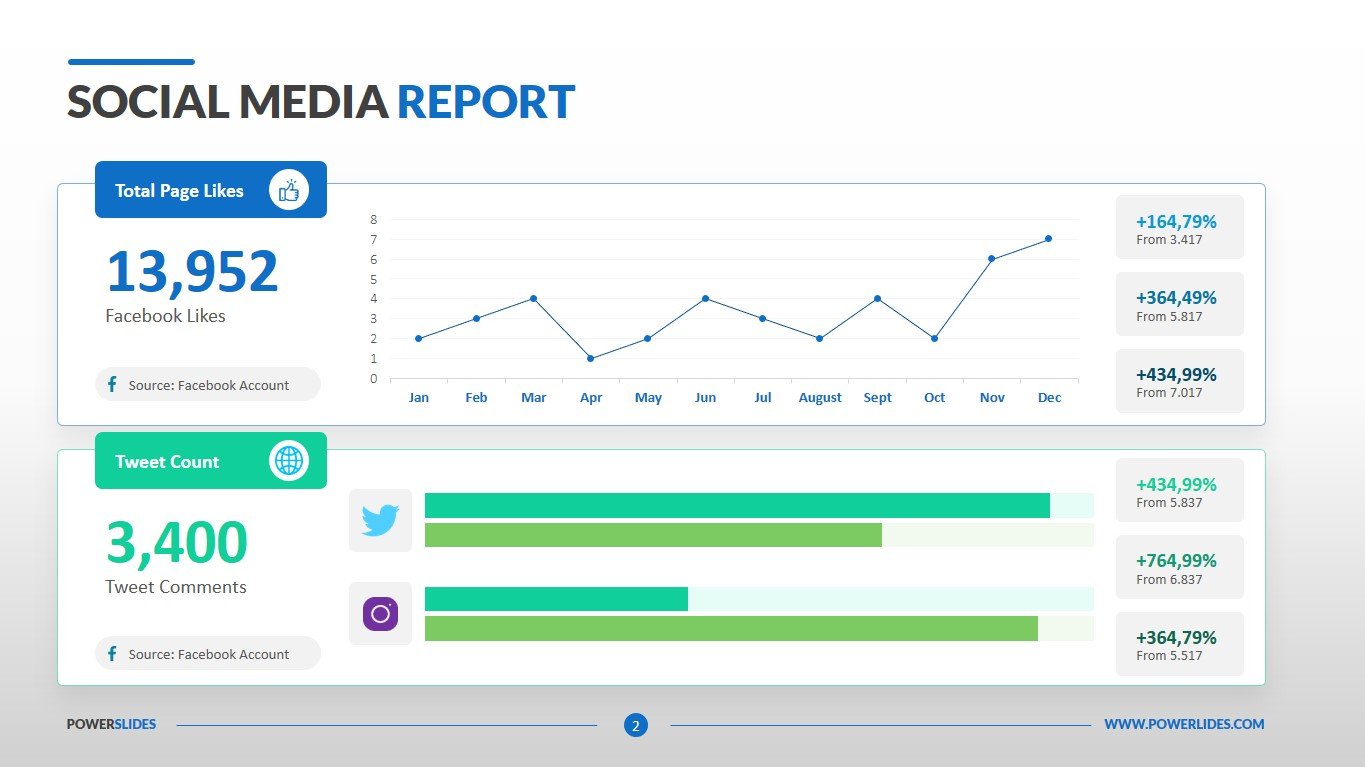
Imagine having all-important KPIs on a single screen. Everyone can interconnect various findings and react to any given issue in seconds with the help of a professional dashboard software. That is where the power of KPI dashboards lies and provides the most valuable weapon against decreased productivity and increased operational or strategic costs.
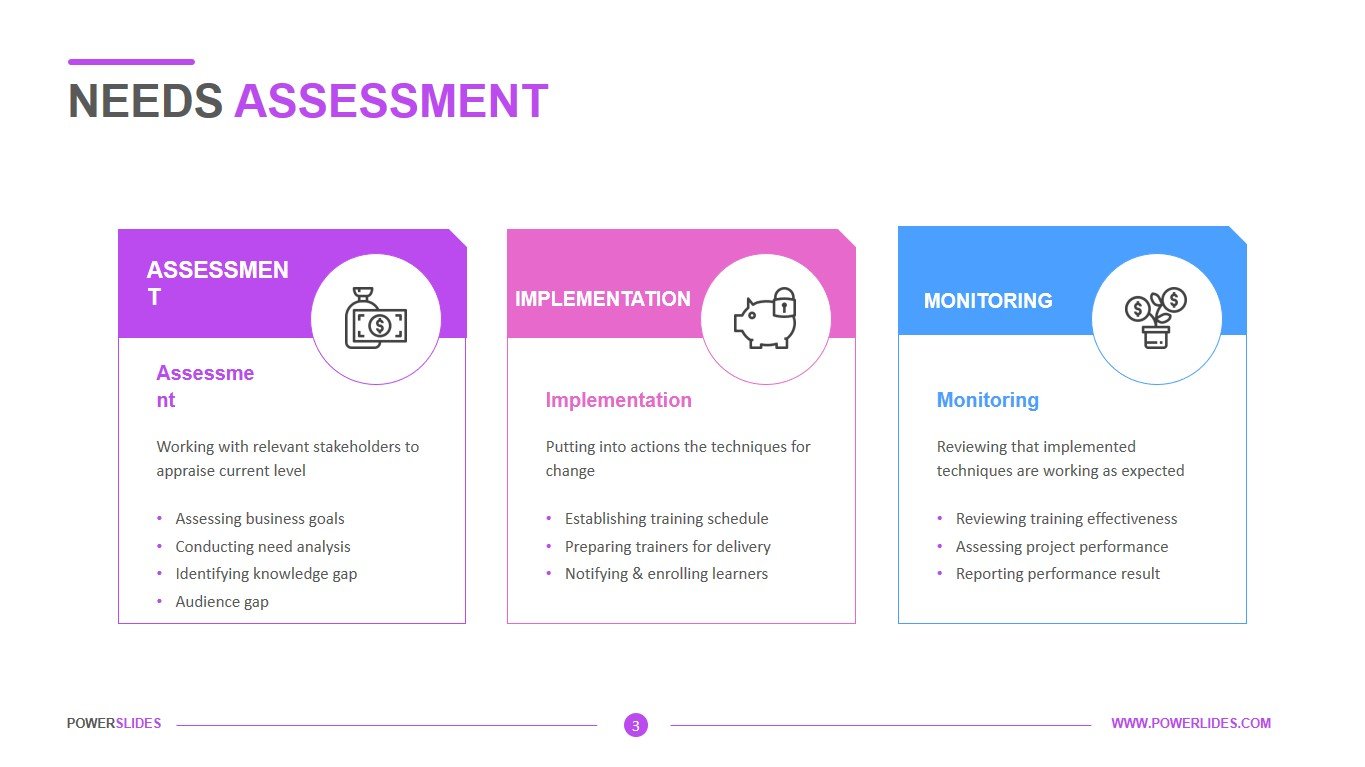
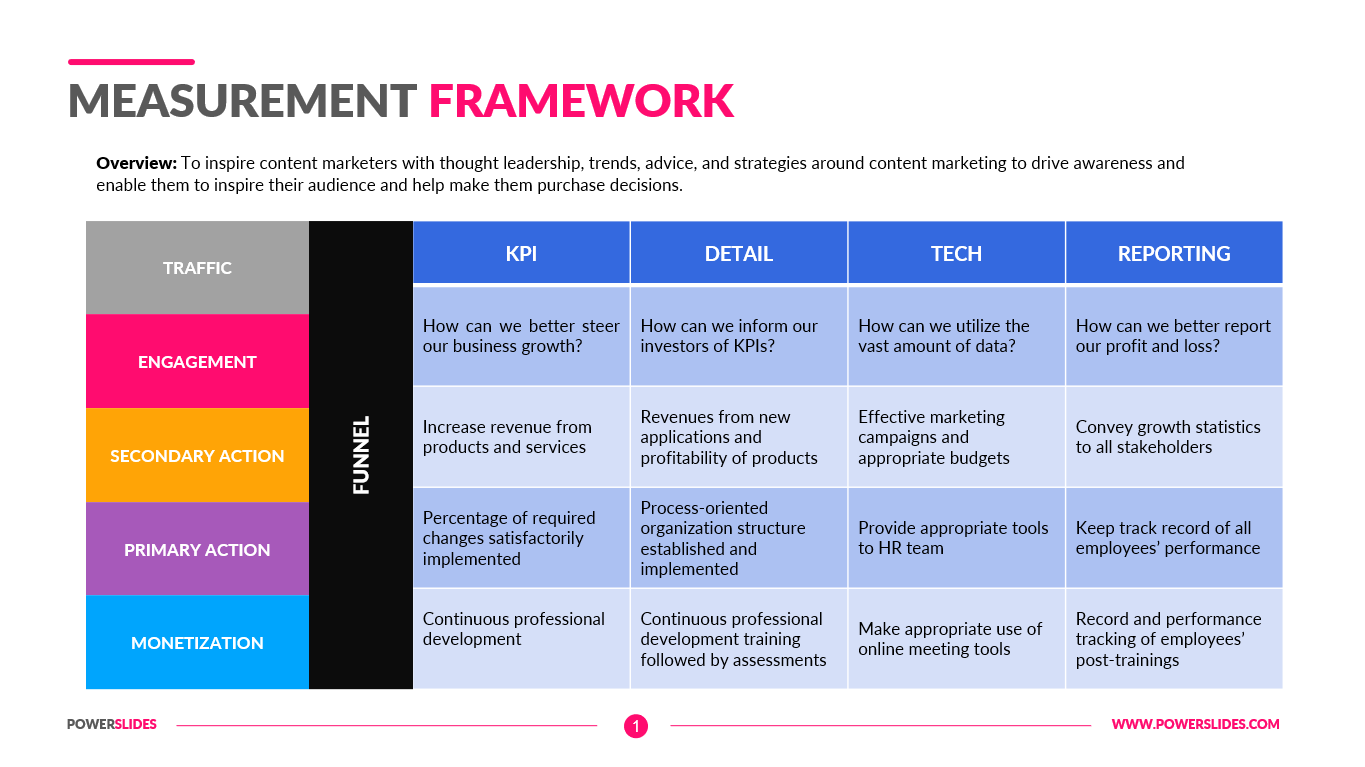
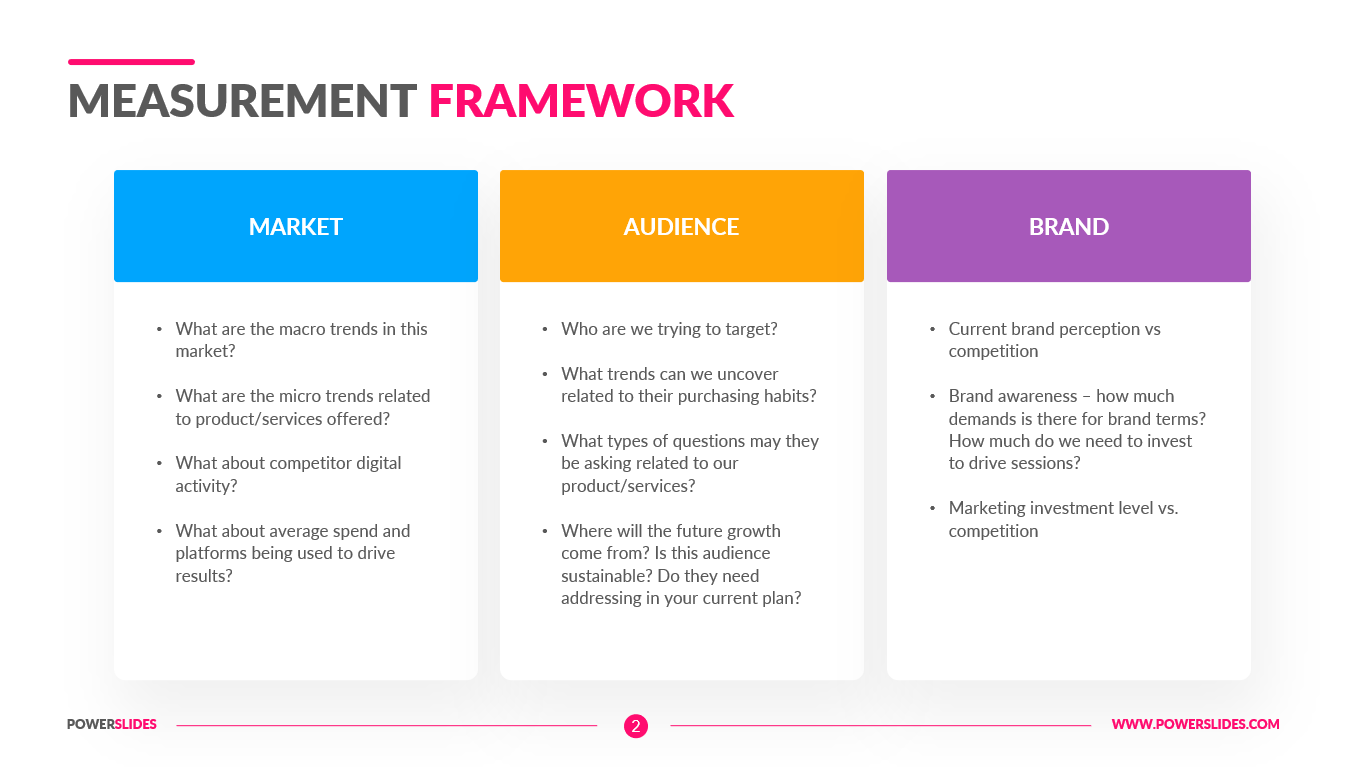
A KPI dashboard is a management tool used by managers, VPs and everyone in the company who needs to have a birds-eye view of the business’ performance, whether on an operational or strategic level and make better decisions. Businesses utilize high-level and low-level KPIs that are specifically designed to track, report and visualize wide organizational goals, and daily departmental targets.
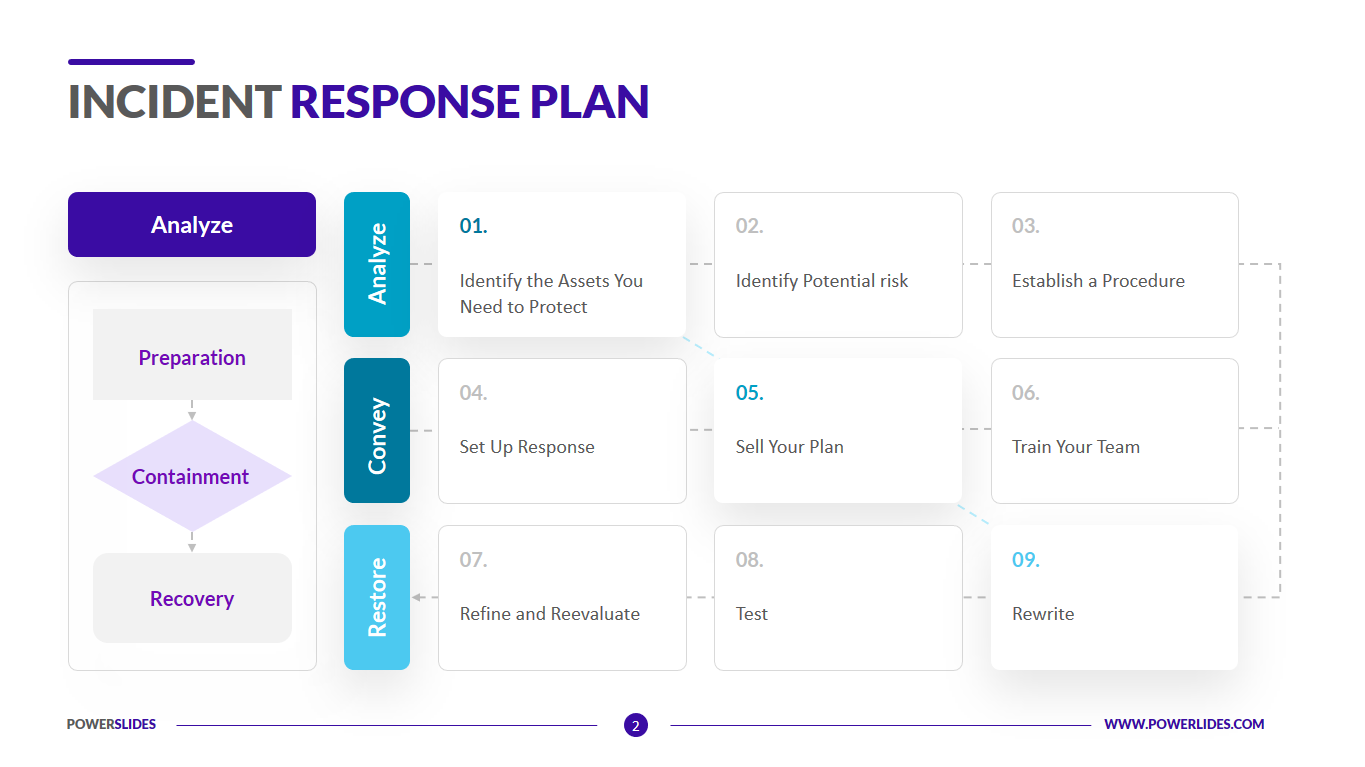
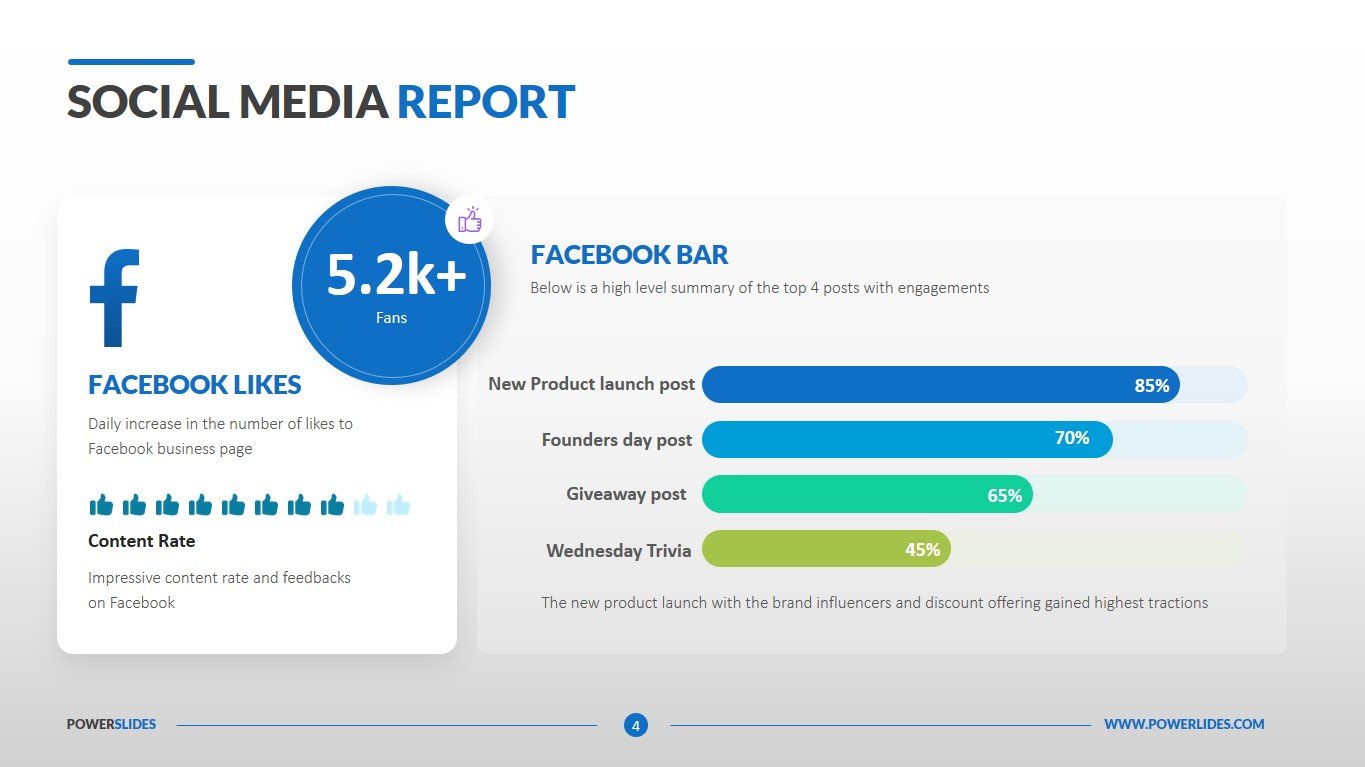
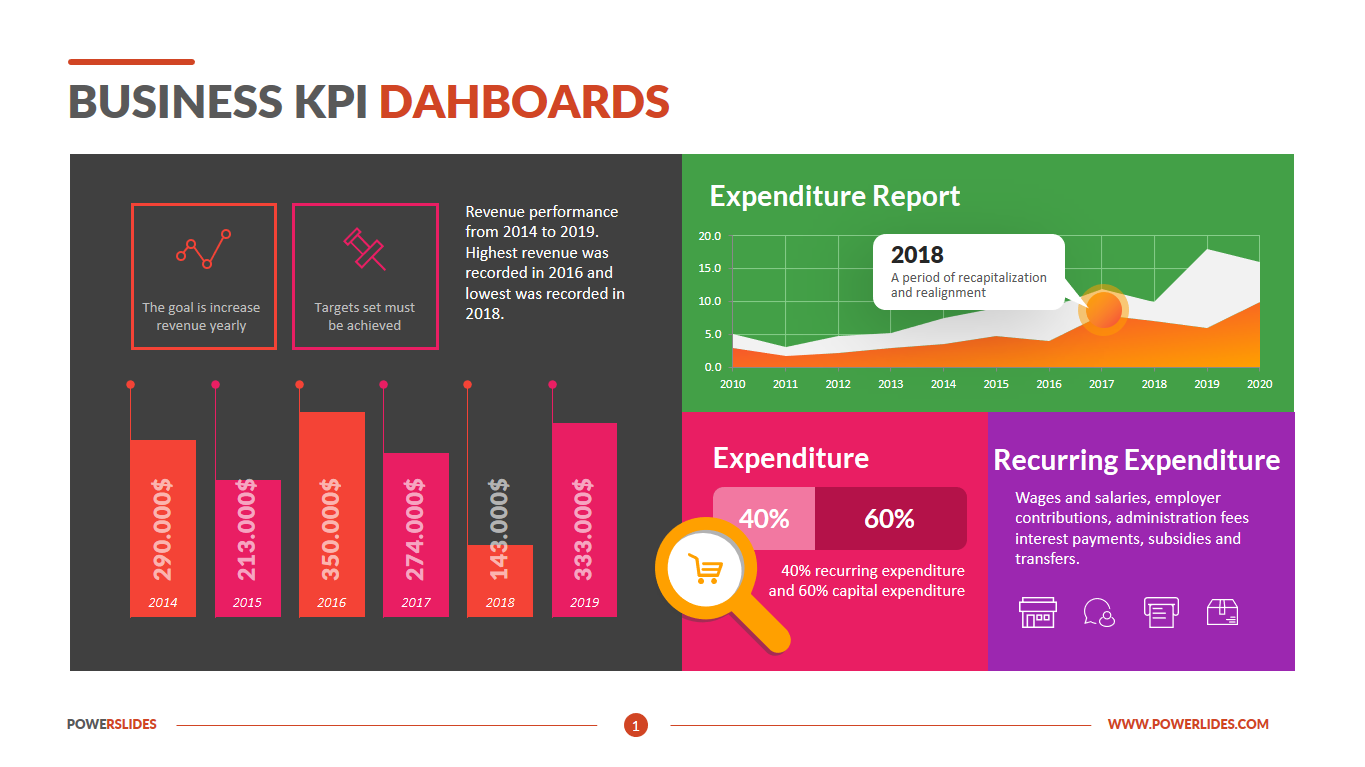
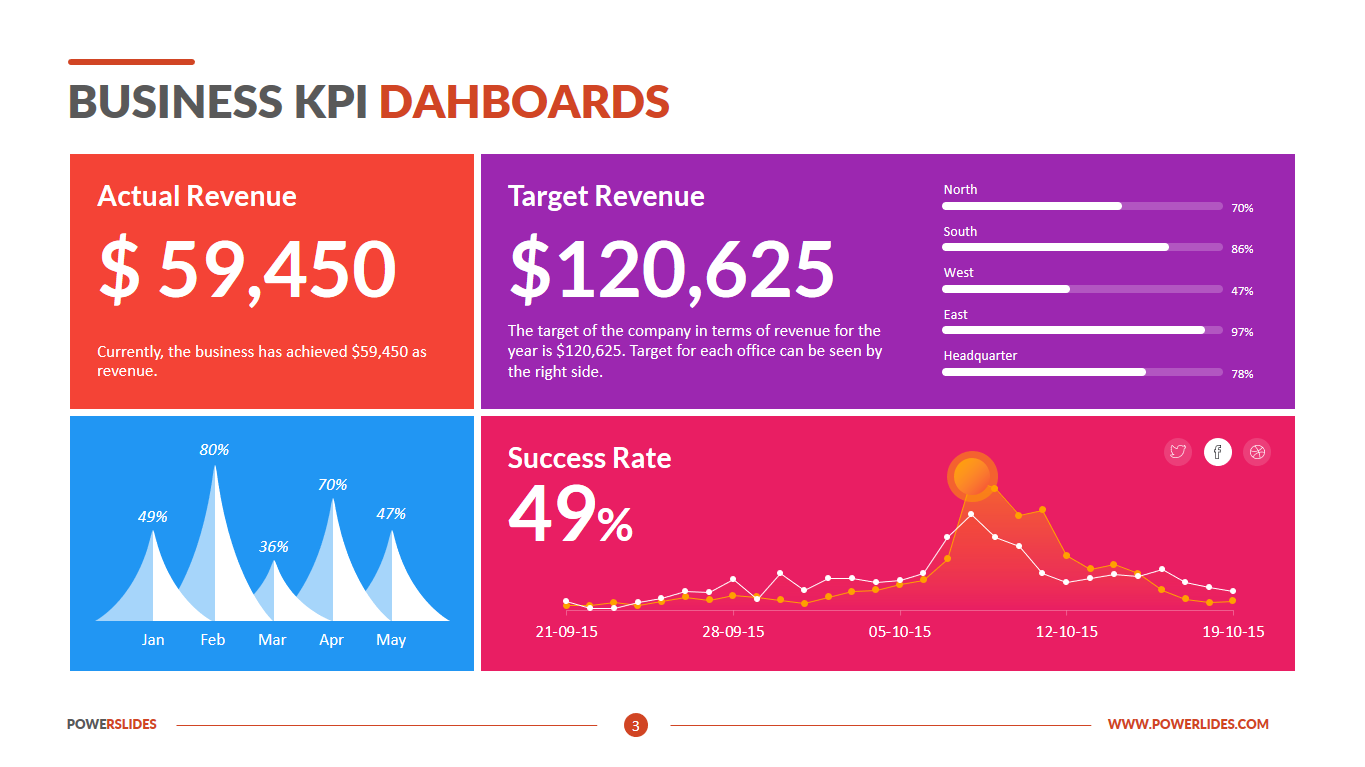
This business KPI dashboard is a structured report that aligns your business initiatives, programs and objectives with key results and goals. For growing startups and established businesses, this dashboard can bring you and your teams a strong focus and a path forward.
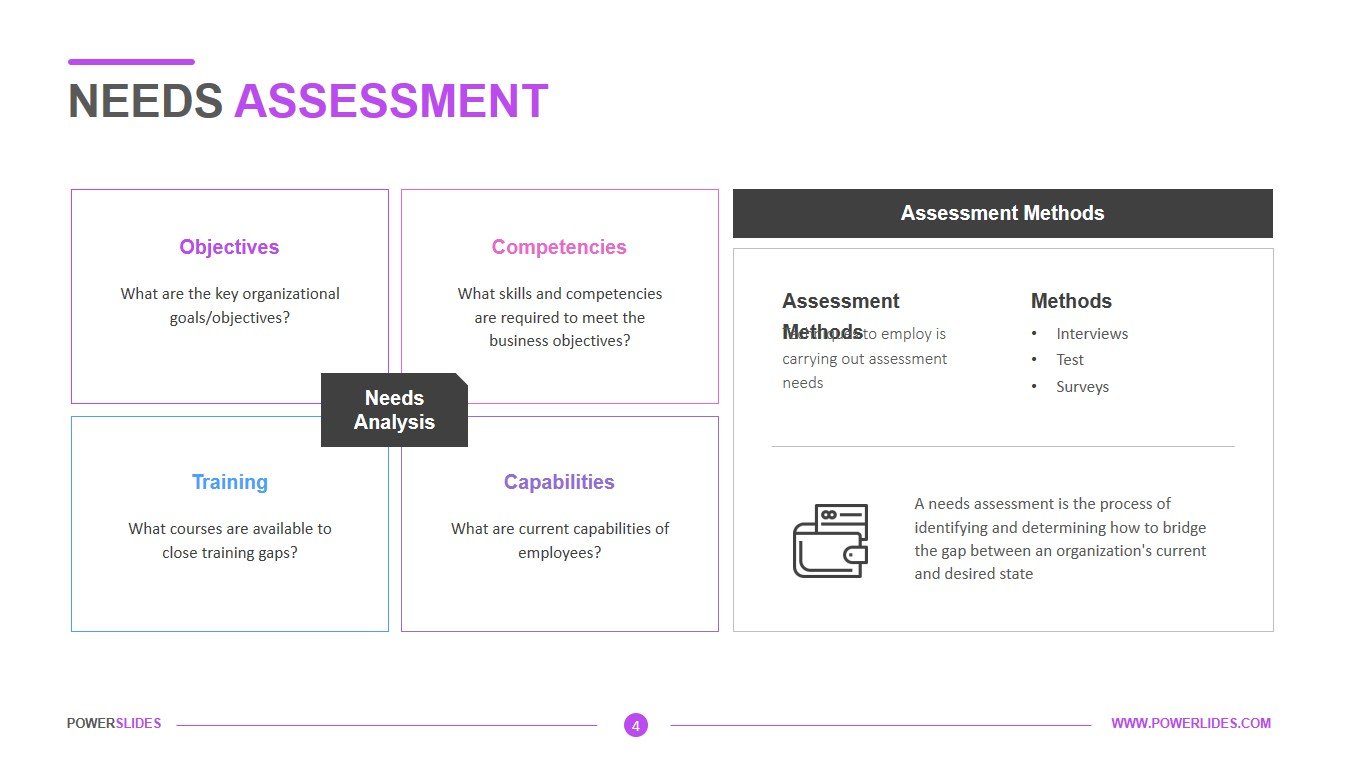
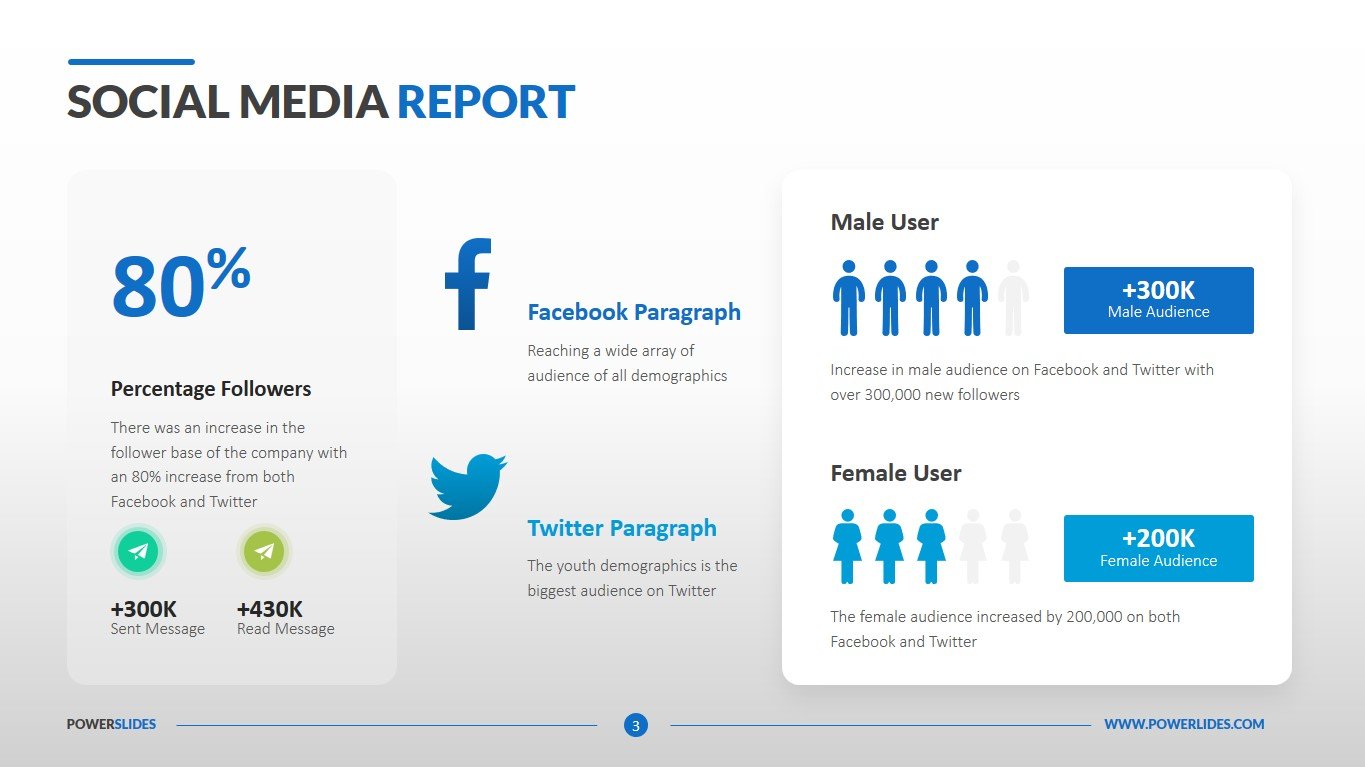
This template will be useful for company executives and department heads. You can use the slides from this template to visualize your company’s KPIs on one screen. For example, you can present the company’s profitability indicators, a graph of the company’s expenses and income, payments to shareholders, and planned investments. This approach allows you to immediately see the patterns between various economic indicators and make decisions based on the analysis of all financial indicators of the company.
Also, this template will be useful for heads of startups when preparing a reporting meeting with investors. You can present the main KPIs in detail and give a complete analysis for each of them. This presentation of the data will show your investors that you are in control of the company and that the investment is in good hands.
Business trainers and university educators can use the slides in this template to prepare their courses on financial analysis or develop and implement KPIs in the enterprise. Financial analysts and bankers can use this template in their day-to-day work. For example, you can use this template when preparing weekly reports on the analysis of financial performance of key market players or large bank clients.
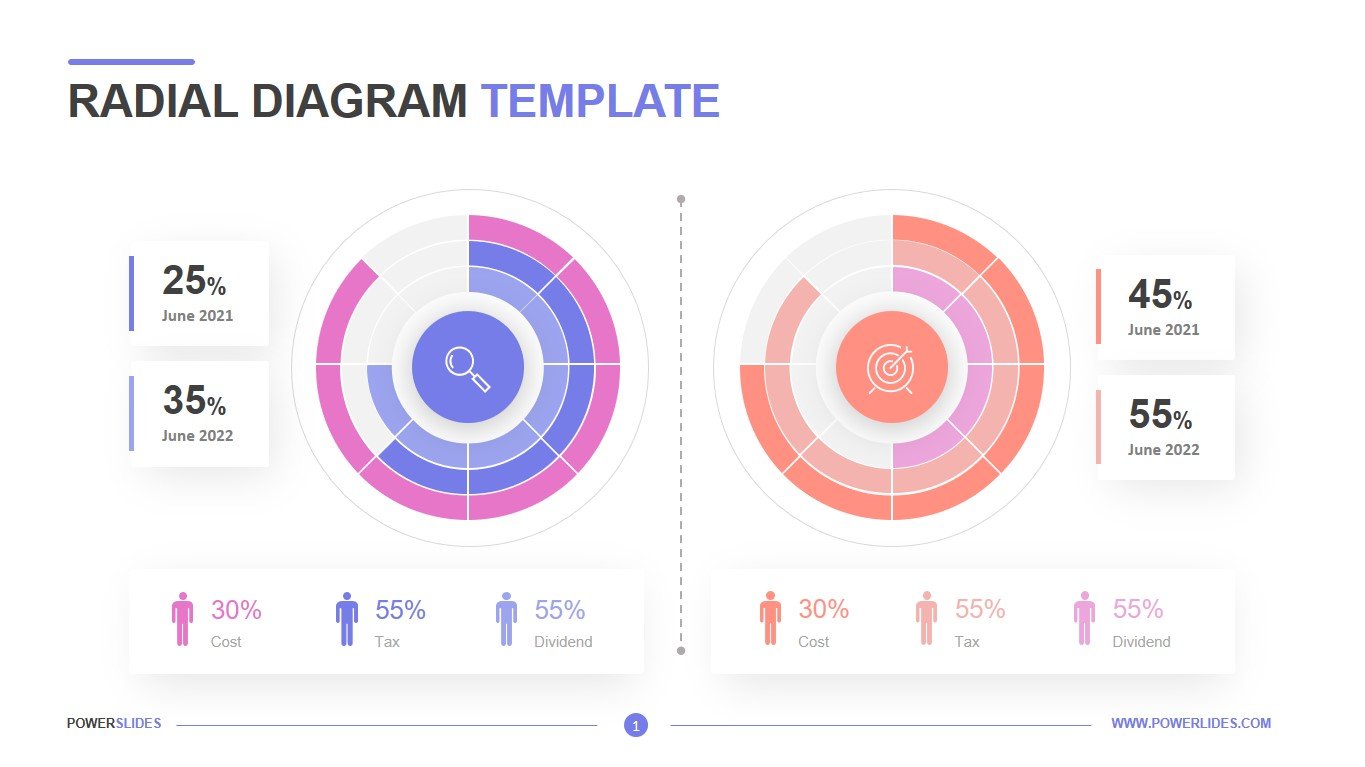
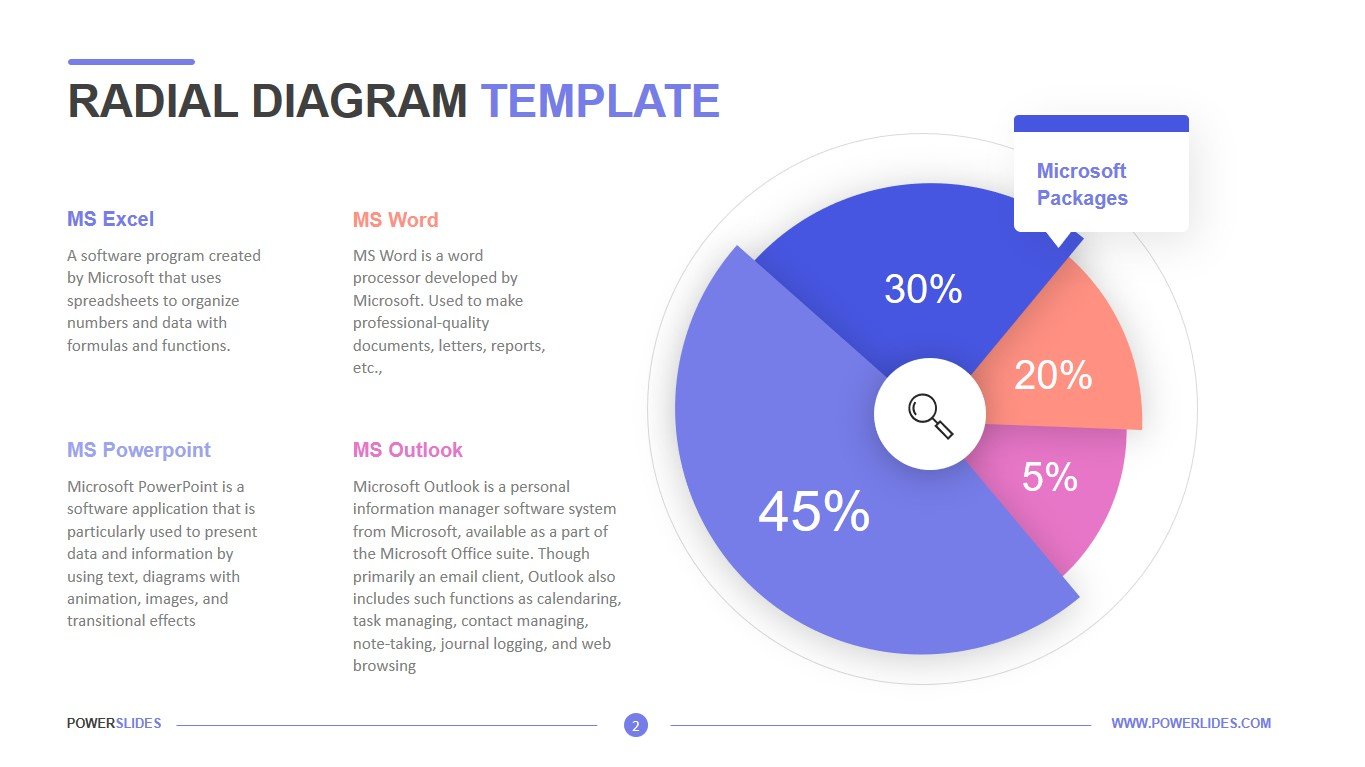
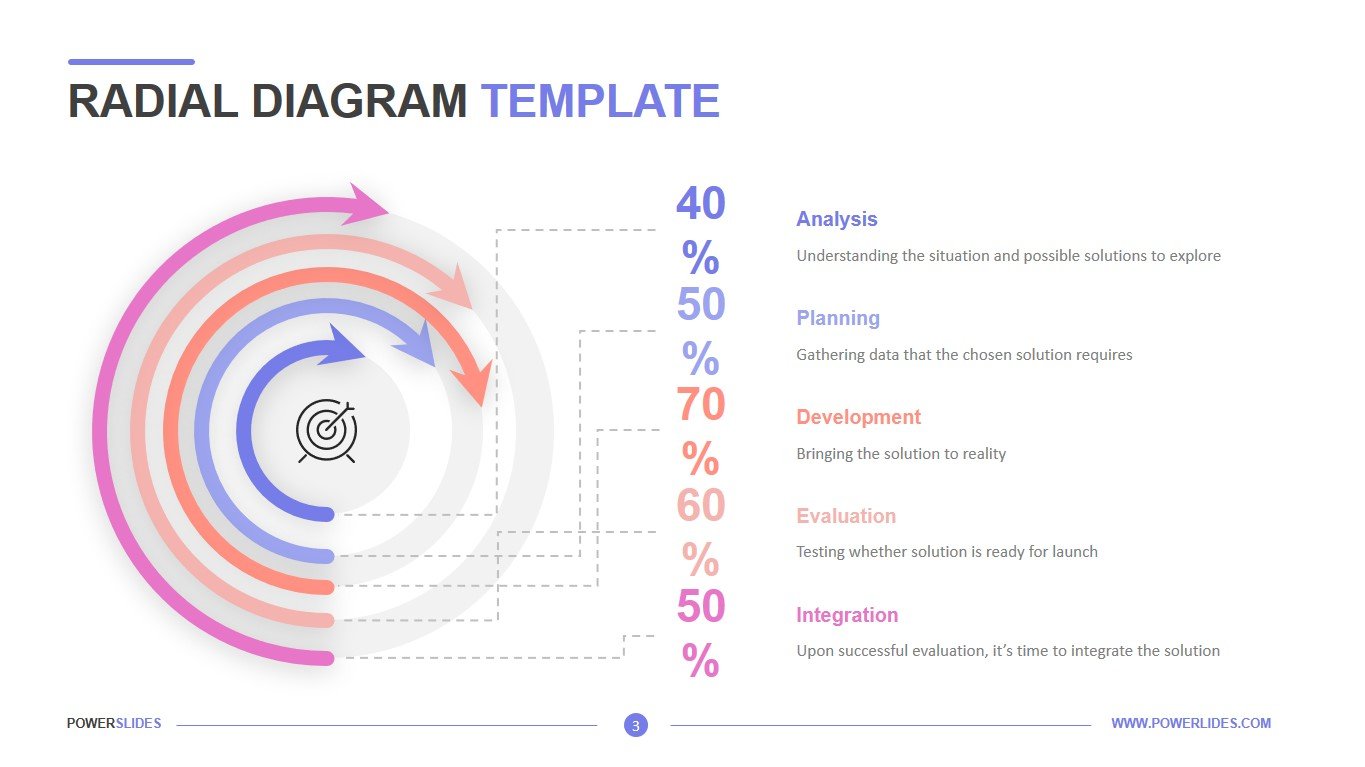
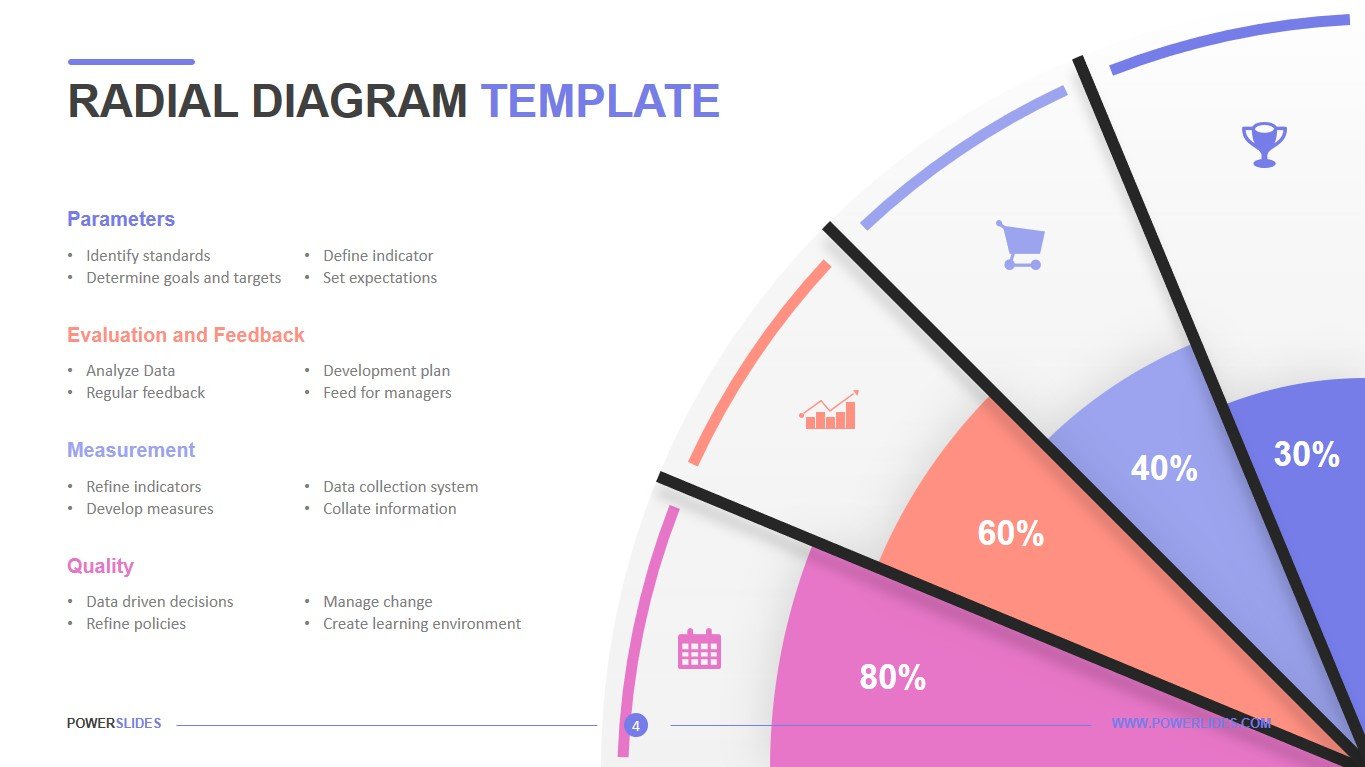
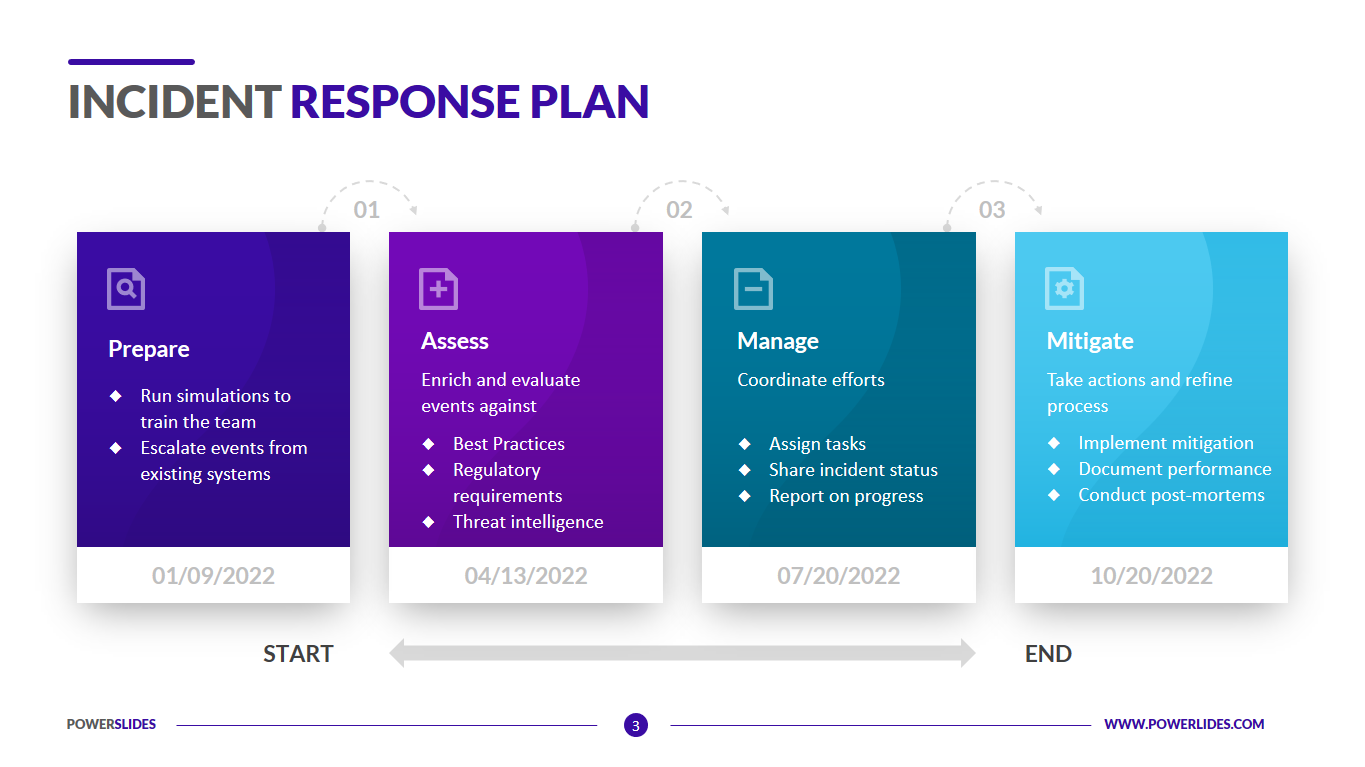
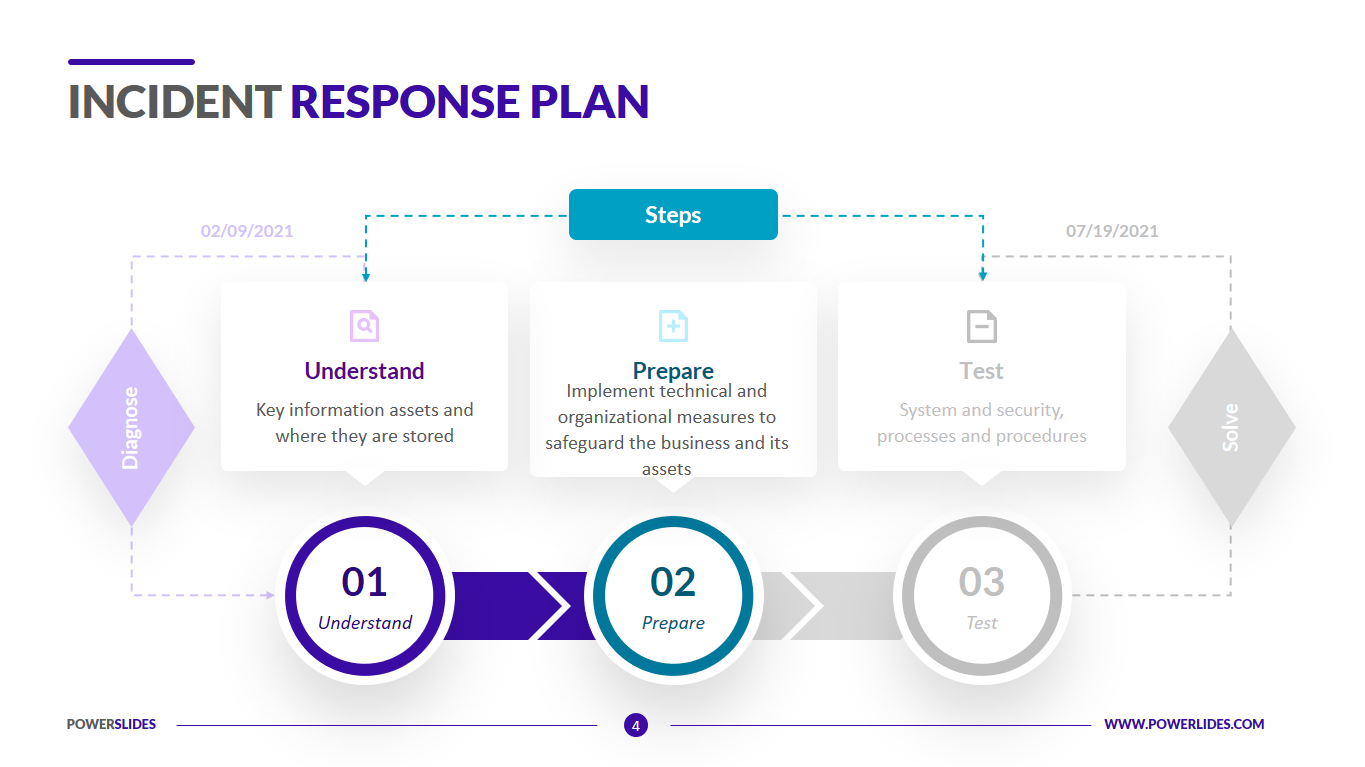
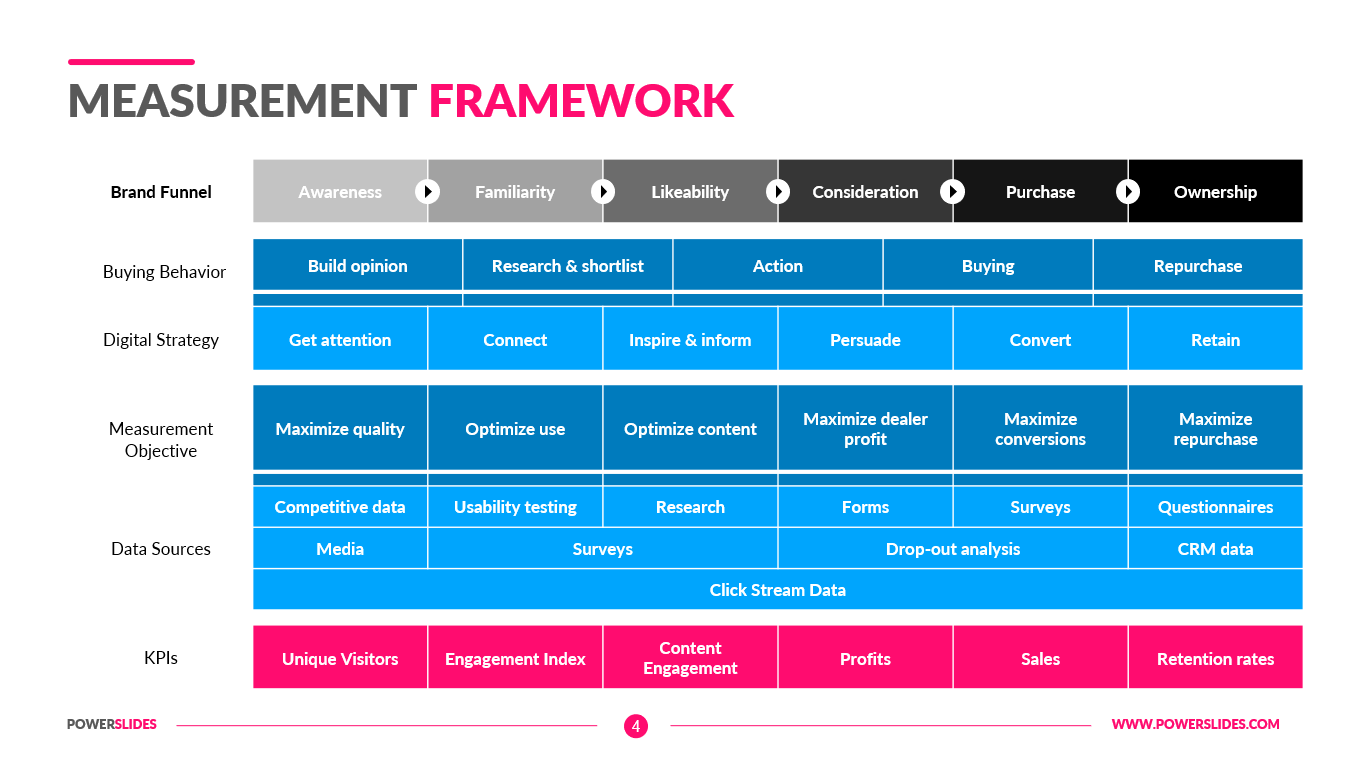
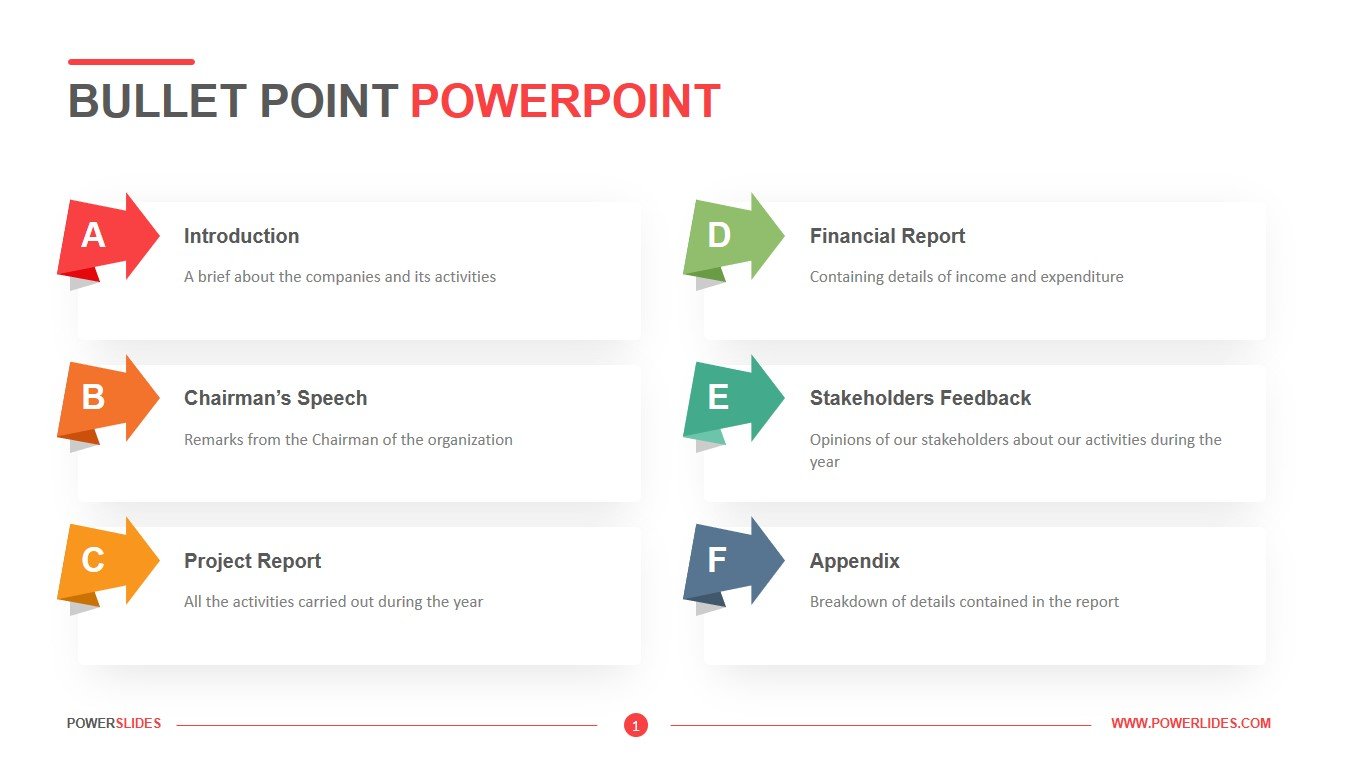
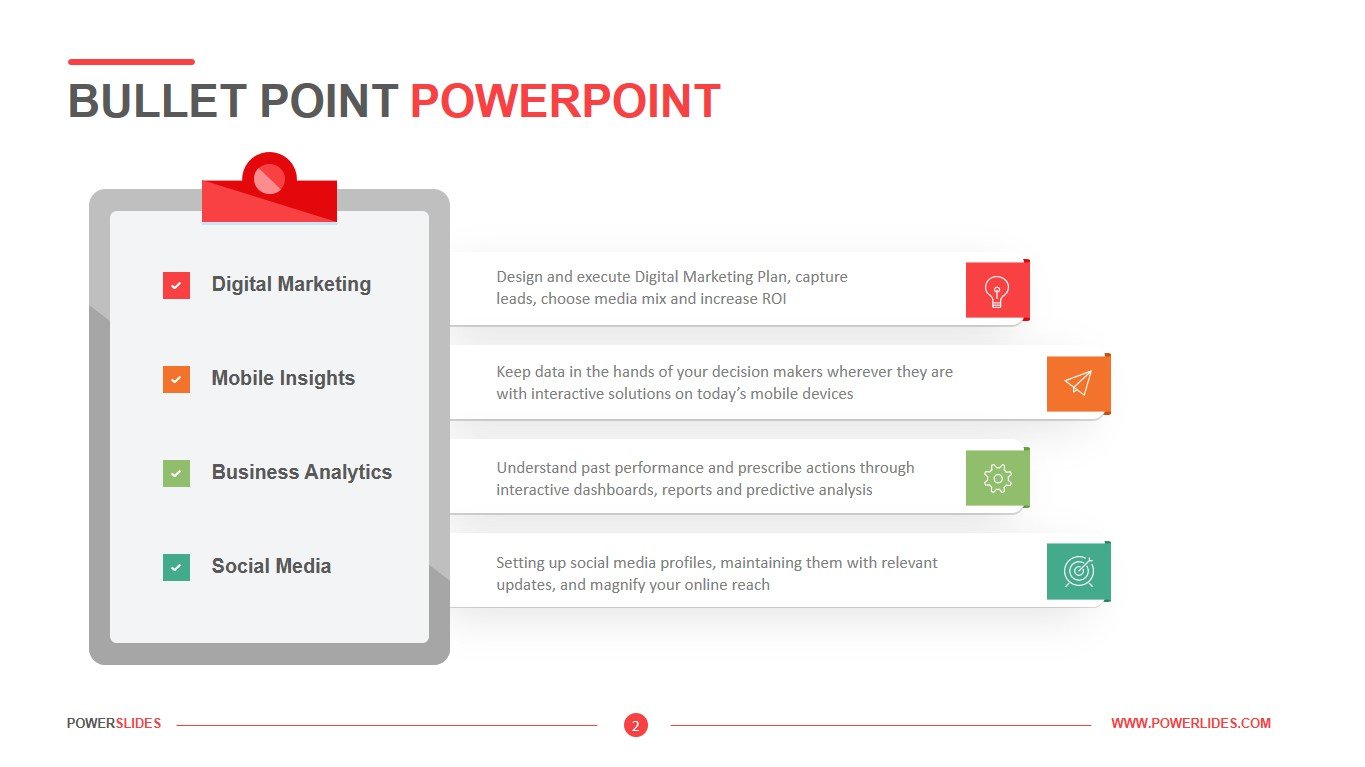
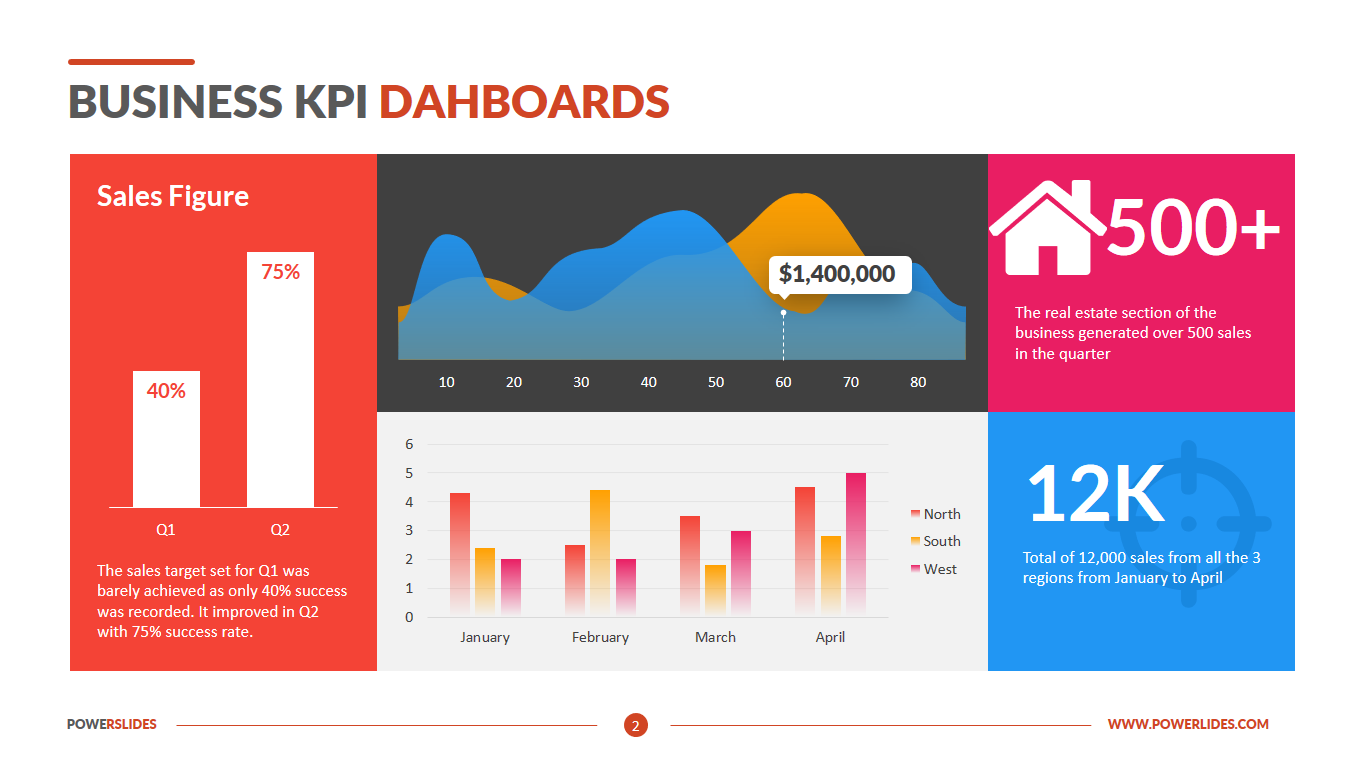
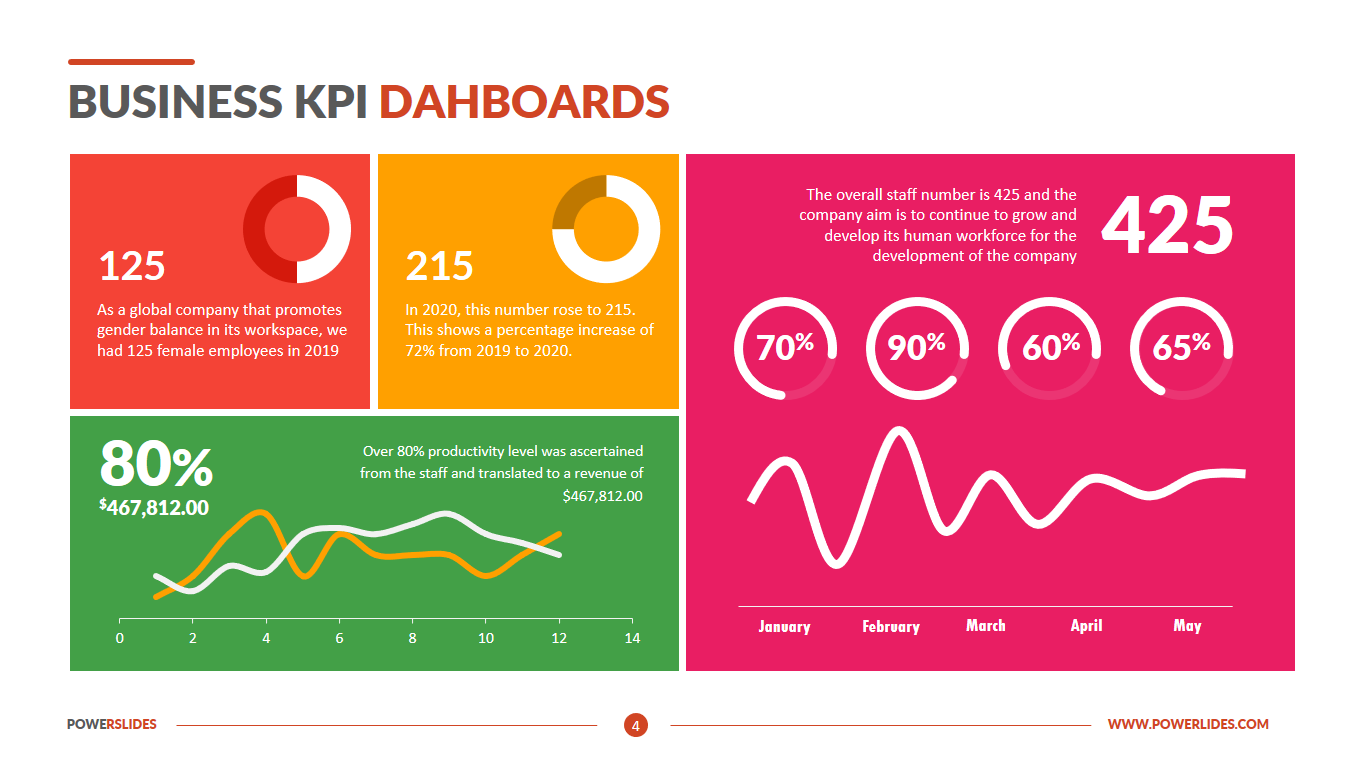
This colorful KPI dashboard template comes in five design variations – each presenting a creative approach to articulating your long-term business strategy and short-term activities. You can customize this template for your unique overarching objectives, measures and key performance indicators, targets for your KPIs, and the initiatives that can help you reach your targets.
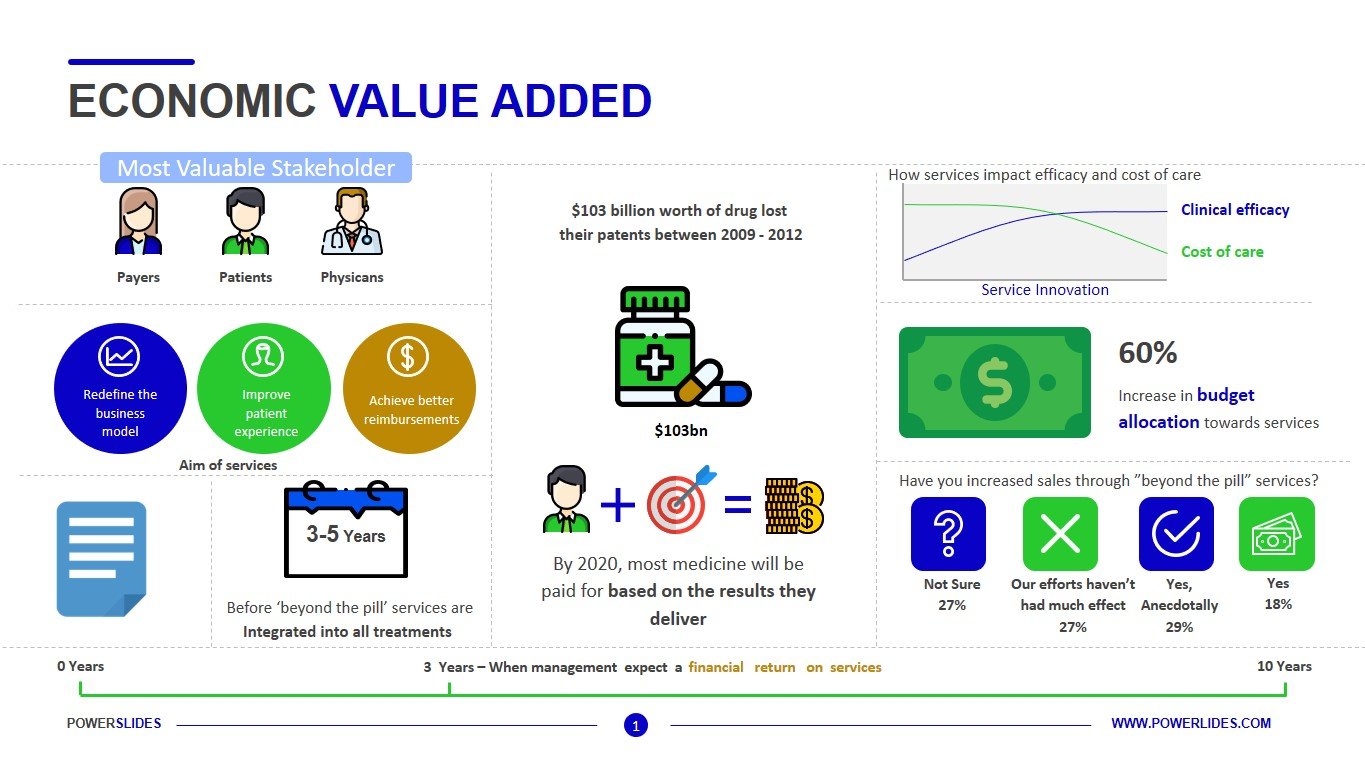
Regardless of whether you use Tableau, QlikView, SAP or Oracle BI, you can apply this KPI dashboard to display results related to: customer base, sales, bottom line increases and employee engagement. Ideal for strategists, team leads, and business owners, this template is 100% editable. Icons, colors and text can be customized to meet your unique business needs. Business KPI Dahboards template will organically complement your old presentations and will take its rightful place in your collection of professional templates.


