Comparison Bar Charts
What do you think of this template?


 (3.50/ 5)
14 ratings

 4 Slides
 File size: 16:9
 Fonts: Lato, Calibri
 Supported version
PPT 2010, PPT 2013, PPT 2016
Supported version
PPT 2010, PPT 2013, PPT 2016

Product details
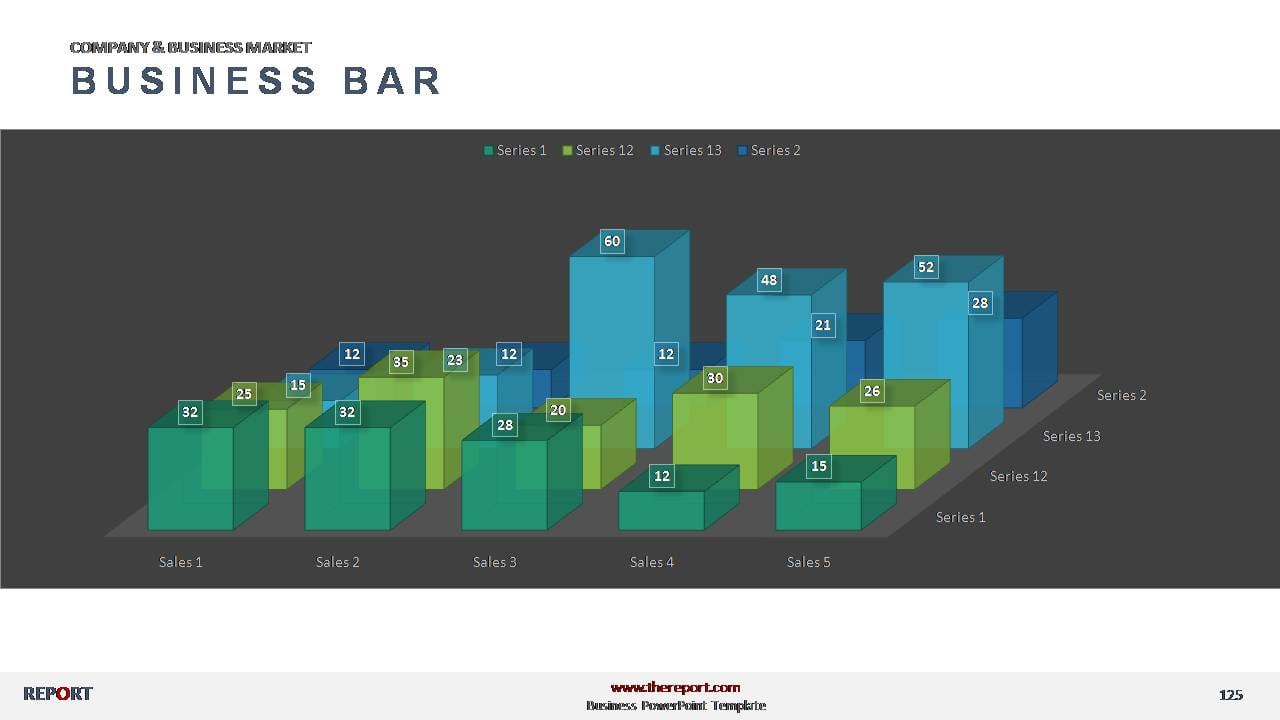
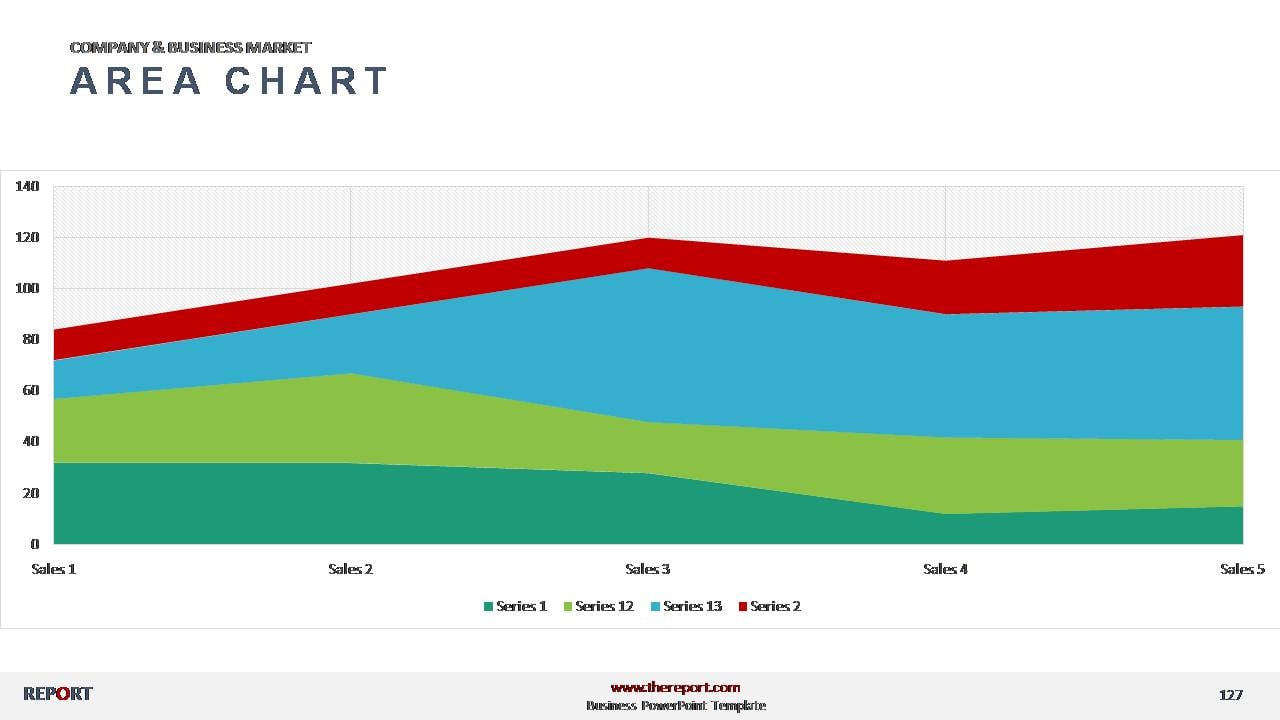
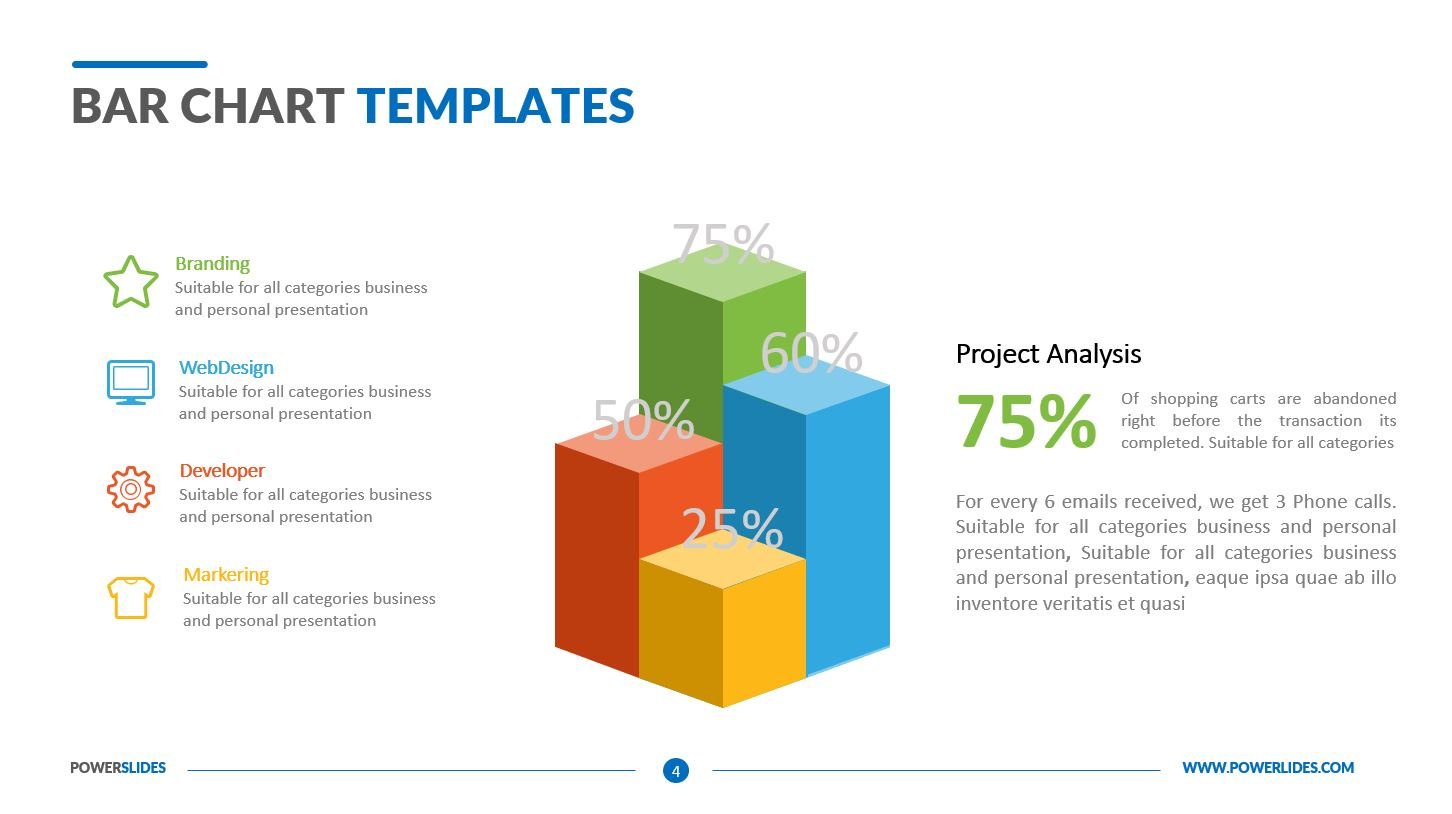
A bar chart is used when you want to show a distribution of data points or perform a comparison of metric values across different subgroups of your data. From a bar chart, we can see which groups are highest or most common, and how other groups compare against the others. Since this is a fairly common task, bar charts are a fairly ubiquitous chart type.
The primary variable of a bar chart is its categorical variable. A categorical variable takes discrete values, which can be thought of as labels. The secondary variable’s values determine the length of each bar. These values can come from a great variety of sources. In its simplest form, the values may be a simple frequency count or proportion for how much of the data is divided into each category – not an actual data feature at all.
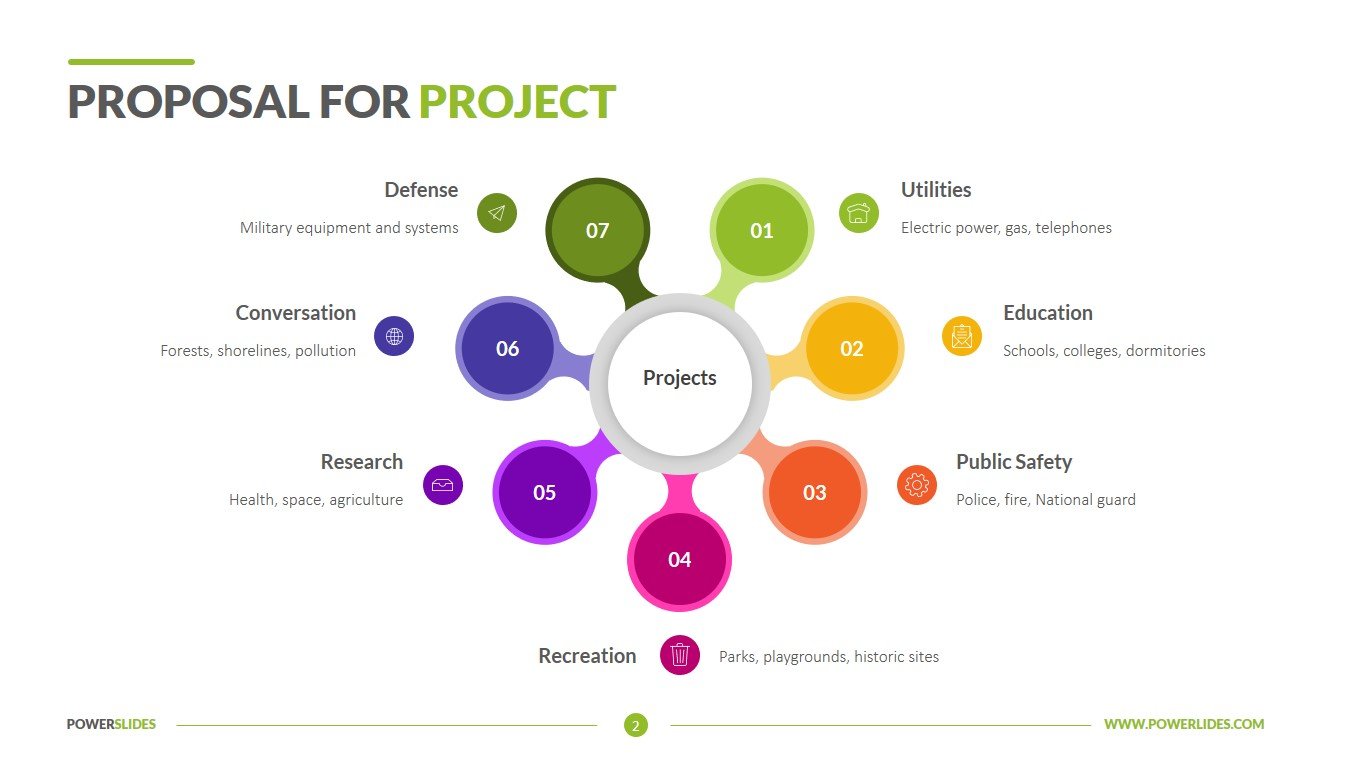
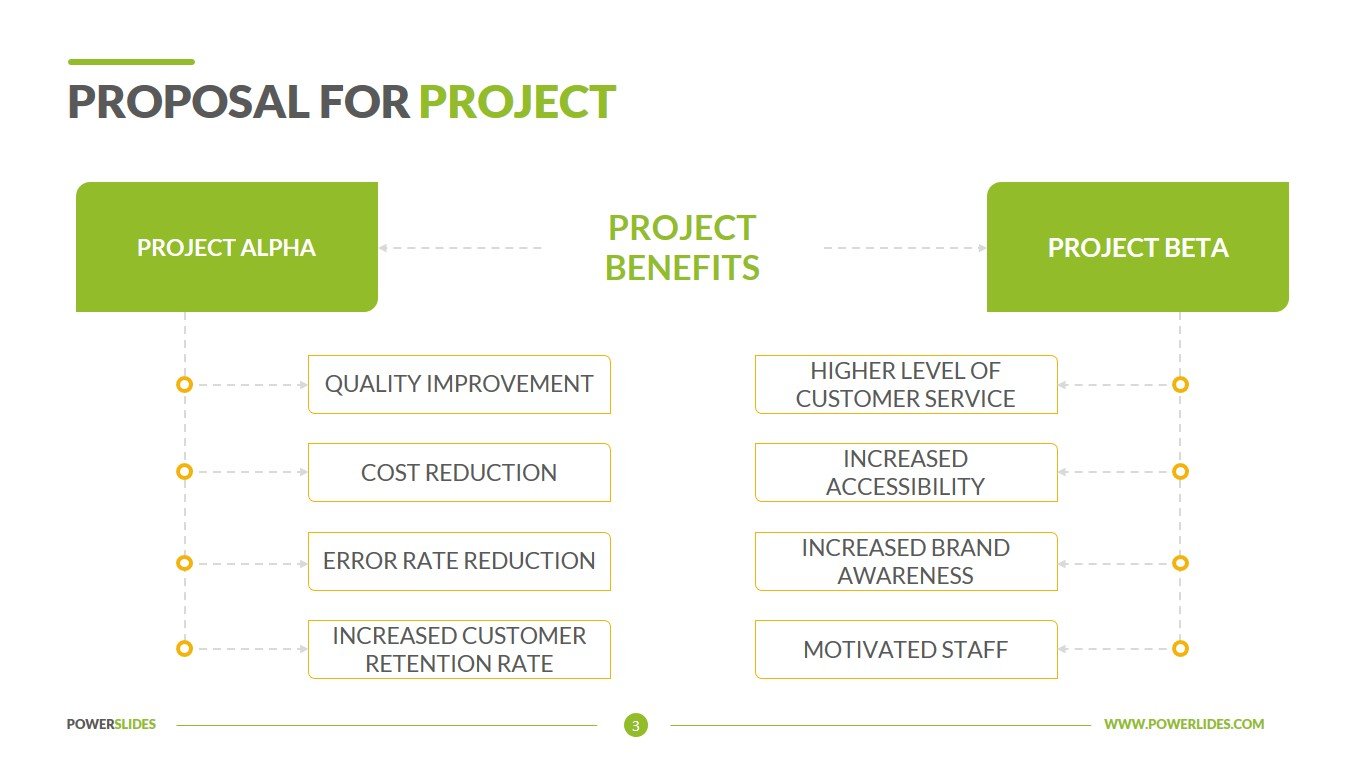
This comparison bar charts template consists of 4 slides. With a core purpose of representing data/product growth in the market. All of these templates are completely customizable meaning that you can utilize them according to your need. With applications in Business areas and Industrial Manufacturing procedures, the comparison bar chart powerpoint template also remains in use for Academic purposes.
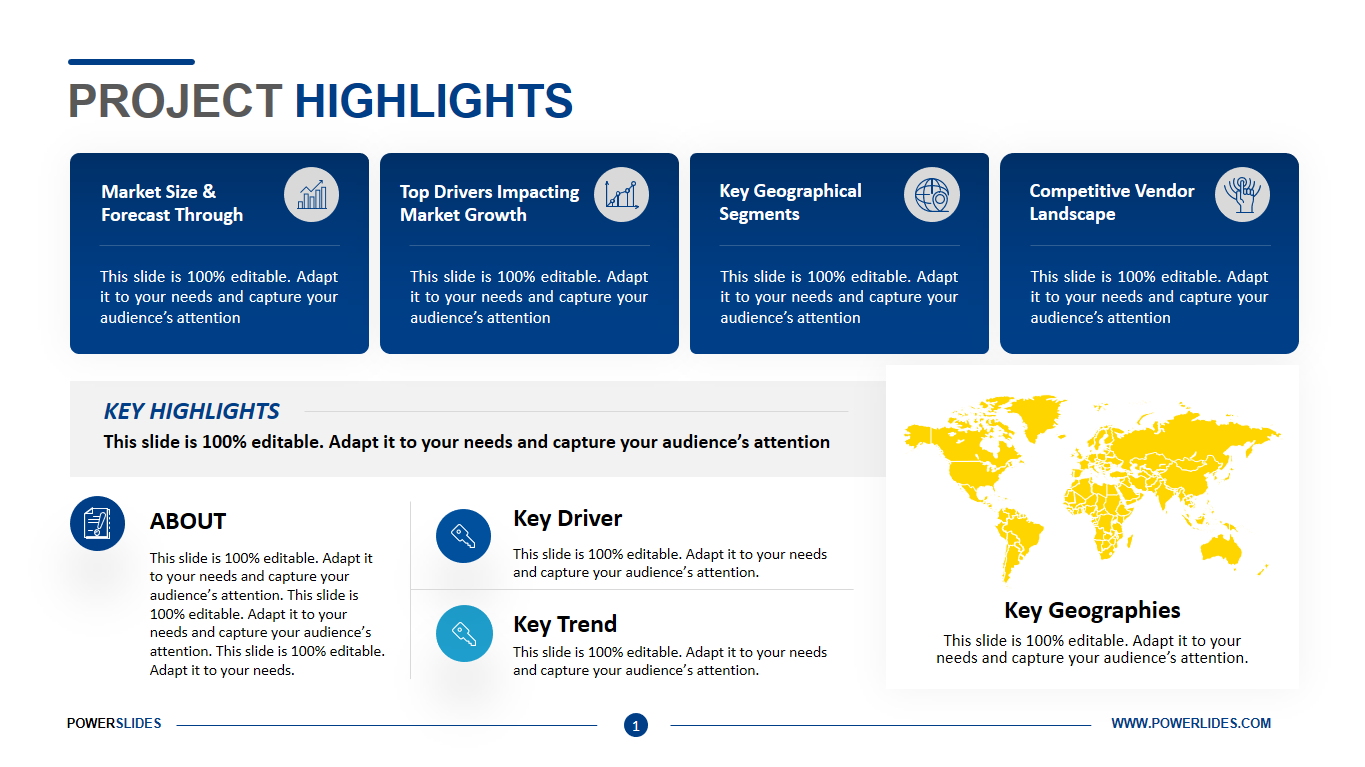
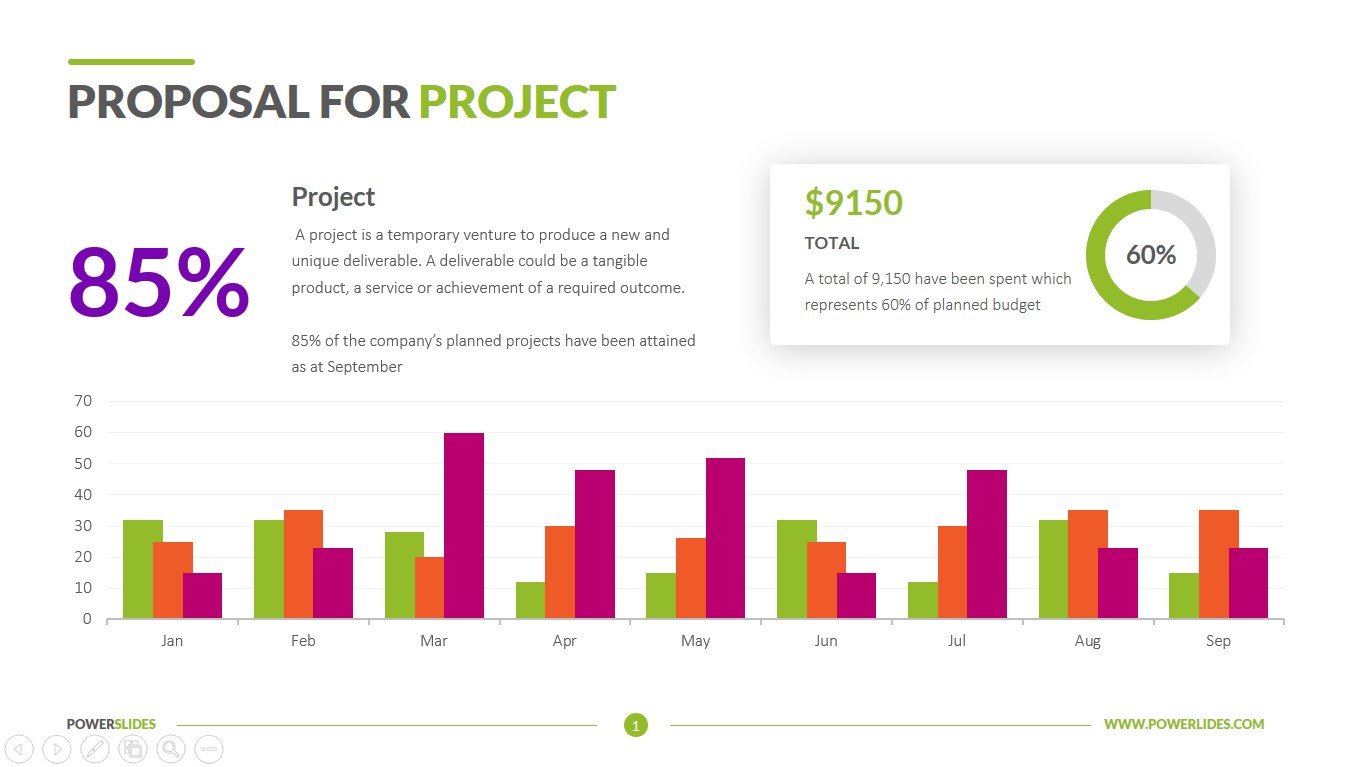
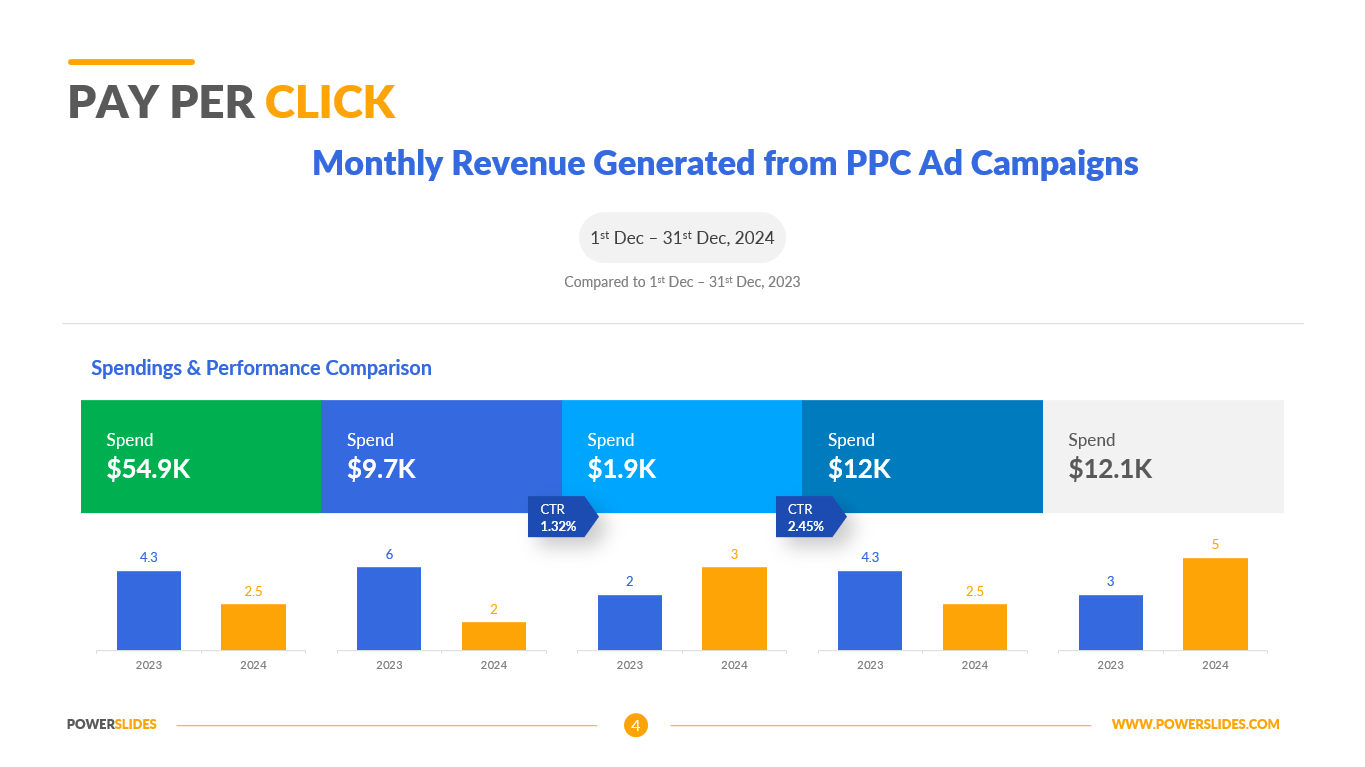
This template will be useful for financial analysts and economists. You can use this template when preparing monthly reports and financial results of the company. You can also use this template when planning your budget for the next year. You will detail the revenue data for the previous period and compare with the planned revenue amount for the next year.
Also, this template will be useful for investment companies. You can use this template when preparing financial analysis of the activities of various enterprises. The visual presentation will enable your audience to better understand the complex data of the analysis. Also, this template will be useful for heads of startups when preparing financial statements for potential investors.
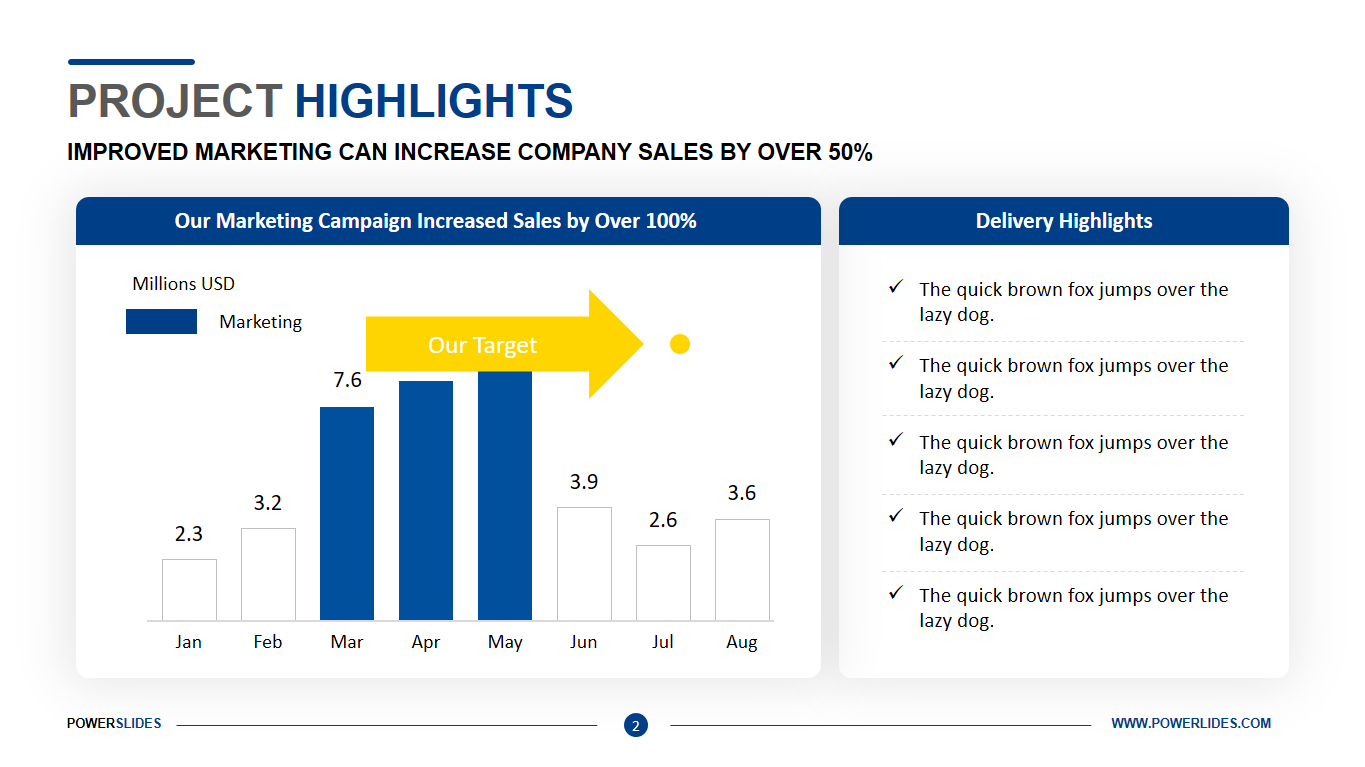
University professors can use this template to prepare their courses on financial analysis or financial planning. Marketers and advertising professionals can use this template when preparing an advertising budget for a marketing campaign.
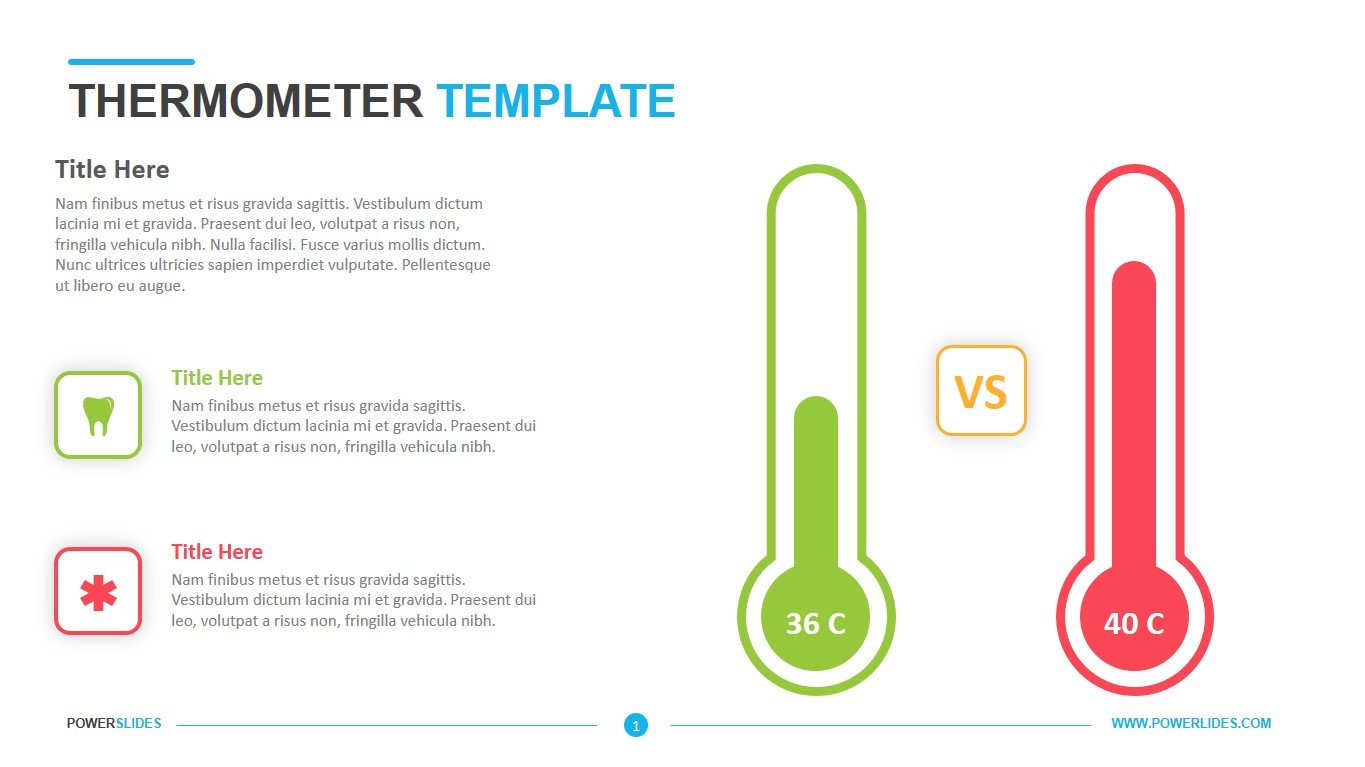
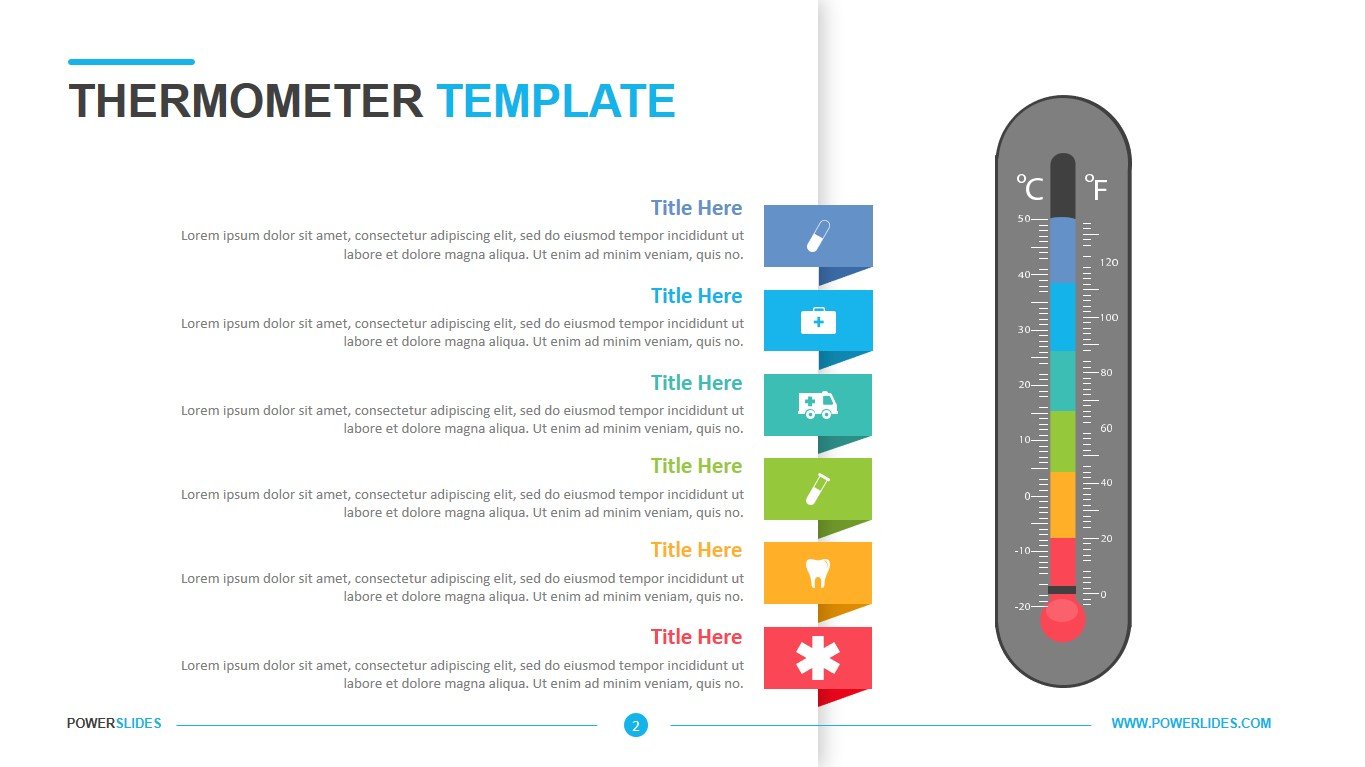
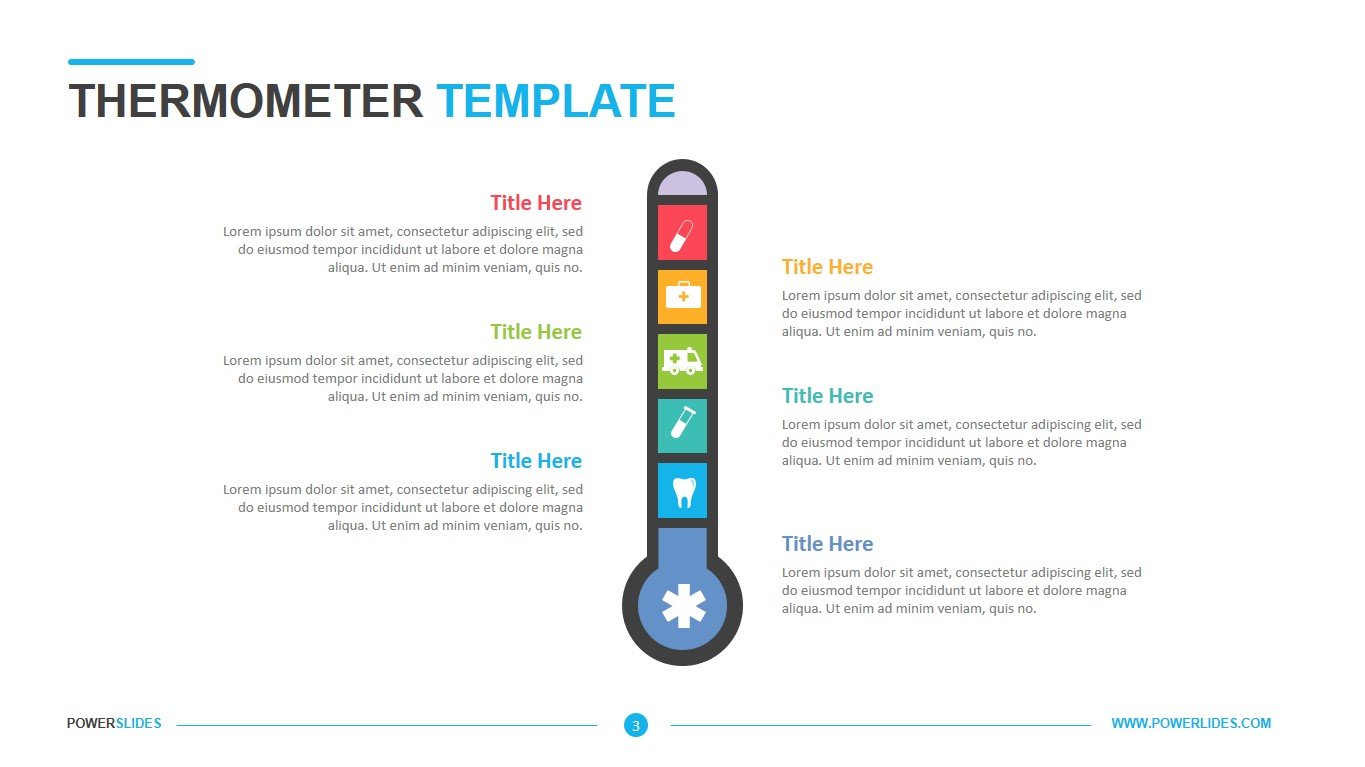
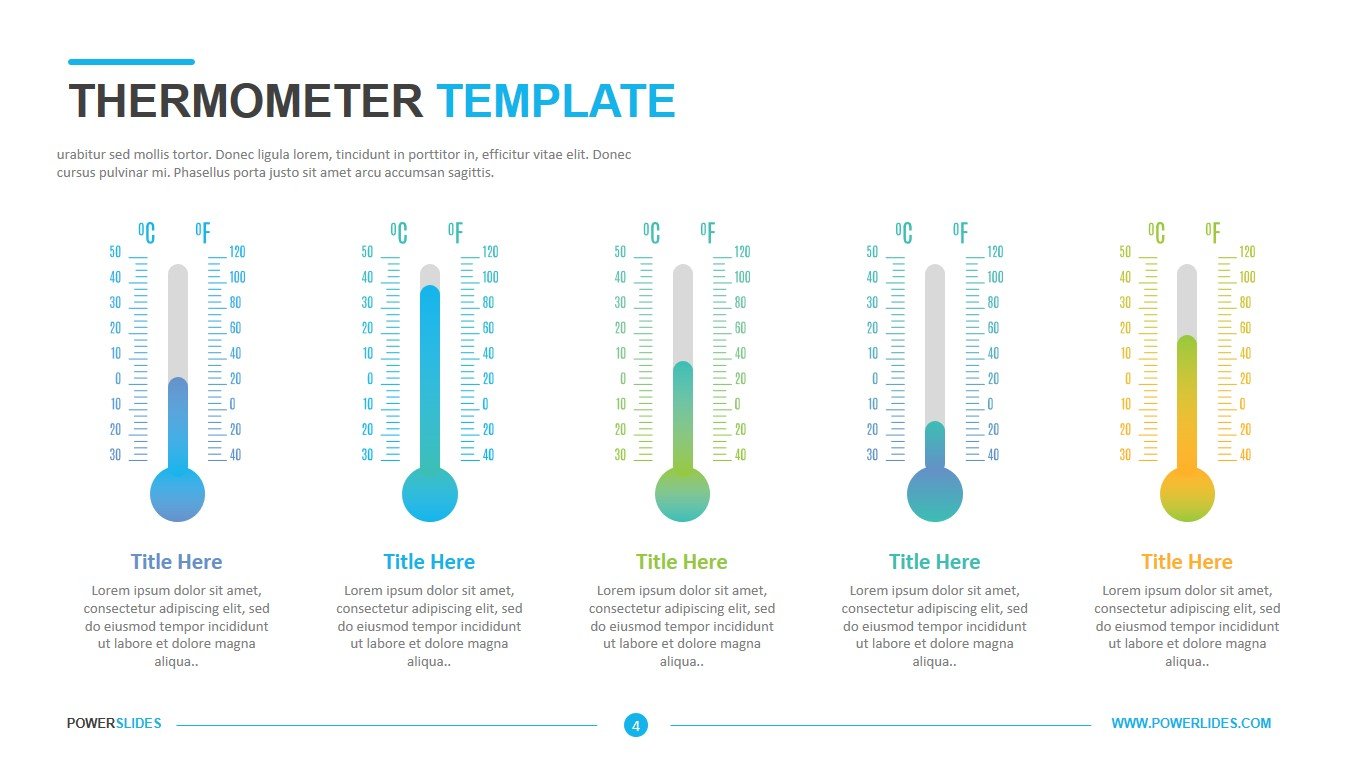
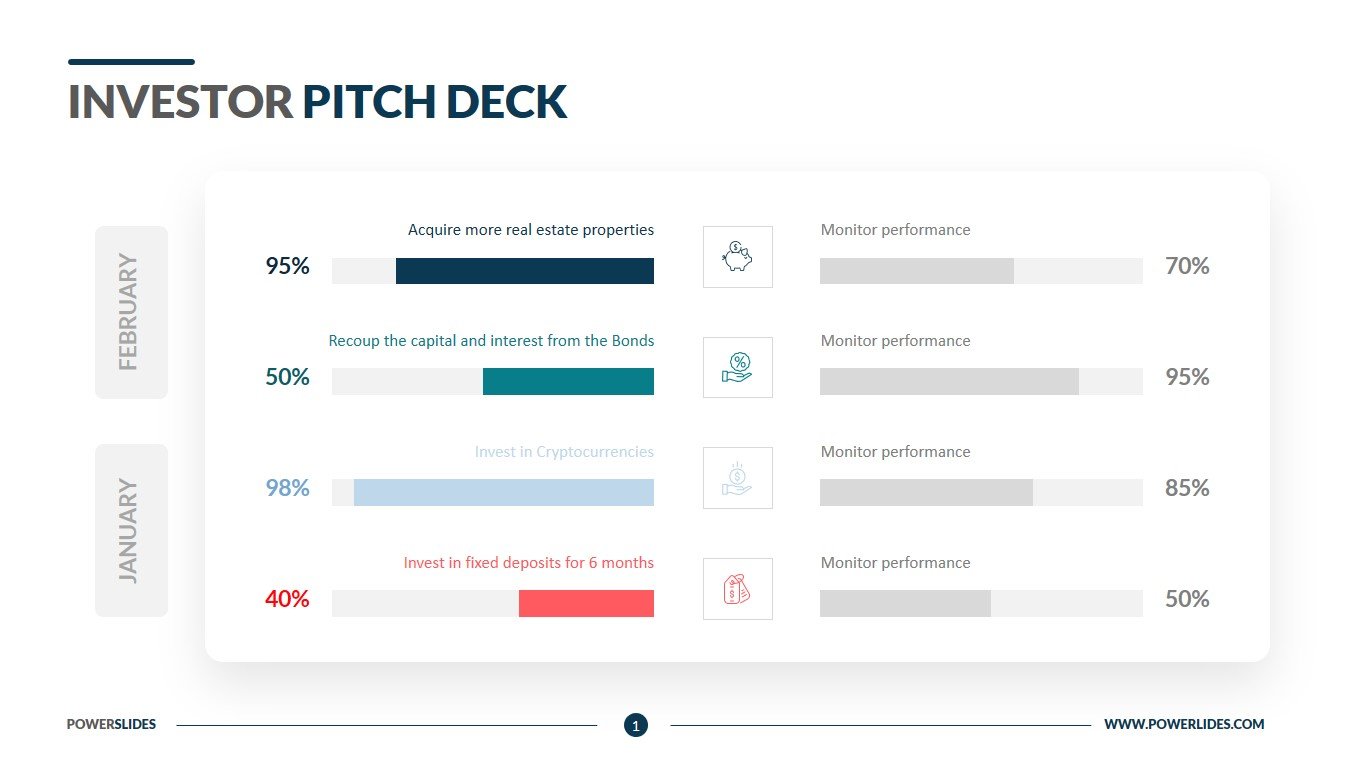
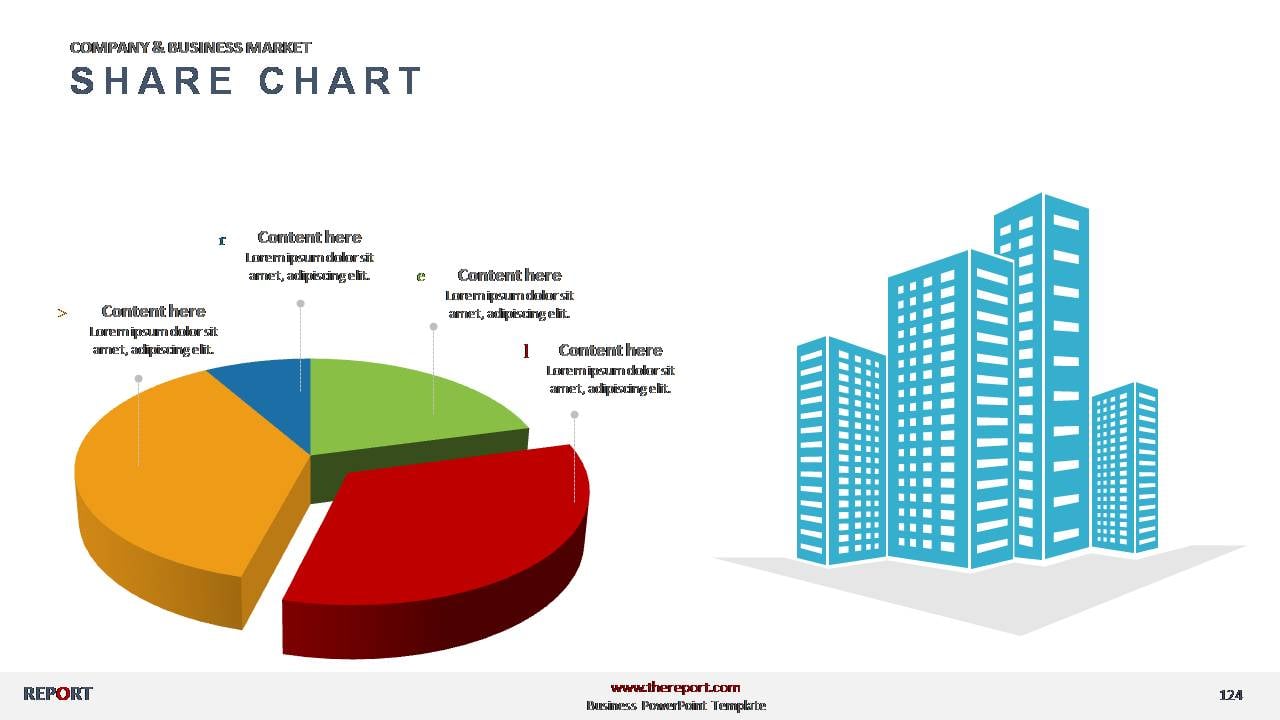
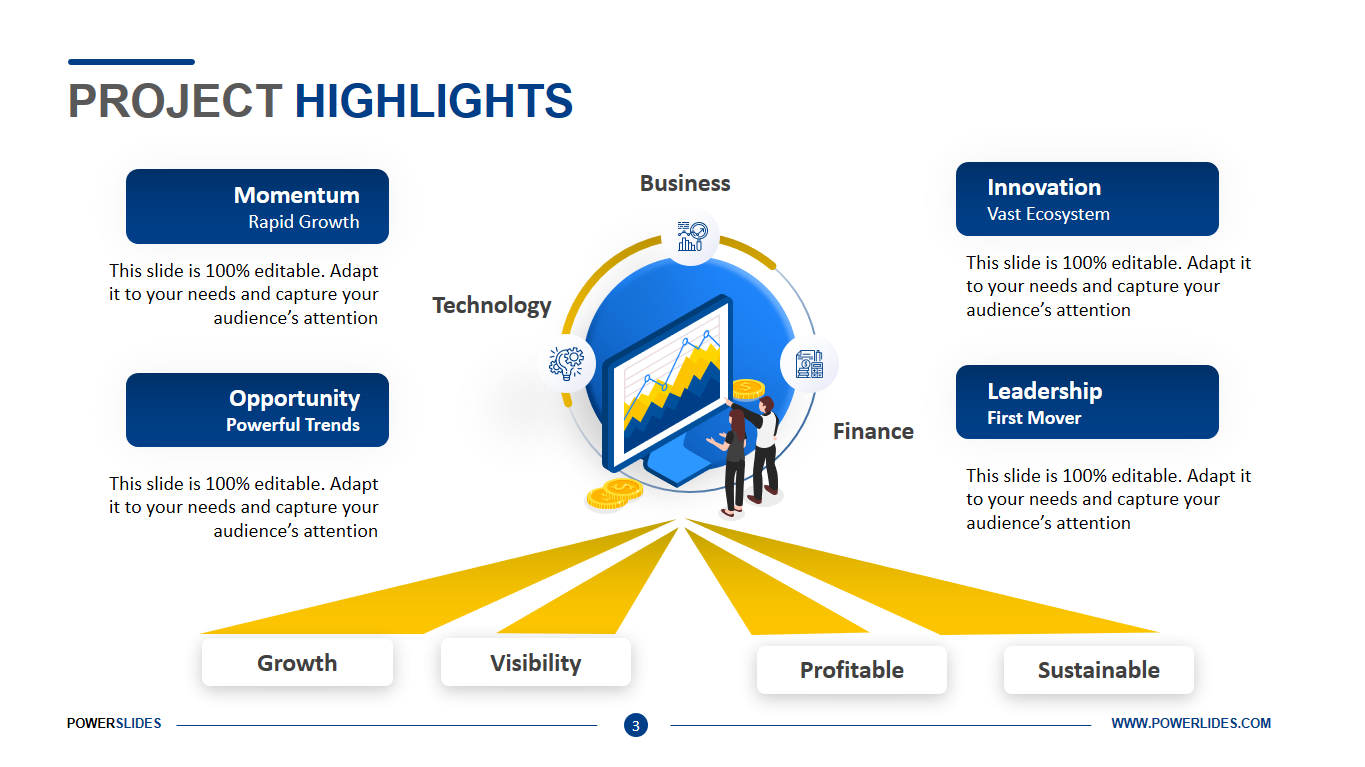
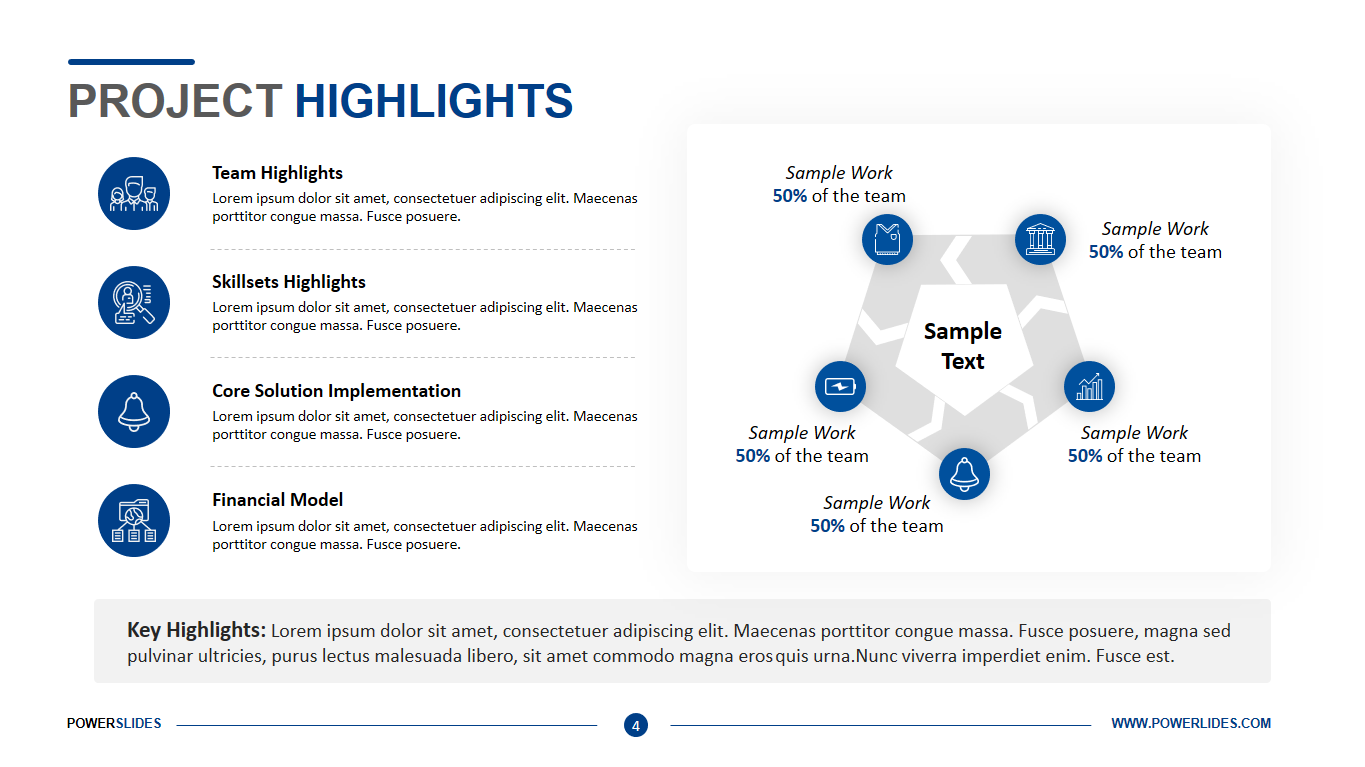
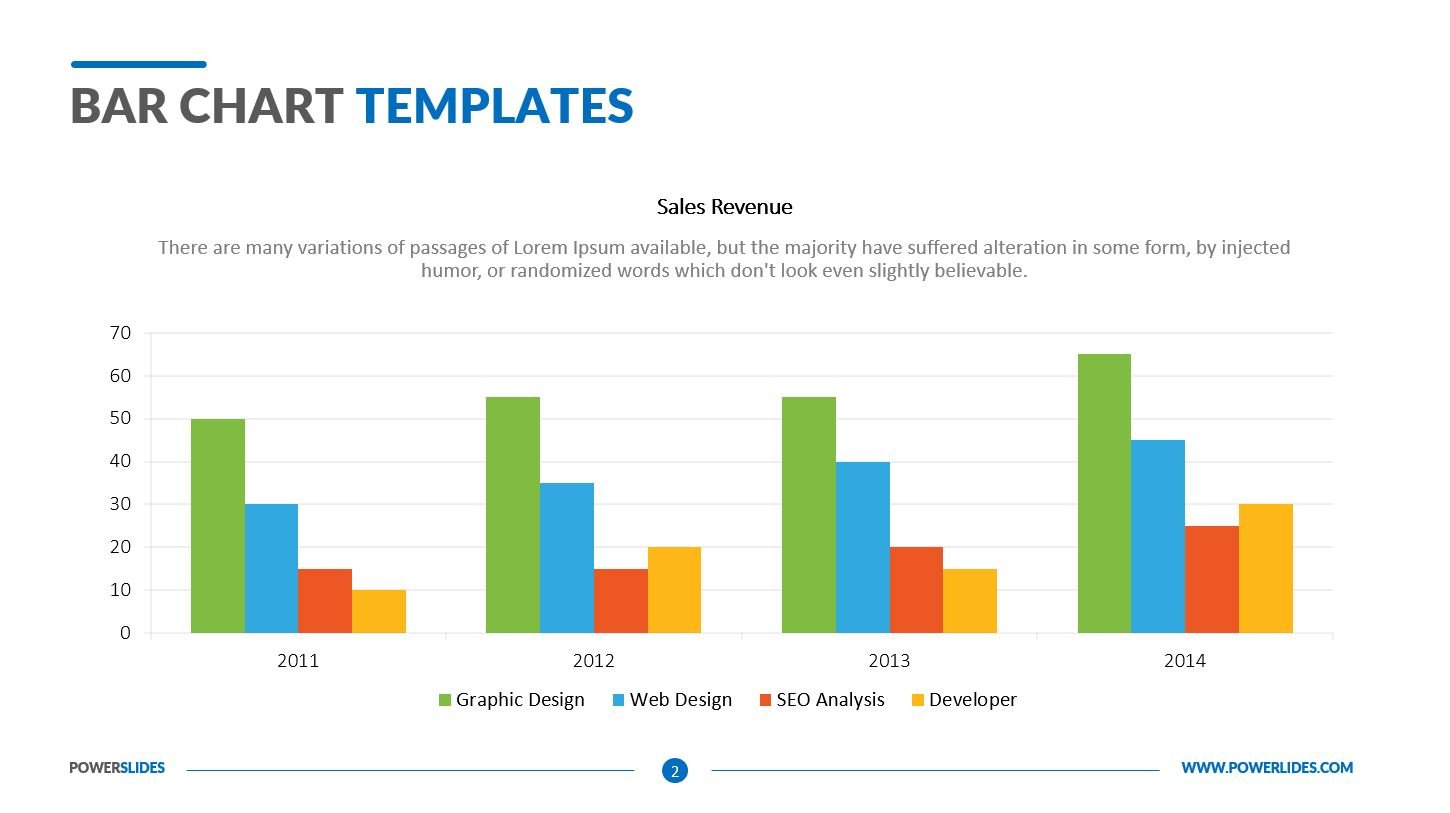
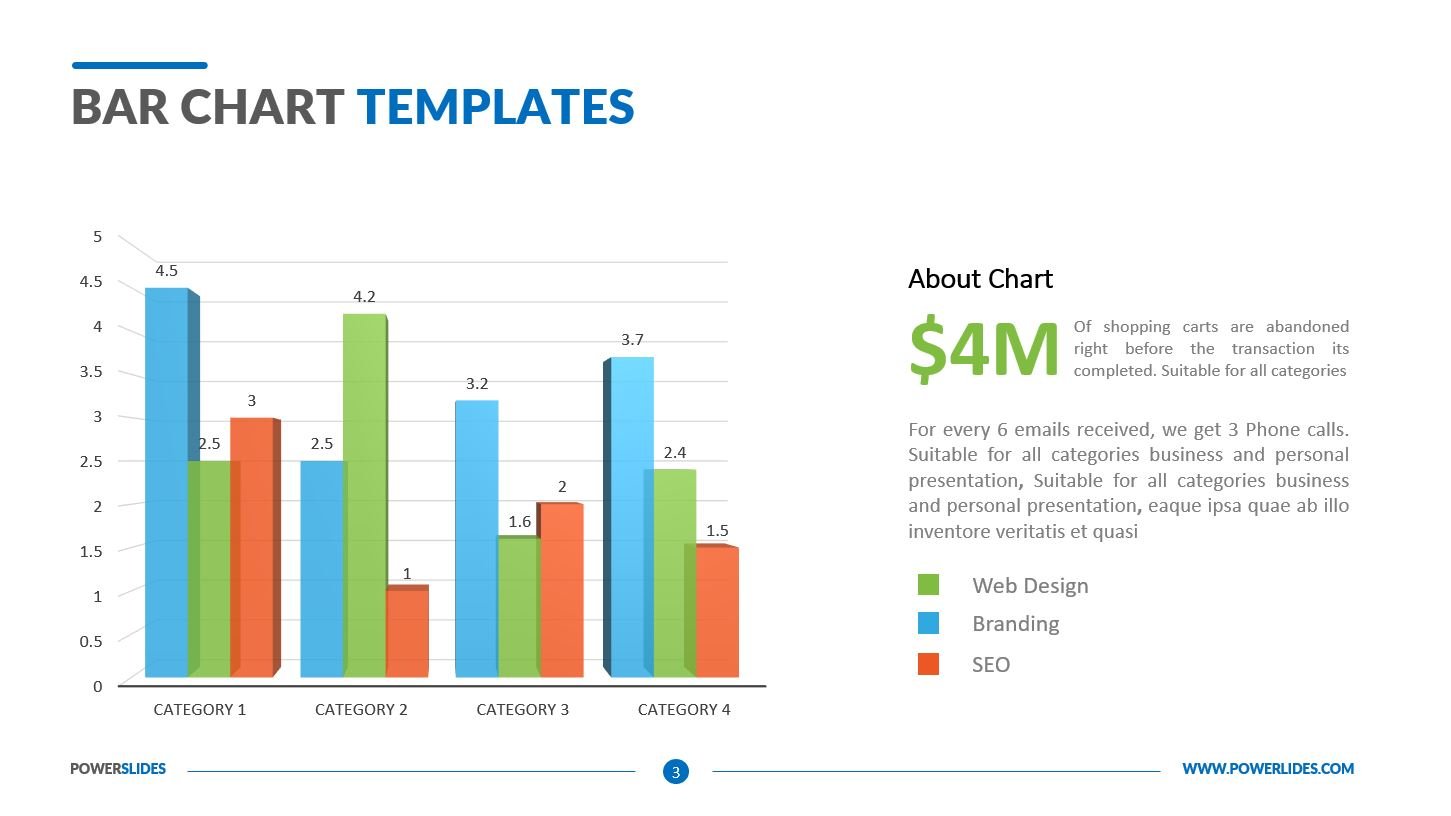
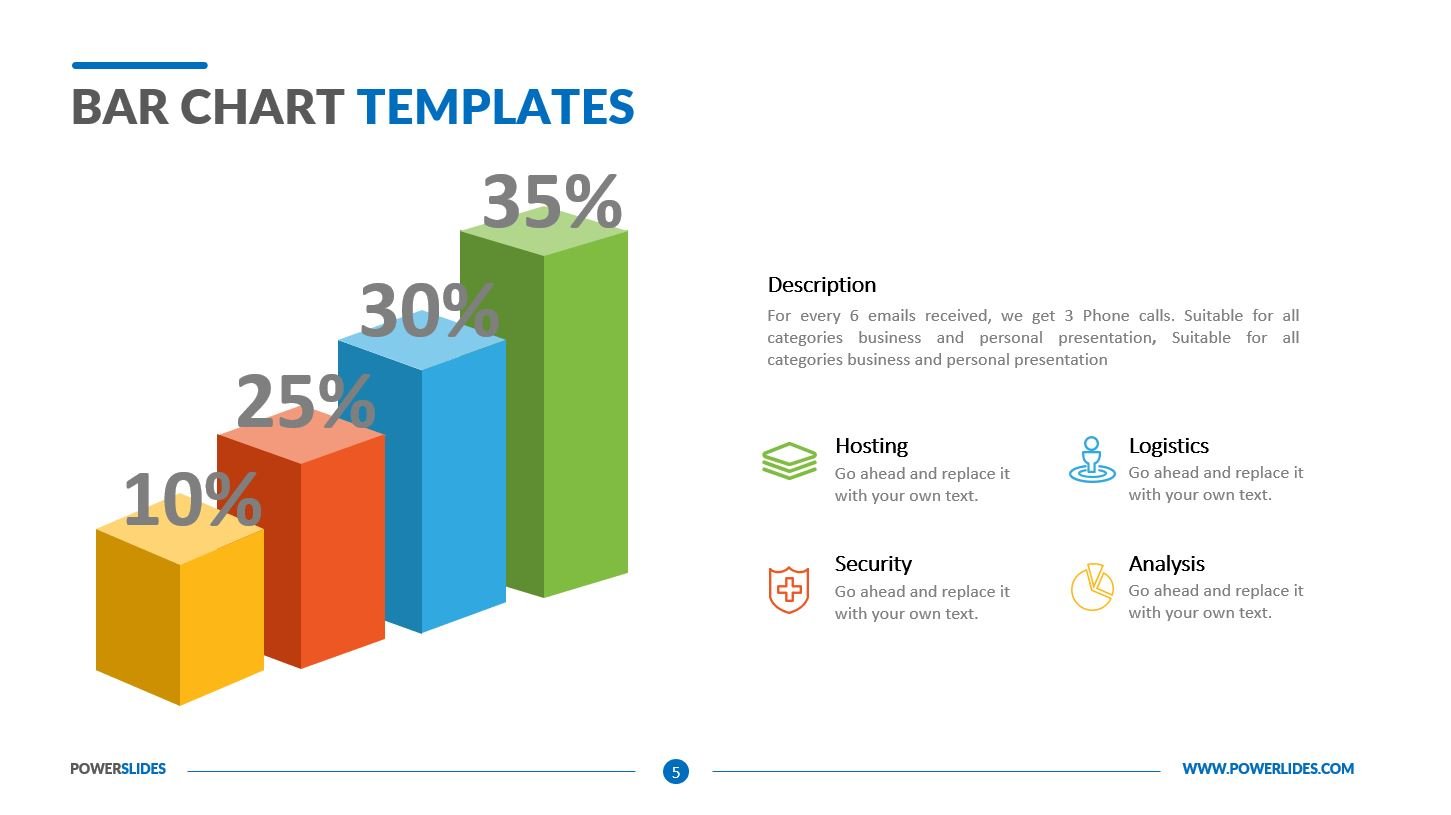
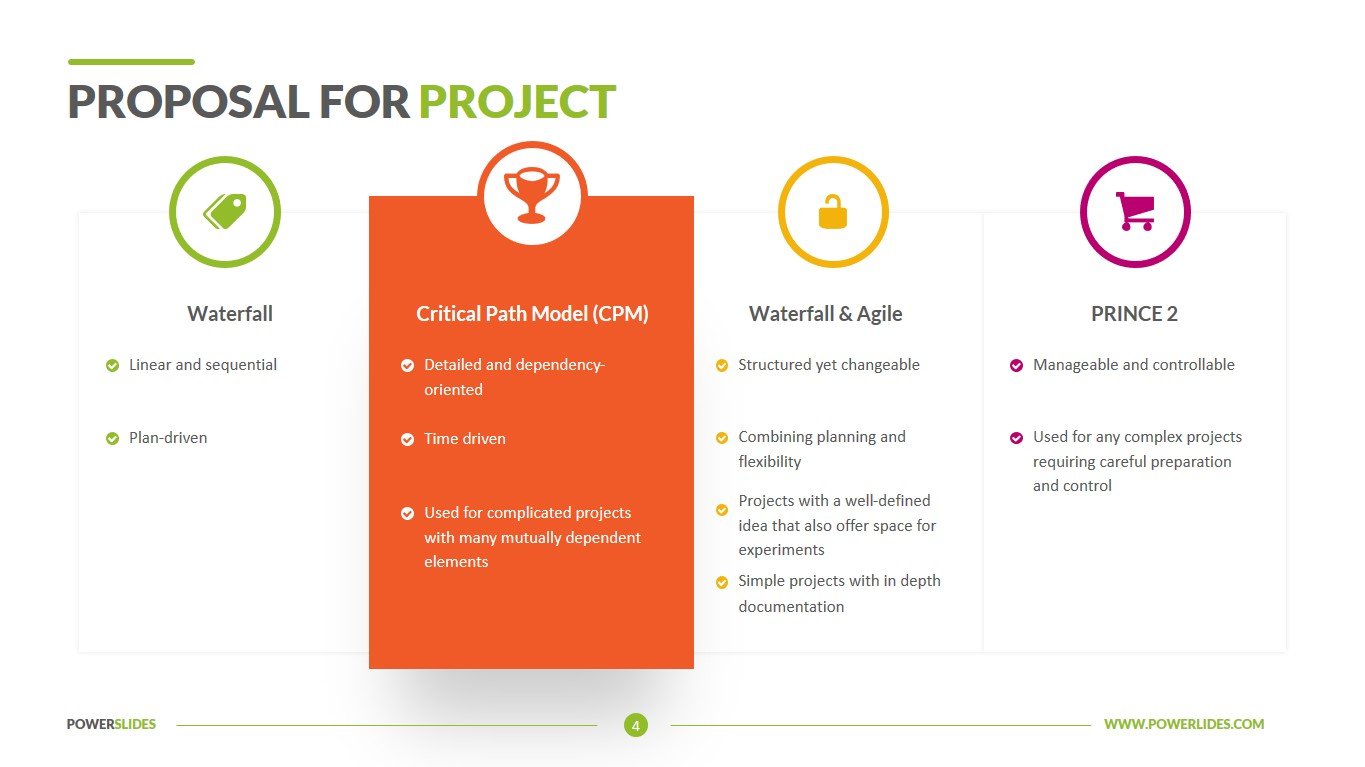
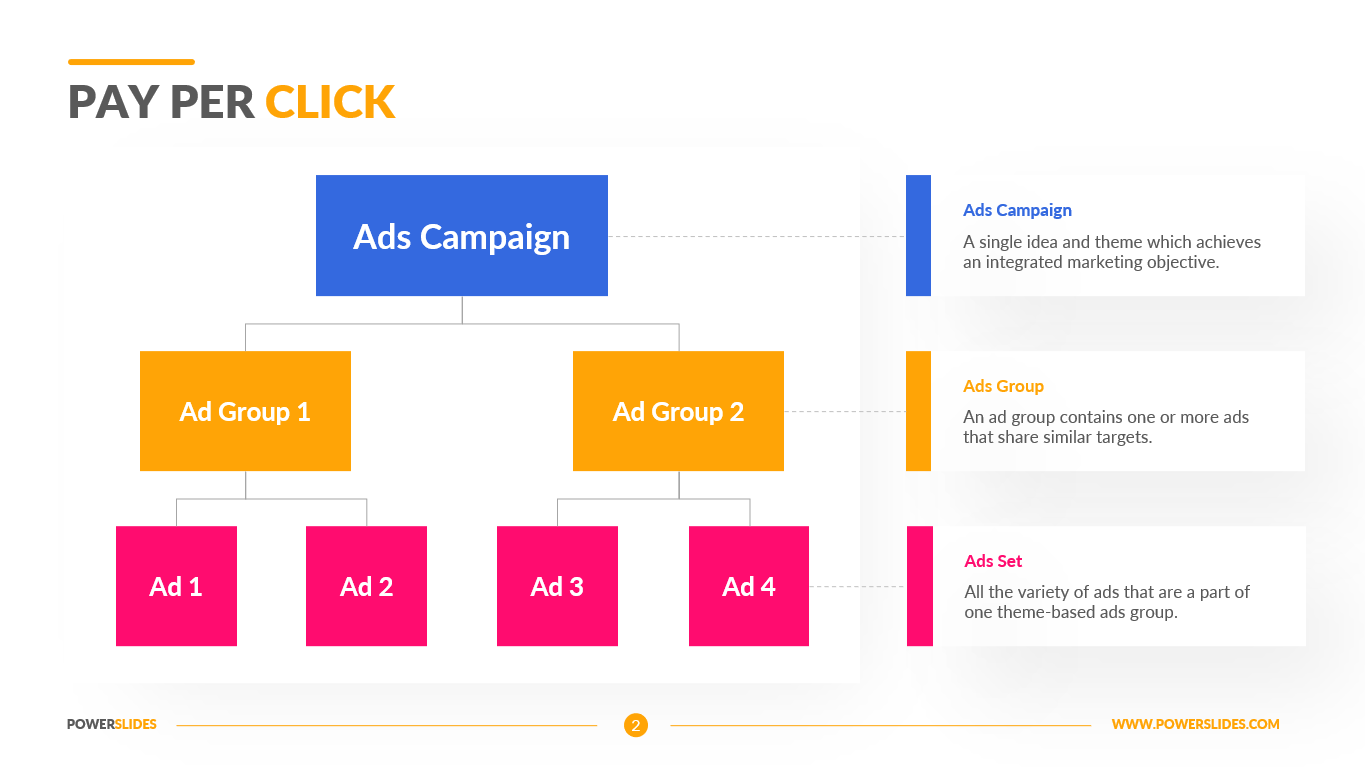
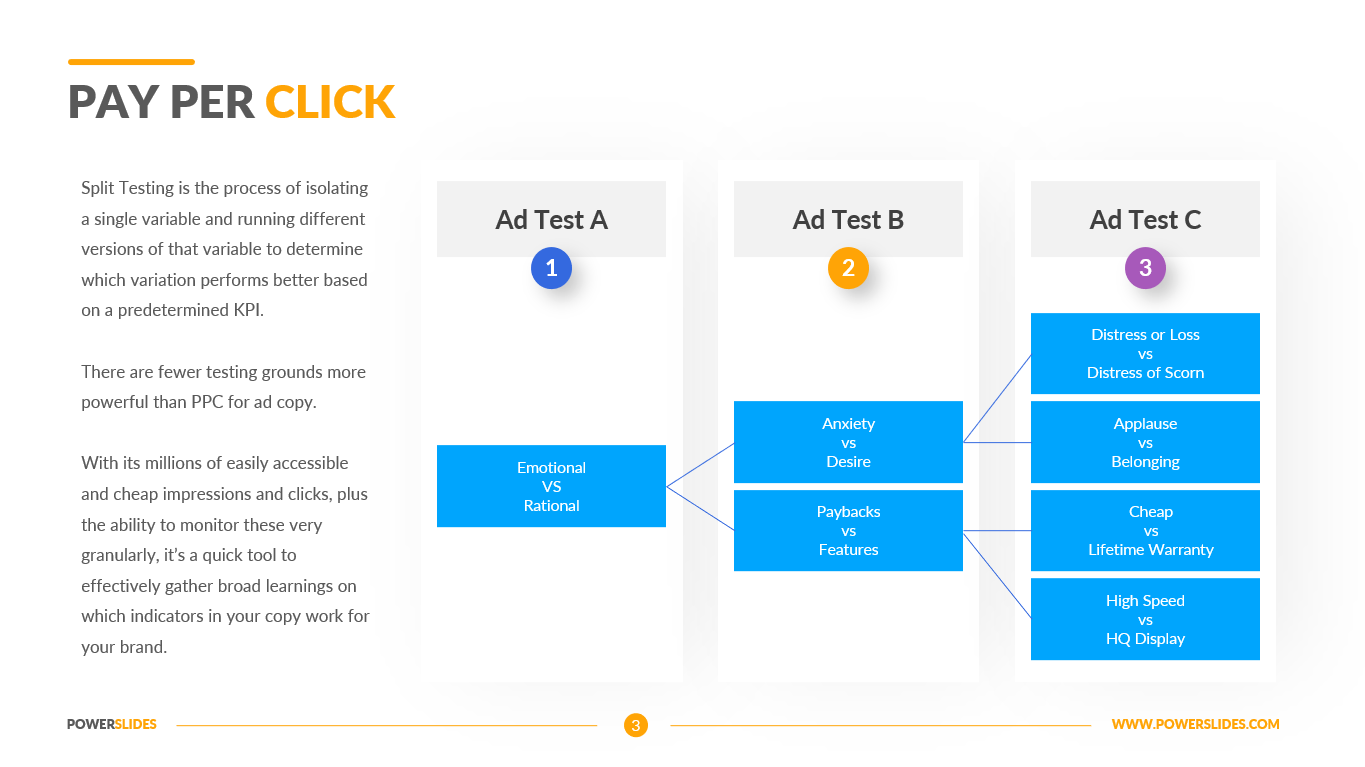
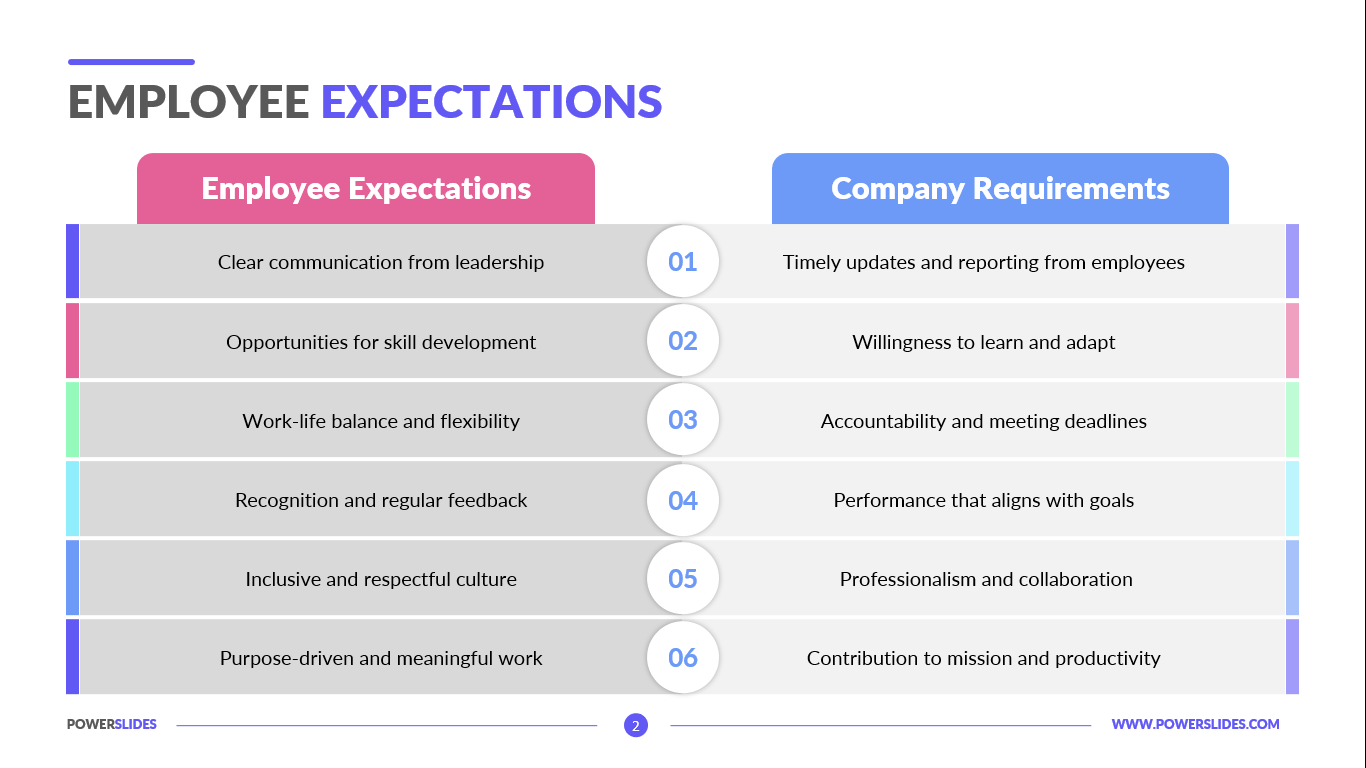
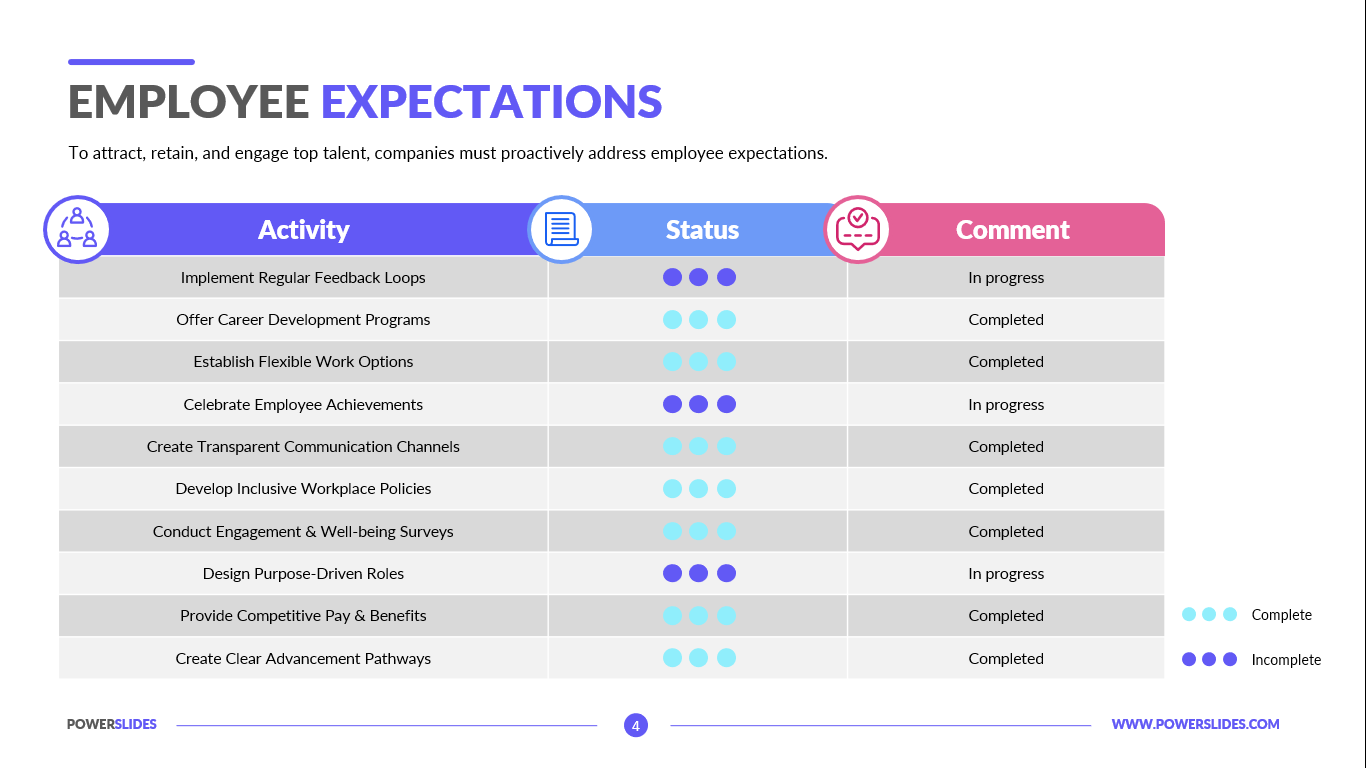
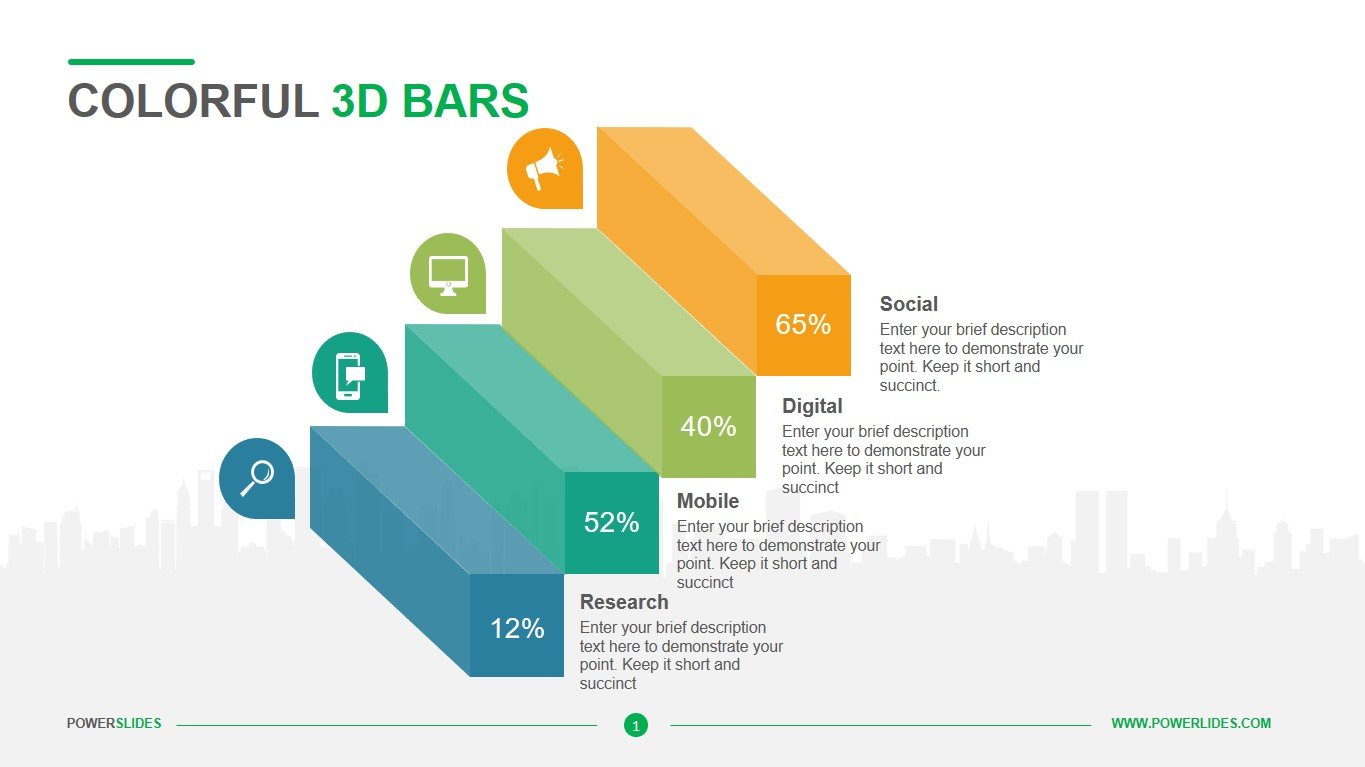
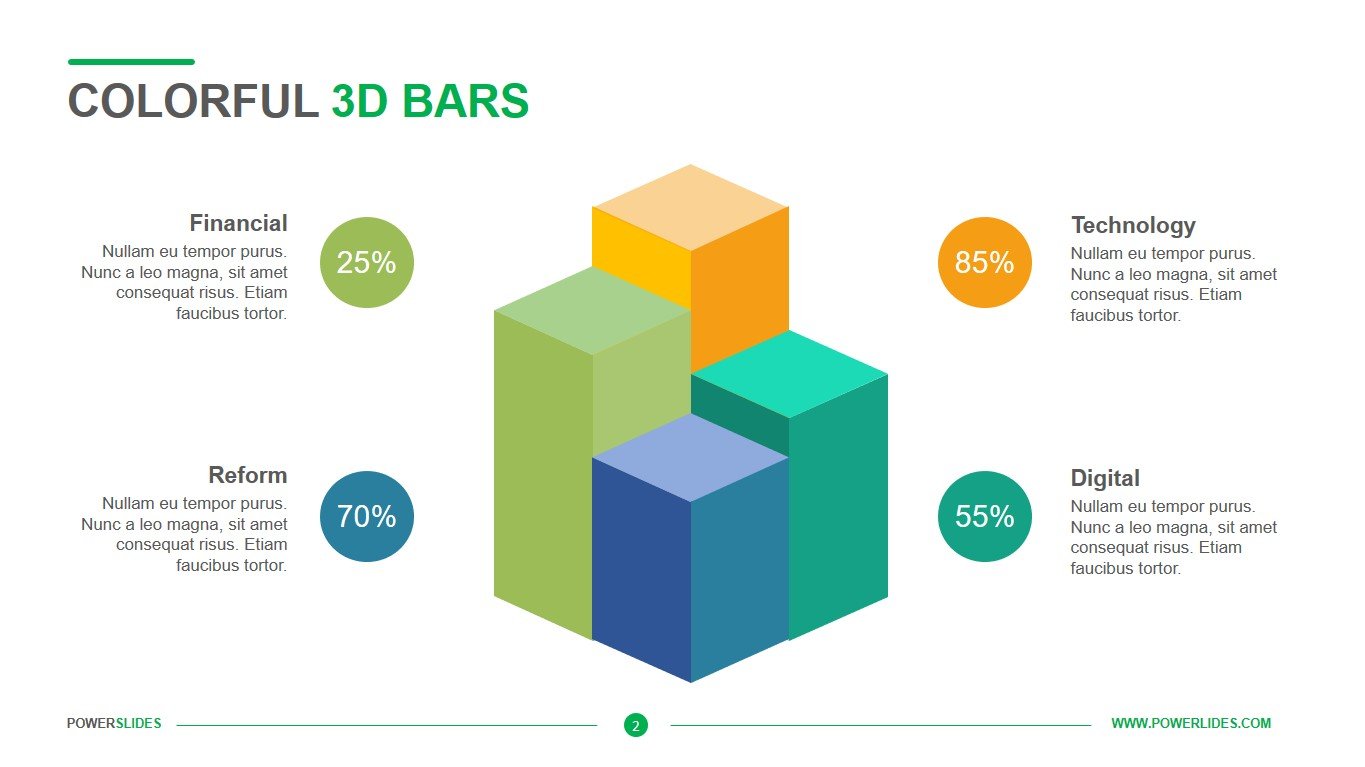
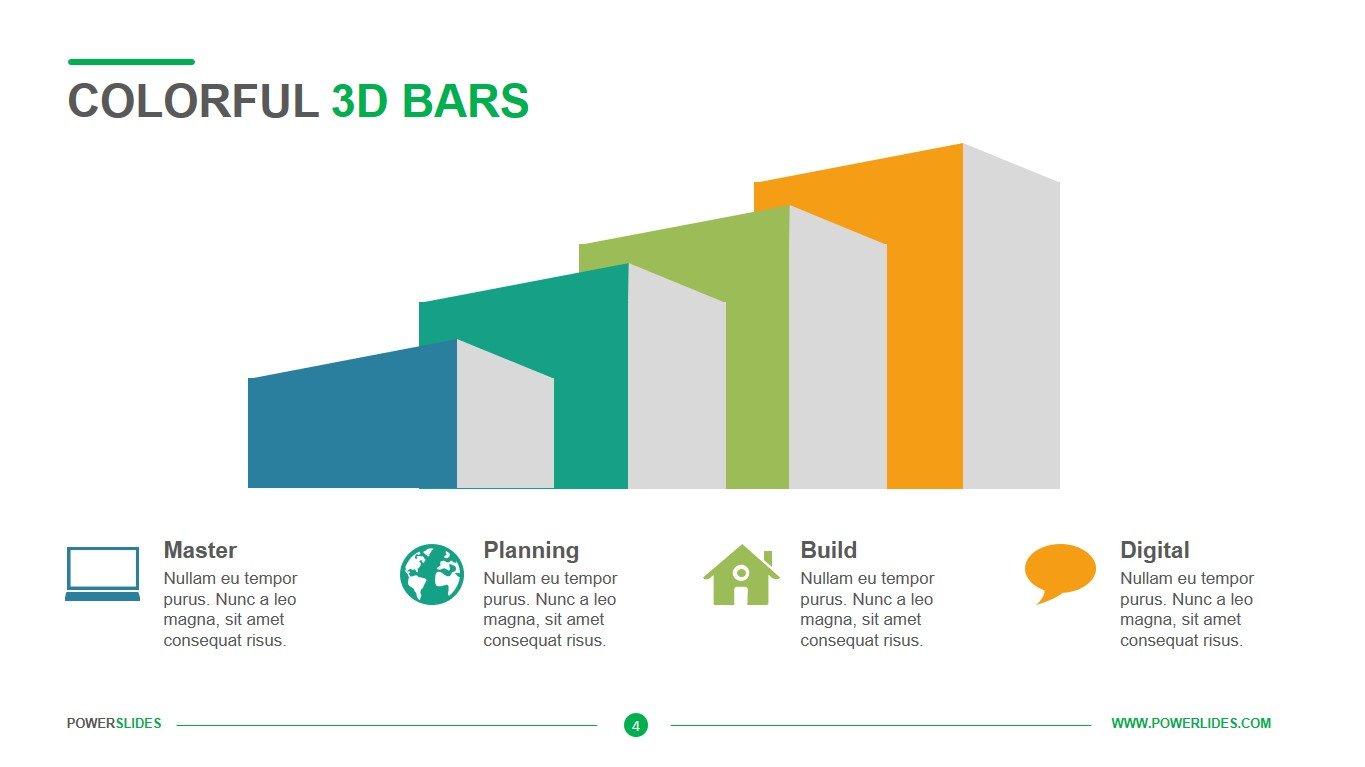
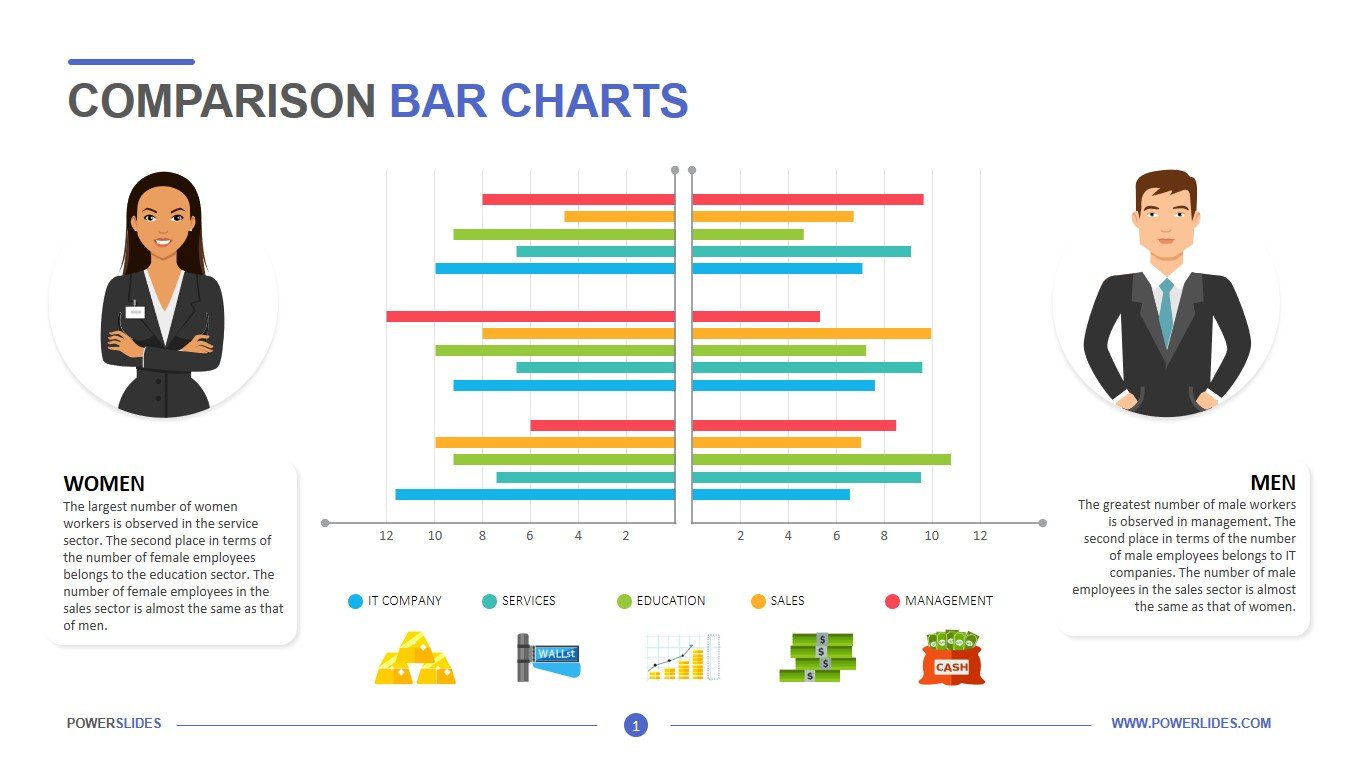
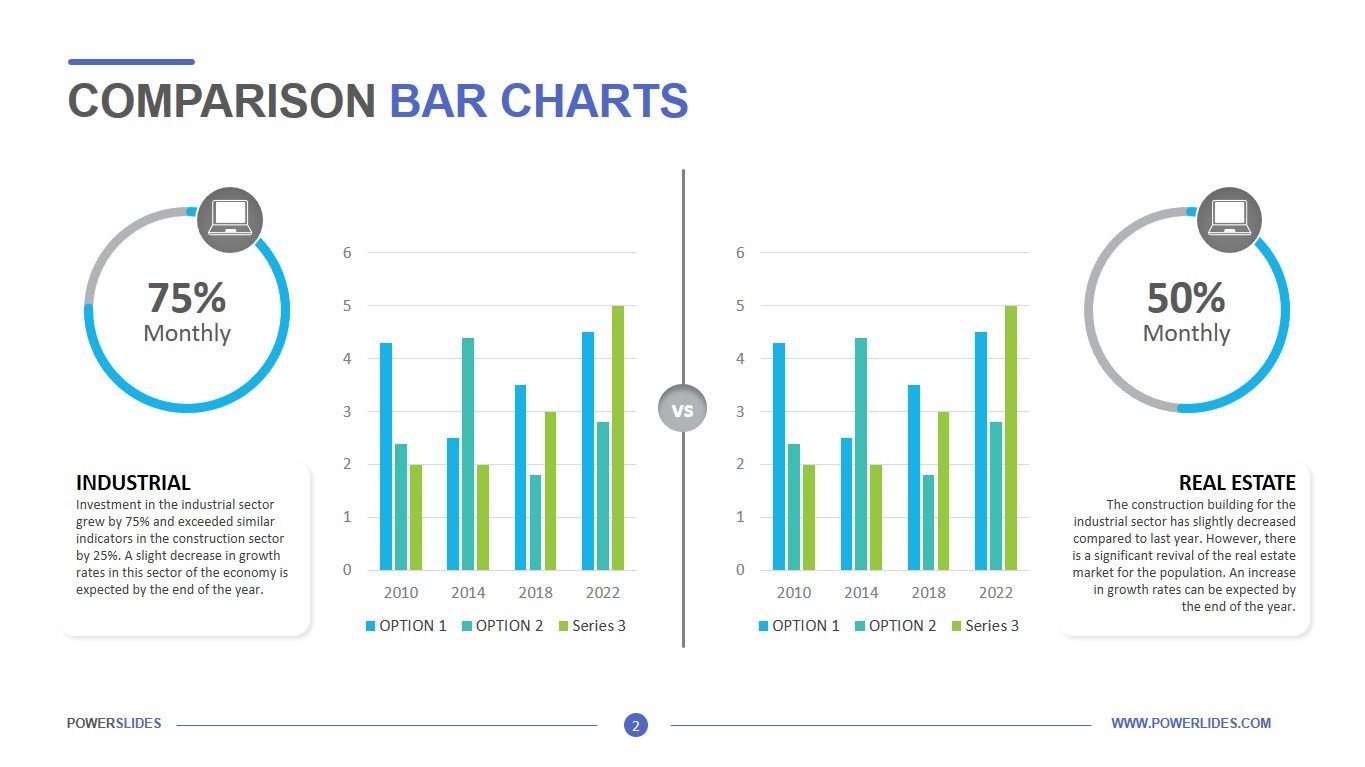
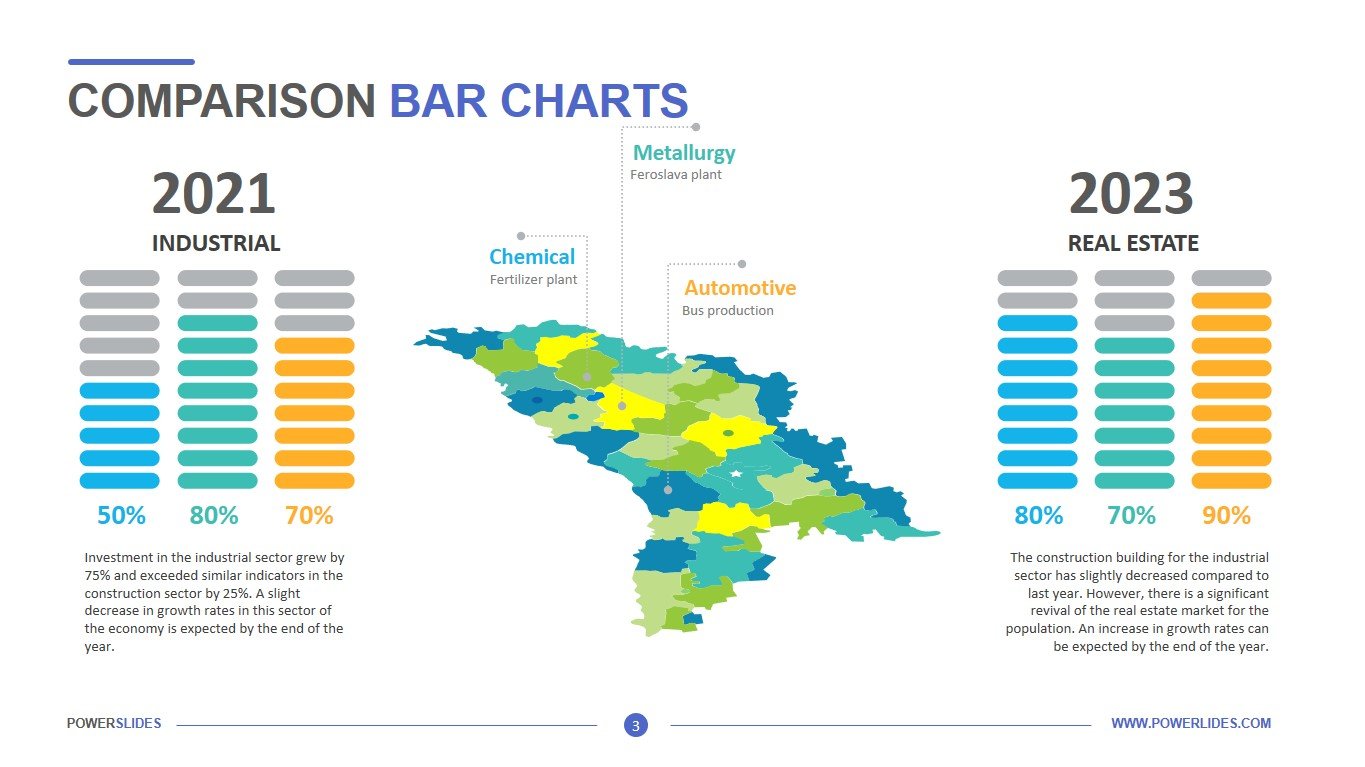
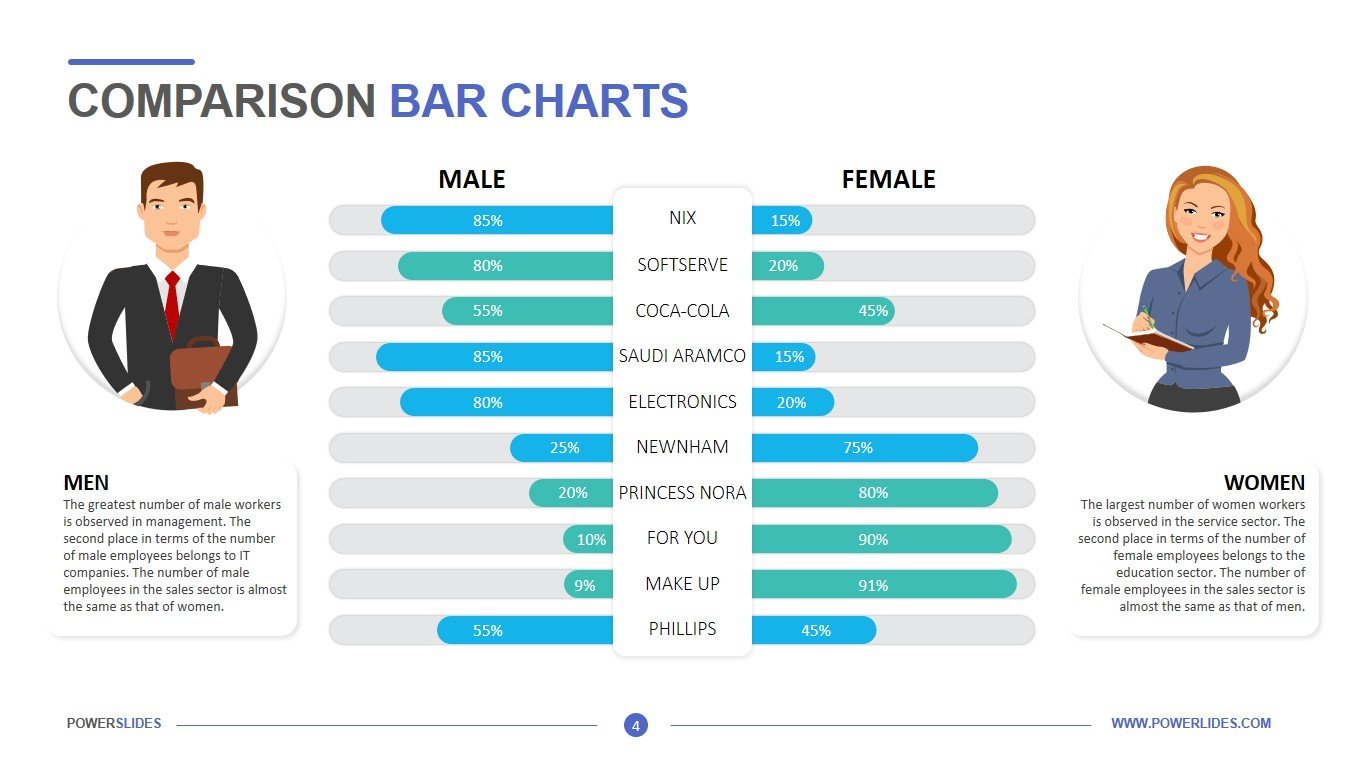
The first slide contains comparison bars along the vertical axis (parallel to the horizontal axis). The side by side comparison shows a summary of information quite efficiently. With distinctive colors, doodles, and description boxes, the graphic is clearly understandable. The second slide is no different from the first one, just opposite to it and contains additional circles representing the percentage of data on the top extreme corners. The third slide contains comparison bar charts which are a combination of mathematical and geographical figures. With the product map indicated in the center, comparison bars are placed to either side of the map with a brief description and dialogue boxes. The fourth slide is a simple representation of data. With labels in the middle and single comparison bars side by side, it’s more suitable when representing two different quantities.
Comparison Bar Charts template has all the necessary tools to build a modern and professional presentation. If necessary, you can independently change the location and color of the charts and edit the type and size of fonts in accordance with your corporate requirements. This template will be a great addition to your professional presentation collection.


