Waterfall Chart
What do you think of this template?


 (3.67/ 5)
11 ratings

 4 Slides
 File size: 16:9
 Fonts: Lato Black, Calibri
 Supported version
PPT 2010, PPT 2013, PPT 2016
Supported version
PPT 2010, PPT 2013, PPT 2016

Product details
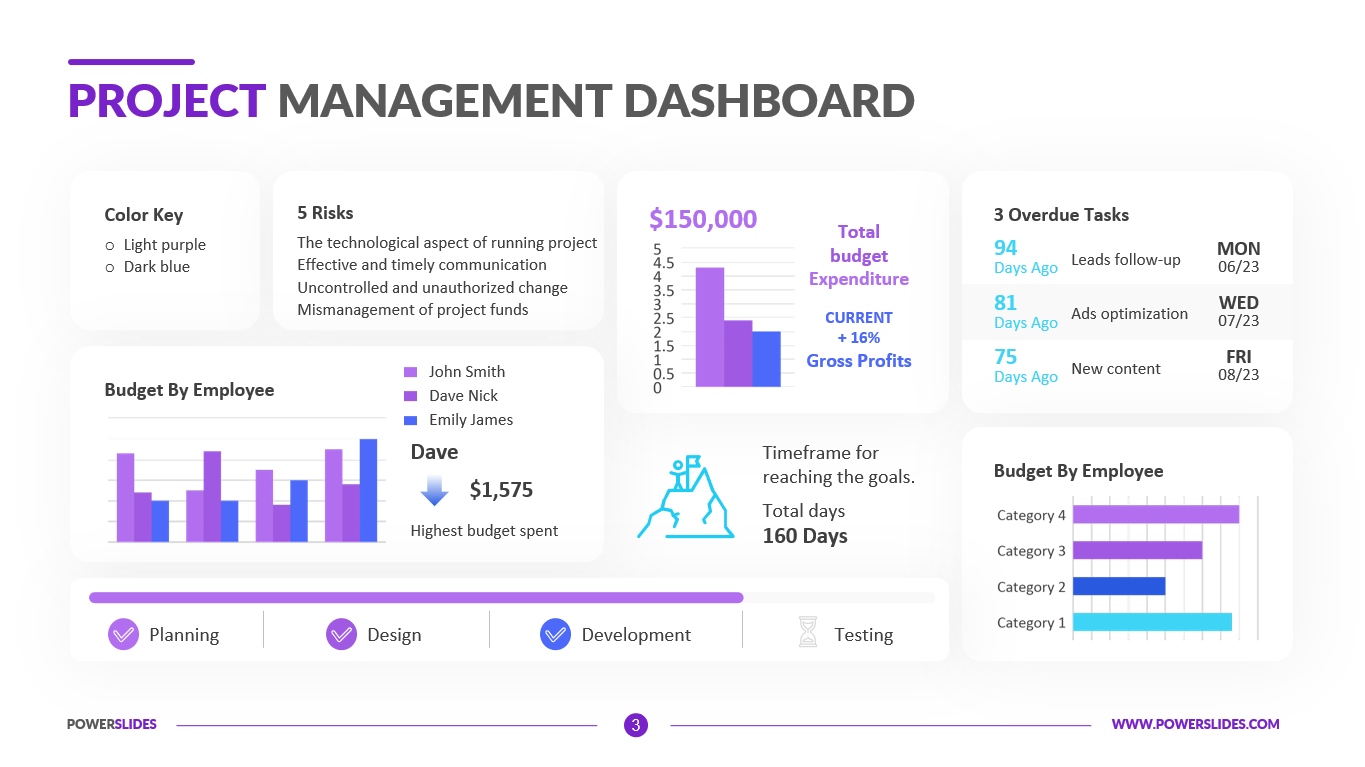
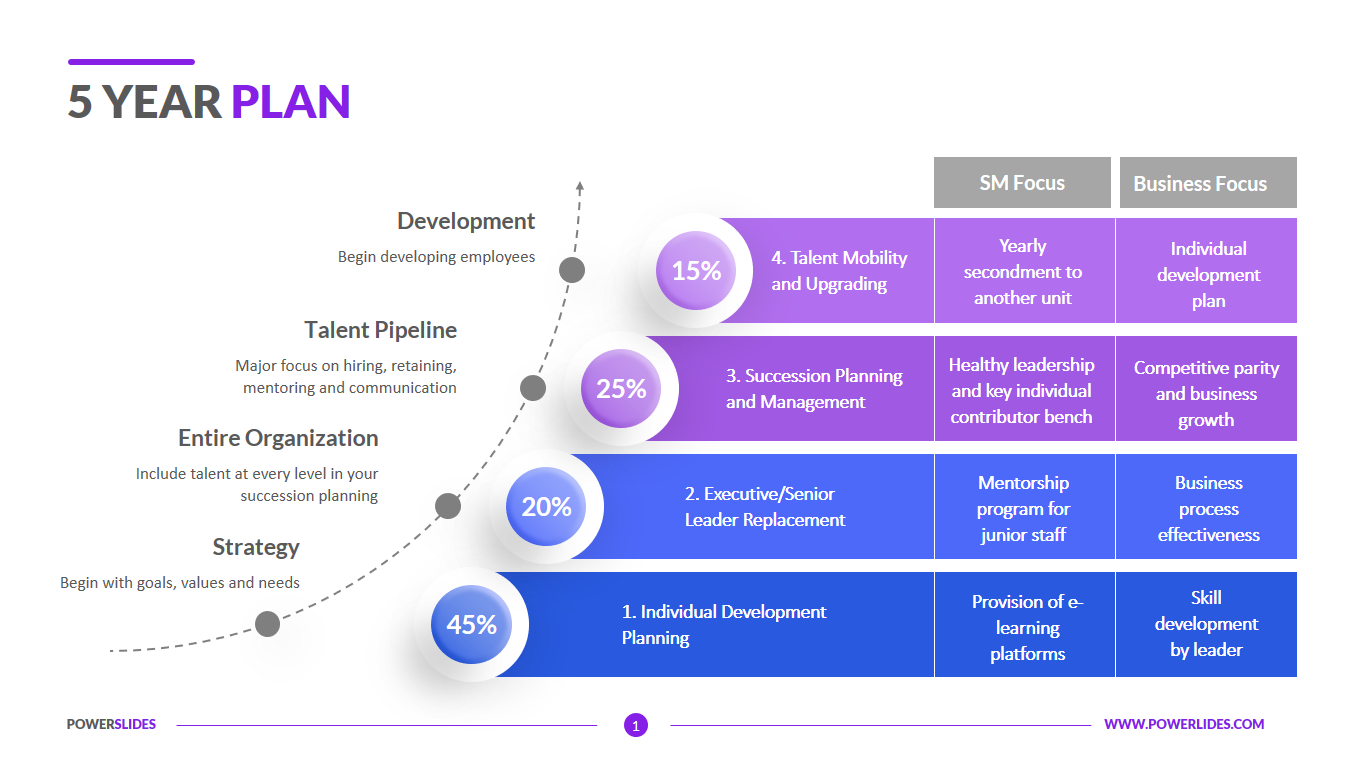
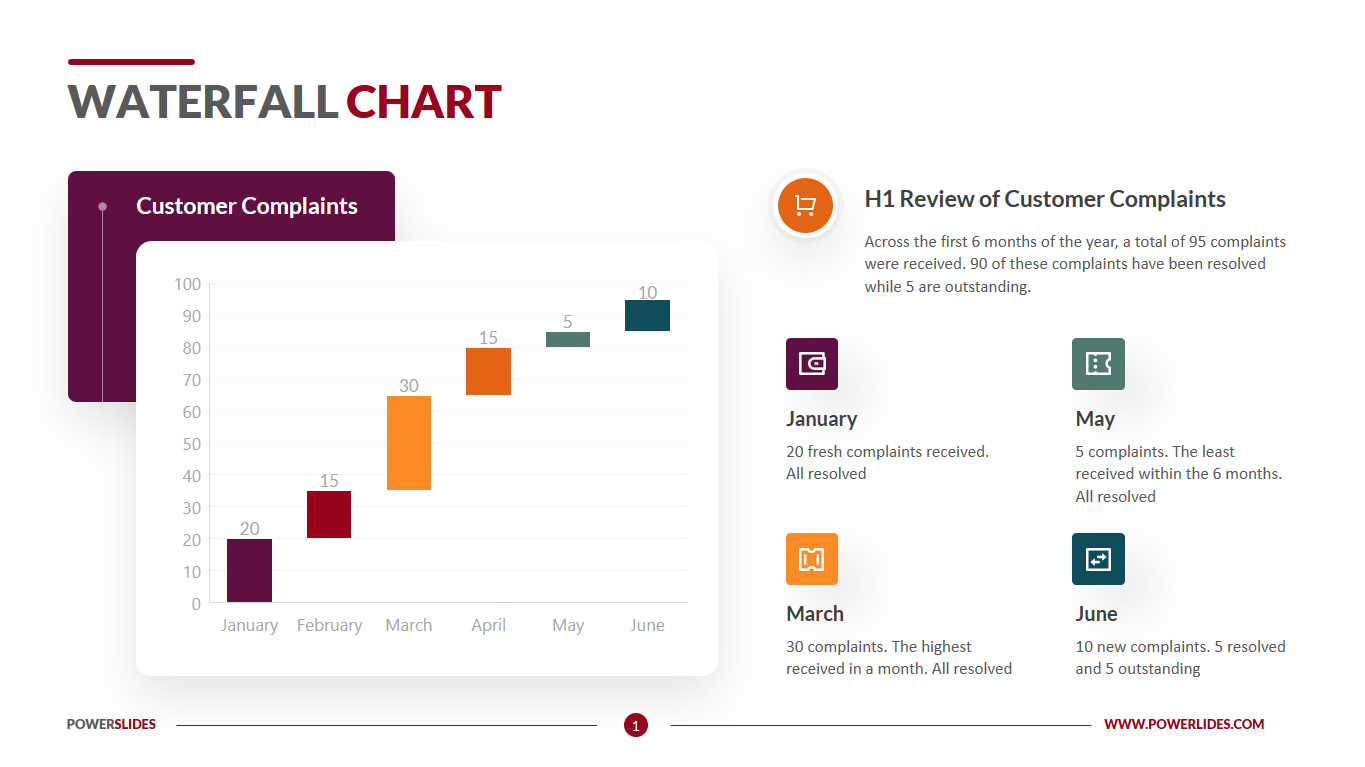
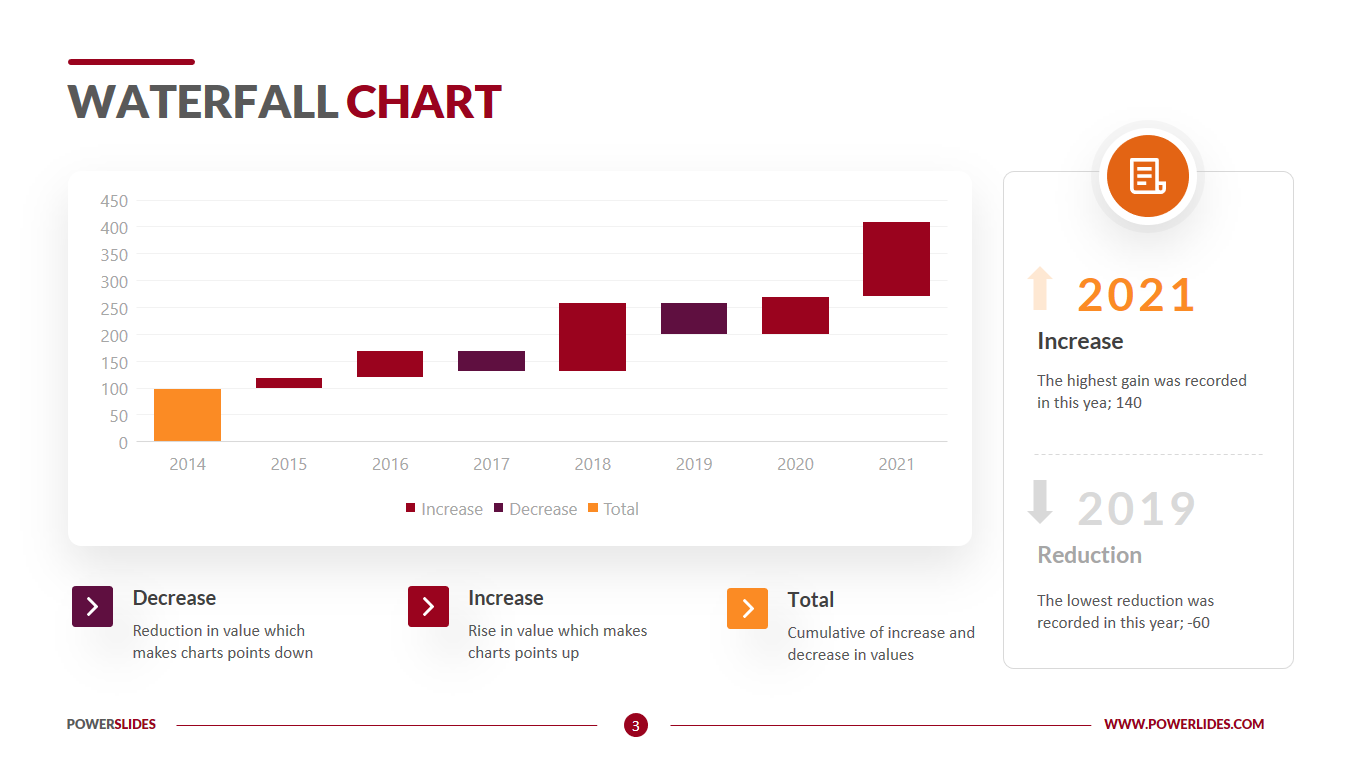
A general waterfall is an analytical tool that visually presents the sequential breakdown of a starting value to a final result by displaying intermediate values and leakage points. This can be used by companies to track data on each step. A waterfall chart is also known by many other names: waterfall graph, bridge graph, bridge chart, cascade chart, flying bricks chart and net profit waterfall chart. Regardless of the name, this versatile chart is a great way to provide a quick visual into the breakdown of data. Within a waterfall chart, the initial and final values are shown as columns with the individual adjustments depicted as floating steps. The waterfall chart as a financial analysis would typically show the values as per each preference round, and how the exit value is split between each round of investors. The key feature of a waterfall chart is that shows each step in the final result and demonstrates how you got there. Waterfall analysis as a financial model is used mainly by the shareholders of the company, but can also be used by those making important financial decisions of the company. The waterfall analysis would show the shareholder the amount each receives respectively upon the exit or sale of the company. The main stakeholders using this would include – founders, VC firms, angel investors, bank institutions, employees, directors, managers, lawyers and accountants. To better understand the capabilities of a waterfall chart, let’s look at an example of counting active contracts at the end of the year. Start with the number of contracts carried over from the previous year, add to that number of new contracts that you earned during that year, and then reduce the number of cancelled contracts and completed tasks. Eventually, you will reach the number of active contracts at the end of the year.
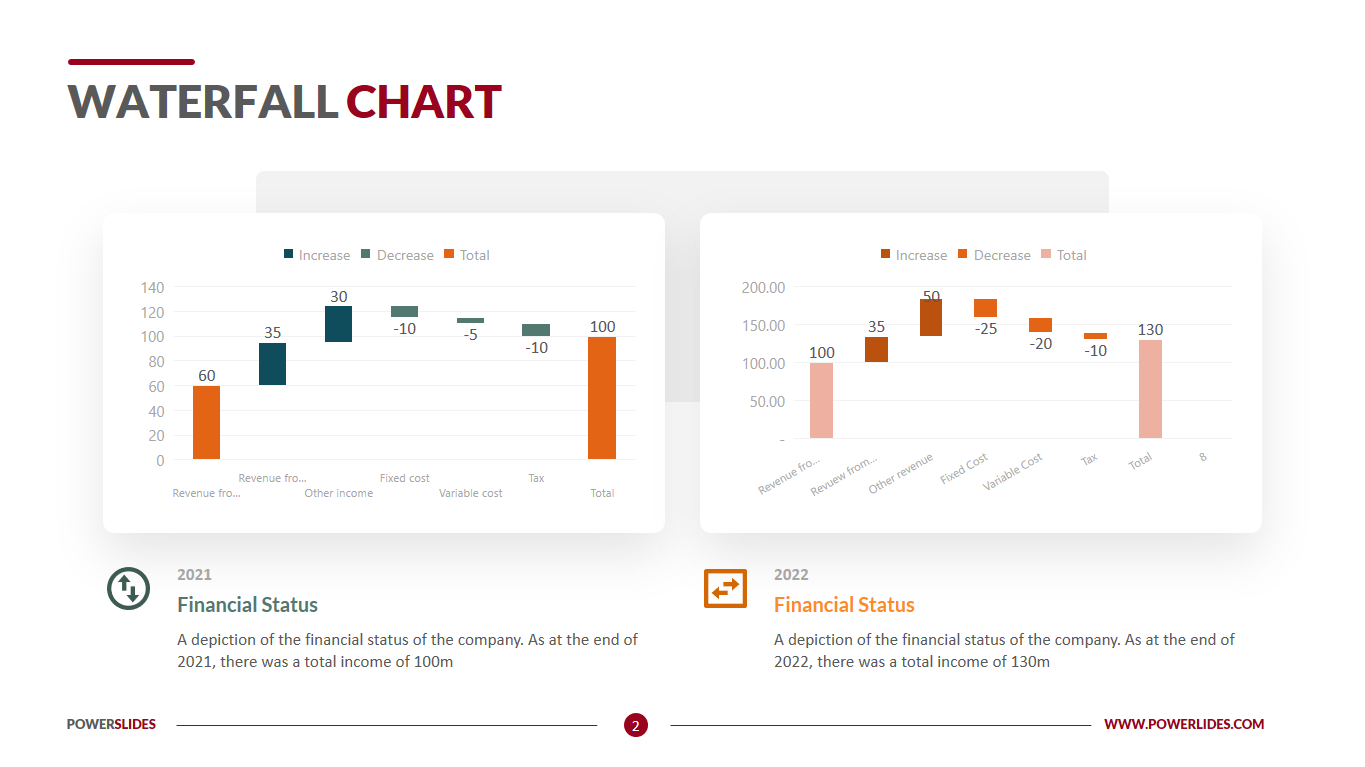
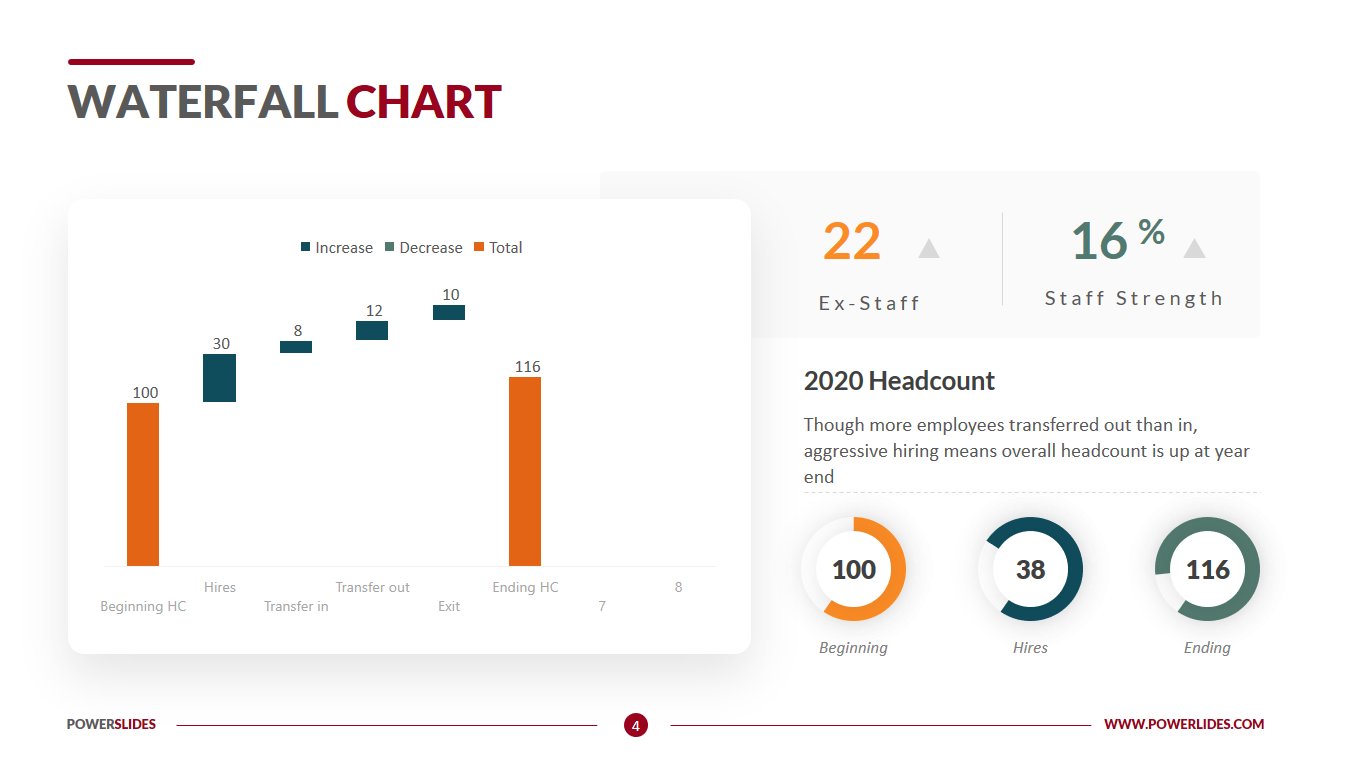
Waterfall Chart template contains a large number of charts and graphs. This template will be useful for investors and shareholders when calculating dividends and profits when selling shares. Also, this template will be useful for financiers when preparing cash flow statements. Sales managers can use this template when preparing their quarterly performance report. For example, you can display the number of initial customers, lost customers, and new customers. Also, this template can be used by warehouse managers when preparing a report on warehouse balances of major product groups. Business trainers and university professors can use the slides in this template to prepare courses on stock returns or cumulative distributional effects. Human resources managers can use the slides in this template to prepare information on the dynamics of layoffs and hiring of employees for each department. Also, this template will be useful for economists, accountants and bank employees when preparing quarterly reports. Waterfall Chart will be a worthy addition to your collection of chart presentations.


