Cash Flow Analysis
What do you think of this template?
 (5.00/ 5)
20 ratings

 4 Slides
 File size: 16:9
 Fonts: Lato Black, Calibri
 Supported version
PPT 2010, PPT 2013, PPT 2016
Supported version
PPT 2010, PPT 2013, PPT 2016

Product details
A company’s cash flow can be defined as the number that appears in the cash flow statement as net cash provided by operating activities. However, there is no universally accepted definition. For instance, many financial professionals consider a company’s cash flow to be the sum of its net income and depreciation.
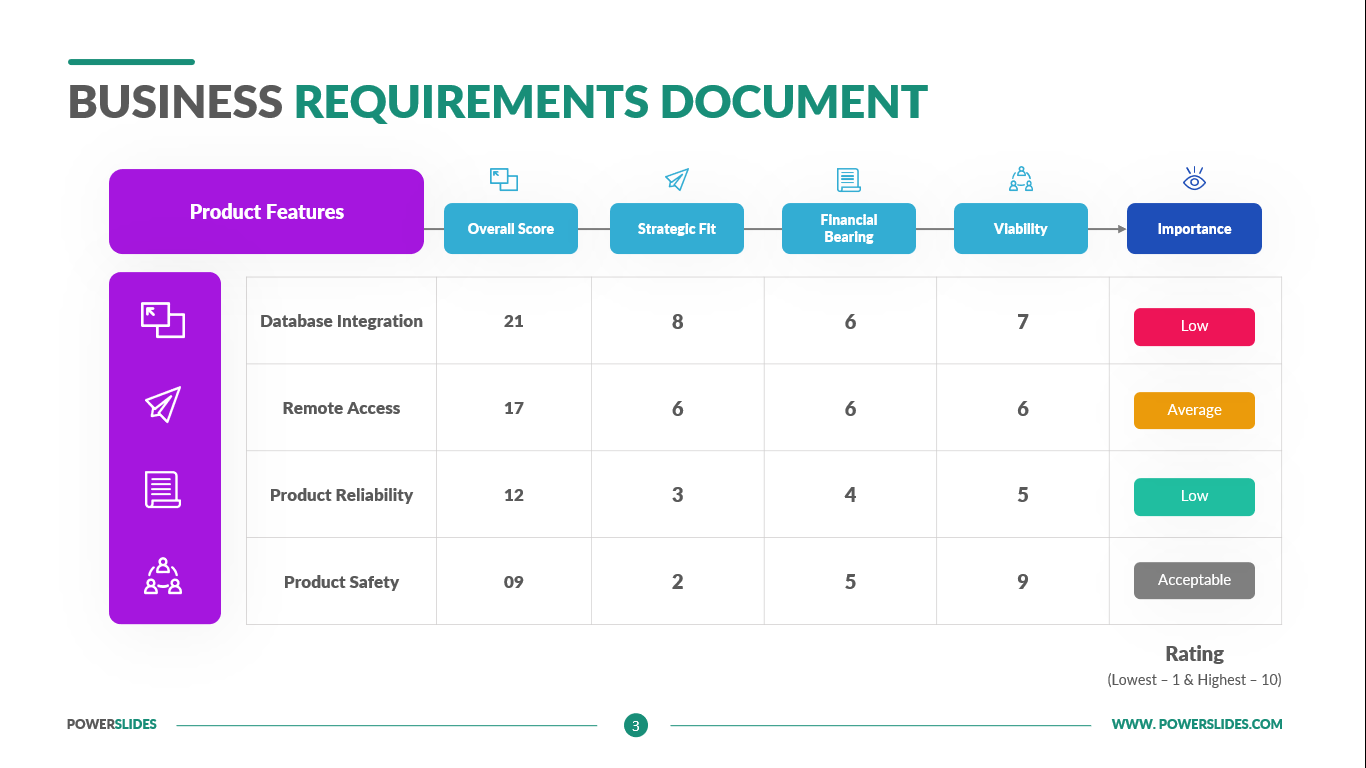
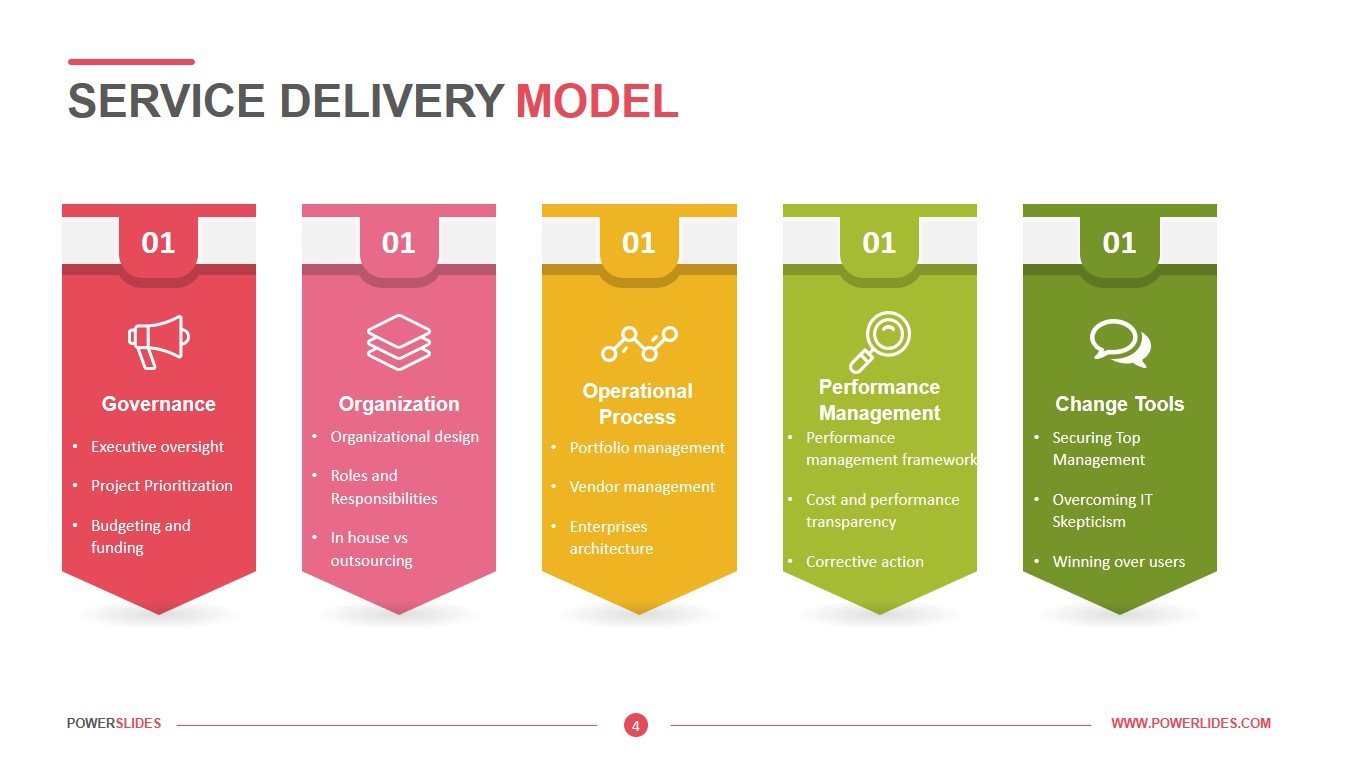
While cash flow analysis can include several ratios, the following indicators provide a starting point for an investor to measure the investment quality of a company’s cash flow.
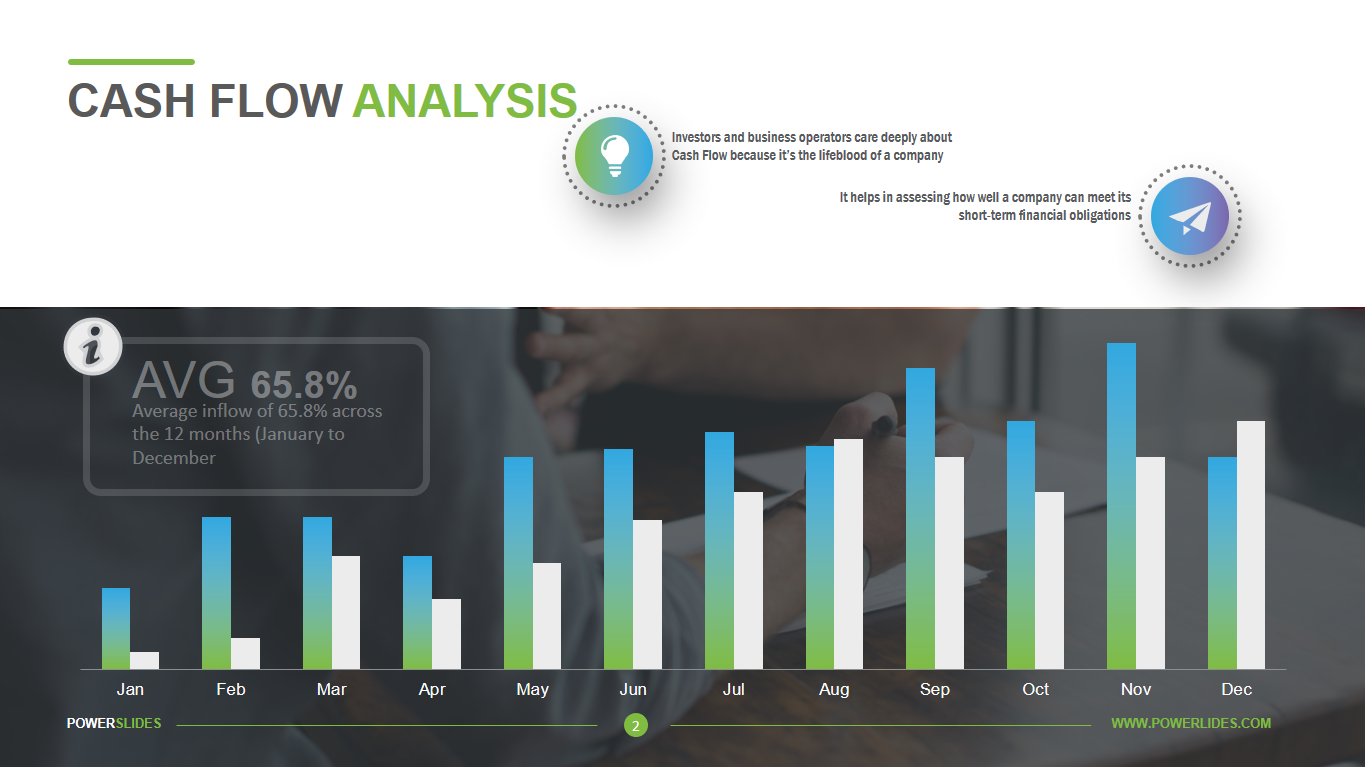
Operating Cash Flow/Net Sales ratio, which is expressed as a percentage of a company’s net operating cash flow to its net sales, or revenue (from the income statement), tells us how many dollars of cash are generated for every dollar of sales. There is no exact percentage to look for, but the higher the percentage, the better. It is essential to monitor how cash flow increases as sales increase since it’s important that they move at a similar rate over time.
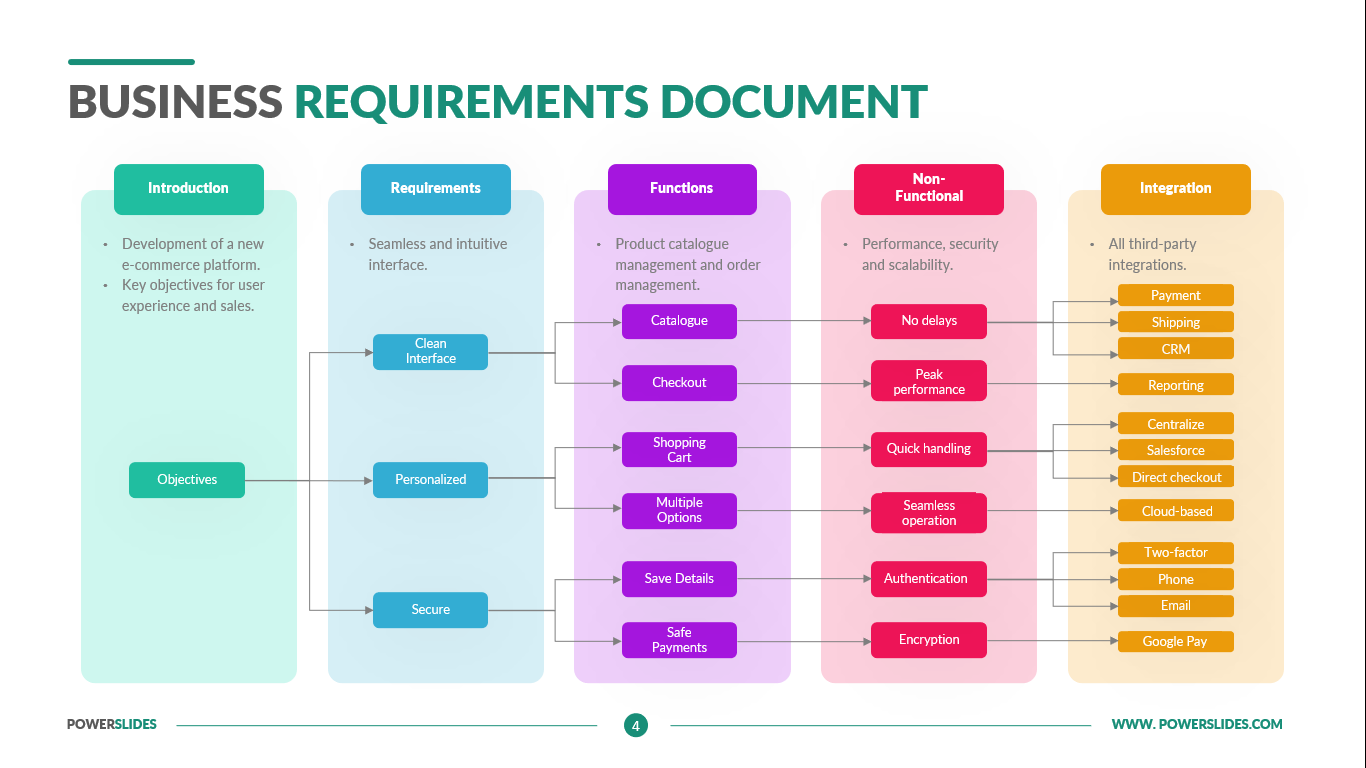
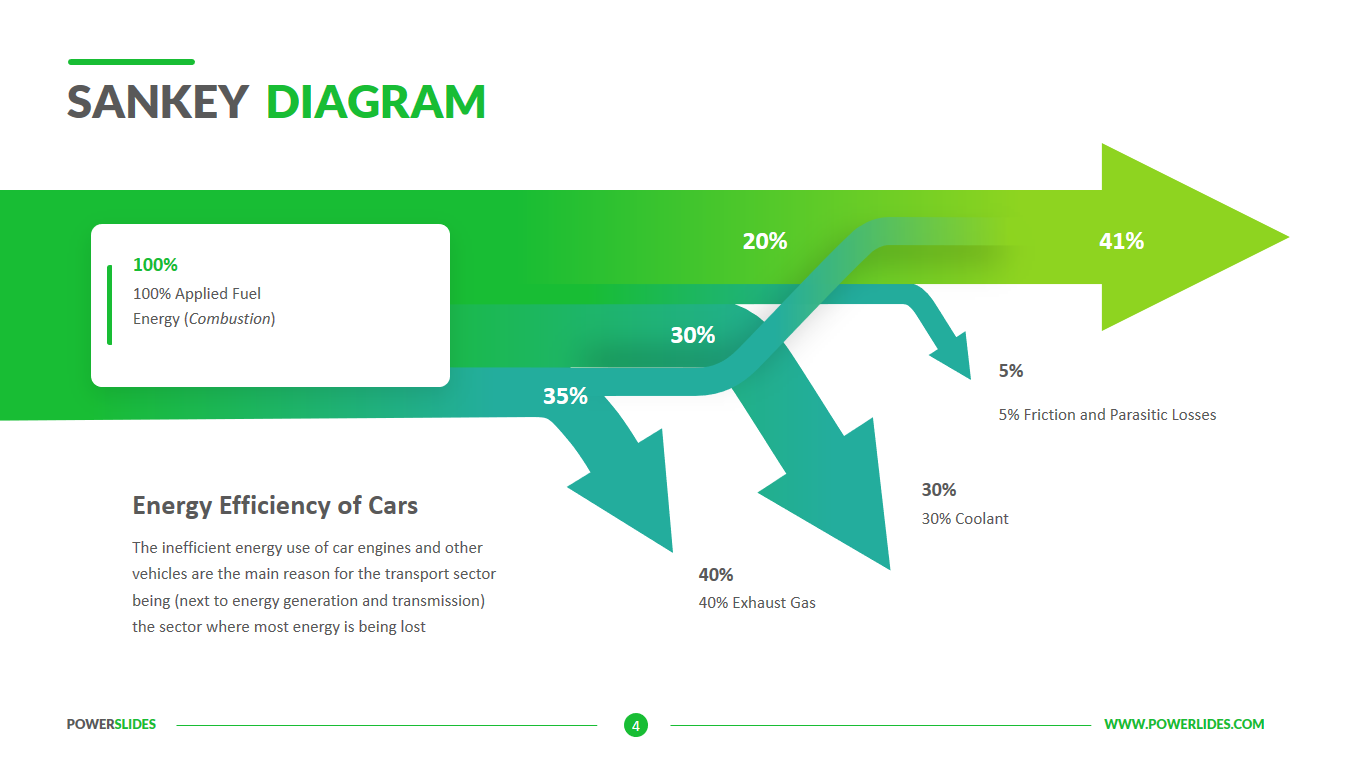
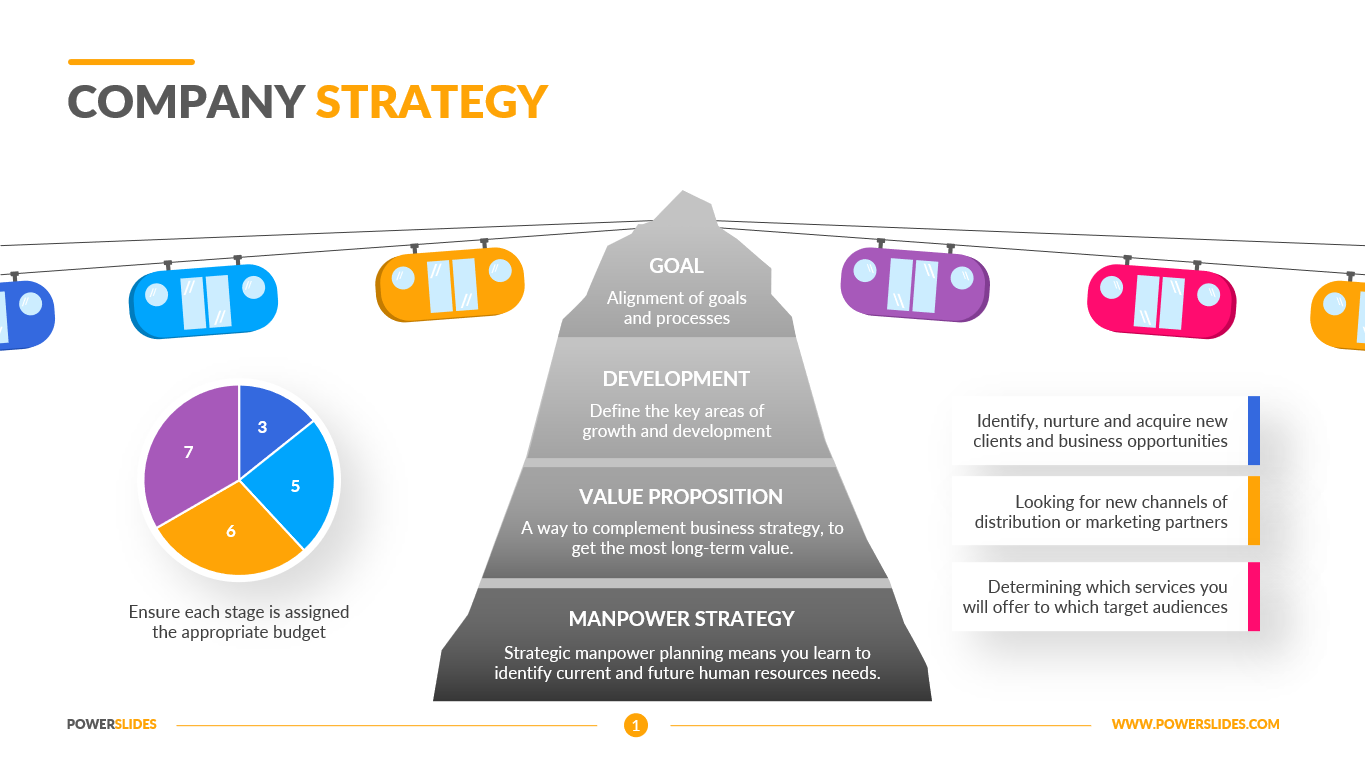
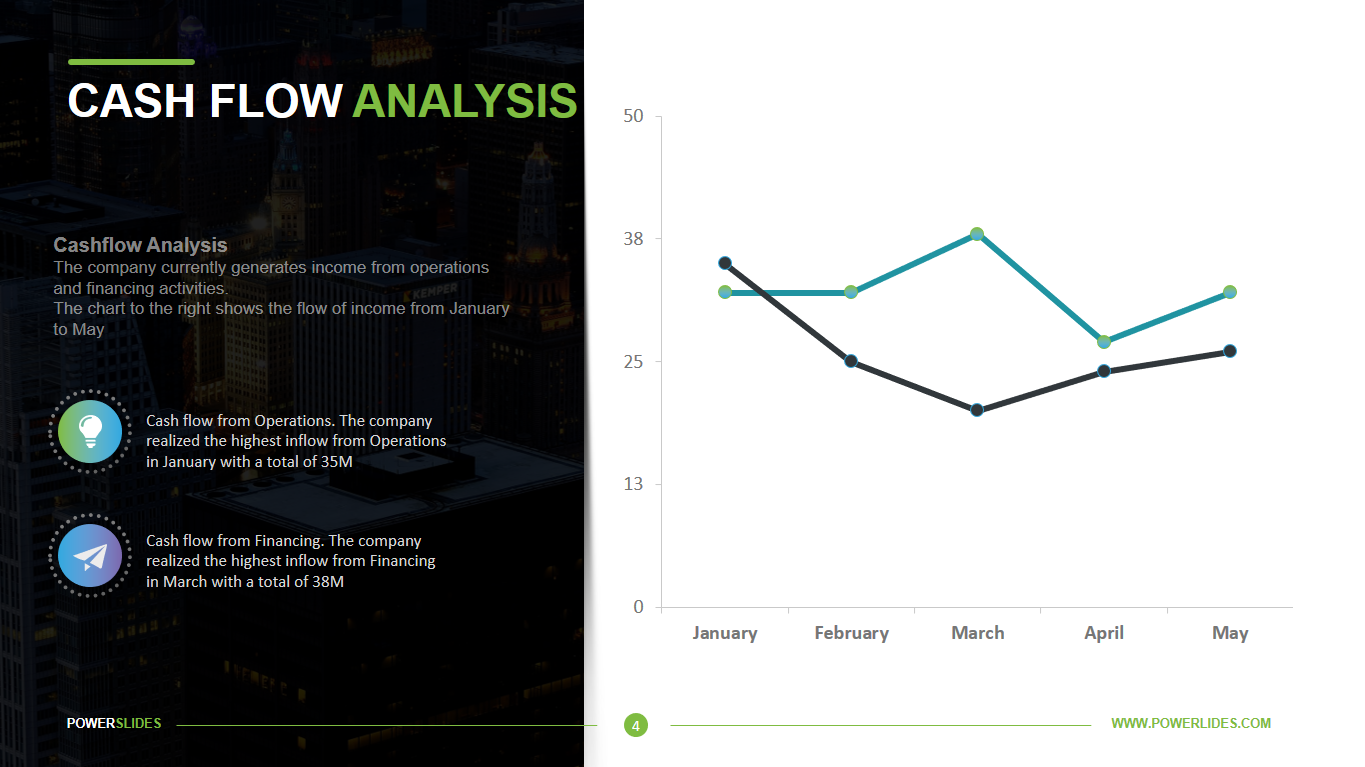
Free cash flow is often defined as the net operating cash flow minus capital expenditures. Free cash flow is an important measurement since it shows how efficient a company is at generating cash. Investors use free cash flow to measure whether a company might have enough cash, after funding operations and capital expenditures, to pay investors through dividends and share buybacks.
If a company’s cash generation is positive, it’s a strong indicator that the company is in a good position to avoid excessive borrowing, expand its business, pay dividends, and weather hard times. Free cash flow is an important evaluative indicator for investors. It captures all the positive qualities of internally produced cash from a company’s operations and monitors the use of cash for capital expenditures.
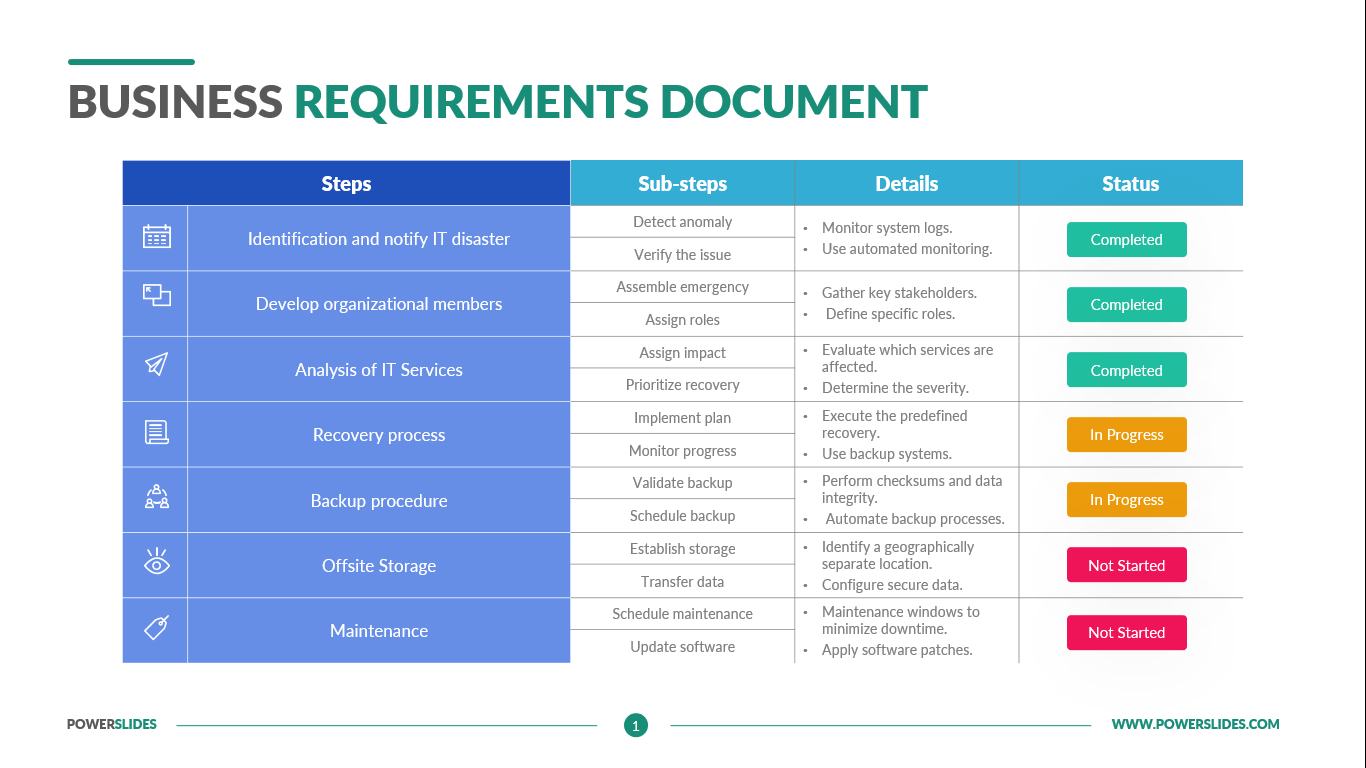
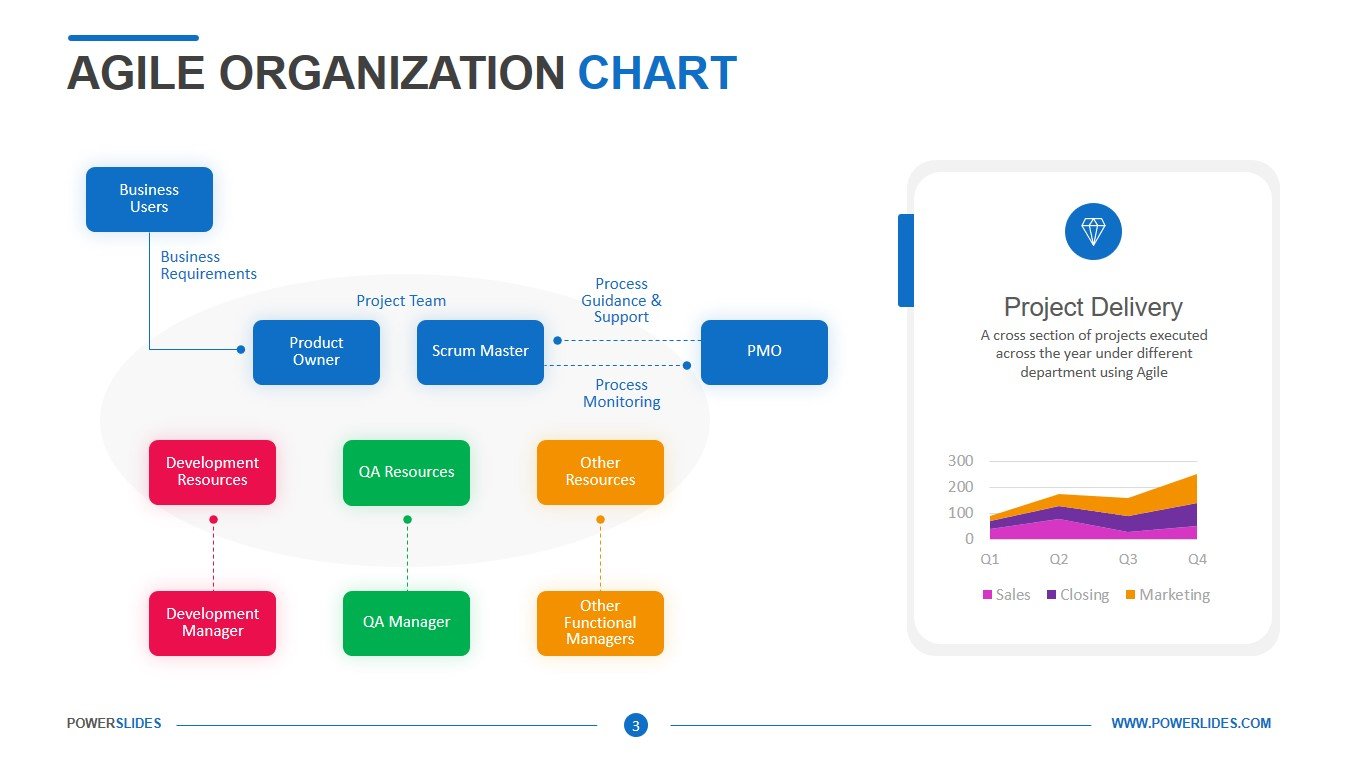
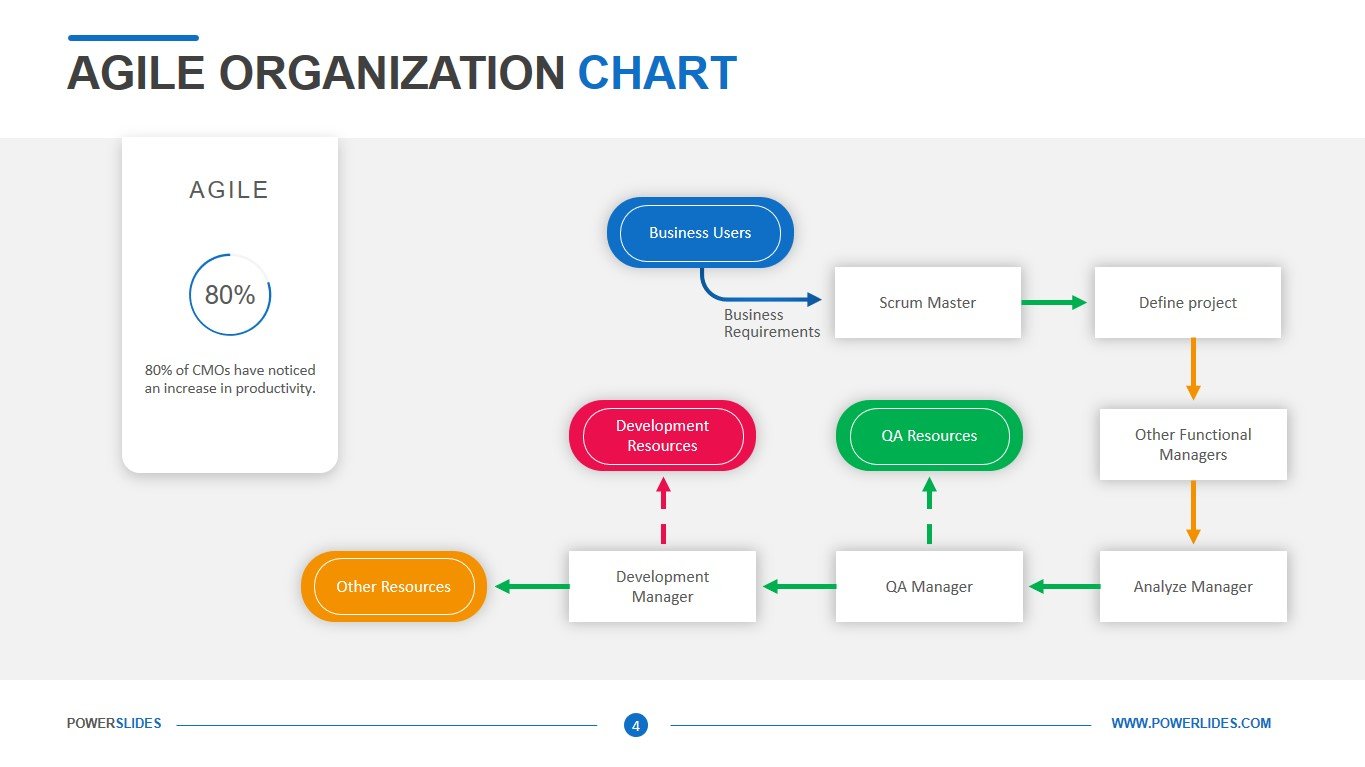
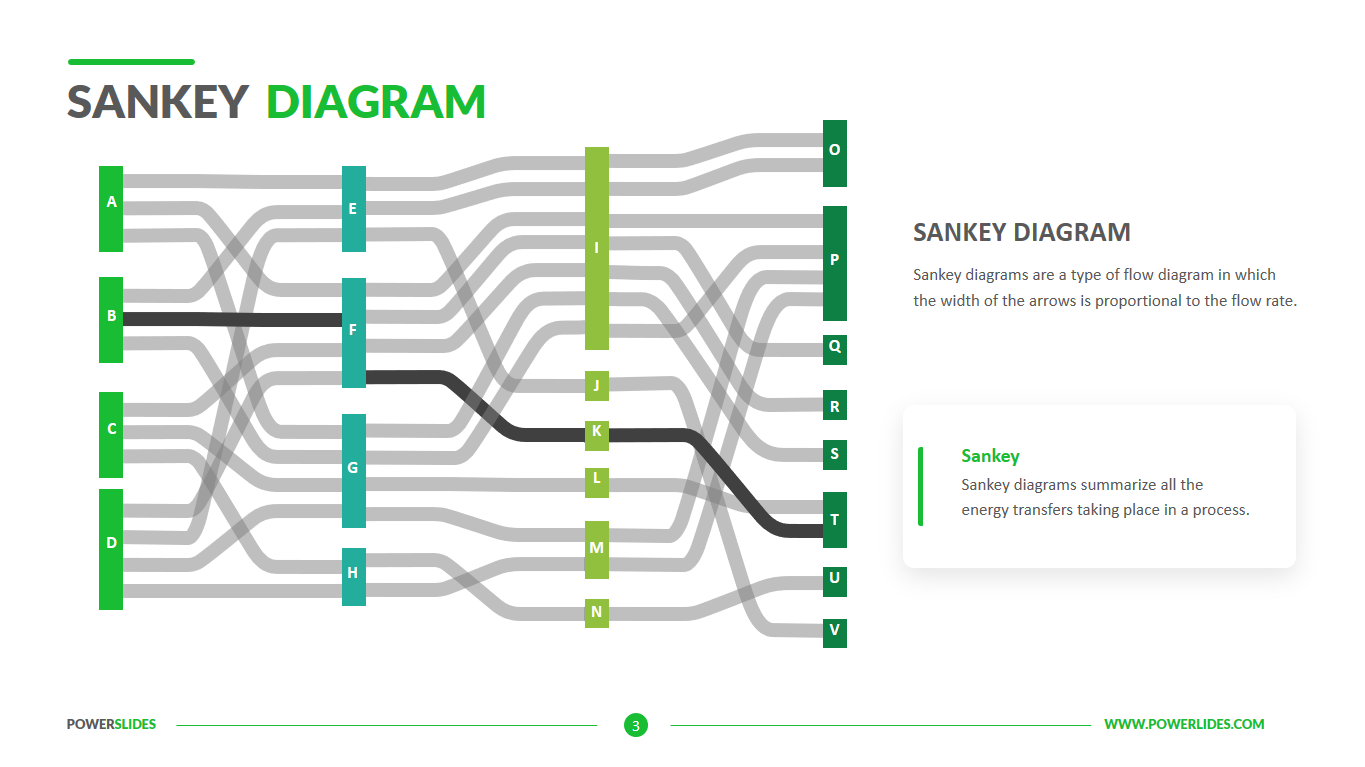
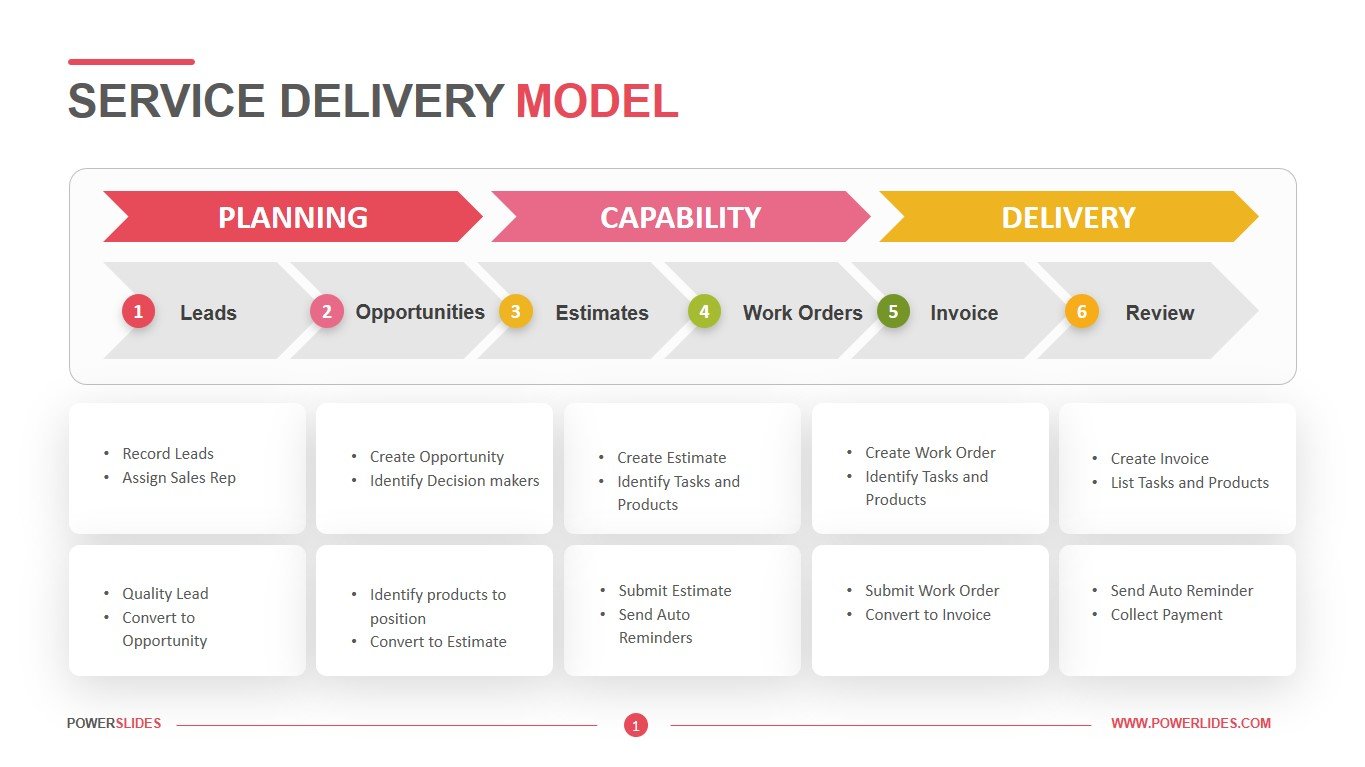
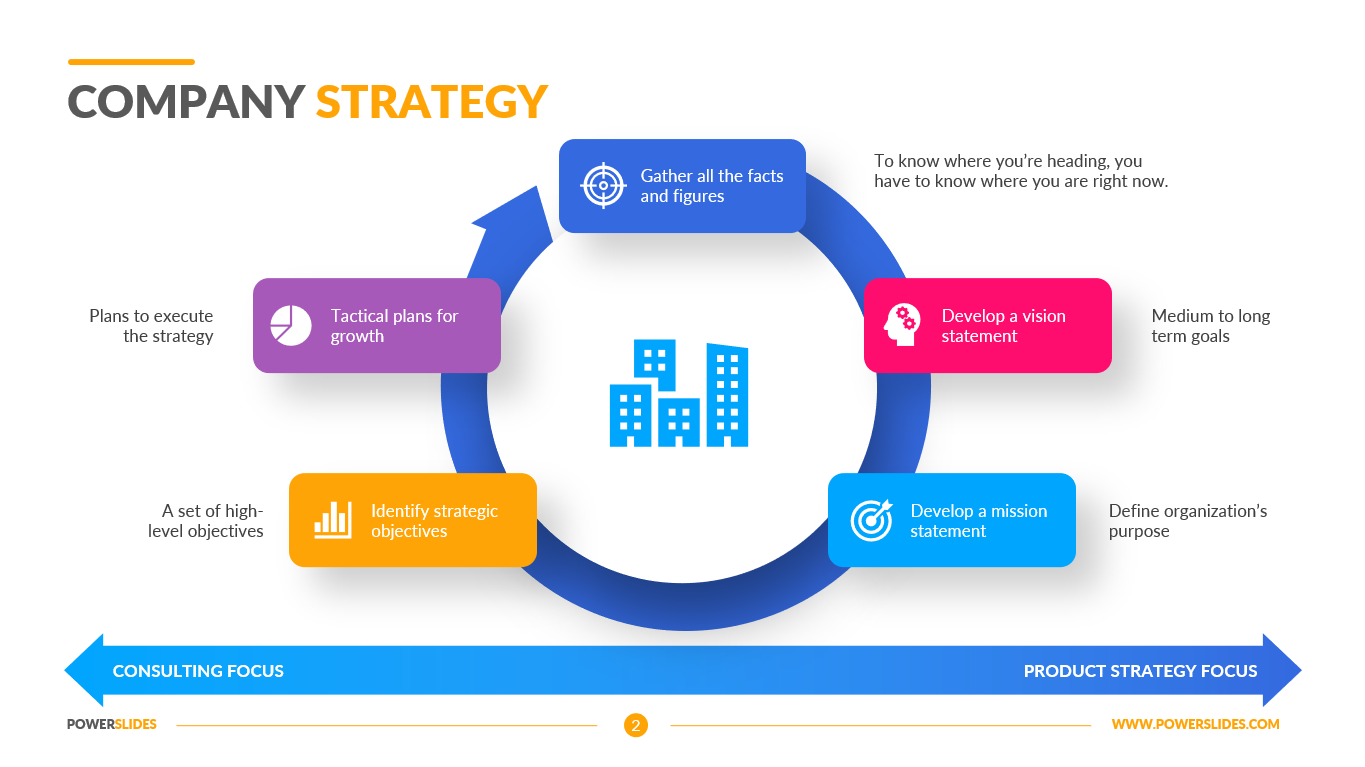
A cash flow analysis shows how much money comes in and out of a business on a quarterly and annual basis. This is a powerful tool for companies of all sizes – small, medium and large. Revenue is one of the most important measures for your business. It proves efficiency, smart strategy, strong sales and it also develops trust from investors. So, it is important to present this data accurately and appropriately in front of employees, shareholders, executives and investors.
The Cash Flow Analysis template will be primarily useful for financial analysts and economists. You can use the slides in this template to prepare your quarterly or monthly financial statements for your company. Various types of charts and graphs in this template will allow you to make your presentation stylish and professional.
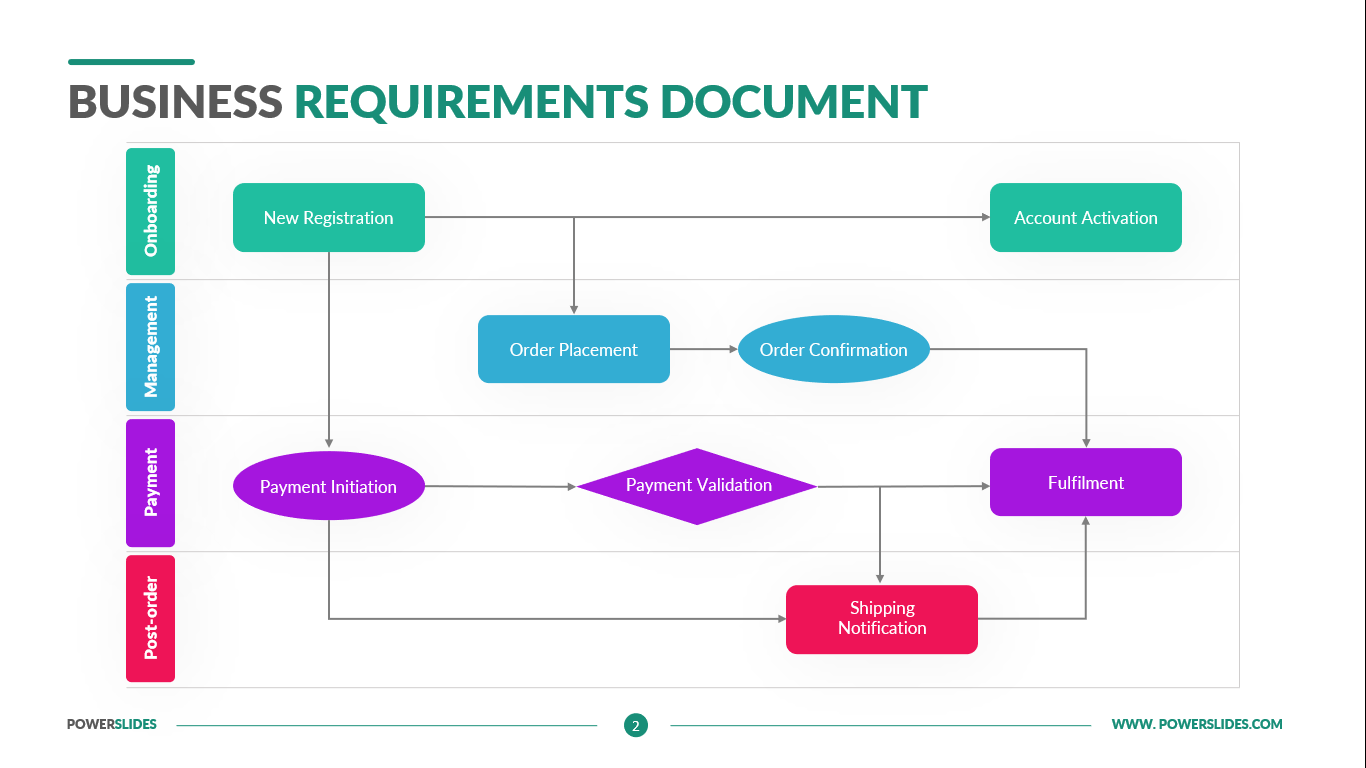
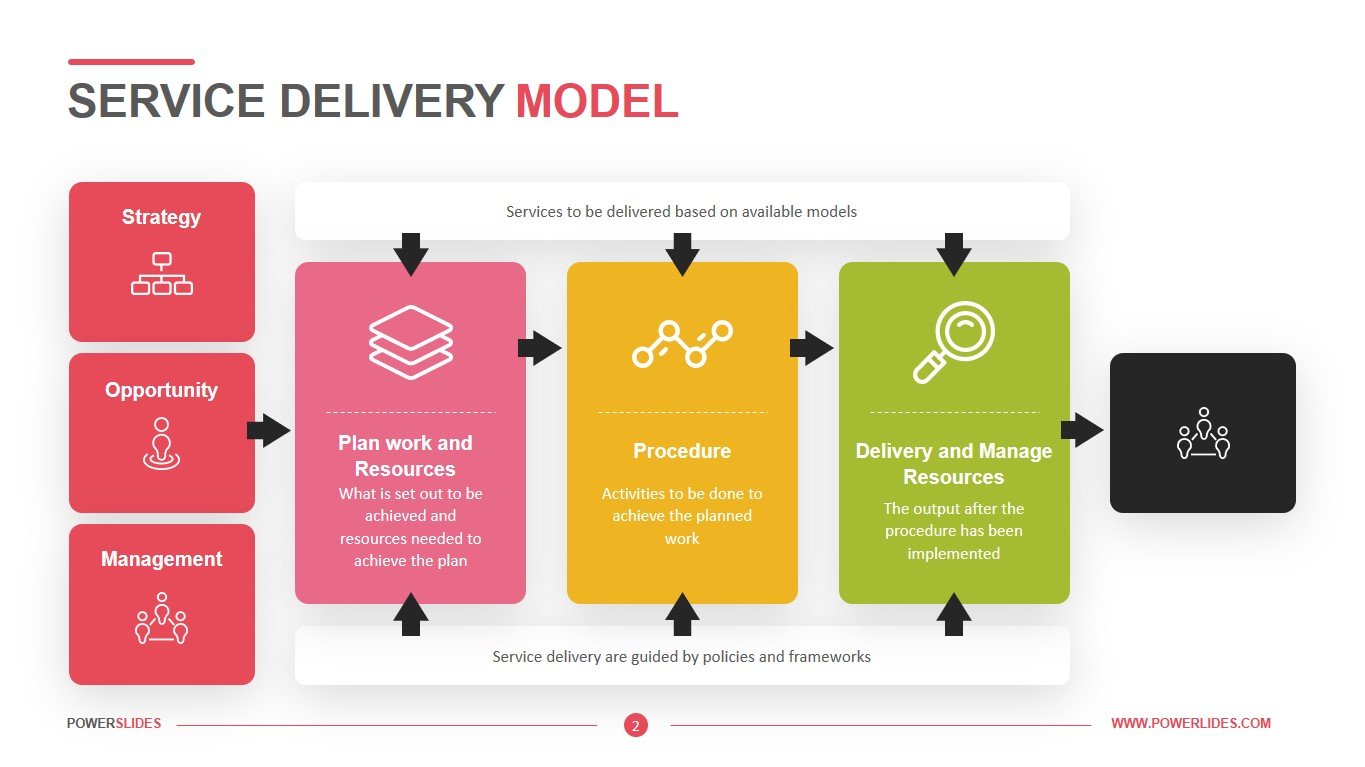
Startup executives can use this template when presenting their financial performance to investors. Investment companies can use the slides of this template when comparing companies looking to get investments to expand their market. Crisis managers and company leaders can use this template when preparing for a company’s development strategy.
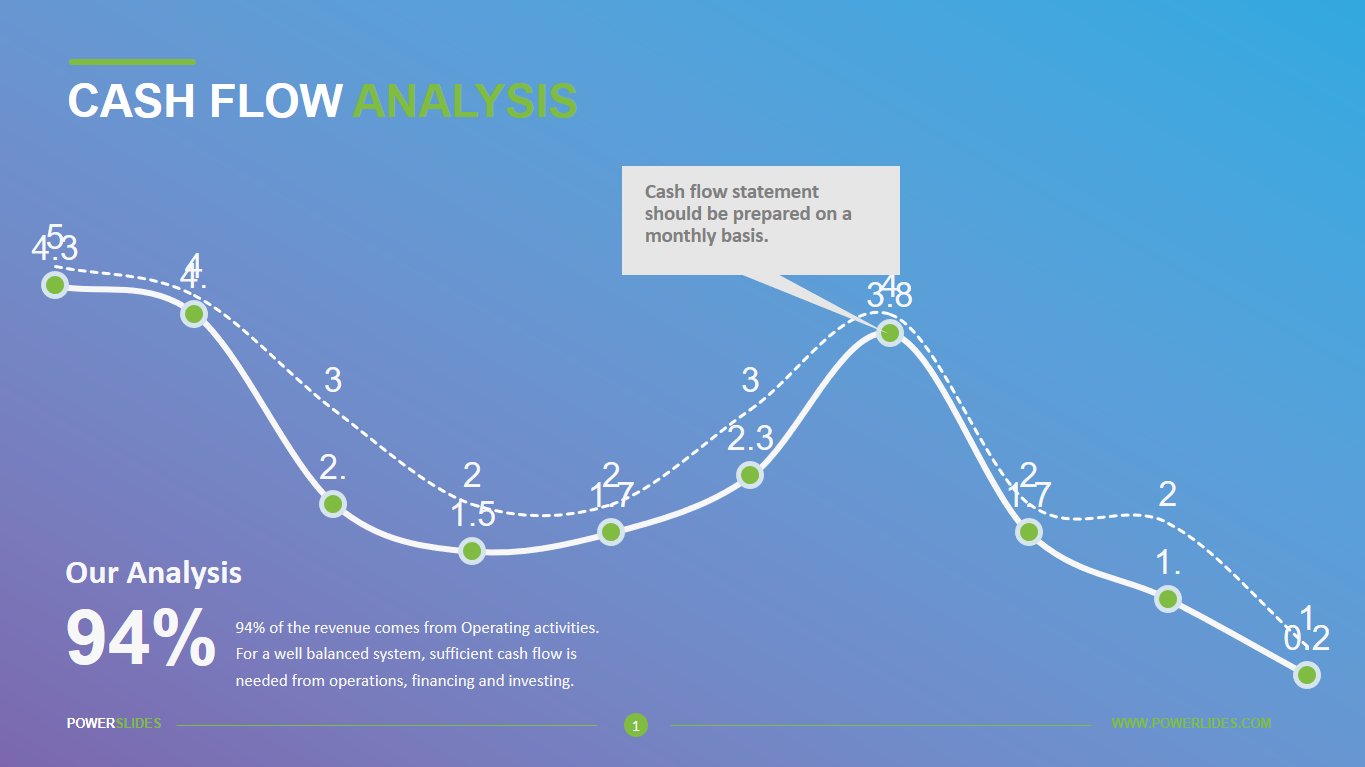
With this cash flow analysis template in PowerPoint, you can track the flow of money in and out of your business with ease. Simply plug in the data and see the graphs populate with accurate information. Ideal for professionals in finance functions, this template offers four different design variations to present statistical data and financial information. You can use the line graph or bar chart to visually show your data to shareholders, executives and investors. All colors, content and graphics can be updated as needed.


