Productivity
What do you think of this template?

 (3.00/ 5)
6 ratings

 4 Slides
 File size: 16:9
 Fonts: Lato Black, Calibri
 Supported version
PPT 2010, PPT 2013, PPT 2016
Supported version
PPT 2010, PPT 2013, PPT 2016

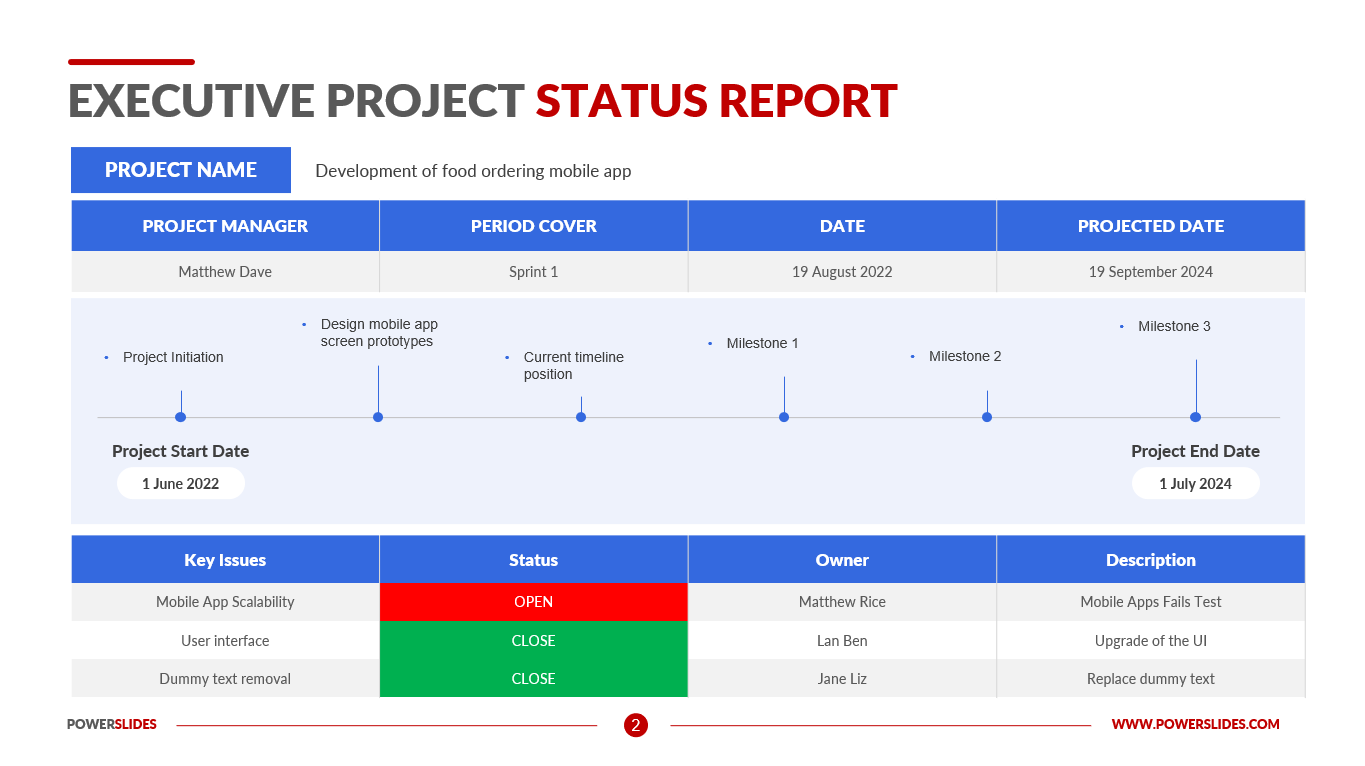
Product details
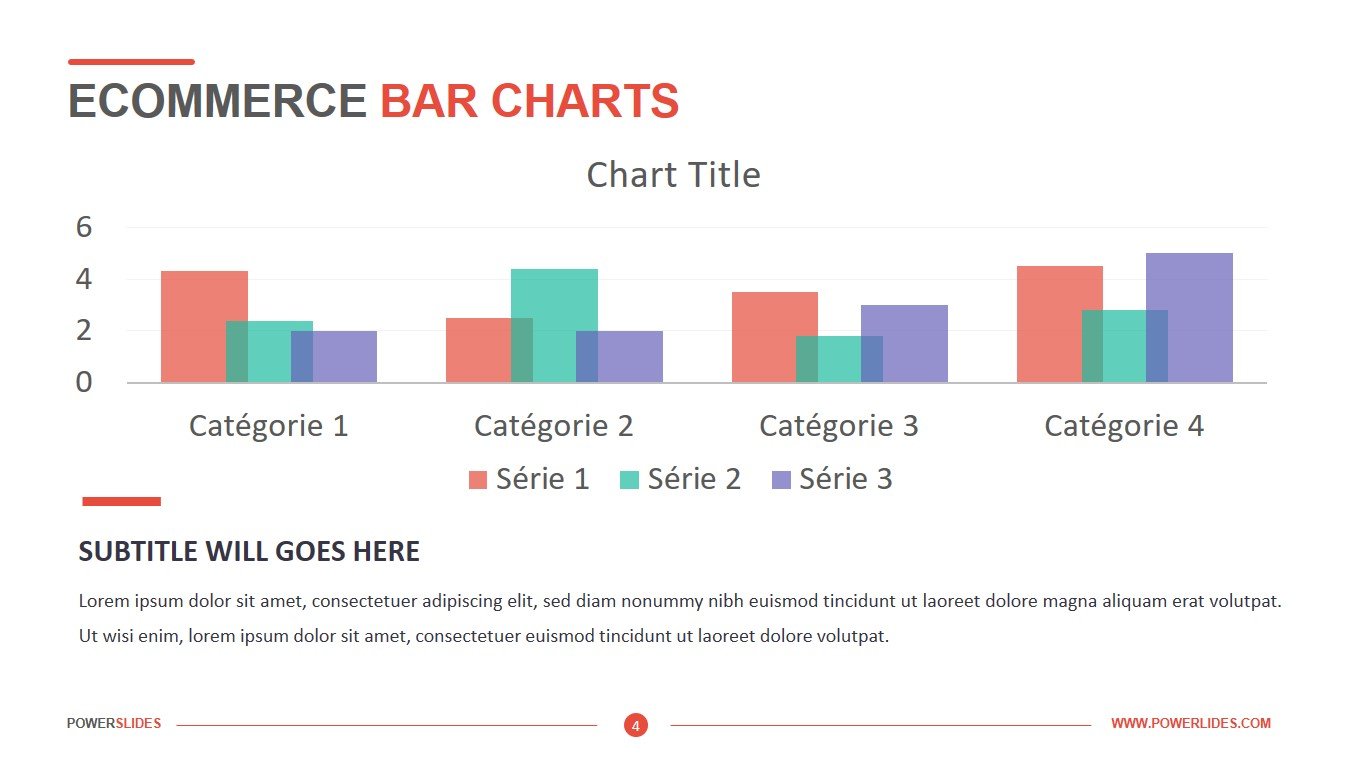
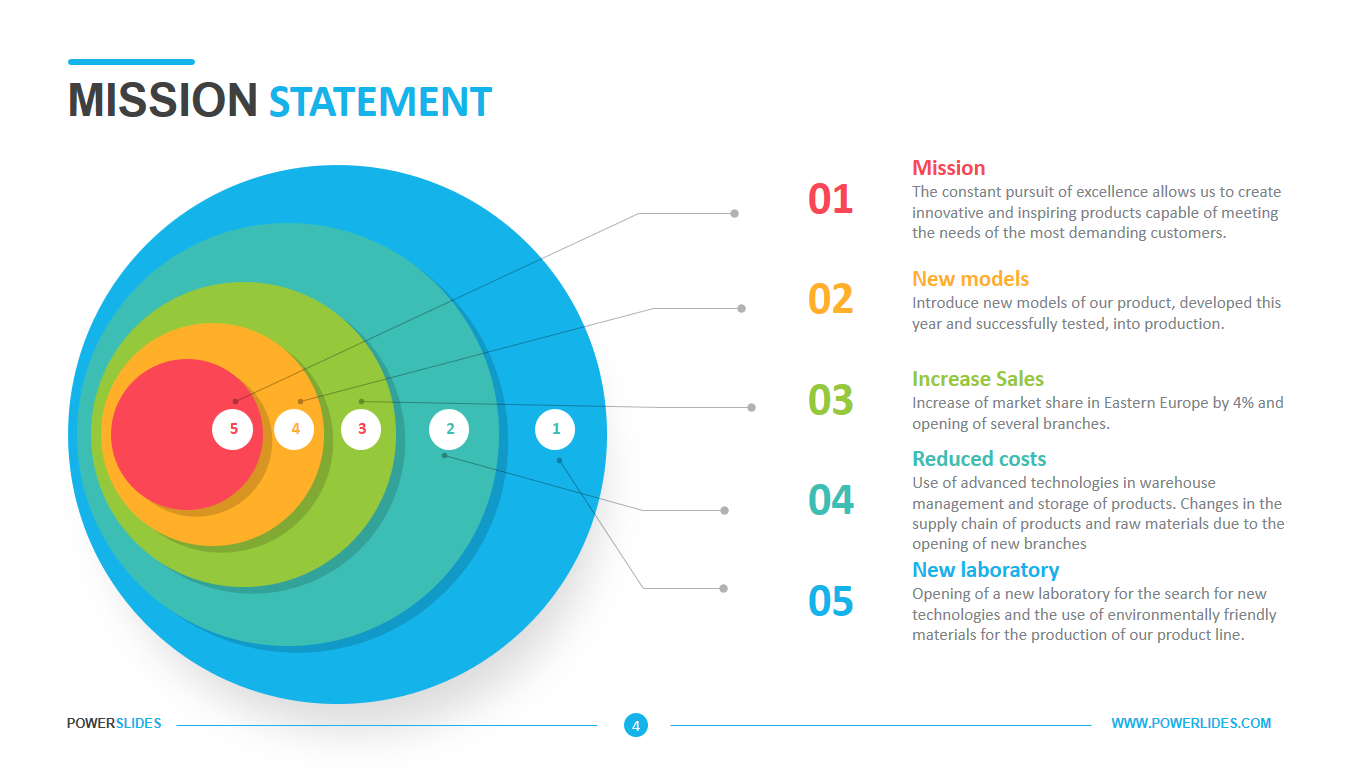
Productivity is a measure of the rate at which output of goods and services are produced per unit of input. It is calculated as the ratio of the quantity of output produced to some measure of the quantity of inputs used.
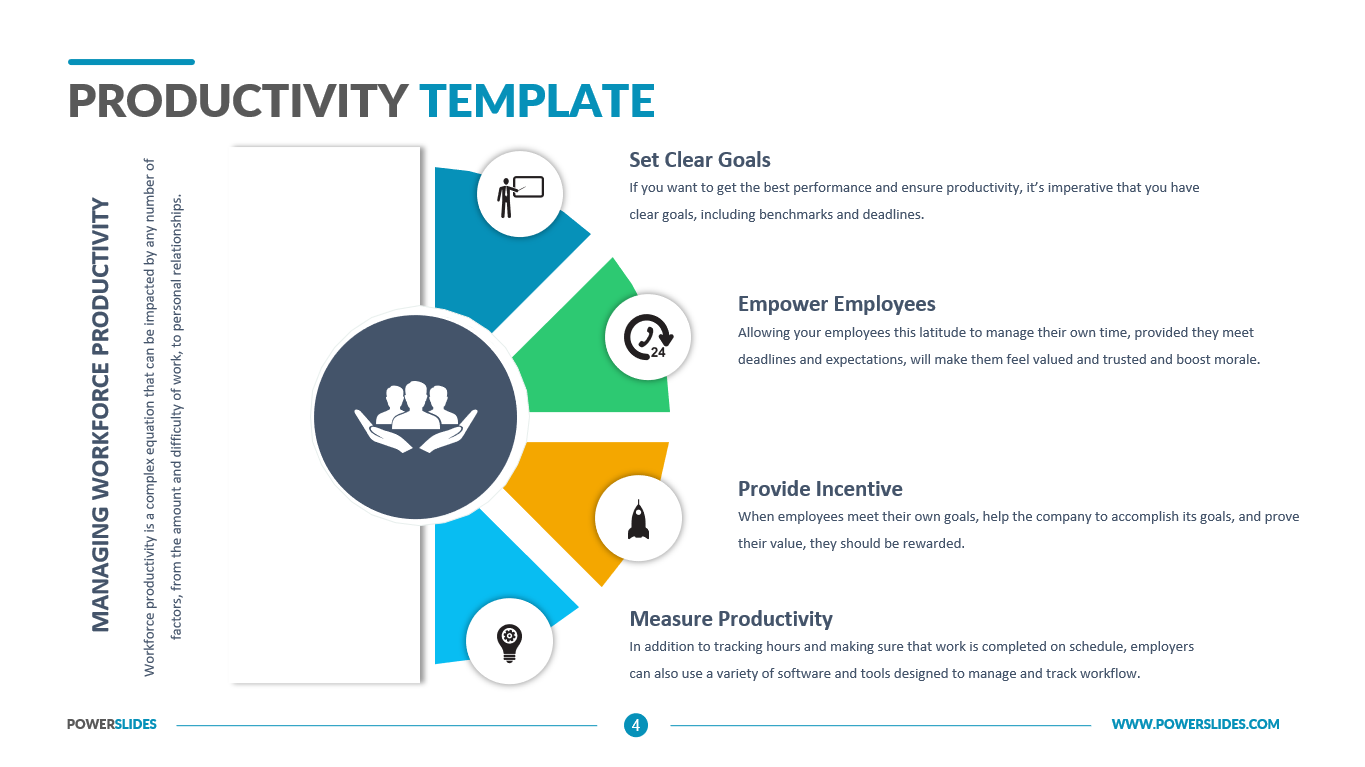
Many factors can affect productivity growth. These include technological improvements, economies of scale and scope, workforce skills, management practices, changes in other inputs (such as capital), competitive pressures and the stage of the business cycle. Productivity has been the driver of long term improvements in living standards.
Productivity growth has been one of the primary drivers of increasing living standards. The more goods and services a society can produce with a given set of inputs, the greater the material standard of living of that society. In terms of how this affects ordinary citizens on a day‑to‑day basis, the most noticeable effects will be more leisure, greater number of market goods and services, lower labour cost of goods and services.
Usually, the growth in labour productivity exceeds the growth in multifactor productivity. The additional contribution comes from capital deepening. That is, the accumulation of more and better capital equipment over time helps to make people more productive.
The output of simple businesses can sometimes be measured in physical units, such as the number of shoes or tons of steel. However, when thinking about entire industries or the economy as a whole, the range of different outputs need to be added together.
While productivity growth rates can be compared readily across countries, productivity level comparisons require estimates of relative prices across countries. To ensure labour productivity levels are comparable between countries, output is converted to US dollars per hour worked based on exchange rates at purchasing power parity.
Increase your productivity and you can generate higher profits — or charge lower prices and take customers away from your competitors. On the other hand, if your productivity declines or increases more slowly than competitors, you may be unable to operate profitably or suffer from sluggish growth.
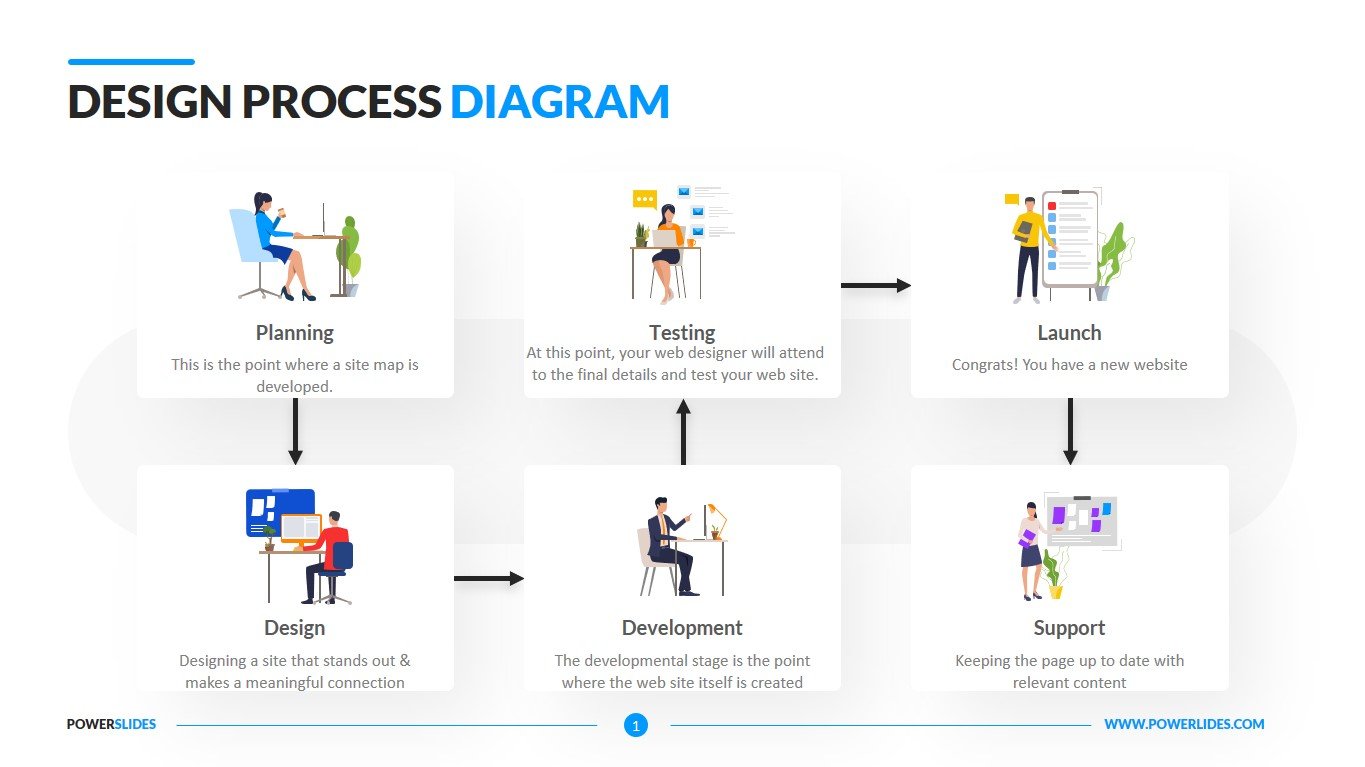
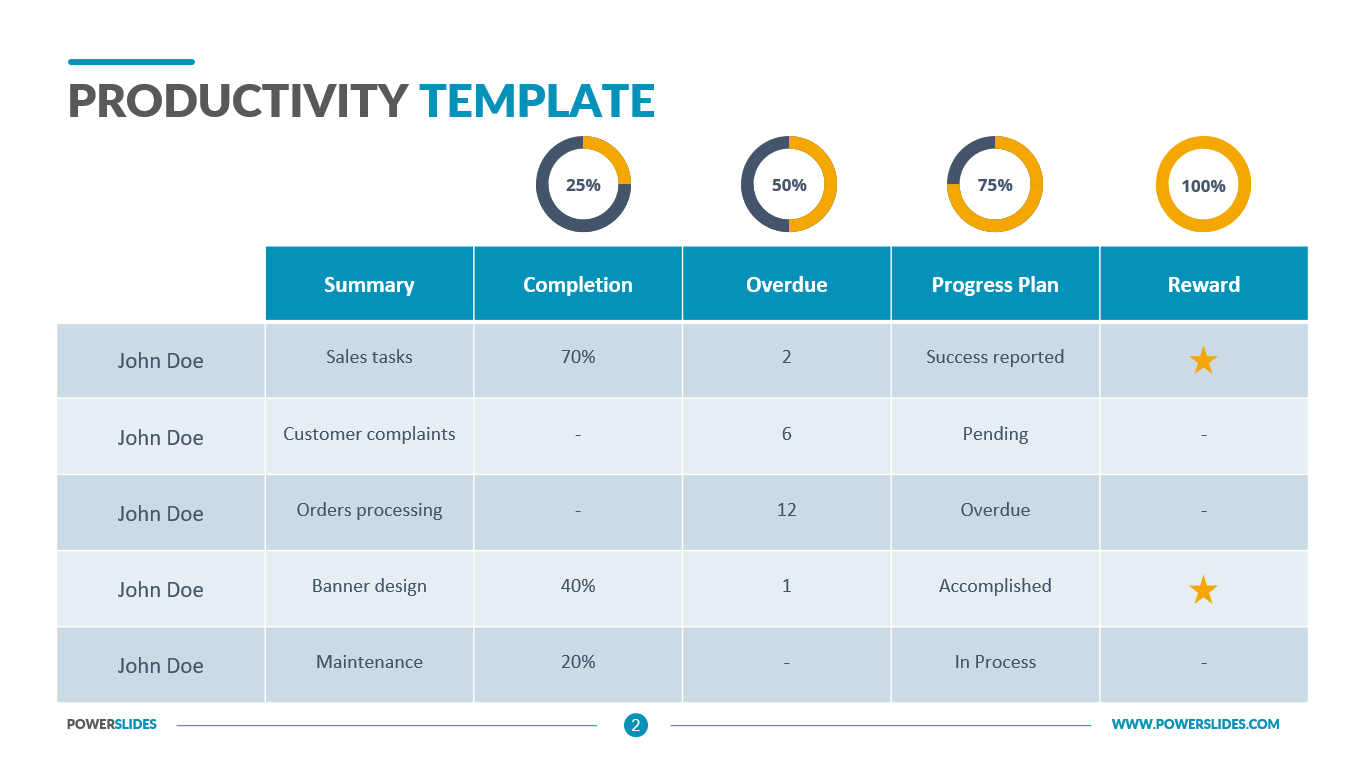
Economists and financiers can use the slides in this template when preparing cost reporting. You can describe in detail how the productivity of work affects the final cost of production and what activities are needed to increase productivity.
Engineers can use the slides in this template when upgrading production lines or purchasing new equipment. You can provide data on the increase in productivity after the installation of new equipment.
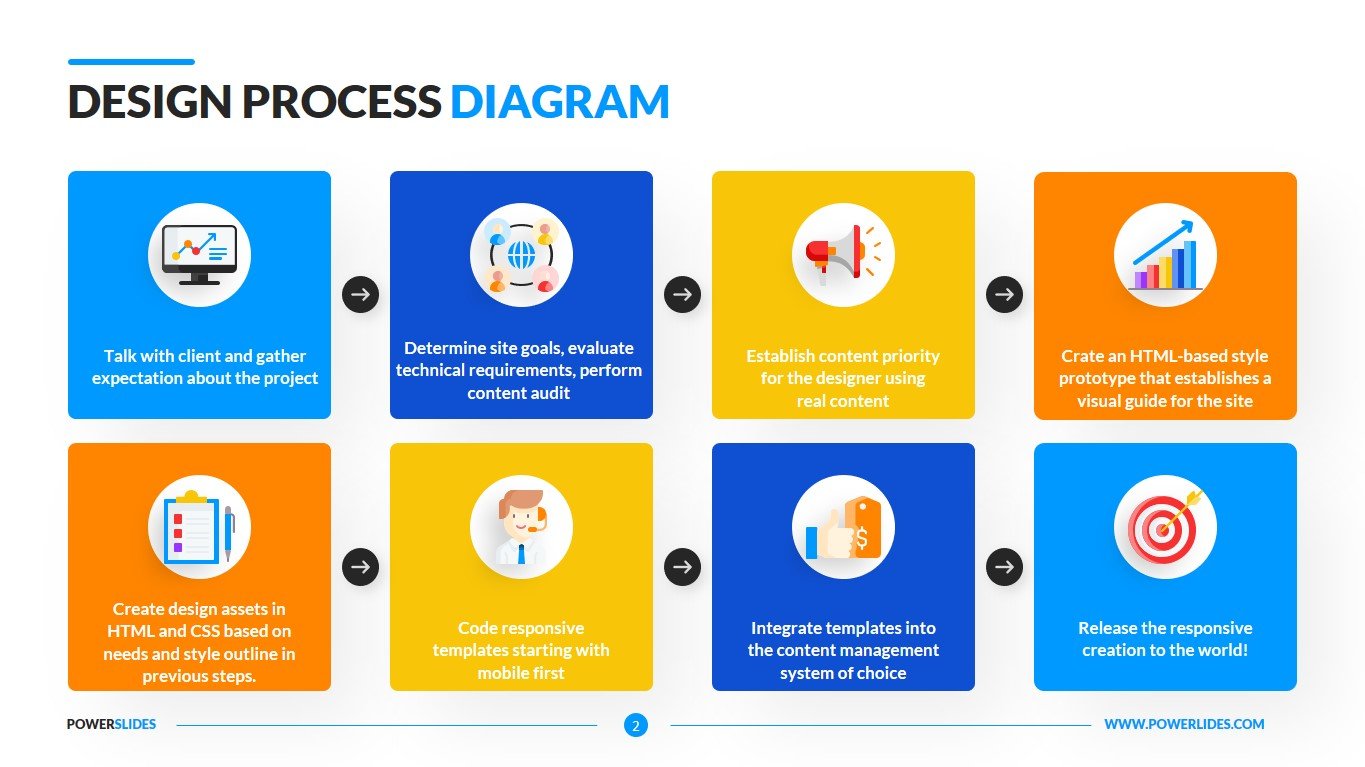
University professors can use the slides in this template to prepare courses on cost reduction or production upgrades. Company executives can use the slides from this template in preparation for a strategy session with company shareholders.
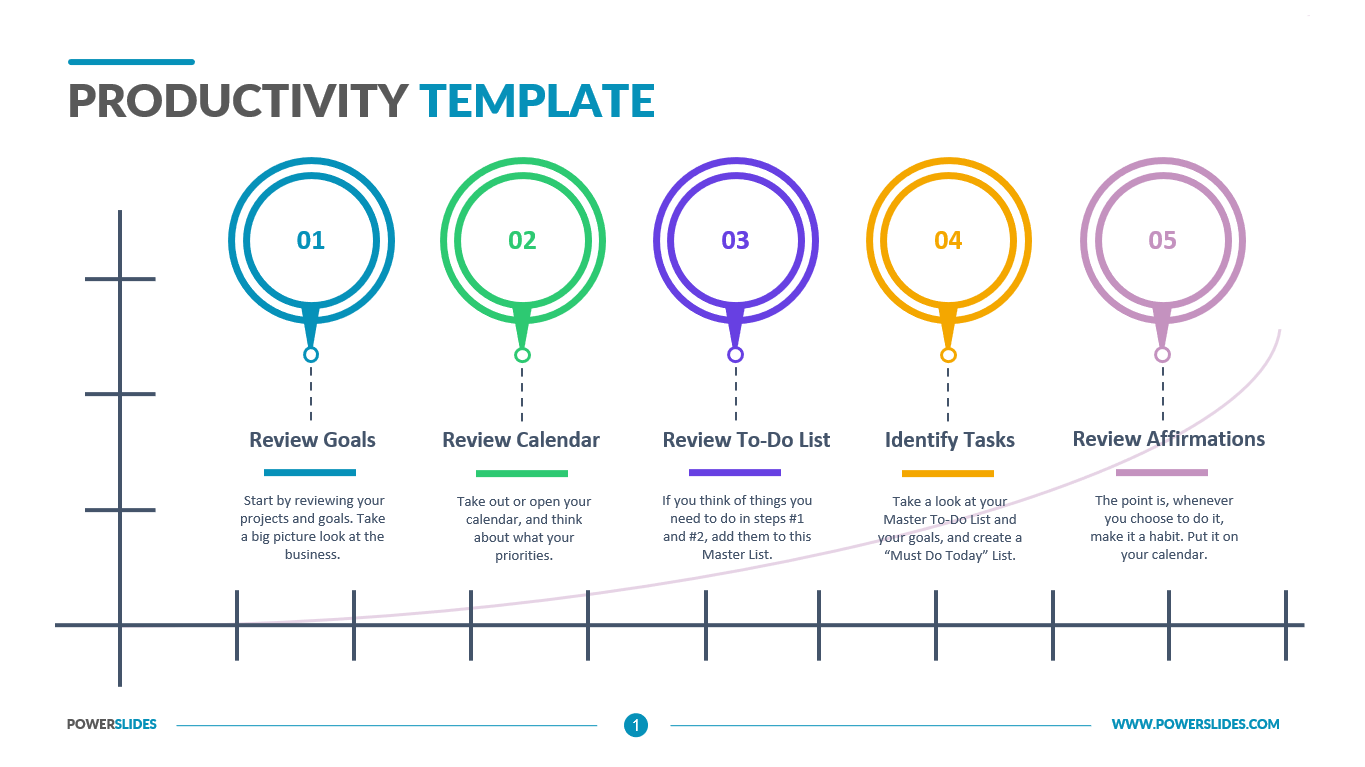
Productivity Template is a professional and modern template that contains four stylish and fully editable slides. You can independently change the type and size of the font, color and position of the infographic. This template will be useful for business executives, financiers and economists. The Productivity Template will complement your old presentations and will be a worthy addition to your collection of professional presentations.


