Call Center KPIs
What do you think of this template?

 (3.00/ 5)
24 ratings

 4 Slides
 File size: 16:9
 Fonts: Lato Black, Calibri
 Supported version
PPT 2010, PPT 2013, PPT 2016
Supported version
PPT 2010, PPT 2013, PPT 2016

Product details
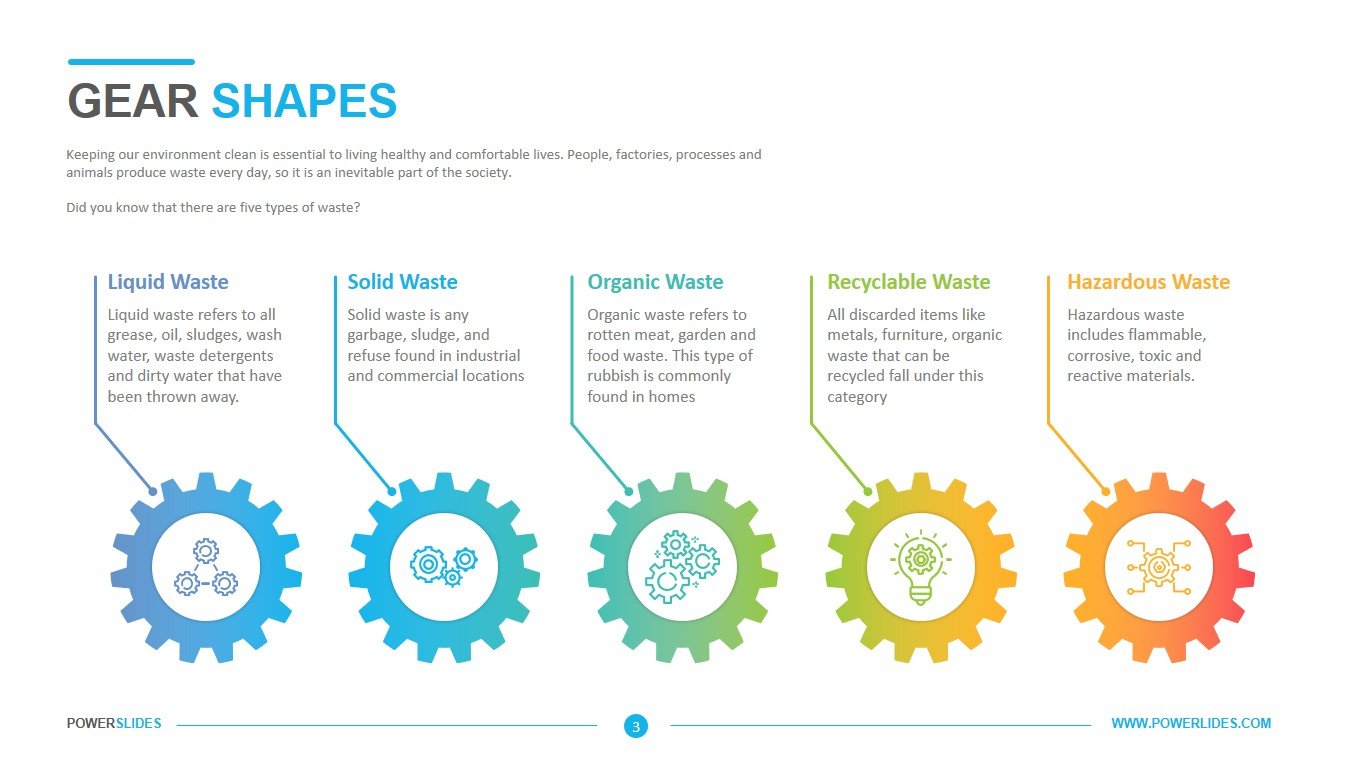
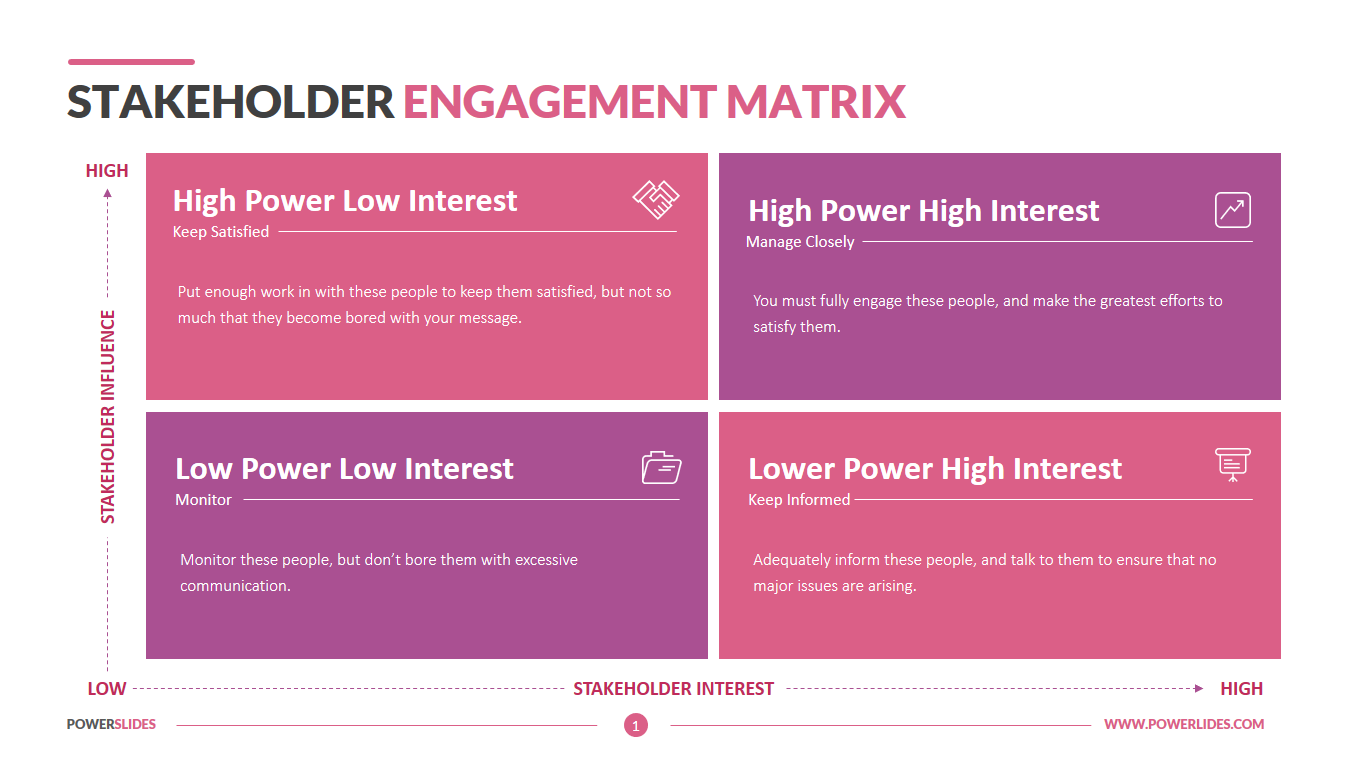
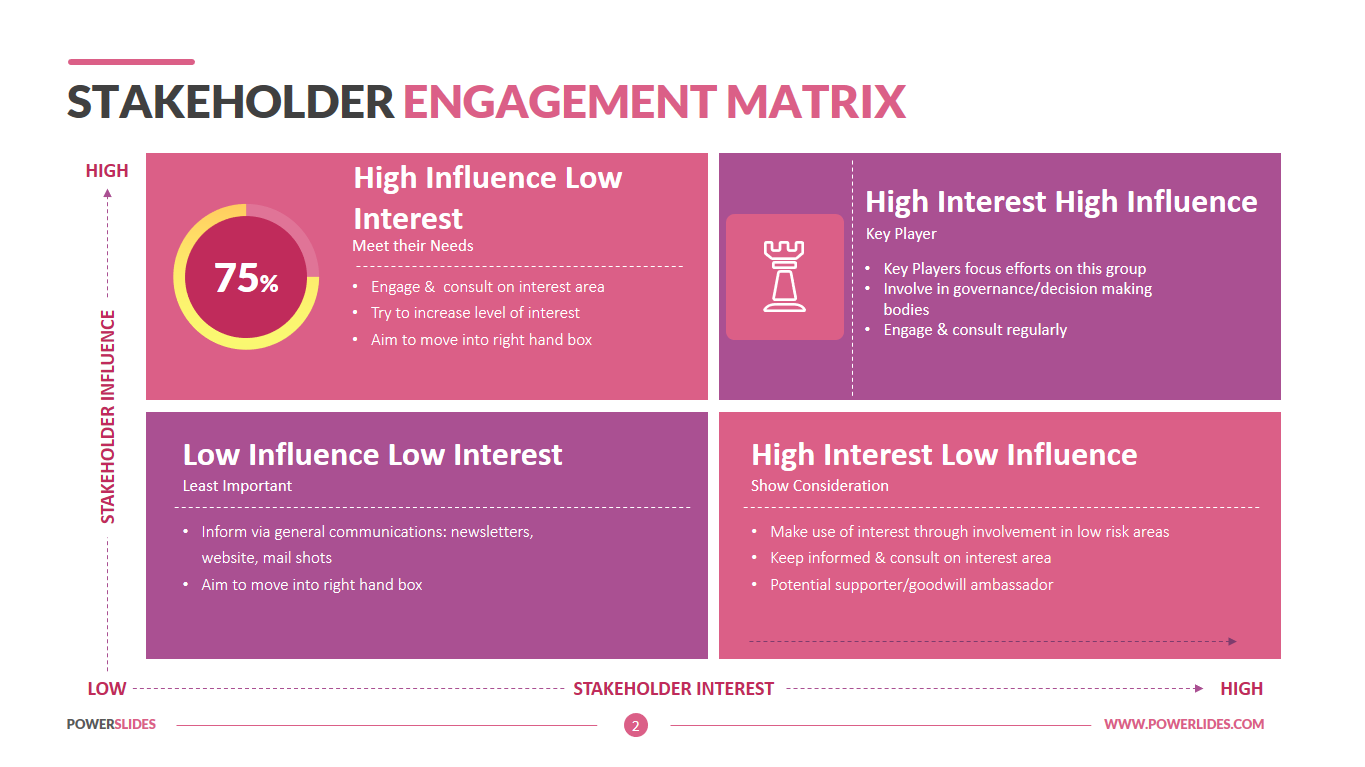
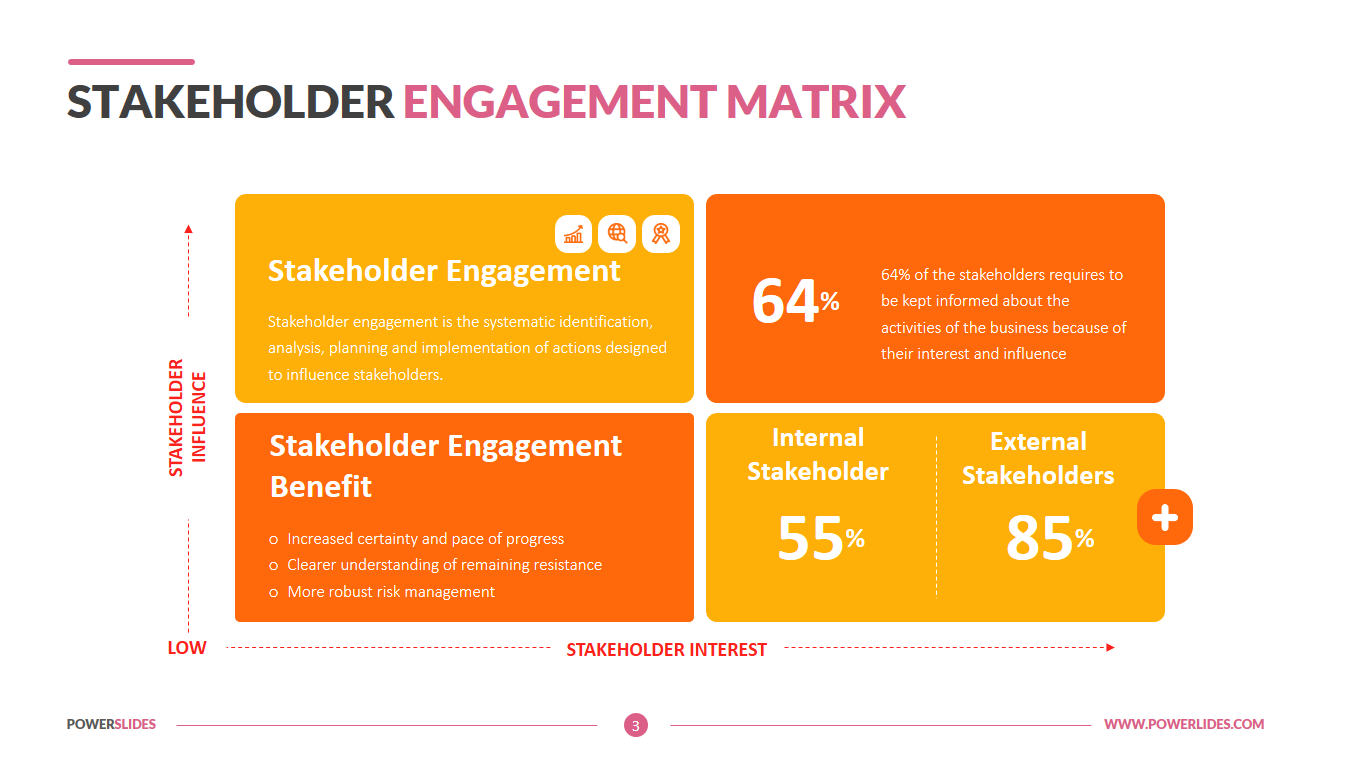
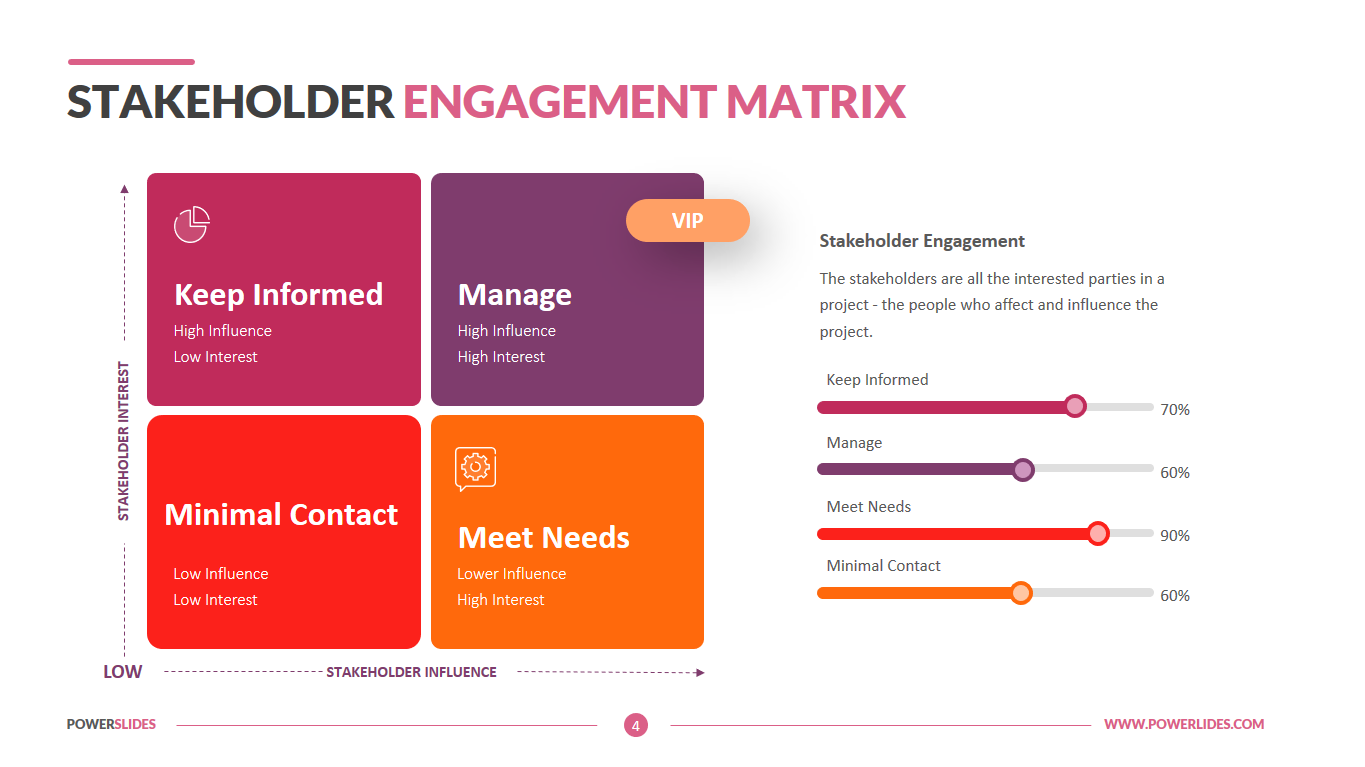
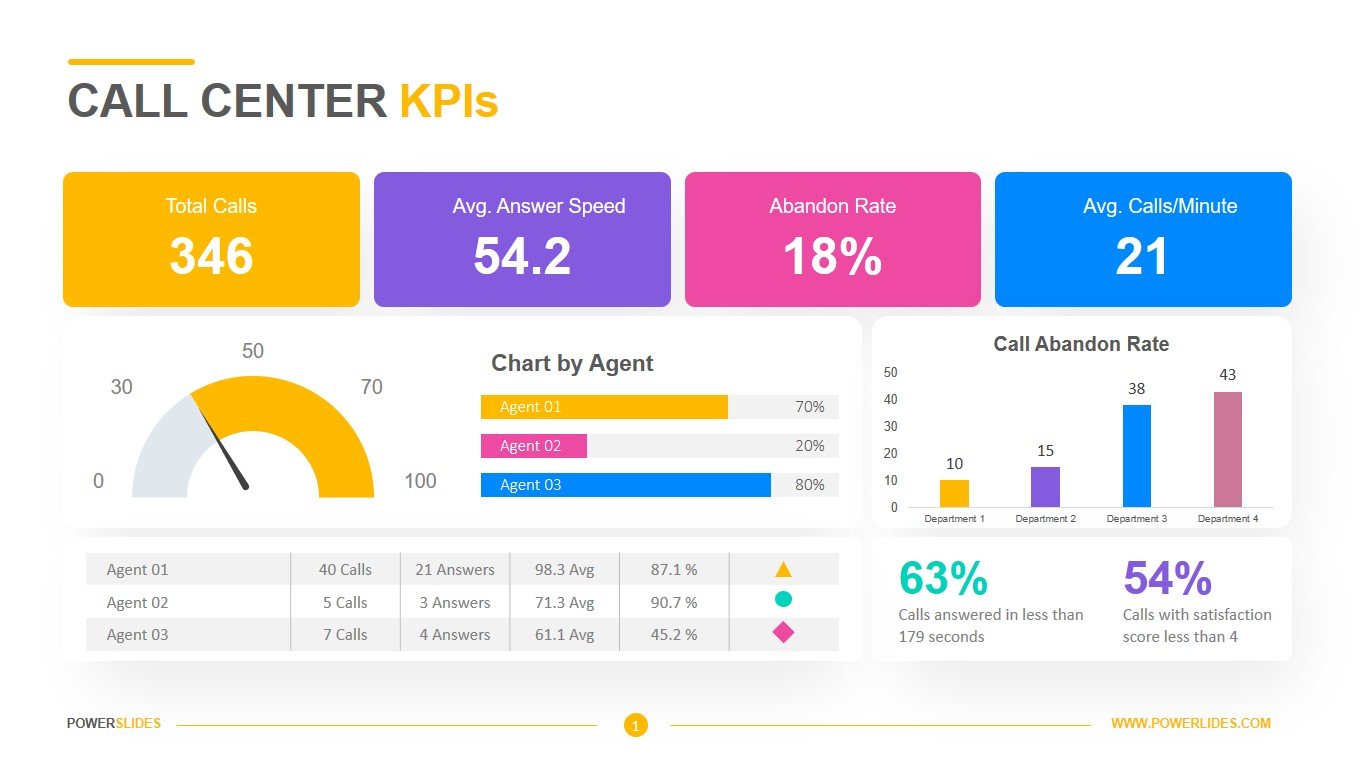
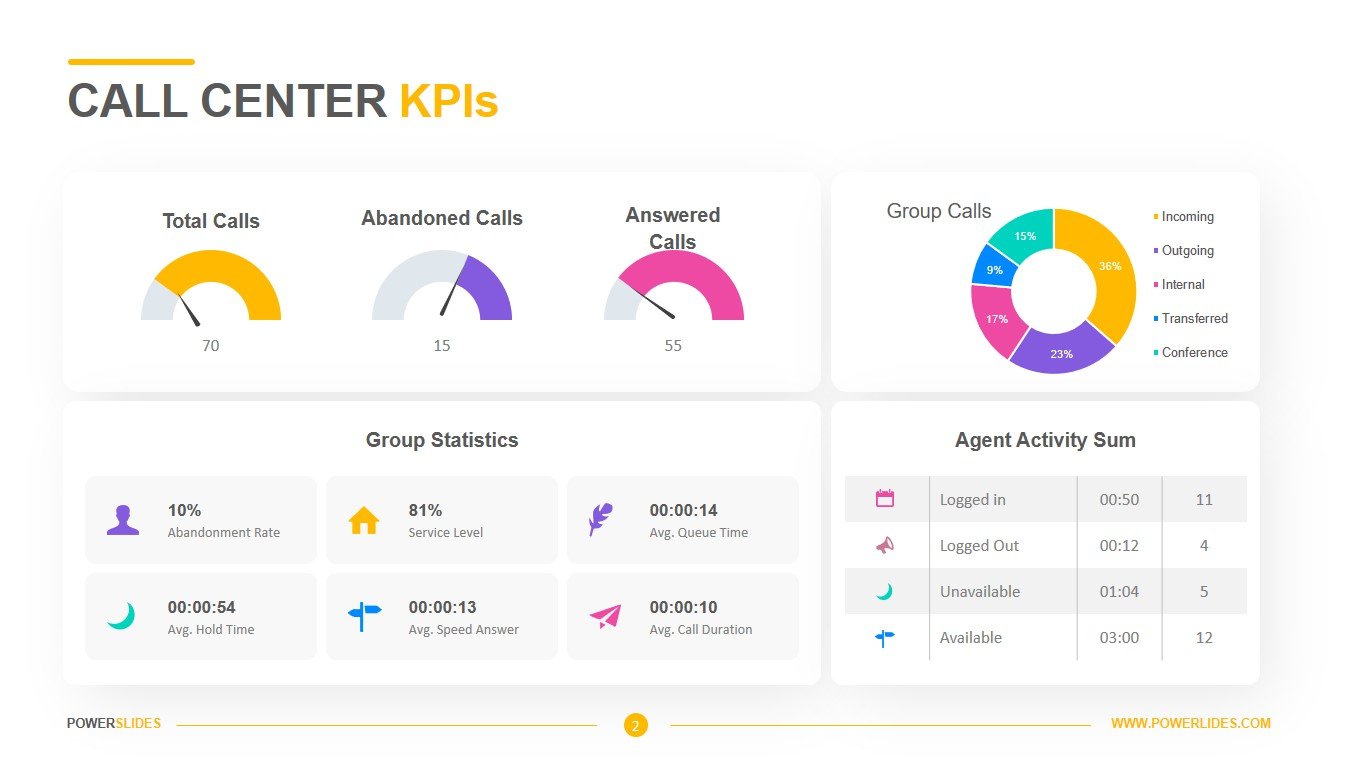
A Key Performance Indicator (KPI) is a measurable value, or values, that demonstrates how effectively a company, department, team, or individual is achieving business goals. Depending on what you’re wanting to monitor, and what industry you’re in, the KPIs that are relevant to you will change; an ER intake nurse in a hospital will need to monitor measurables that are very different from those of a CFO of a multinational Not-For-Profit. Your call center operates in a stressful environment where you need to manage thousands of calls each hour while maintaining a high standard of customer services. To do this effectively, you need to be dialed into the latest metrics and KPIs such as current service level, call volume and call resolution rates. Use these call center KPIs and metrics to track your performance through the busiest and most hectic days. The Active Waiting Calls metric gives both you and your team a view into how many calls are currently in the queue. The Longest Call Hold metric displays both the target hold time and the longest hold time to date. Managers monitoring the longest hold time can take steps to ensure that customer loyalty does not fall due to exorbitant wait times and alter the call agent numbers so there are more employees available to handle calls. Peak Hour Traffic helps managers identify when the busiest hour of traffic is. This allows them to prepare and schedule enough call agents to handle the boom in calls during a specific time. The Revenue per Successful Call metric lets your team know just how much revenue they are bringing into the company for a single successful call. This metric helps managers plan expected revenue with set targets and current progress, while also giving them a view into how valuable an effective call can be for the team. Average Handle Time metric enables managers to monitor the average amount of time a single call last. Knowing the average handle time helps managers and team members understand the workload, in terms of time, that is required with every customer call.
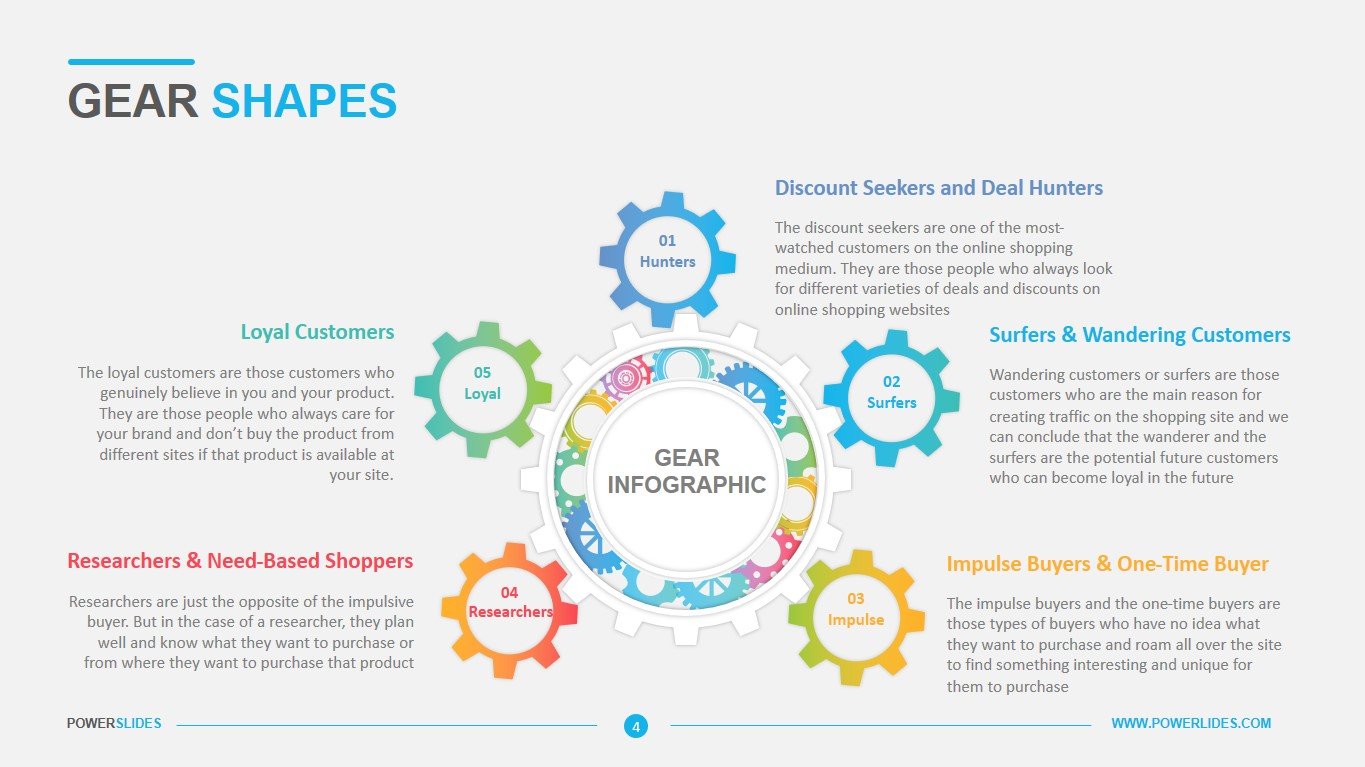
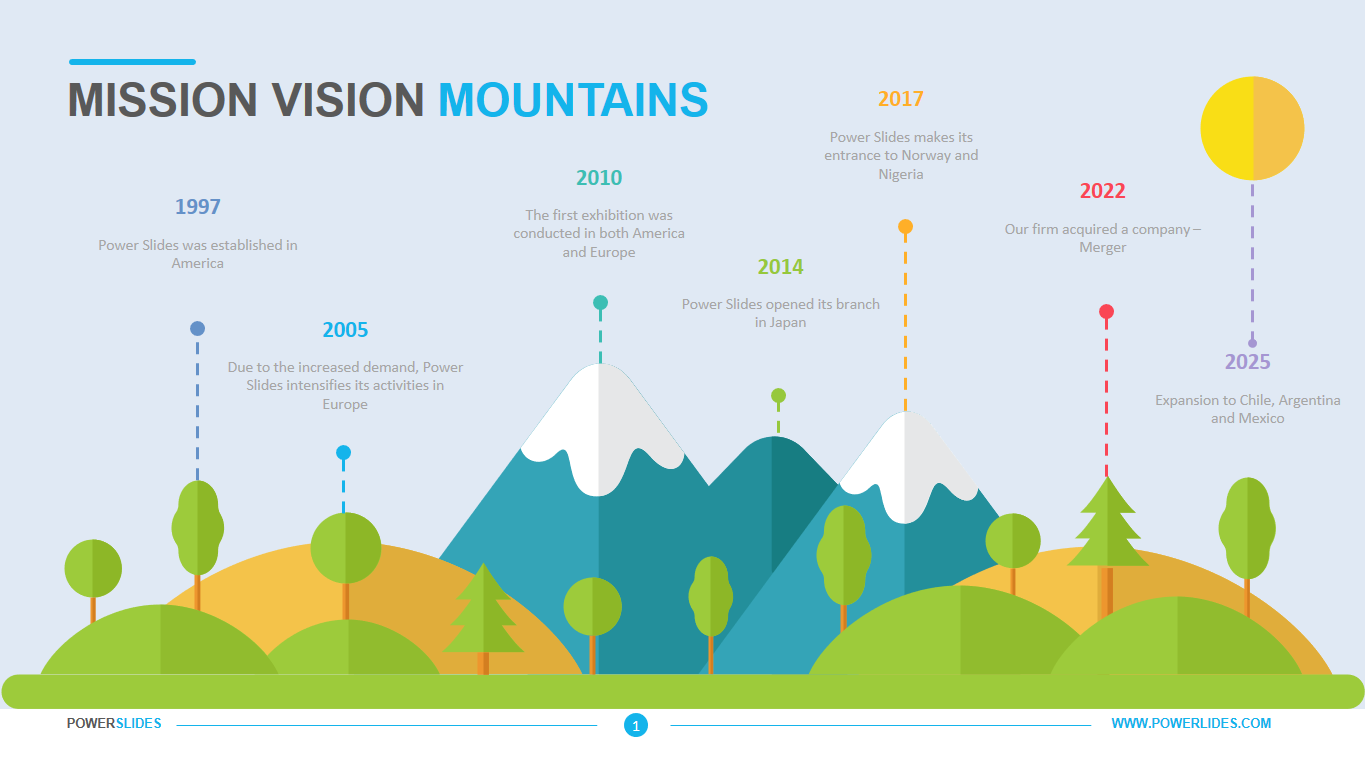
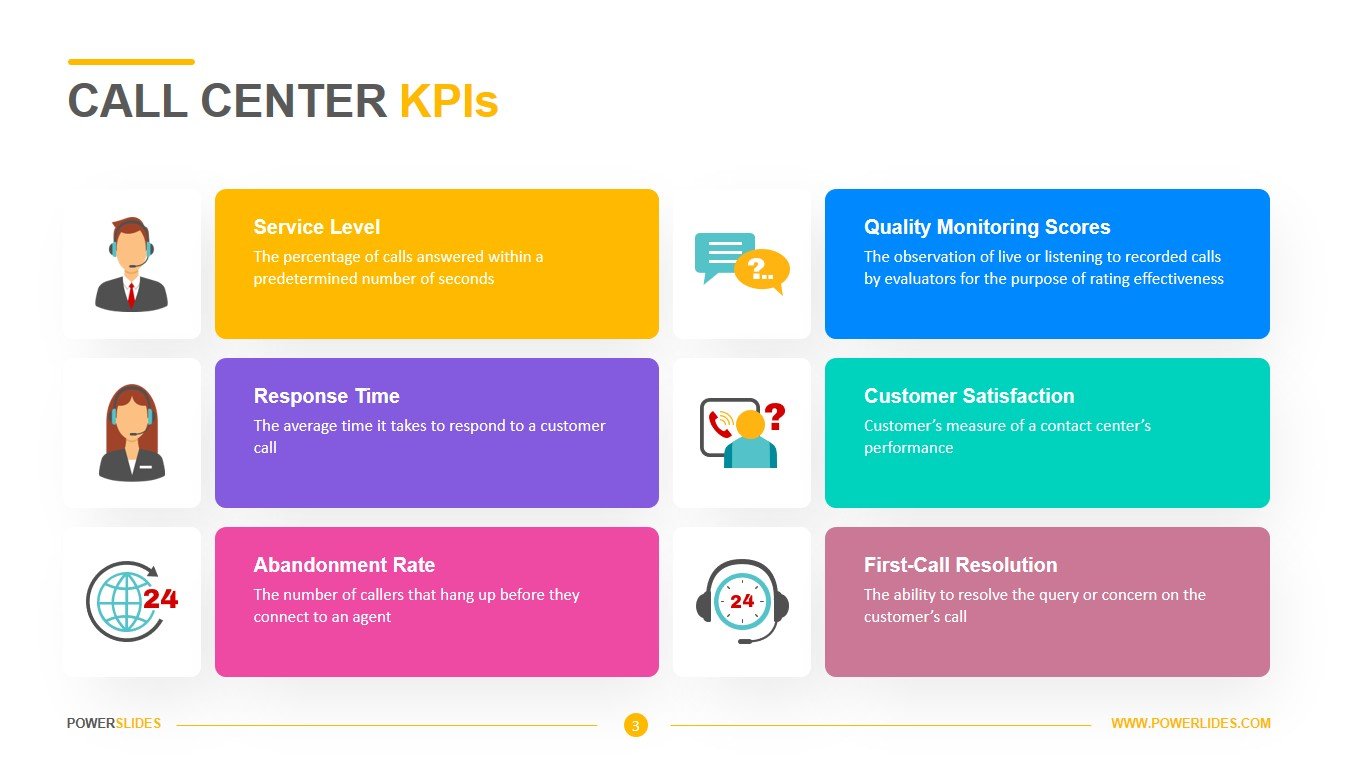
Call Center KPIs template is made in a bright color scheme and uses modern infographics. The first slide of this template contains a huge number of infographics, tables and charts. You can display the most important performance indicators of your company here. For example, you can use this slide to prepare your daily call center report. Also, this slide will be useful for the staff of the department. This slide can also be used by economists and financiers, purchasing managers and logistics managers when preparing a department performance report. The last slide of the template gives you the ability to display up to six different indicators and give a brief description of them. Call Center KPIs template will be useful not only for call center managers, but also for everyone who considers it necessary to implement a KPI system. You can customize the color, size and placement of infographics and text boxes to suit your corporate requirement


