Scales Diagram
What do you think of this template?
 (No Ratings Yet)
 4 Slides
 File size: 16:9
 Fonts: Lato, Calibri
 Supported version
PPT 2010, PPT 2013, PPT 2016
Supported version
PPT 2010, PPT 2013, PPT 2016

Product details
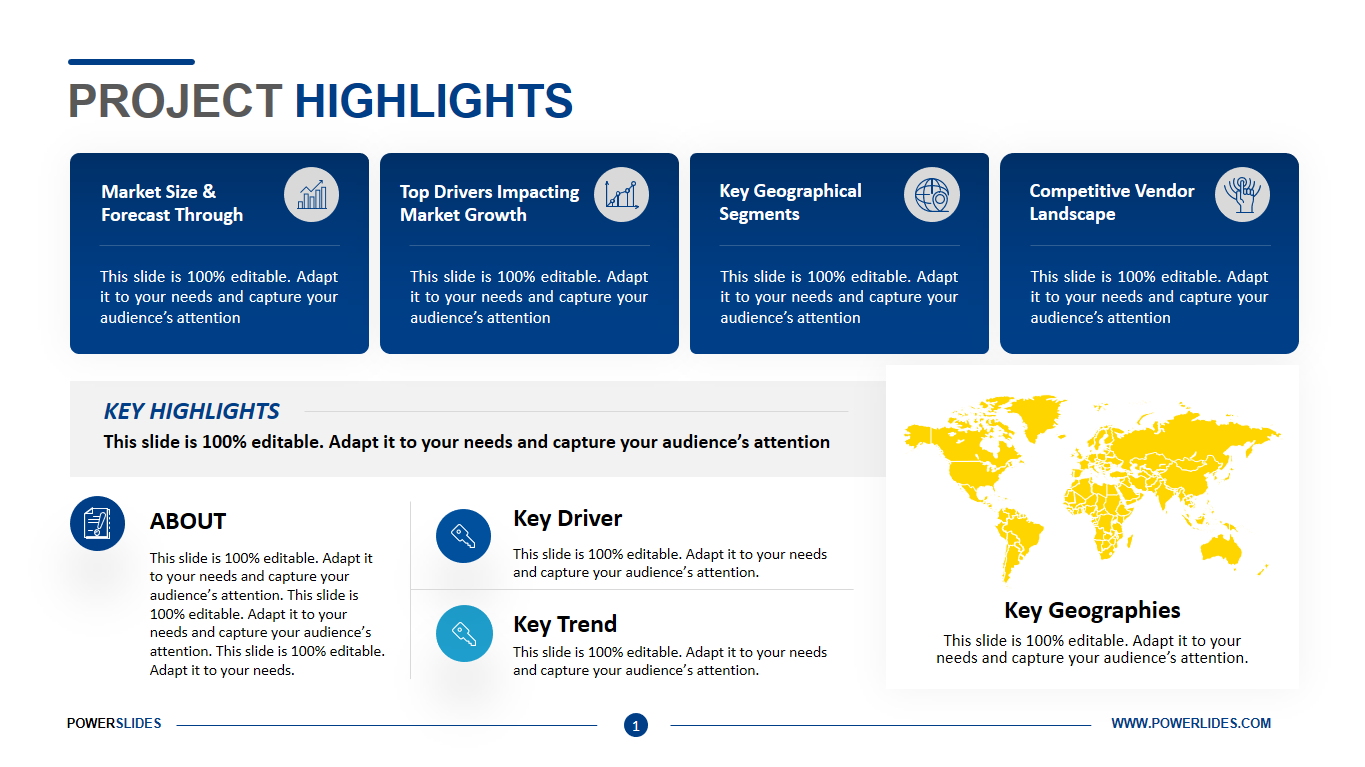
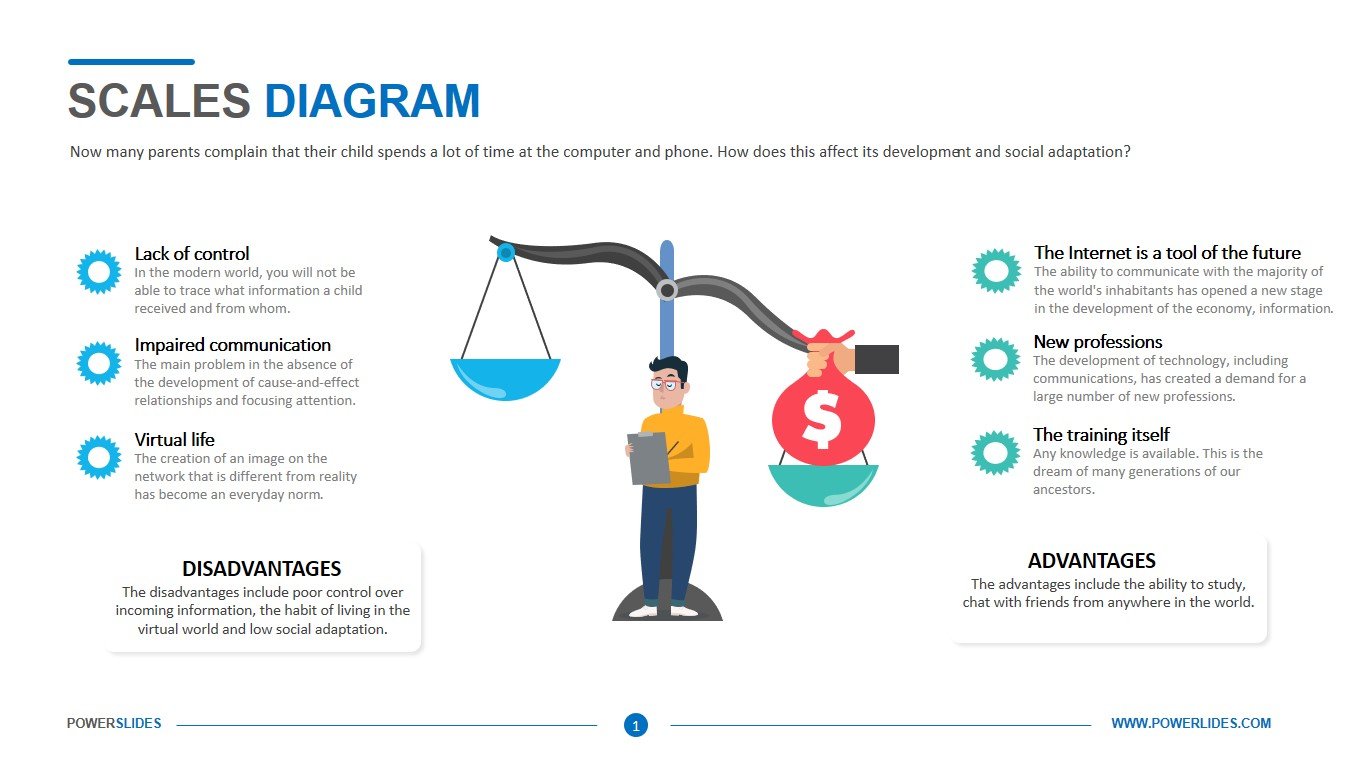
Scales Diagram is the traditional method of evaluating things. Its only purpose is to graphically portray the comparison between two similar or distinctive quantities. Therefore elaborating their benefits and drawbacks in a very simple, comprehensible and interesting manner. For the very reason, Scales Diagram finds great importance in the Corporate sector. Keeping this in view, This Scales Diagram Powerpoint template is the perfect fit for business use. Whether you are proposing a new idea to a client, having internal meetings with your company’s team, estimating industry opportunities or introducing a new product in the market. This Scales Diagram template offers you the flexibility to do everything.
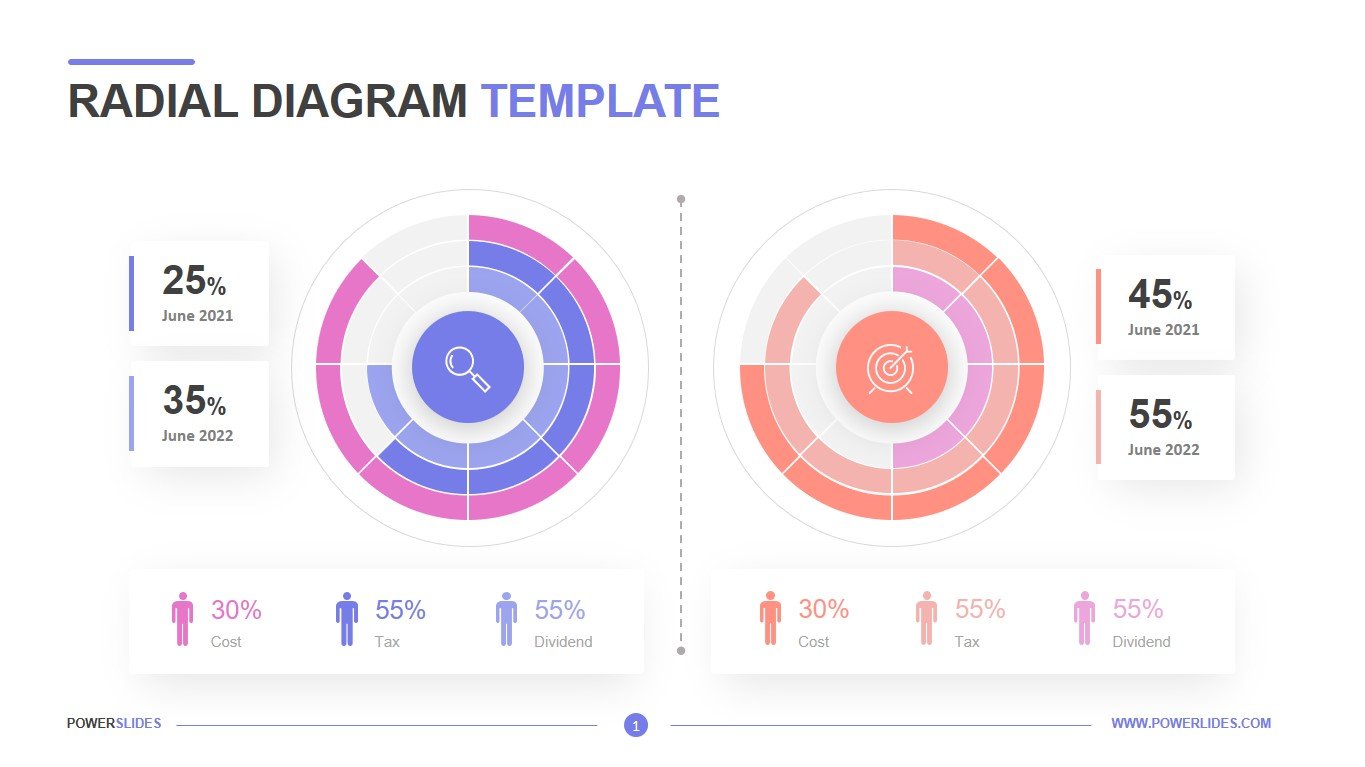
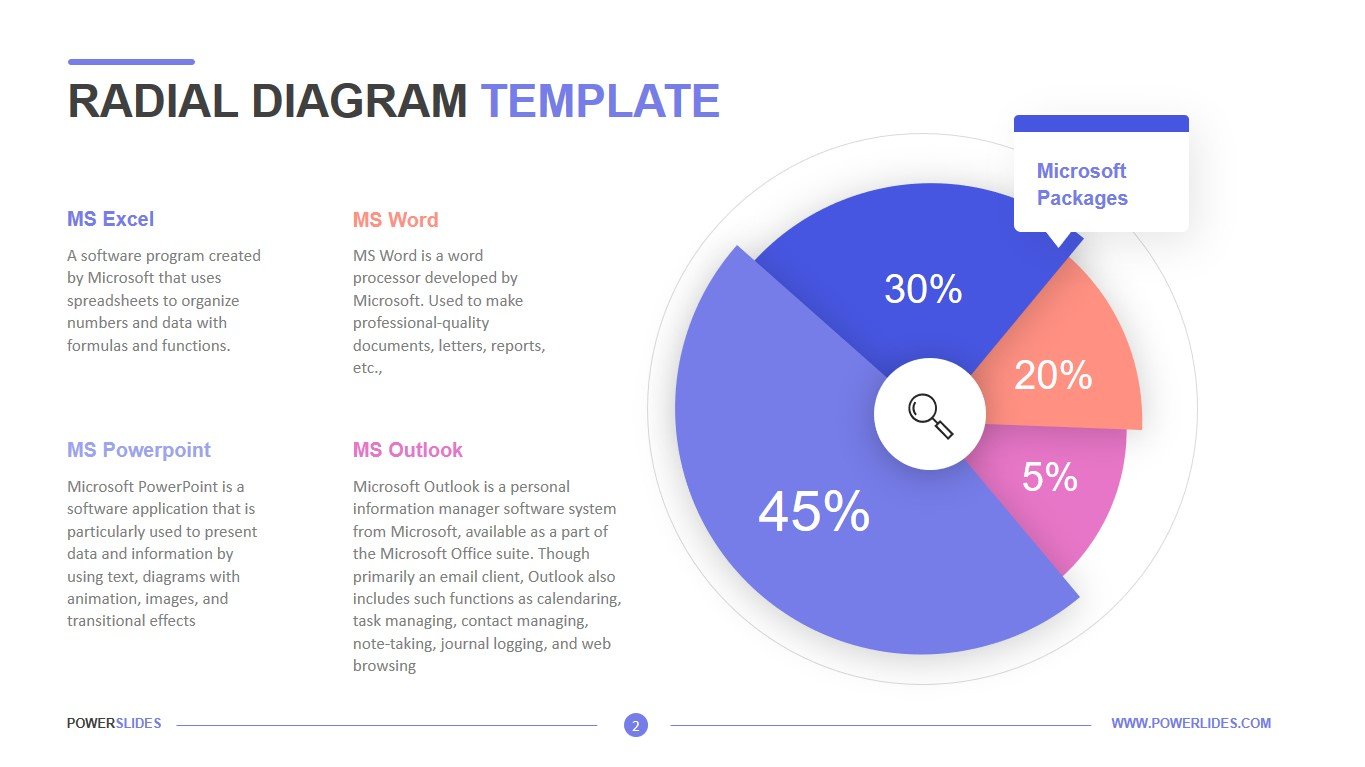
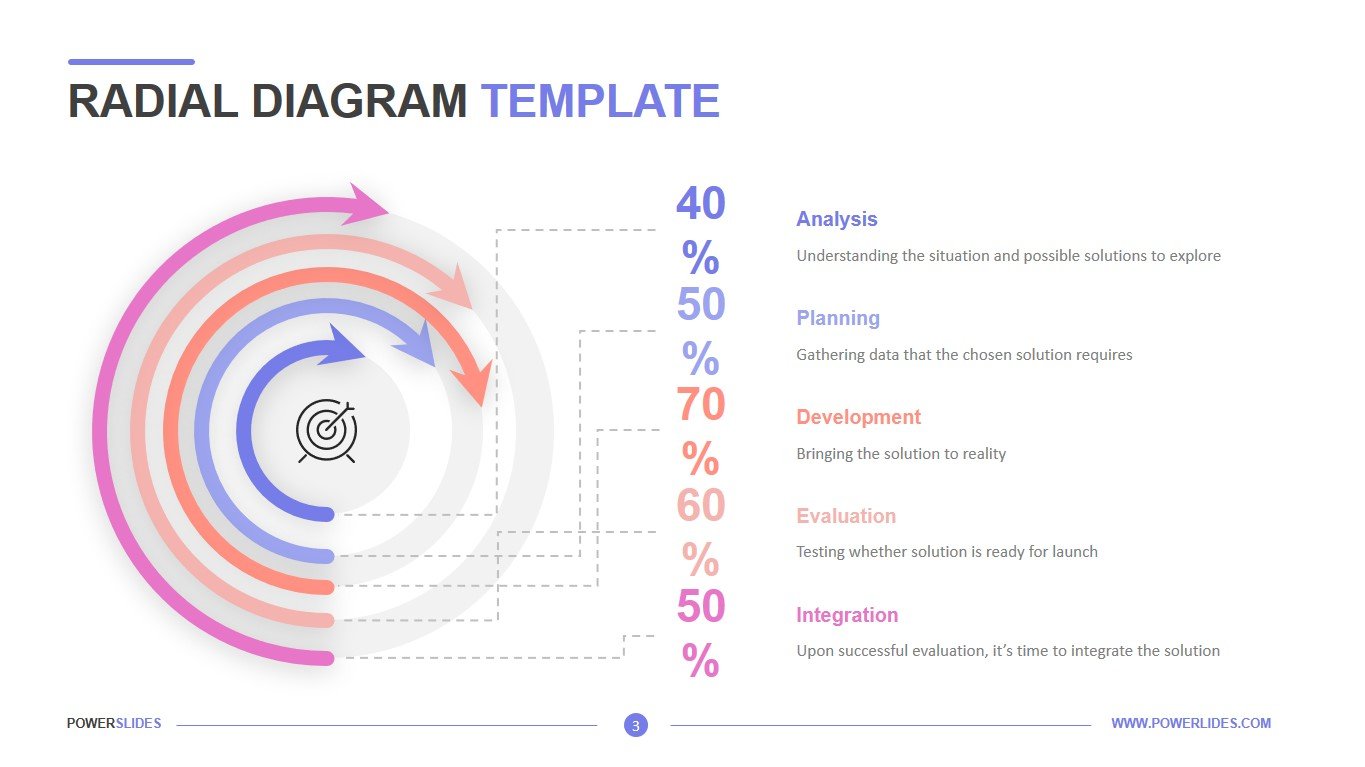
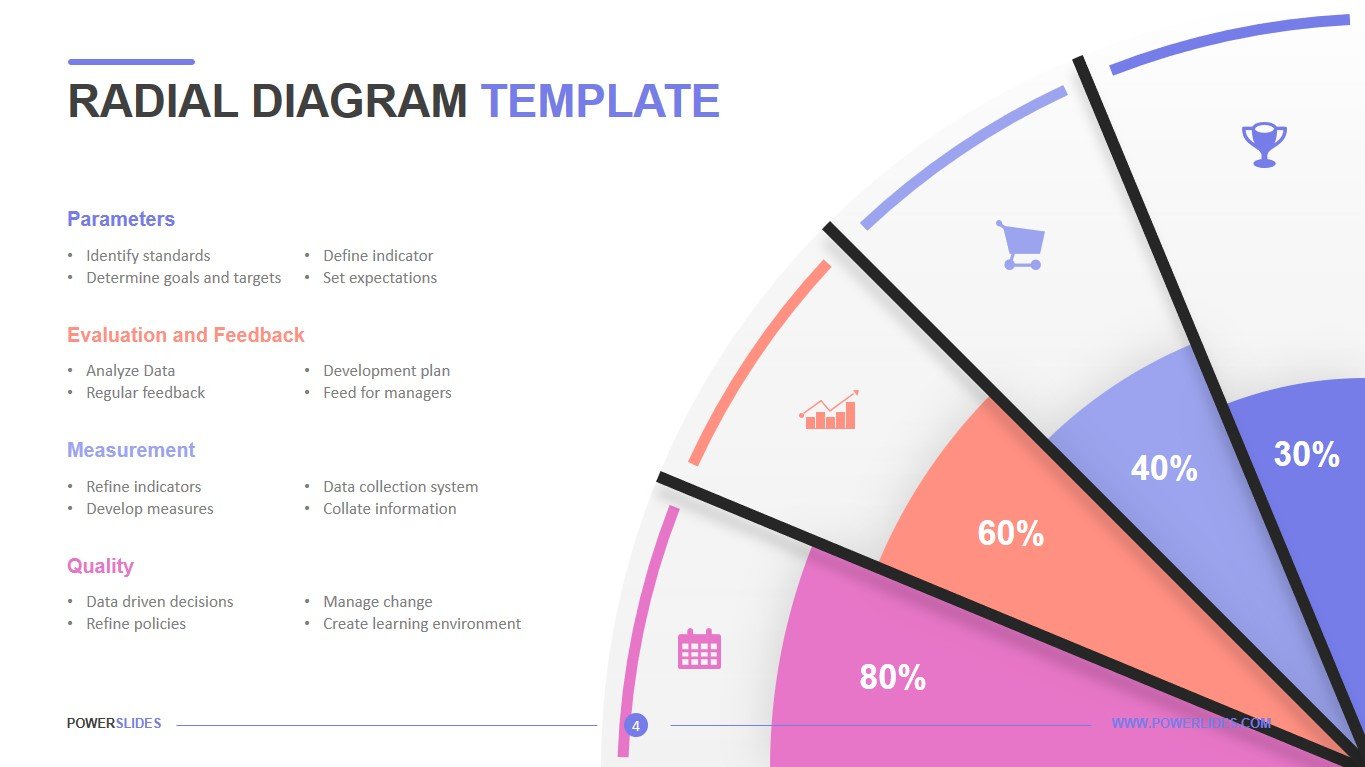
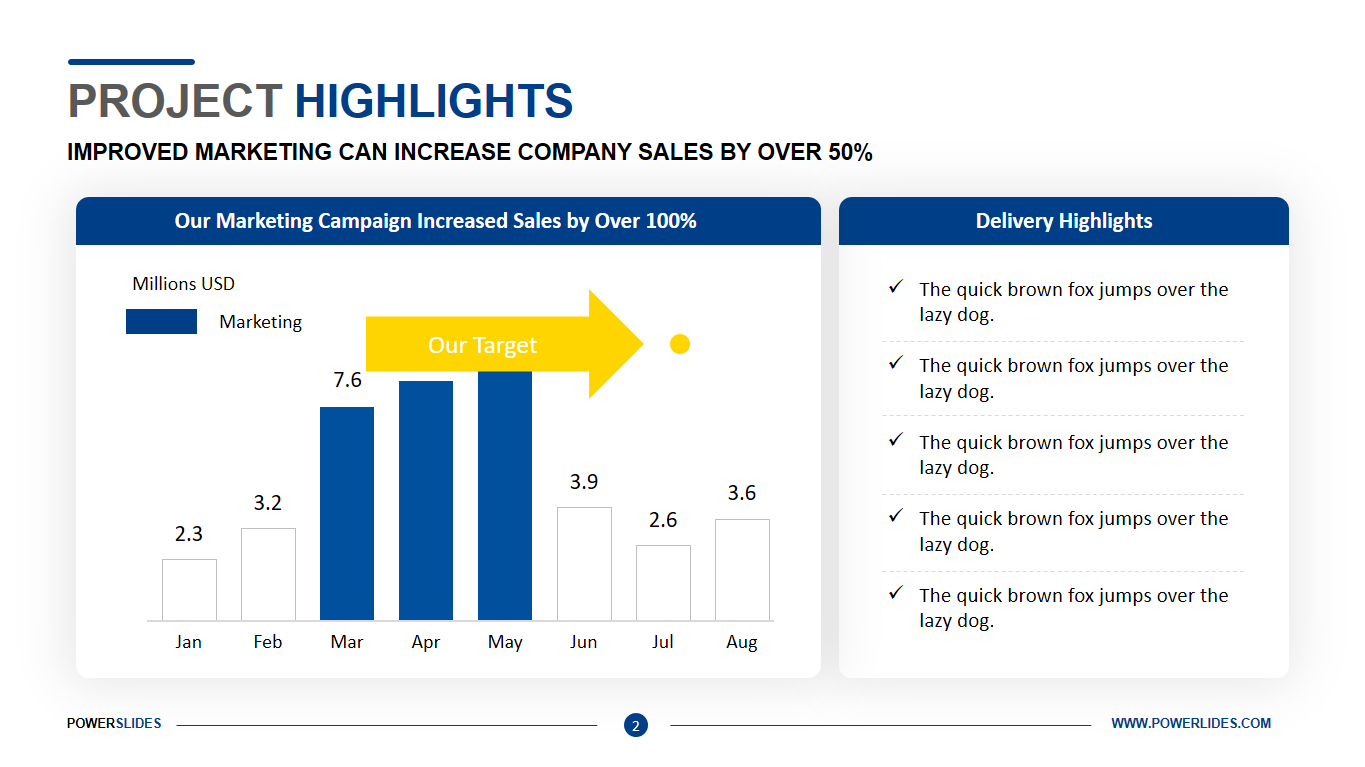
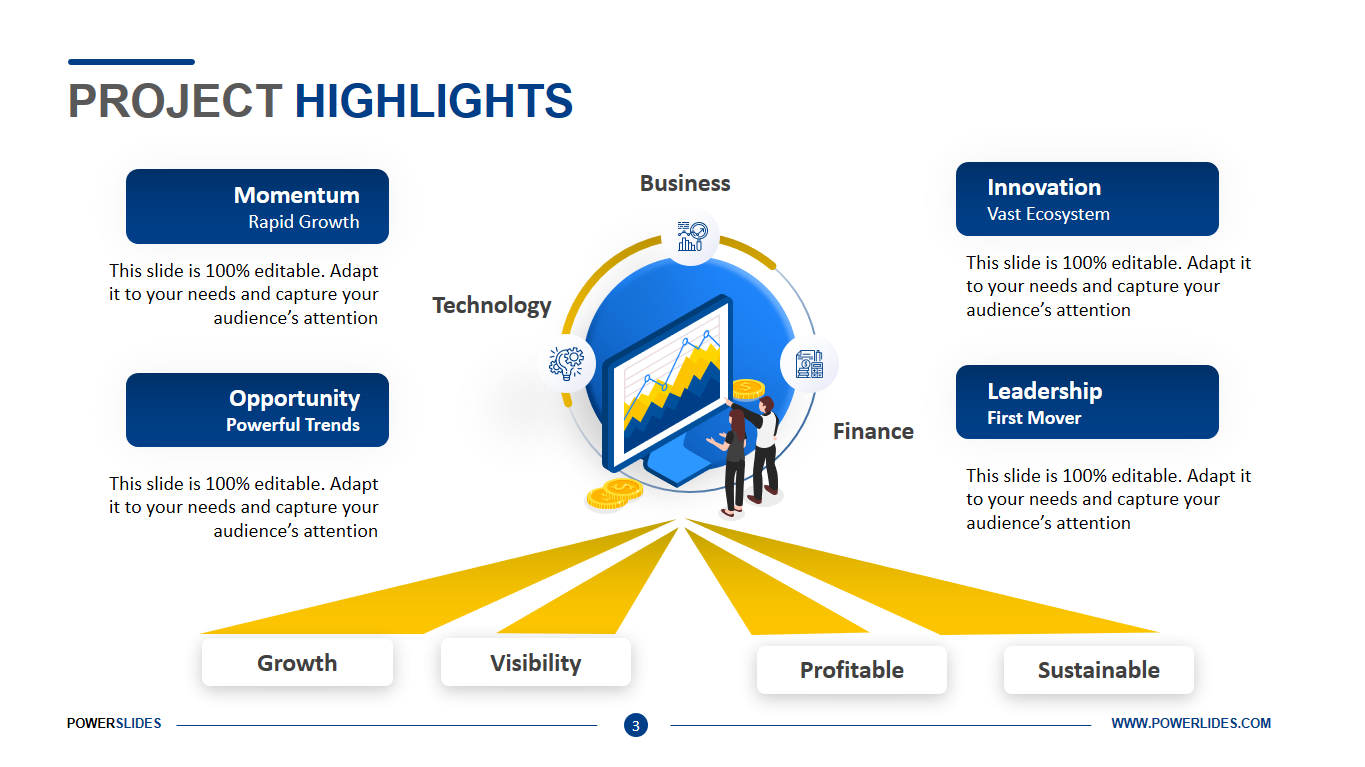
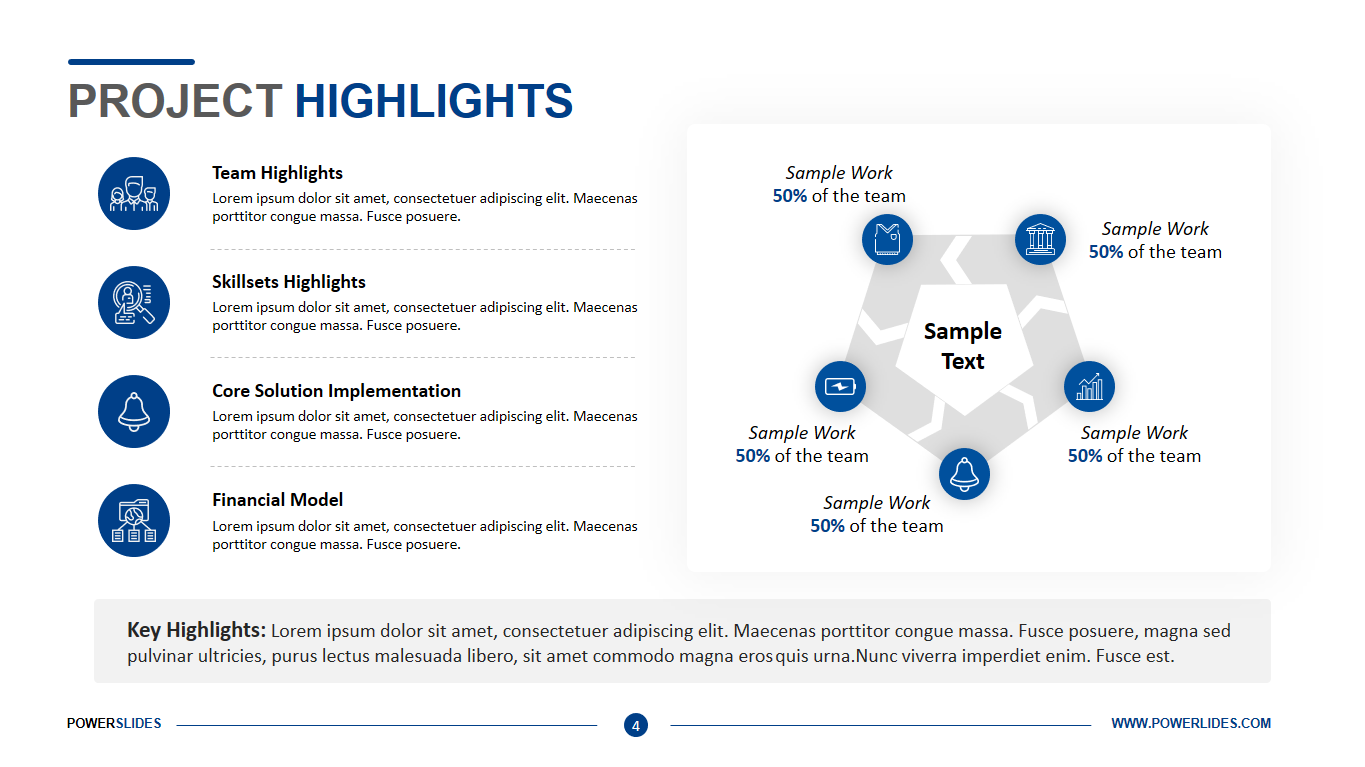
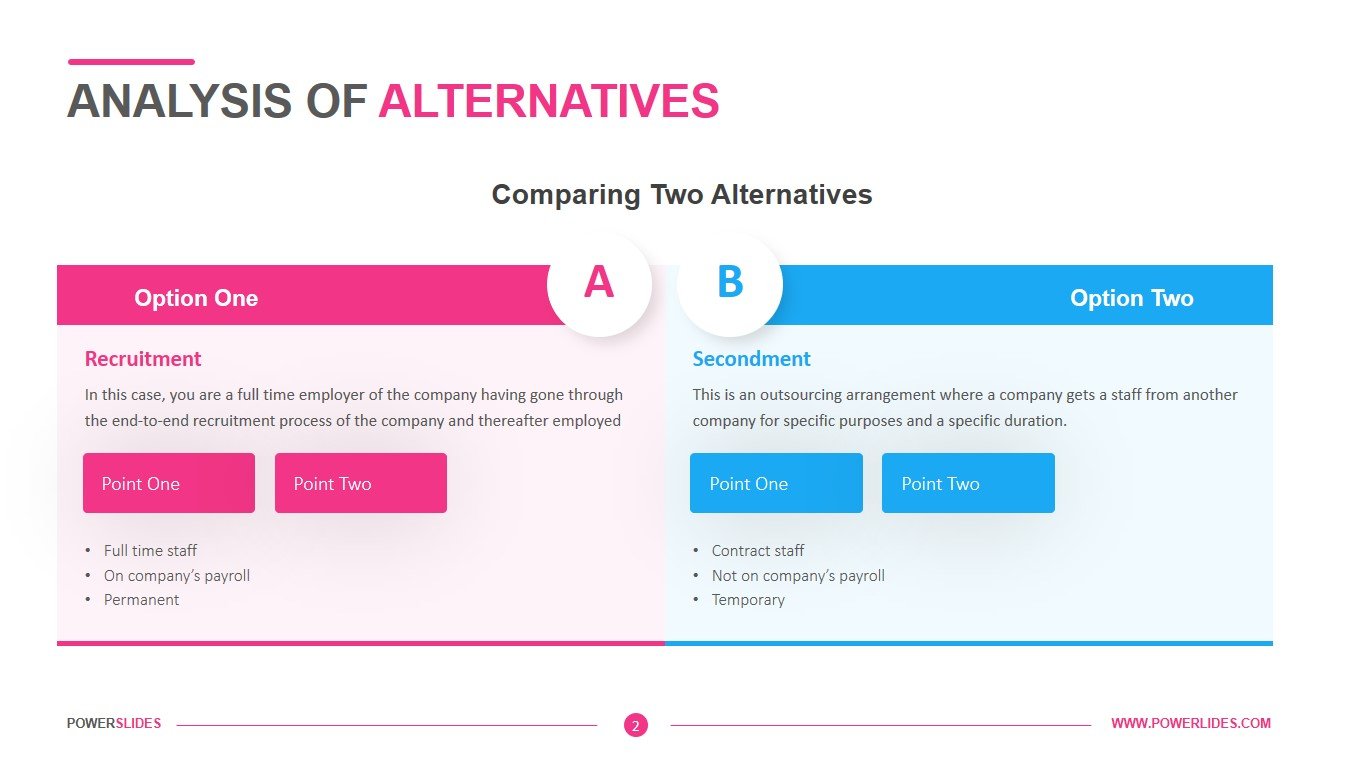
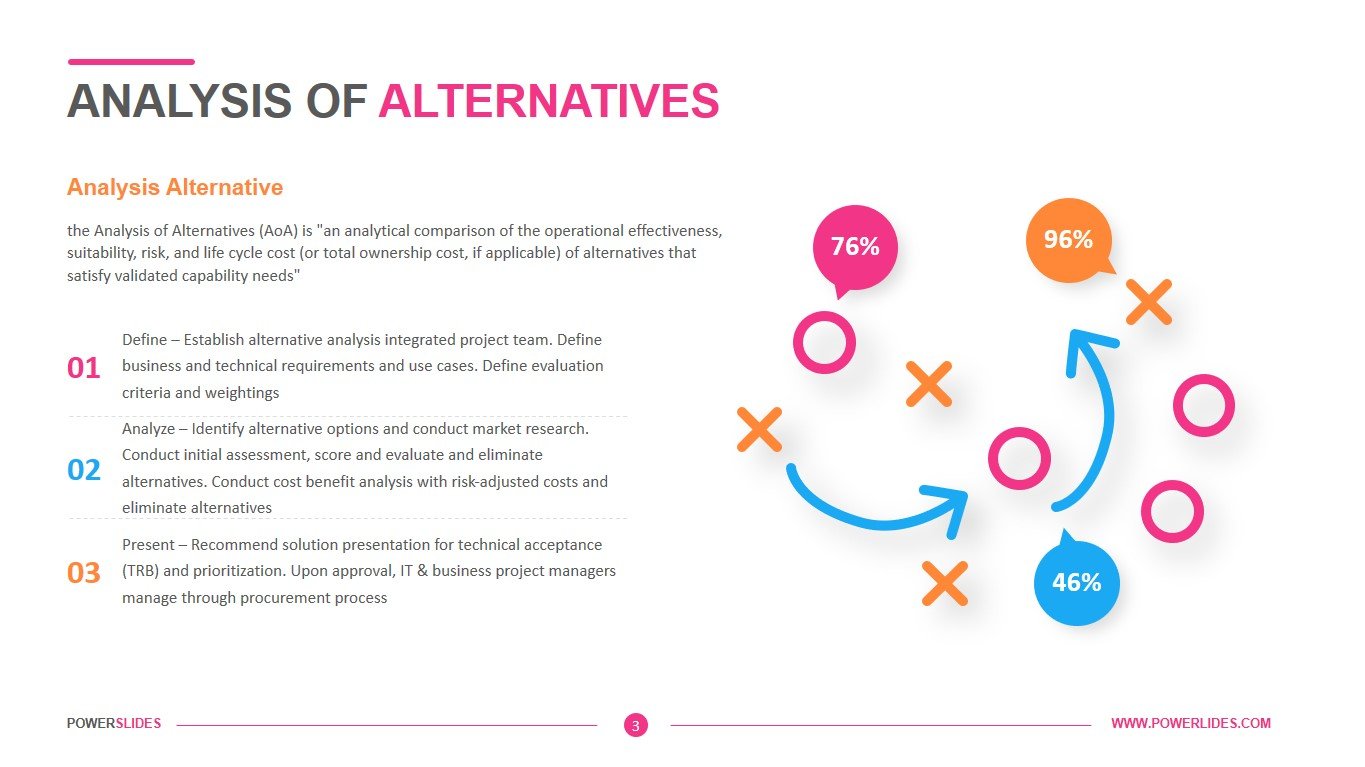
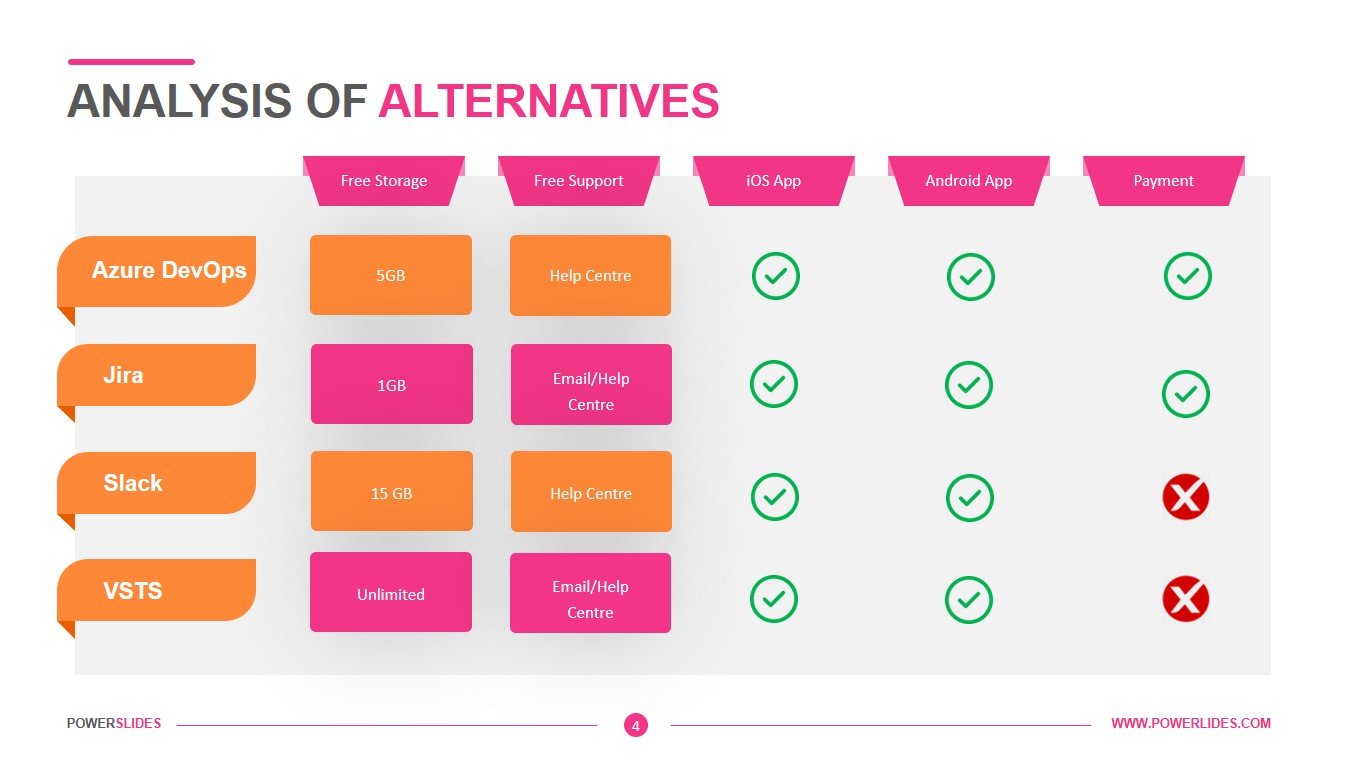
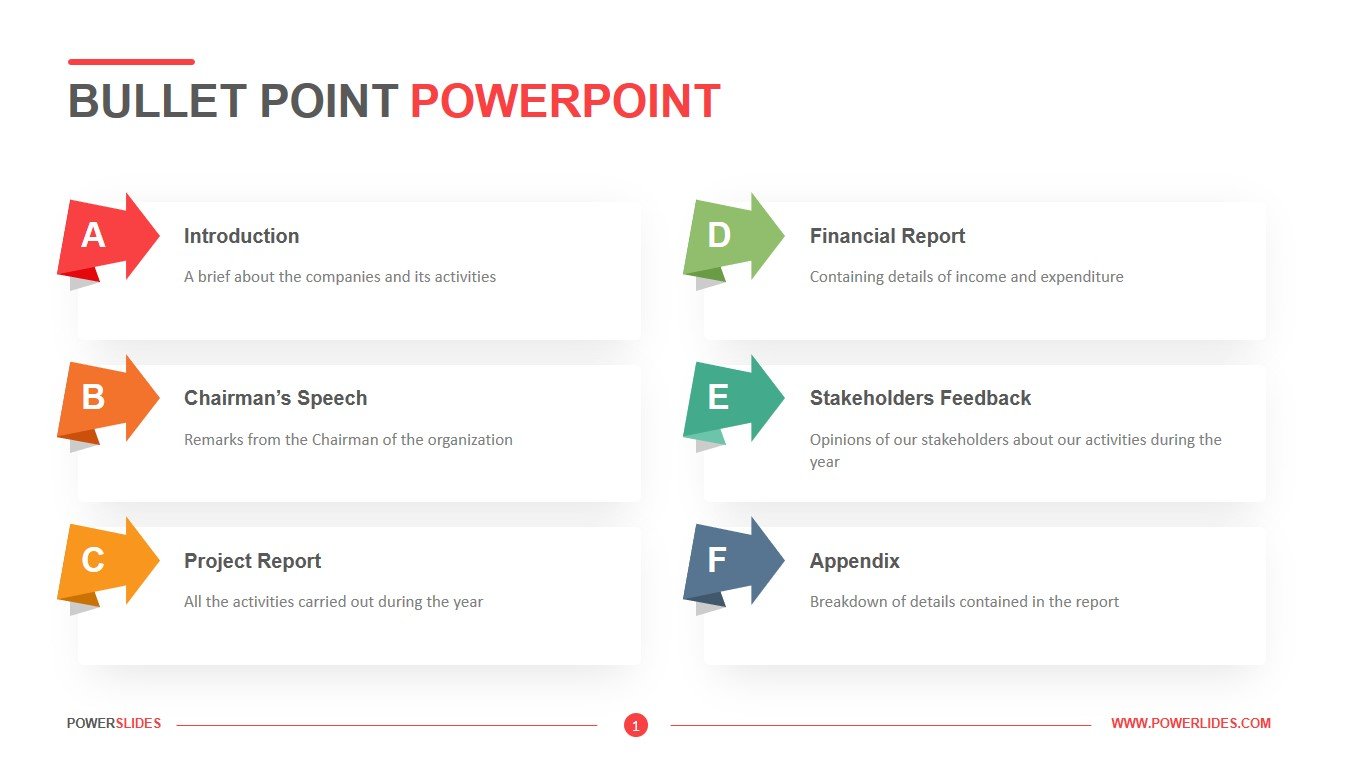
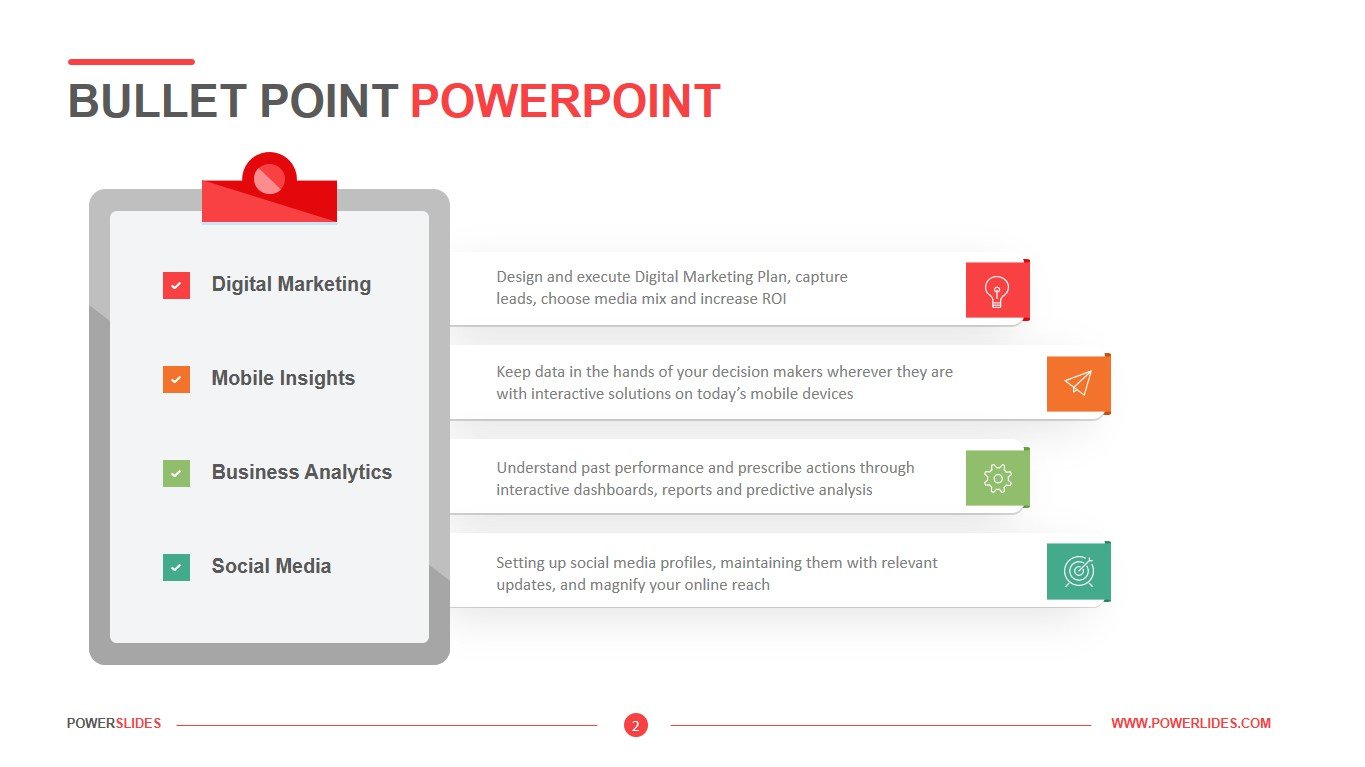
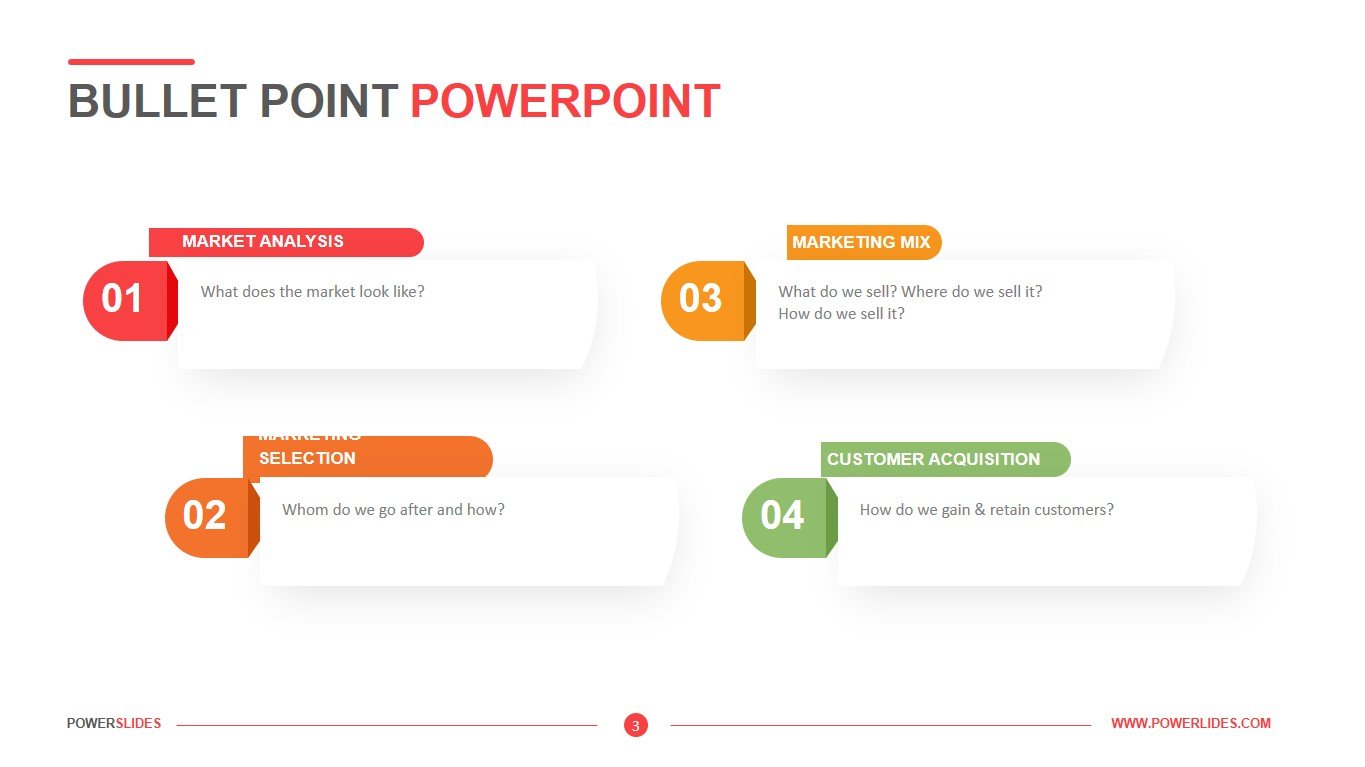
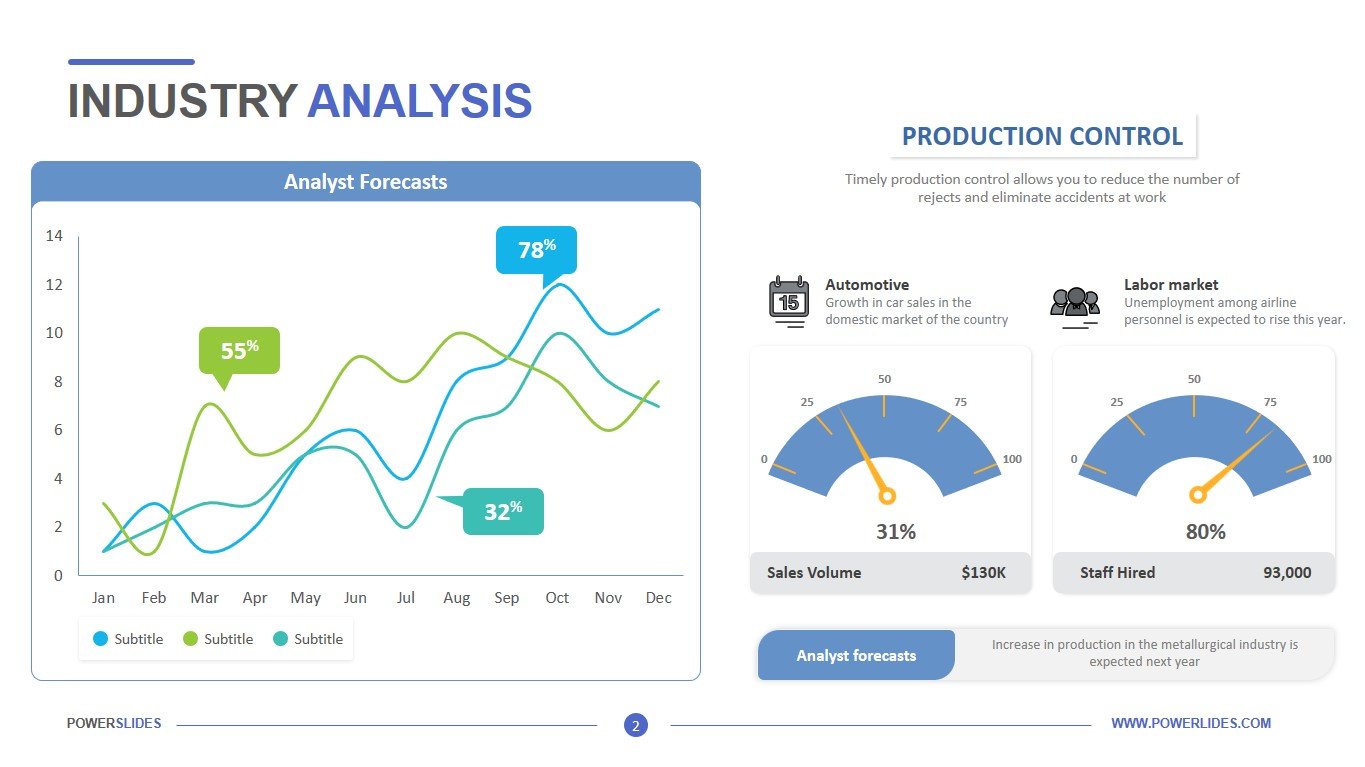
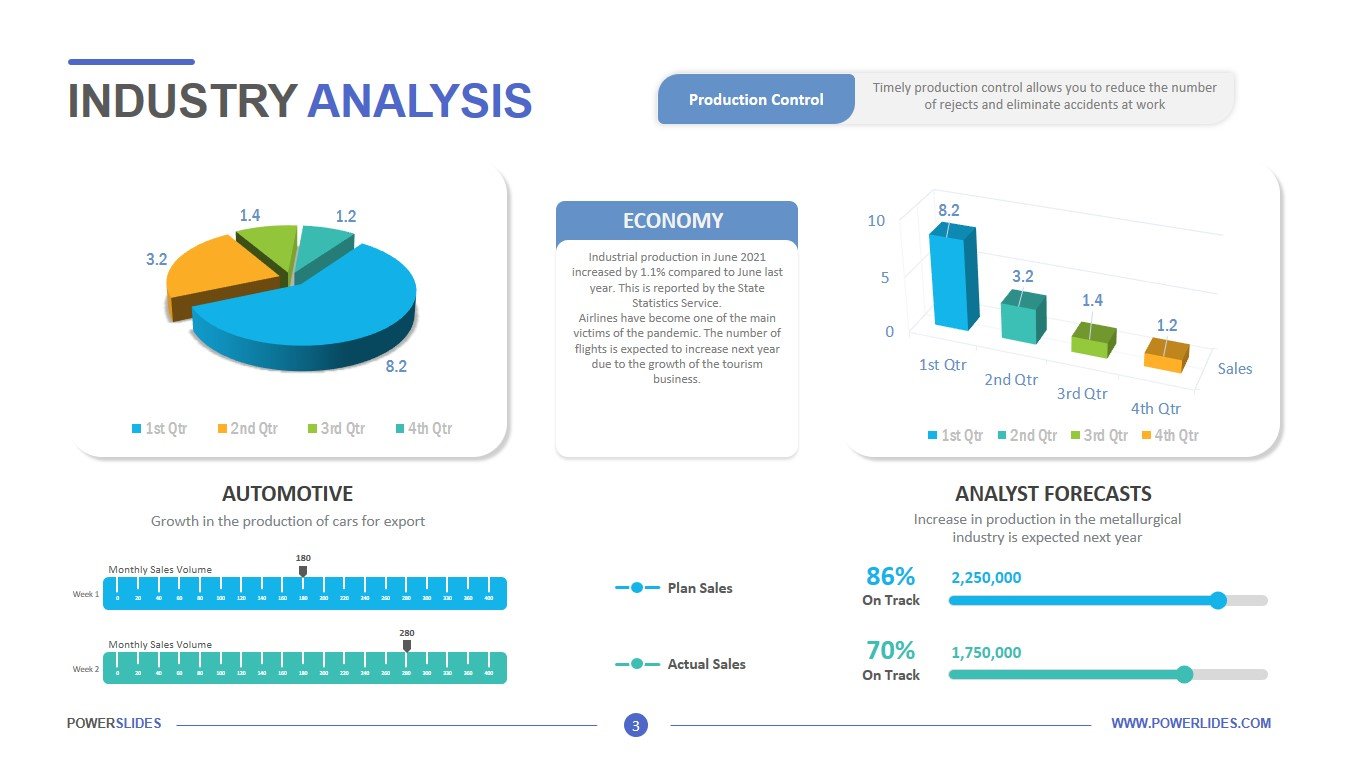
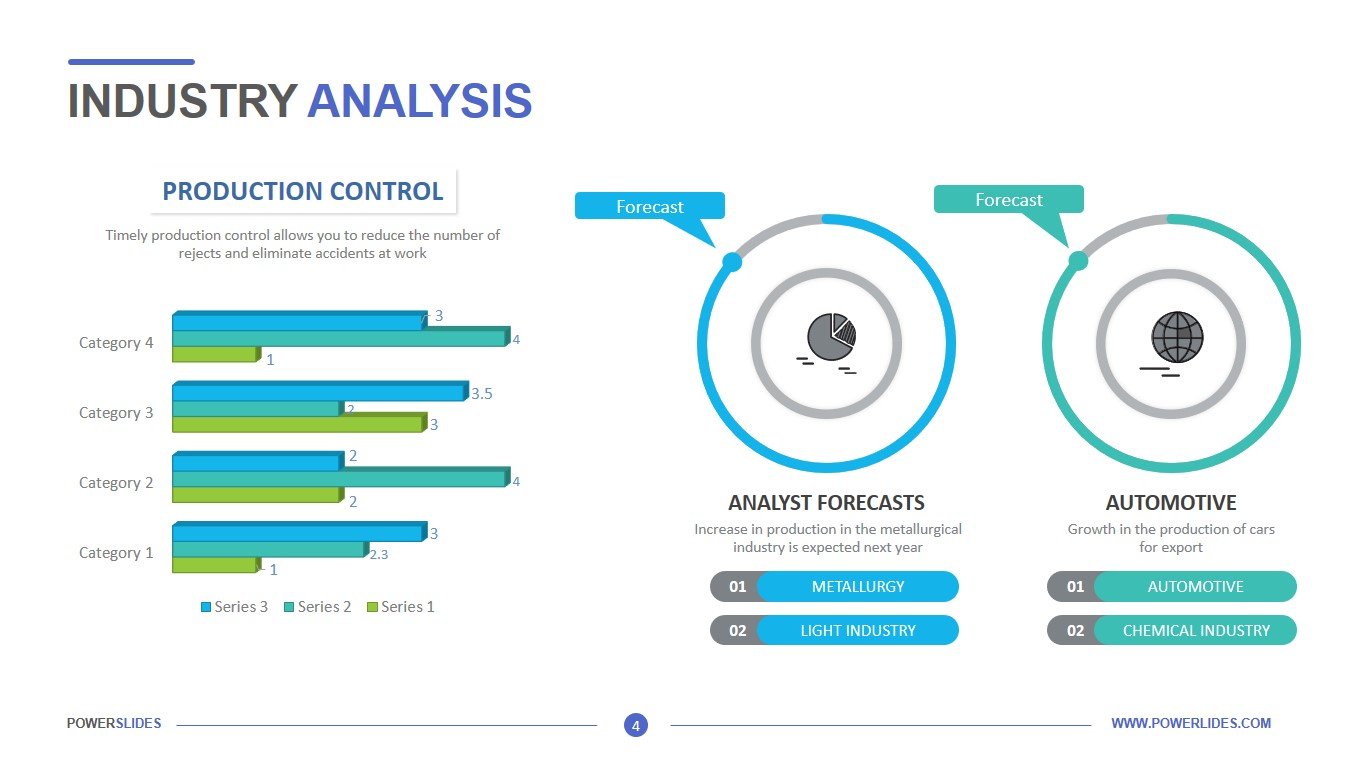
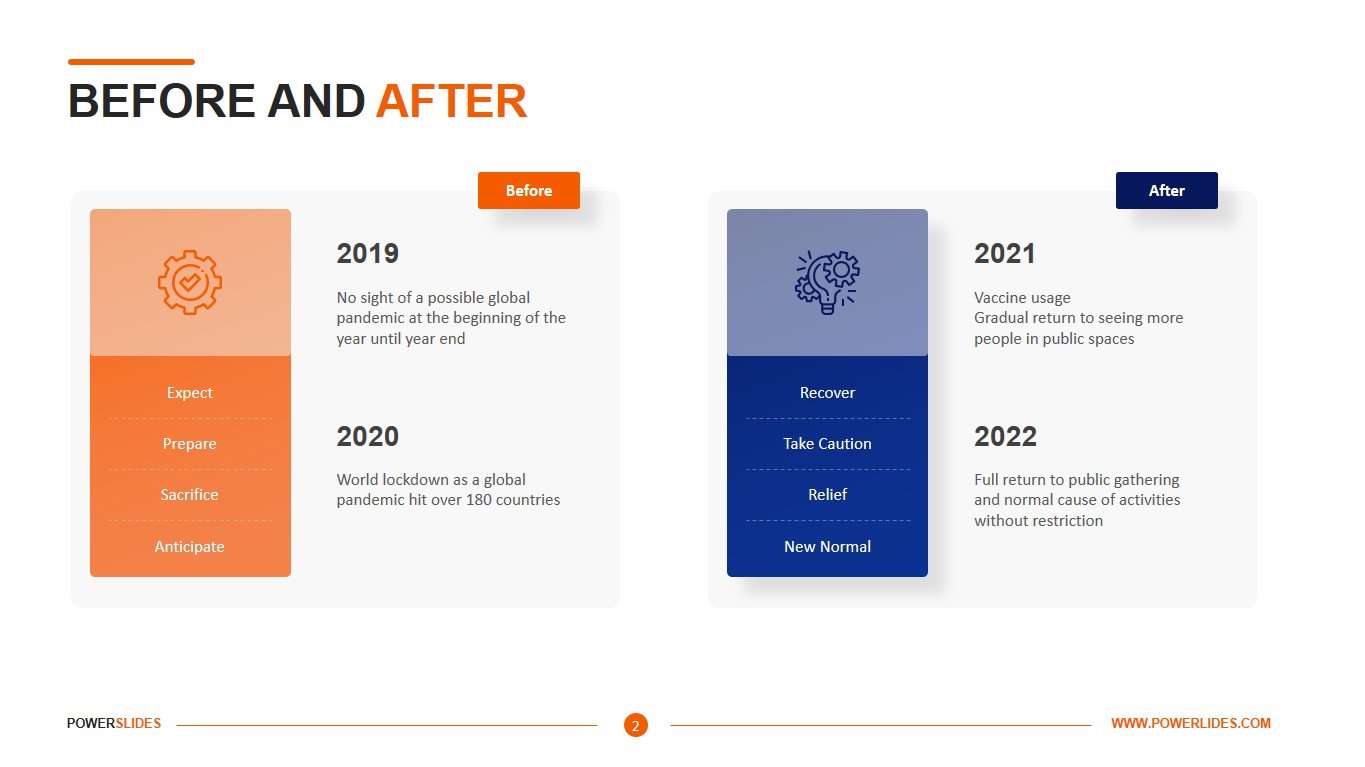
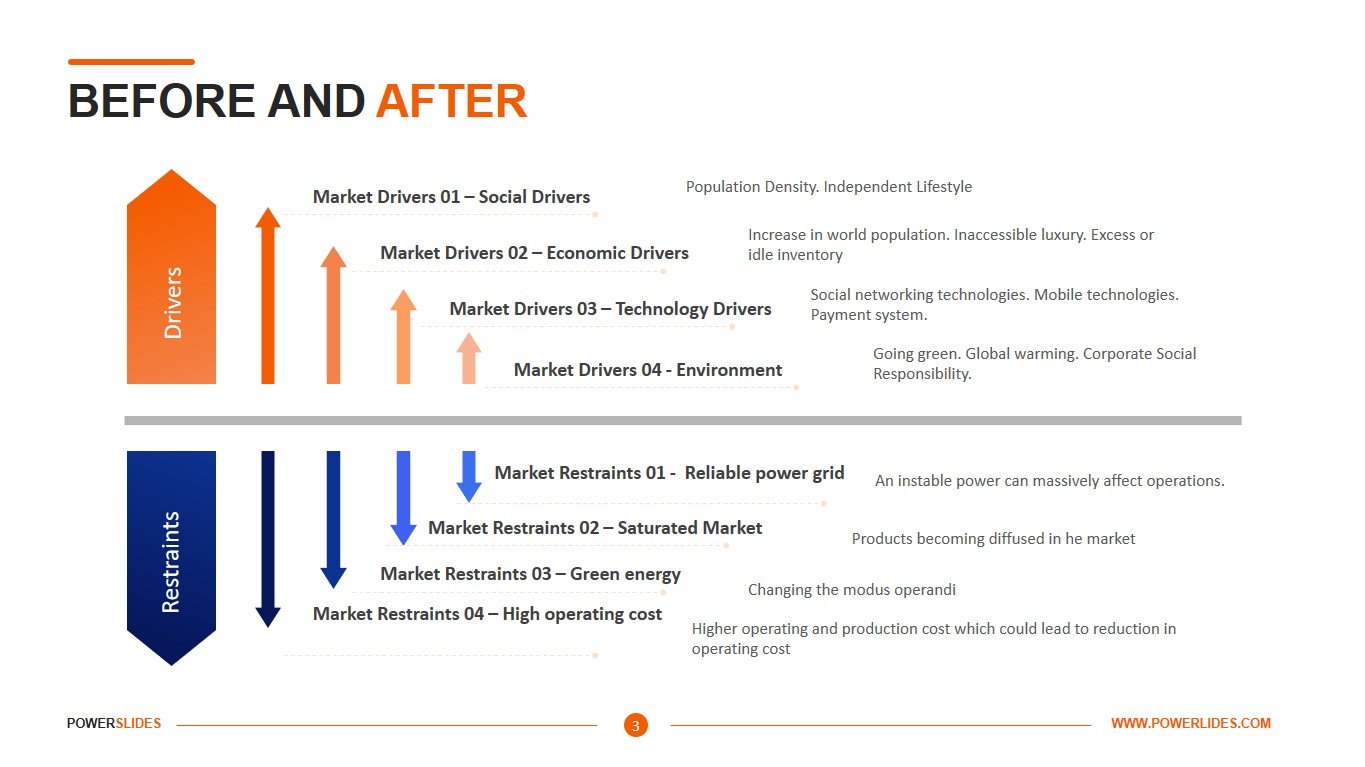
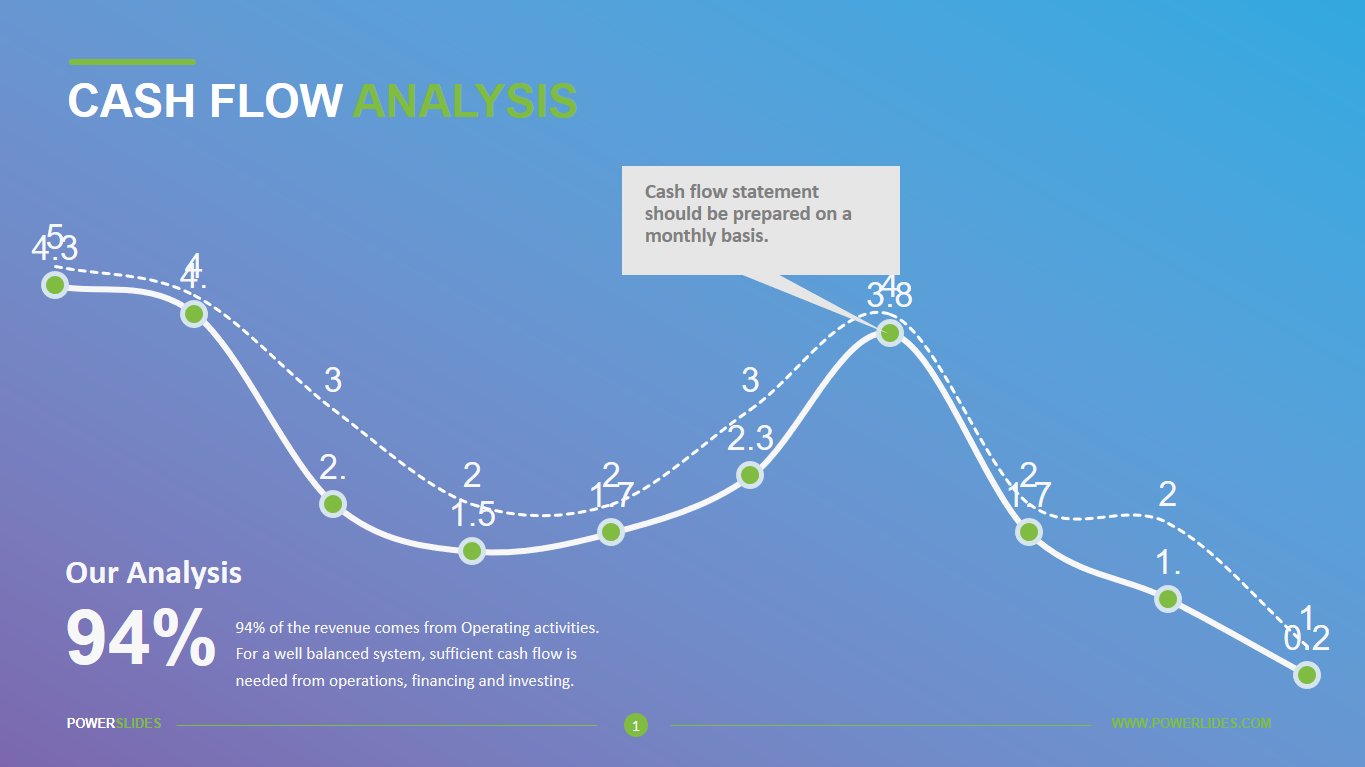
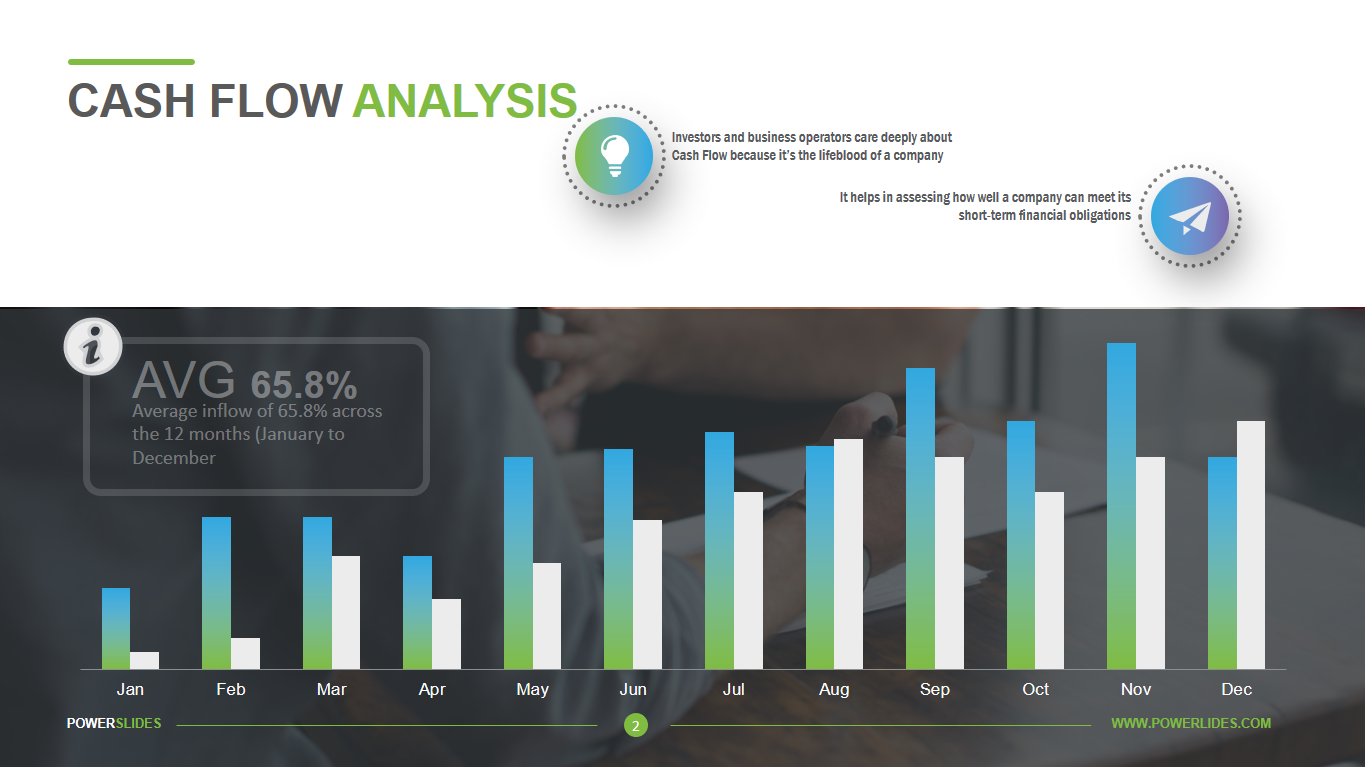
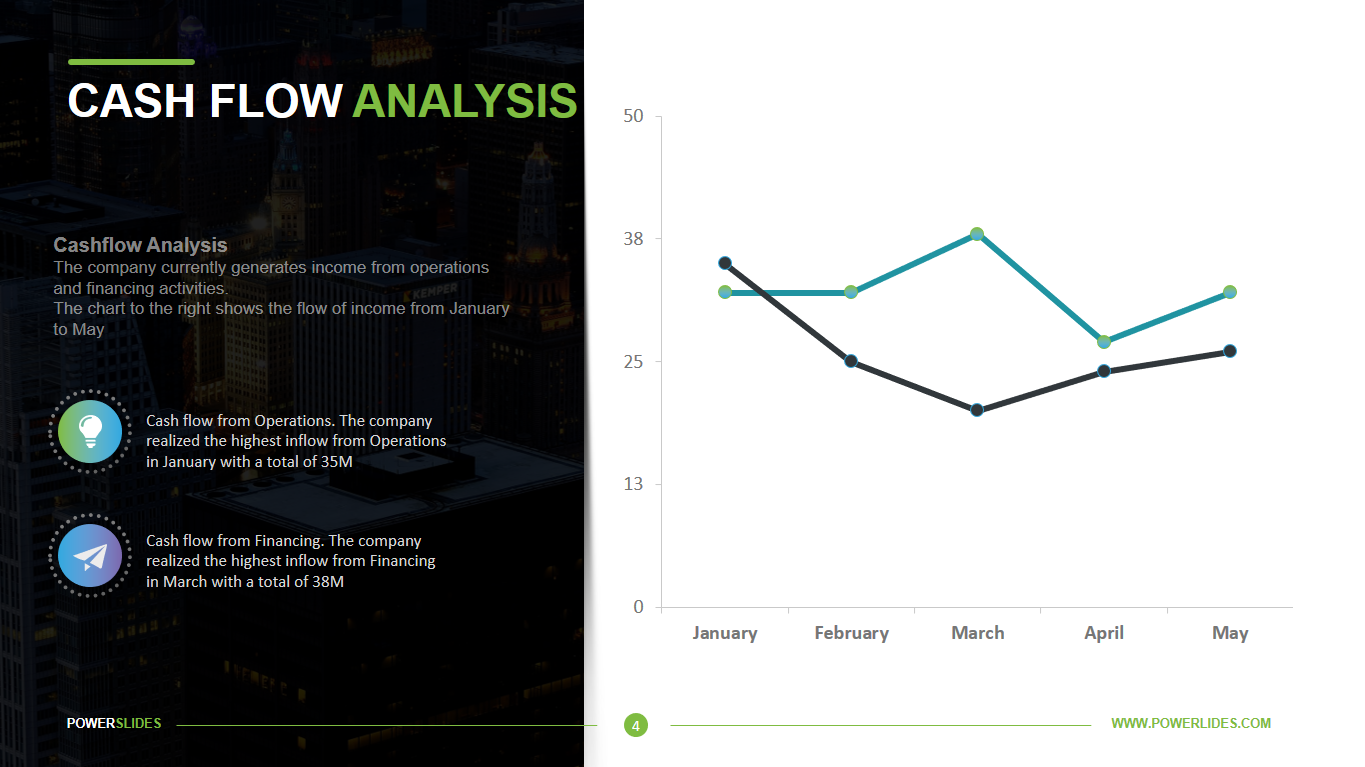
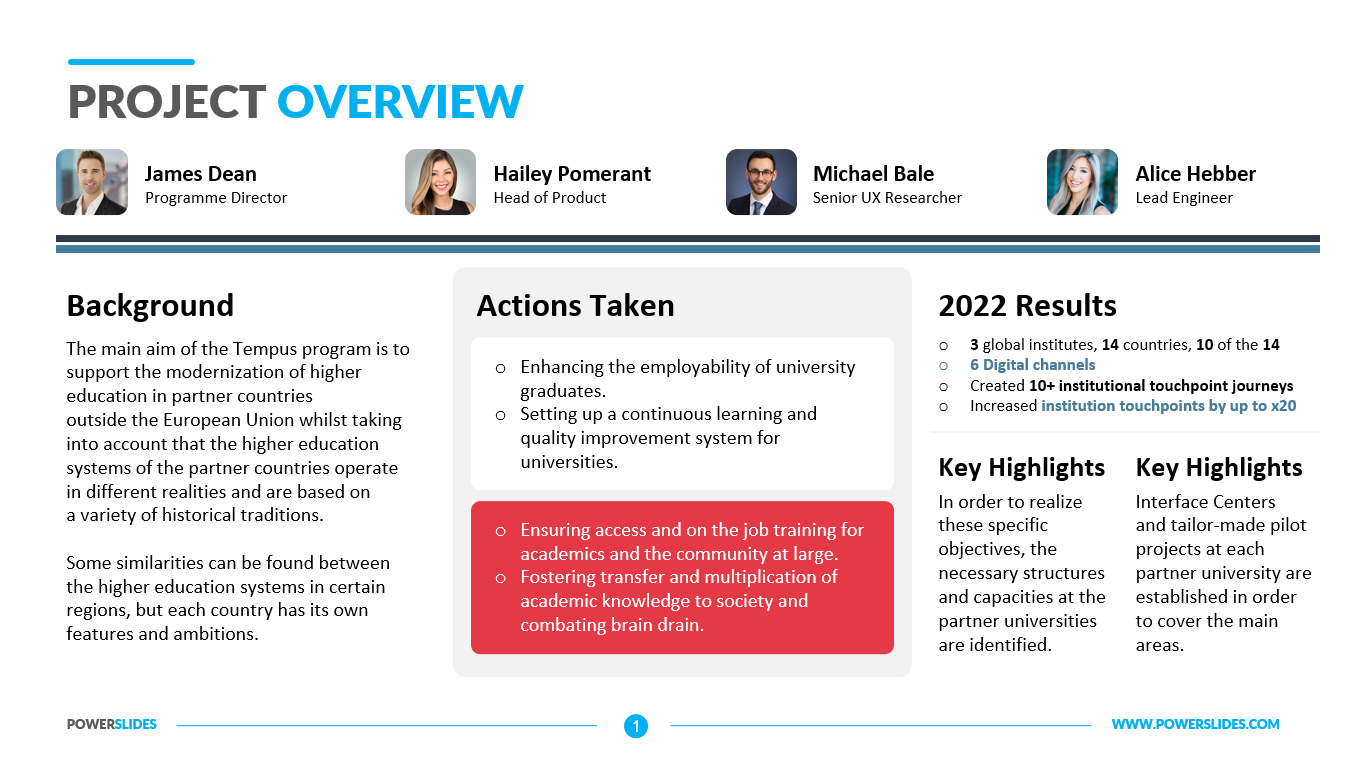
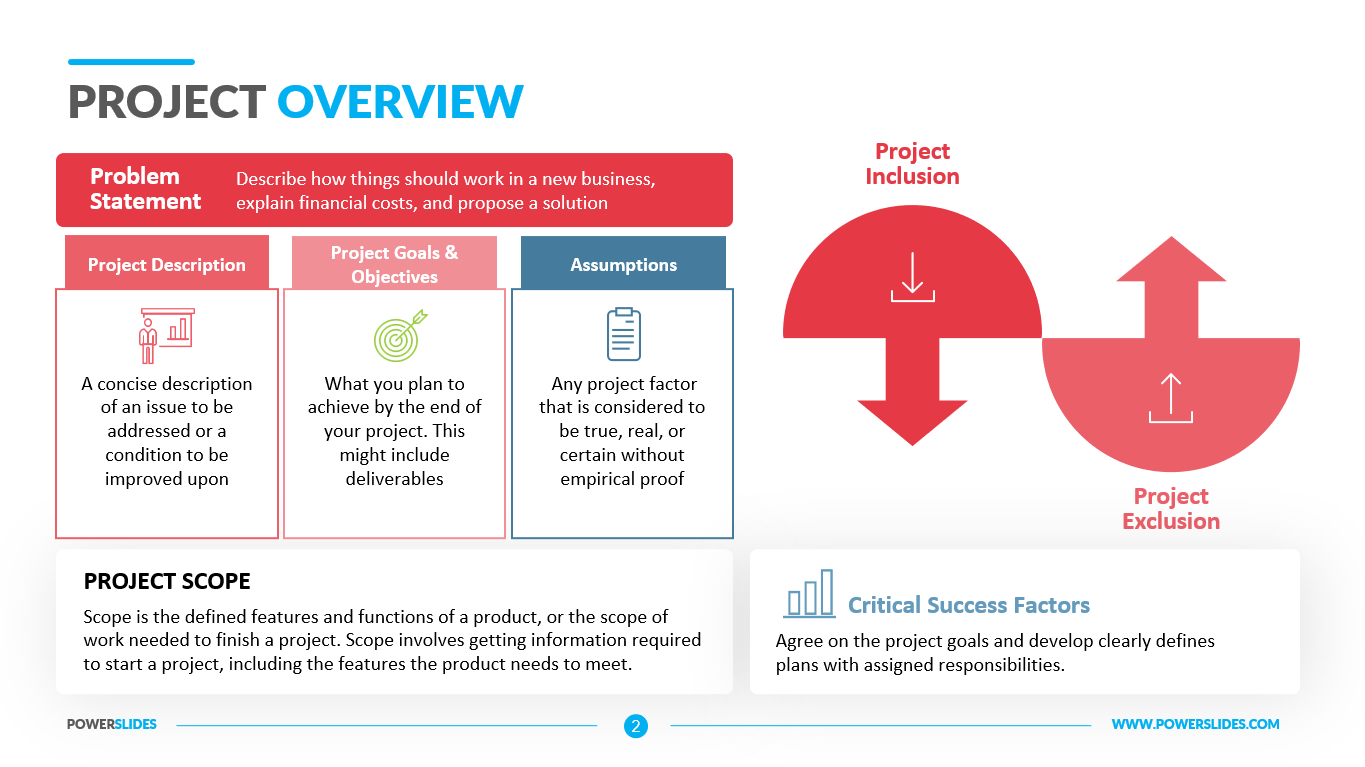
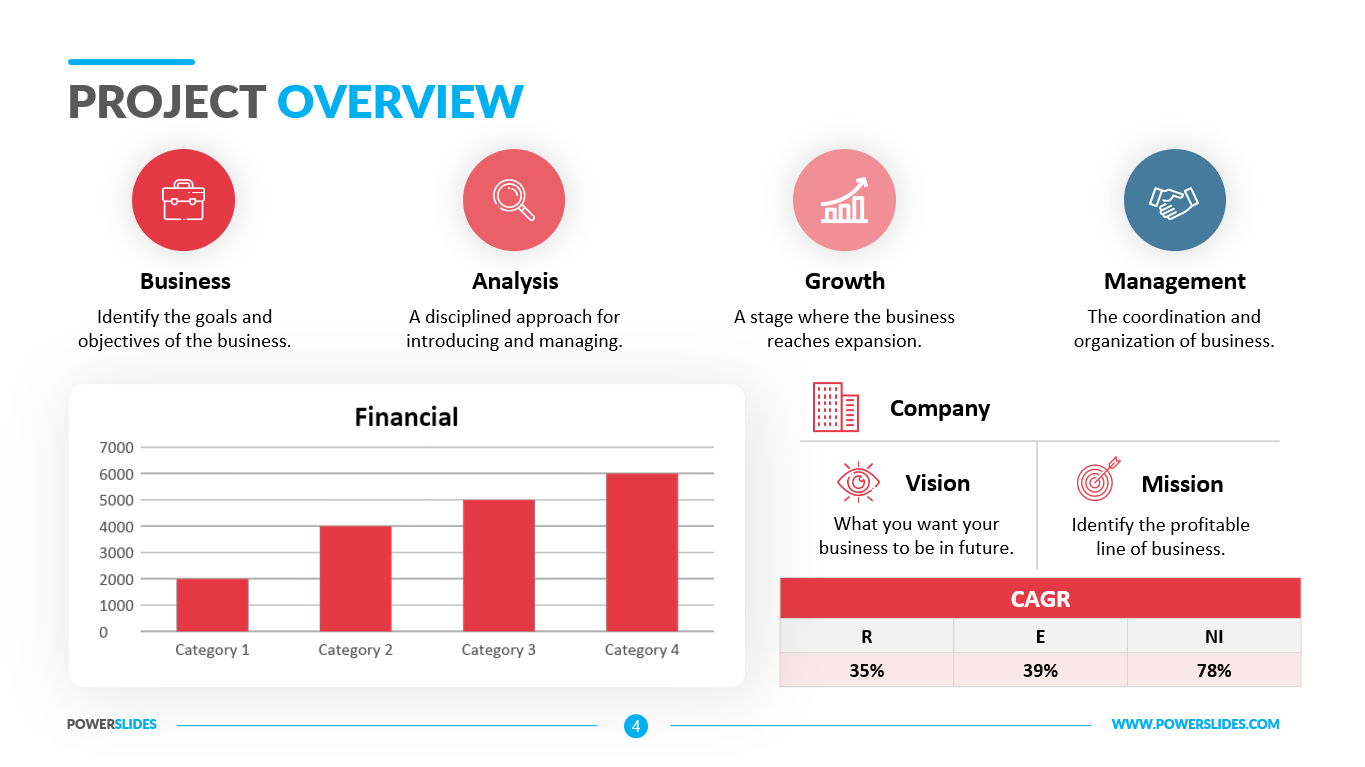
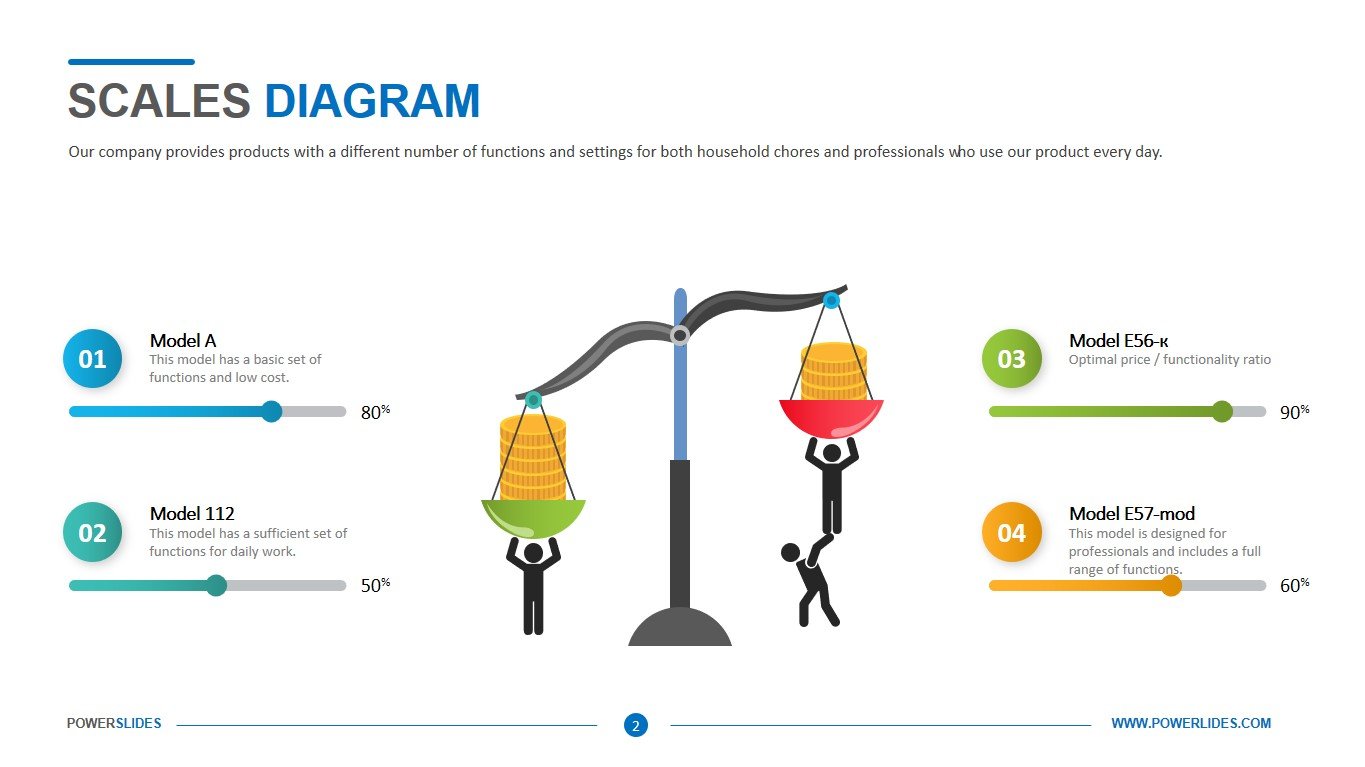
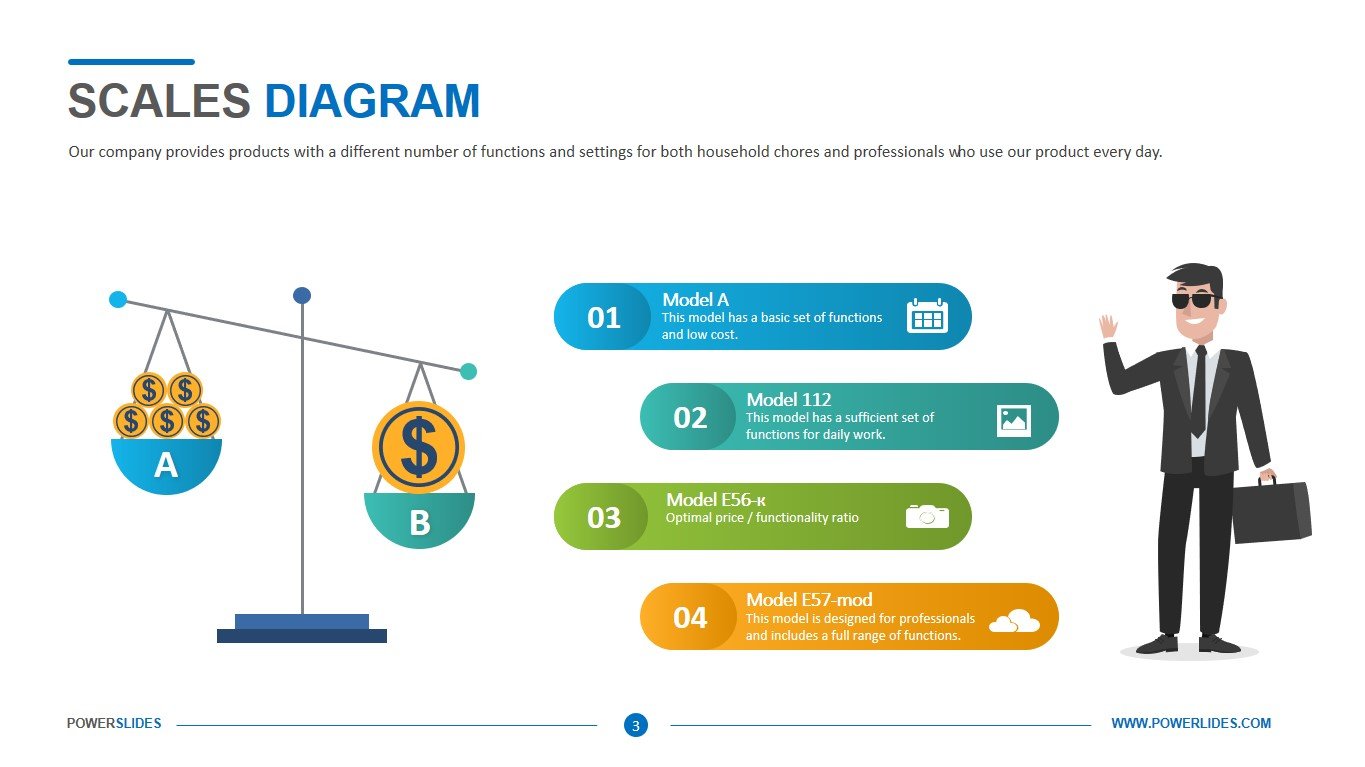
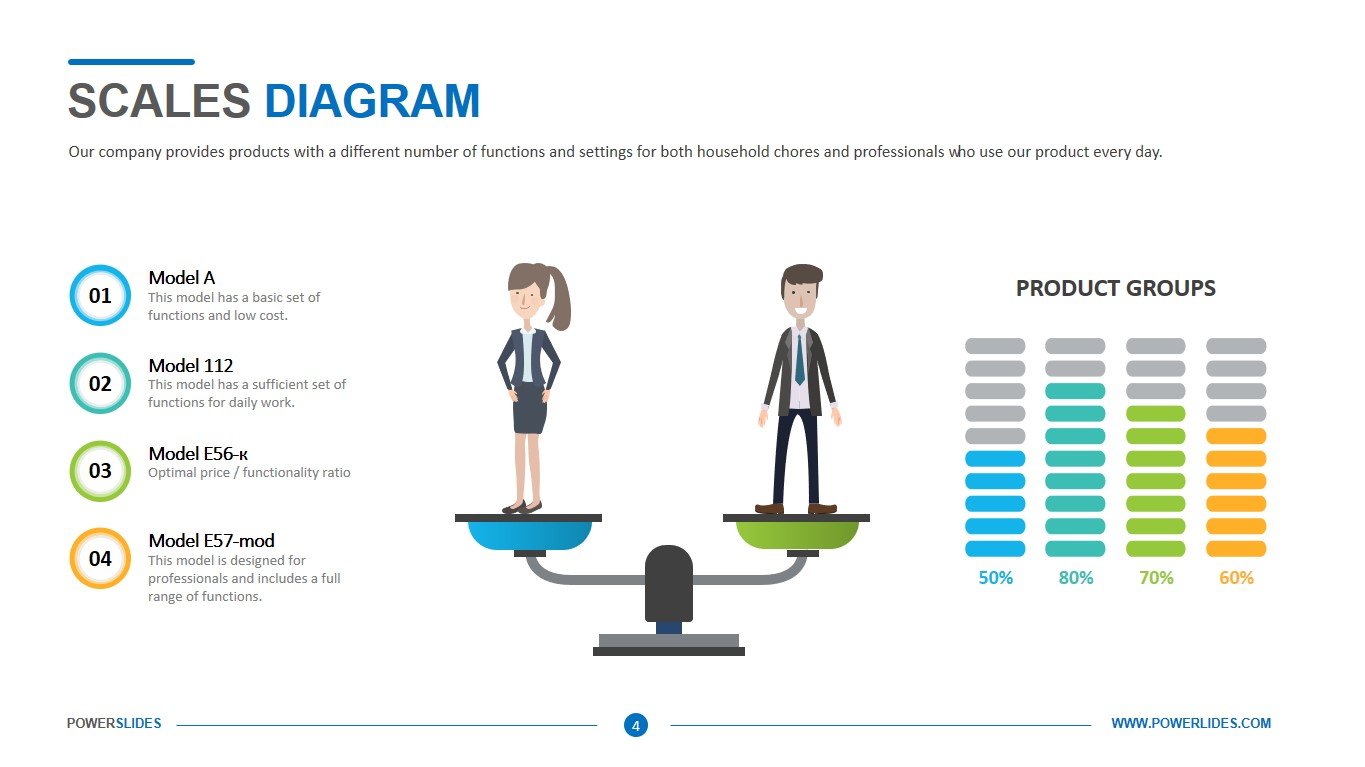
The first slide allows you to prepare a comparison between several products of your company. You can use this slide to compare a competitor’s product to yours. For example, you can point out the advantages of your product on the one hand and the disadvantages of a competitor’s product on the other. You can also use this slide when evaluating suppliers. For example, a purchasing manager will be able to prepare an analysis of suppliers for various groups of goods and display on this slide the advantages or disadvantages for each of them. The second slide gives you an opportunity to evaluate the main characteristics of the product. For example, you can indicate the percentage of customer satisfaction with your product for each of the characteristics. Also, this slide can be used by advertising agencies when preparing an analysis about various advertising channels for your product. For example, you can specify the percentage of your target audience through social media or TV ads. The next slide will be useful for startups and investment companies. You can point out on this slide the benefits of your project that will help you get a high return on investment. This slide can also be used by development managers to prepare their weekly reports. You can indicate the directions of the company’s development and indicate the benefits of working in these areas. The last slide presents you with ample opportunities for analyzing various data. You can list the main characteristics of a comparable product or service on the left side of your presentation. On the right side, you can display the data in a bar chart using the slide infographic. For example, the company’s financiers can use this slide to prepare an analysis of the use of company cash or borrowed funds and their investment in high-yield projects. Also, the slide can be used when preparing a report on the results of work on the project. You can compare project executions by week and determine the reasons for the decrease or increase in team performance.
Consisting of 4 slides, this Scales diagram Powerpoint Template is very sophisticated in its design. With comparison bar charts, infographics, doodle art, percentage comparisons, contrasting colors, and individual dialogue boxes. The slides remain very efficient and compact in their use due to editable properties. The side by side description spaces further adds to its accessibility. The Scales Diagram PowerPoint template is the ultimate tool to represent business growth, predict market results, observe investment opportunities, and equality ratios for all your business purposes. Nonetheless, it can also be used for academic and research purposes.


