Financial Projections
What do you think of this template?

 (4.00/ 5)
12 ratings

 4 Slides
 File size: 16:9
 Fonts: Lato, Calibri
 Supported version
PPT 2010, PPT 2013, PPT 2016
Supported version
PPT 2010, PPT 2013, PPT 2016

Product details
The usefulness of the financial projections template bundle comes to the scene when you have to present a huge numerical data with lots of statistics but while utilizing less space and time as well as making sure that your audience captures the main idea with a simple glace. These financial projection templates come in a variety of colors, designs, and types so that one can choose the most suitable one. You can either use a bar diagram projection to set long term finance related goals for your business project or can simple use the table template of these financial projections to show the revenue and income generated over a stretched time period.
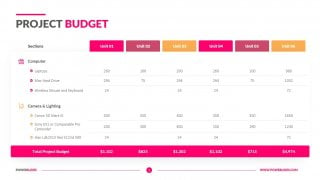
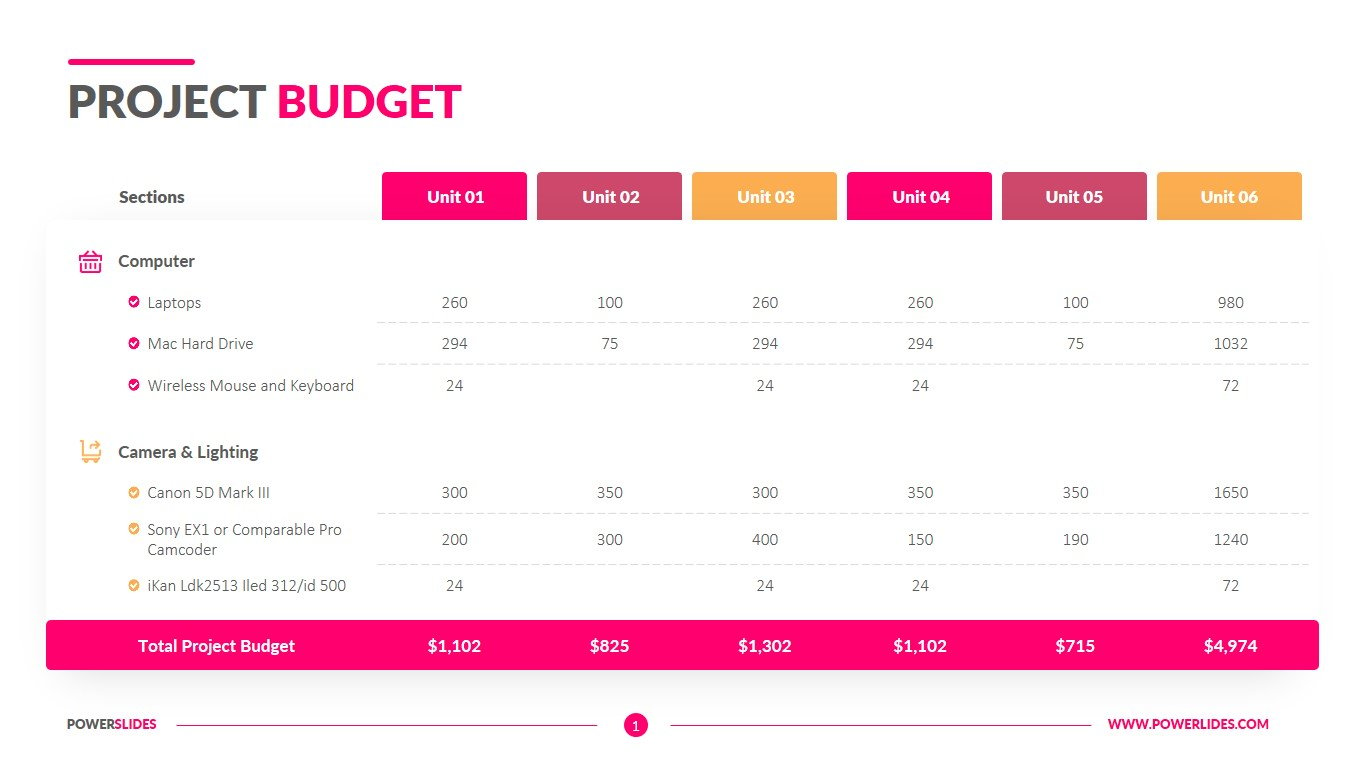
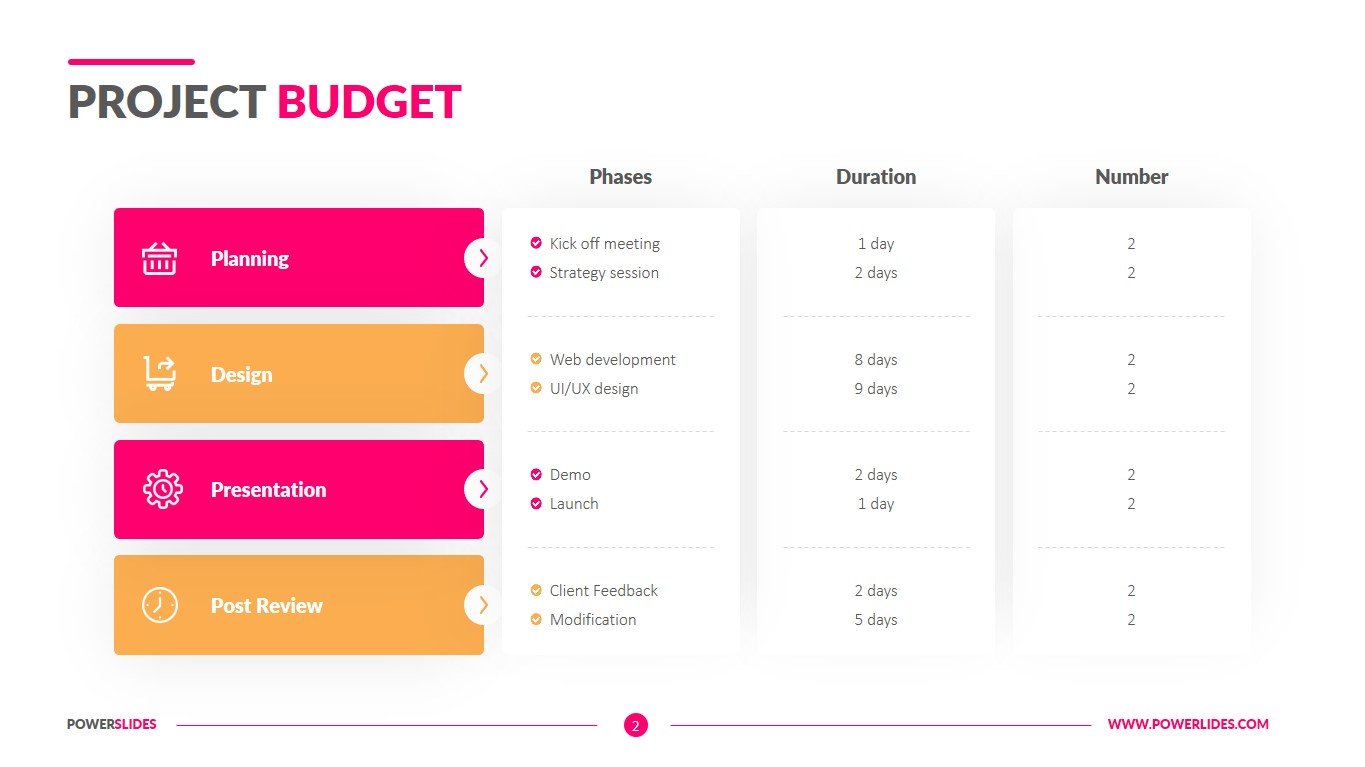
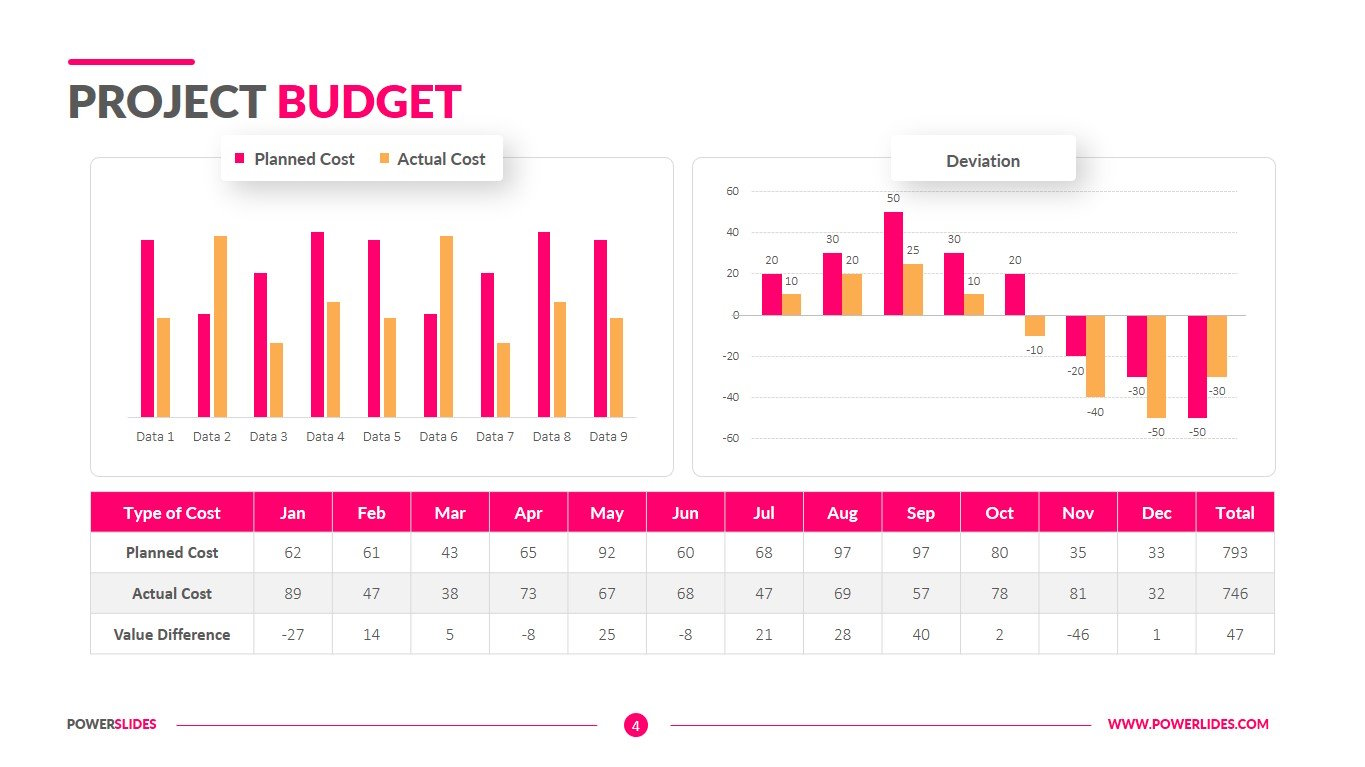
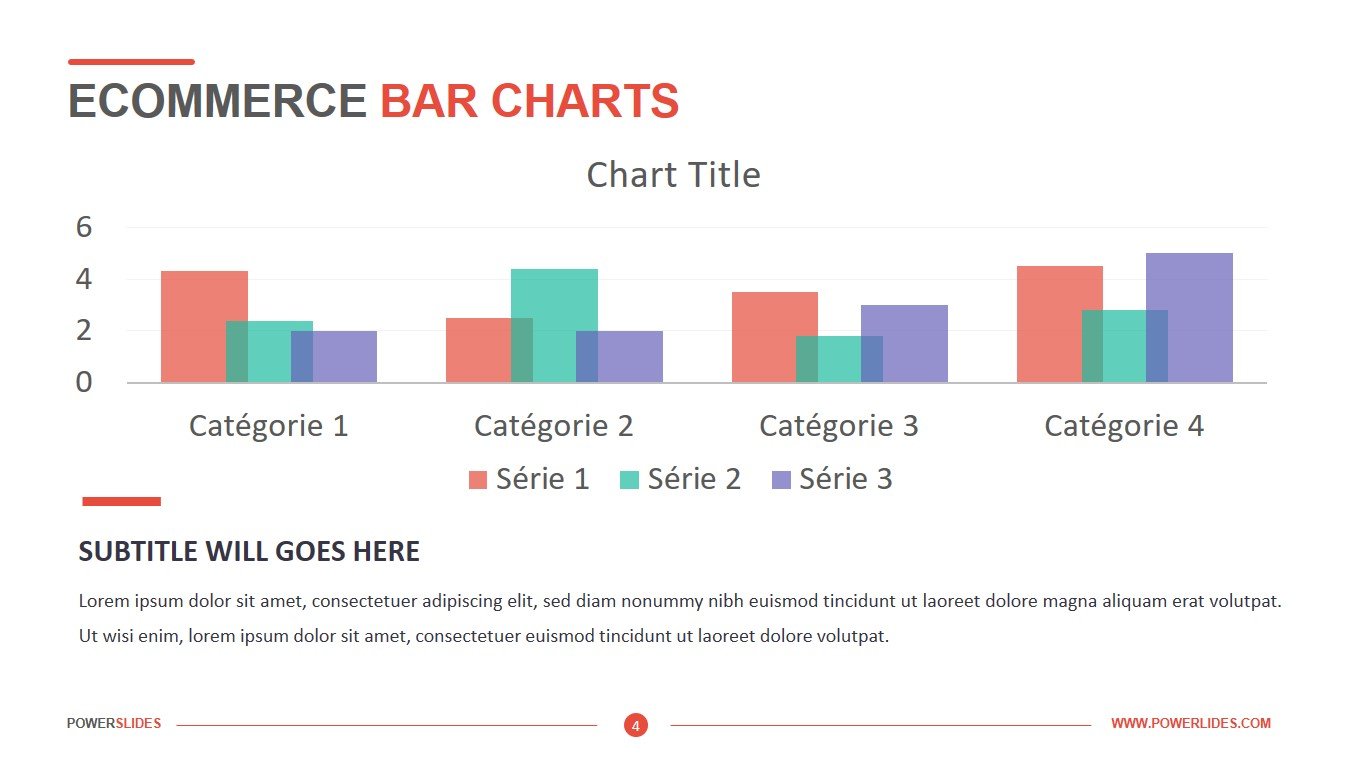
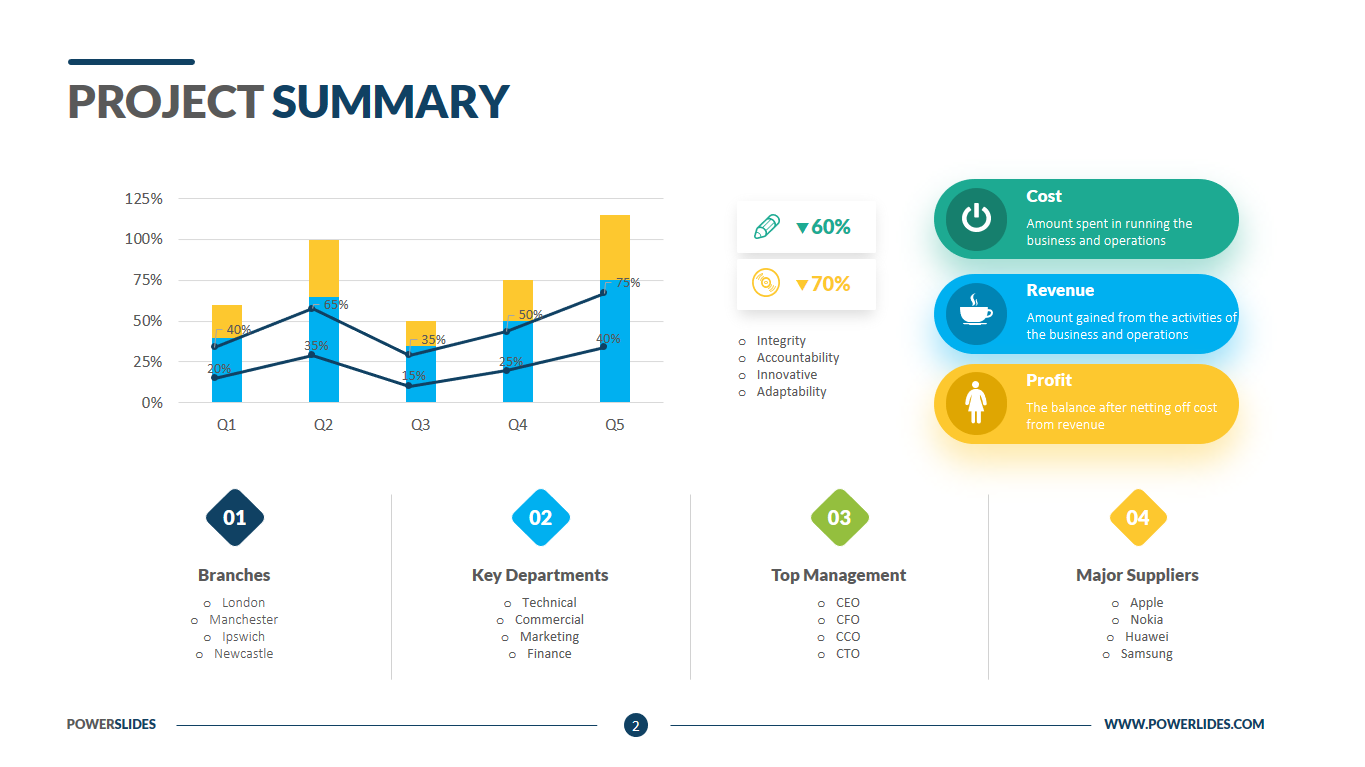
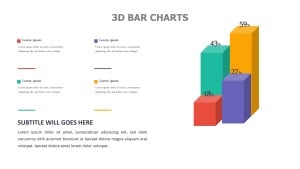
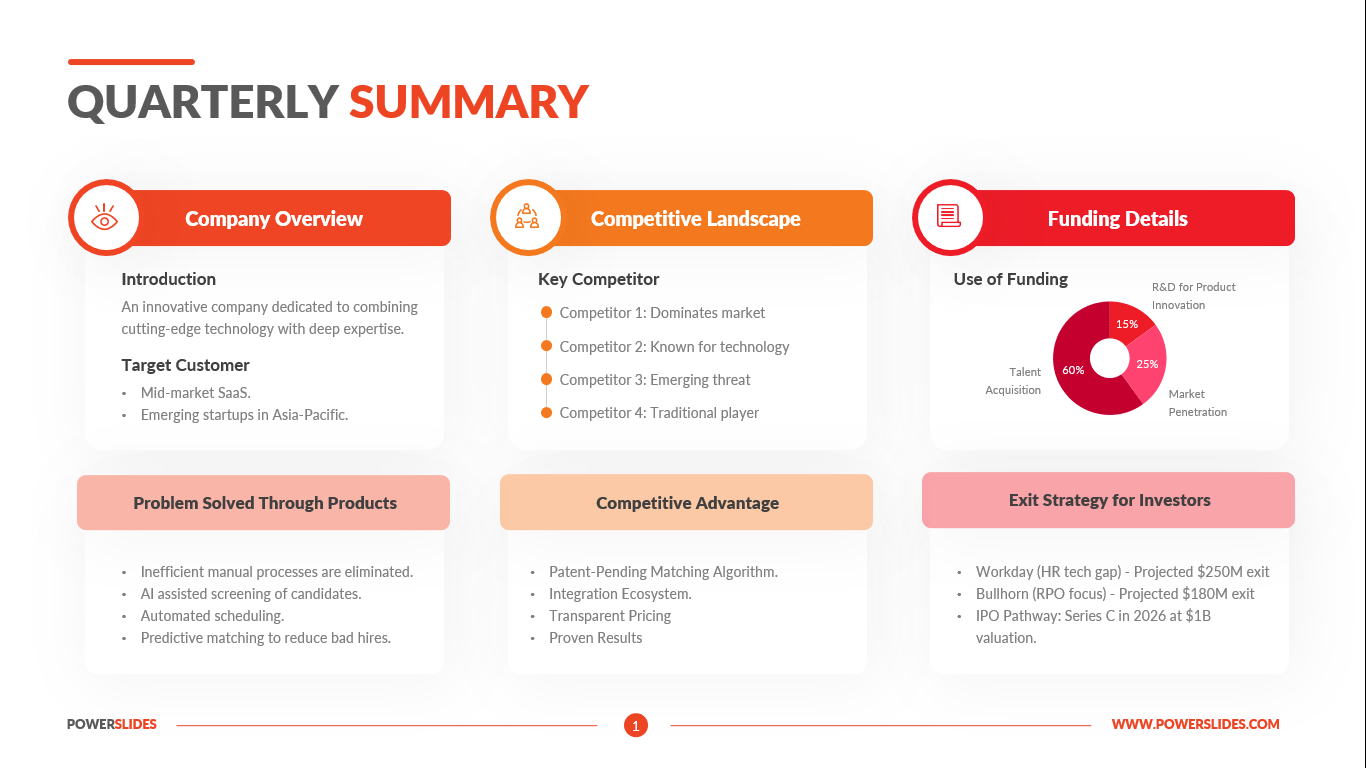
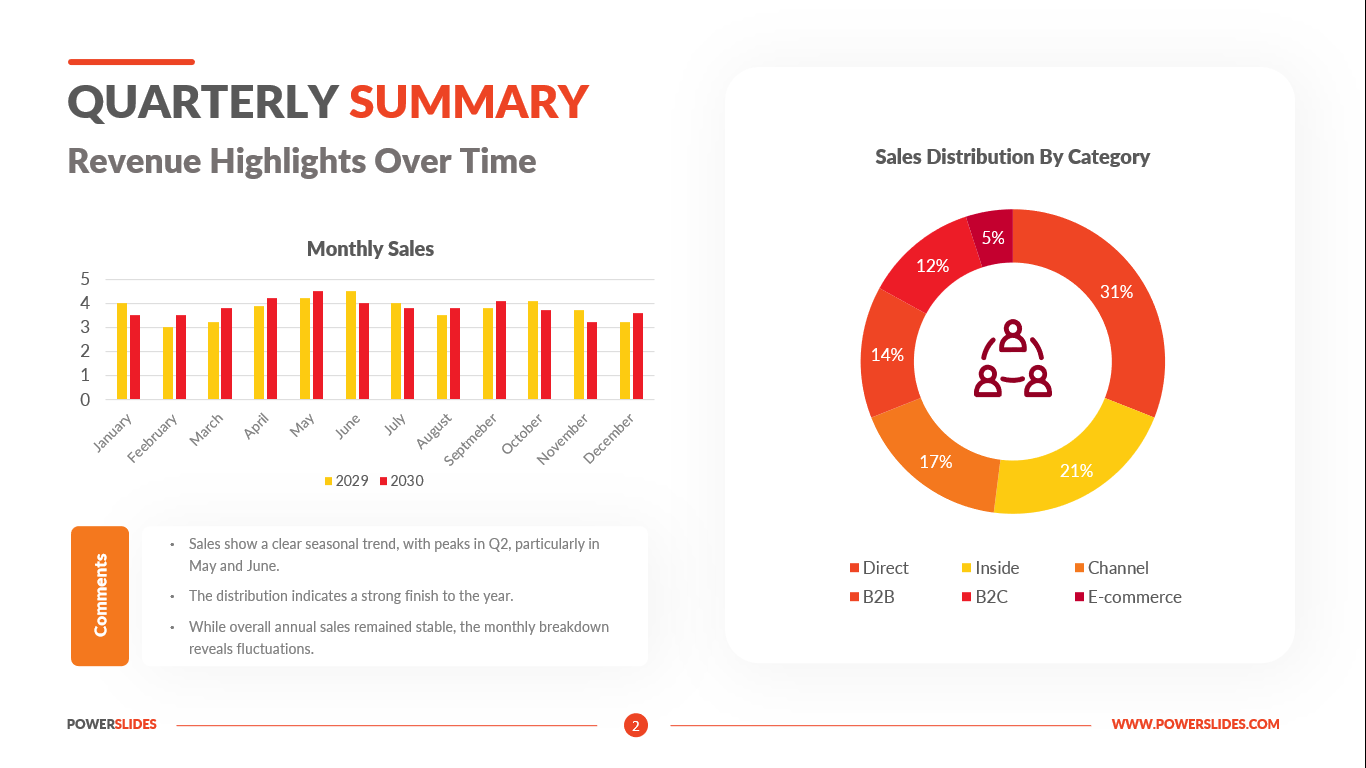
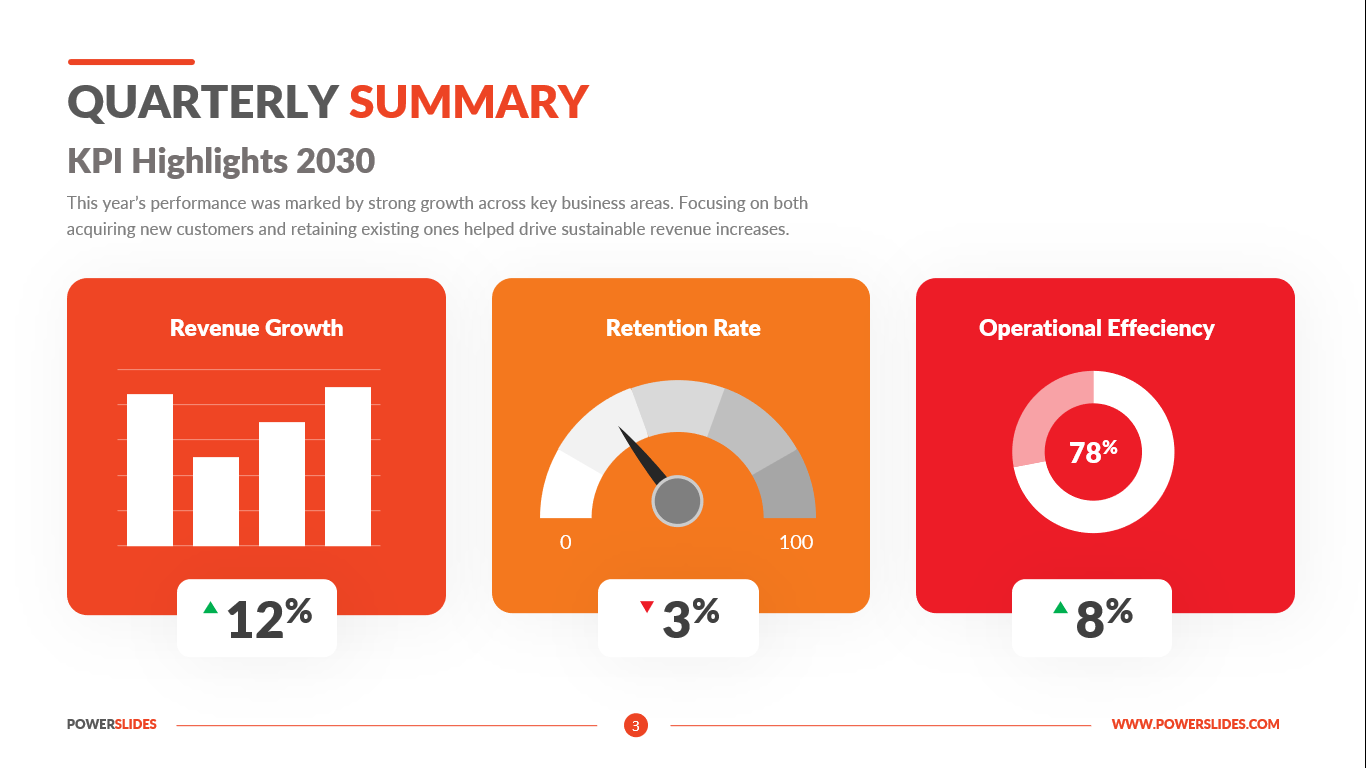
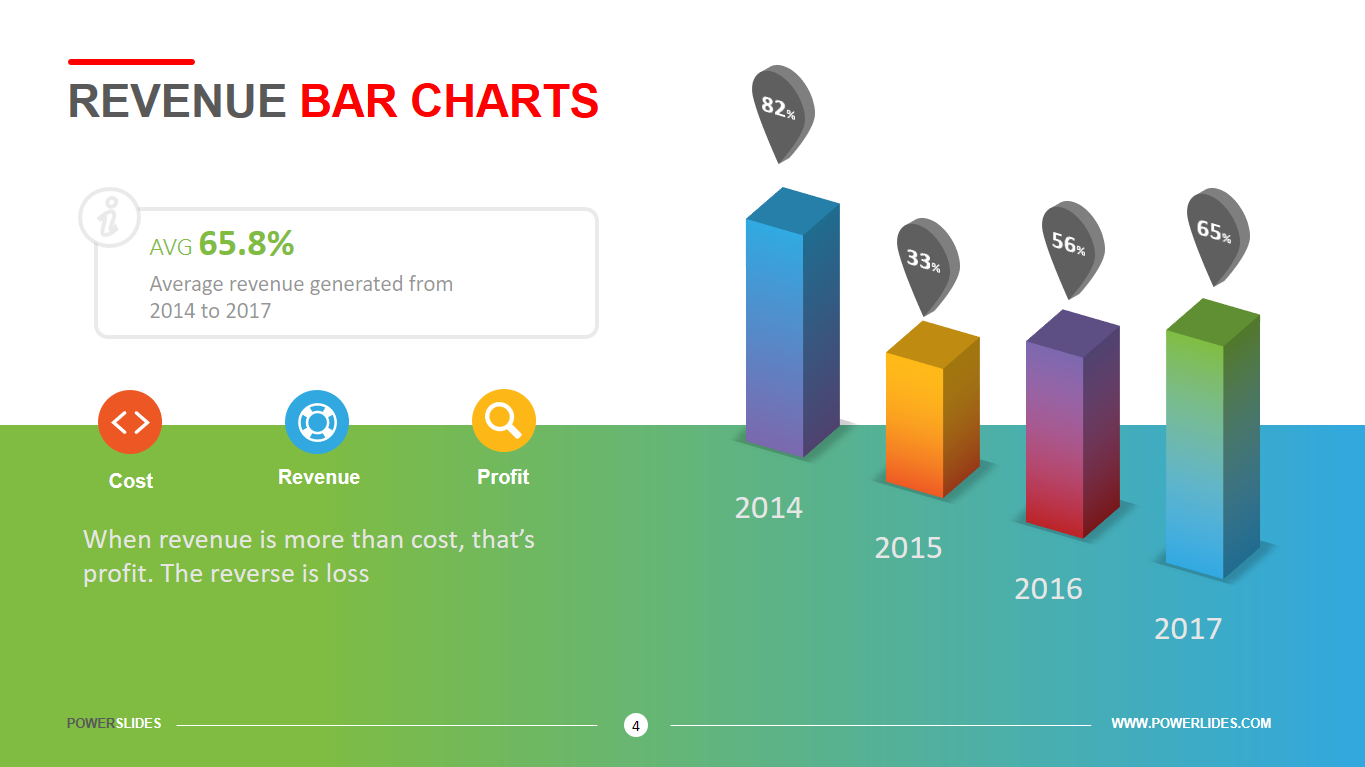
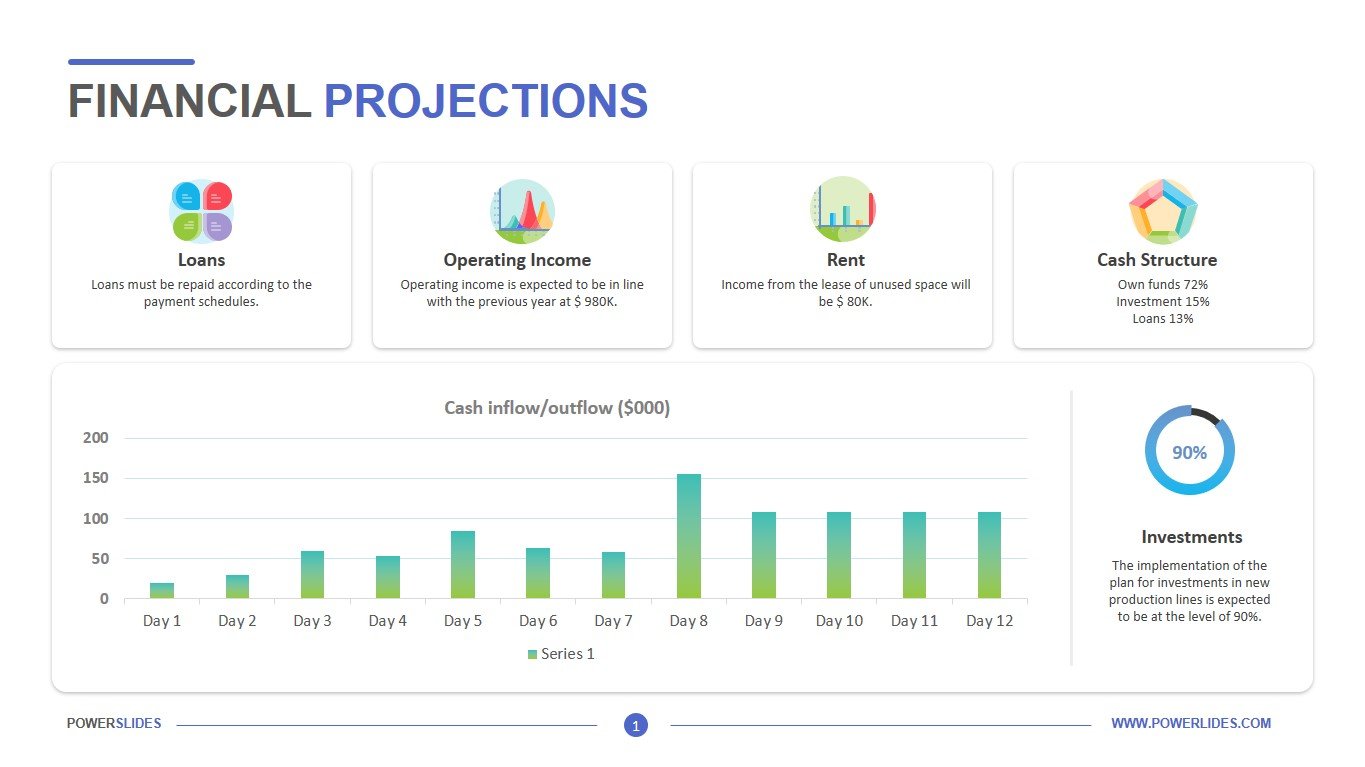
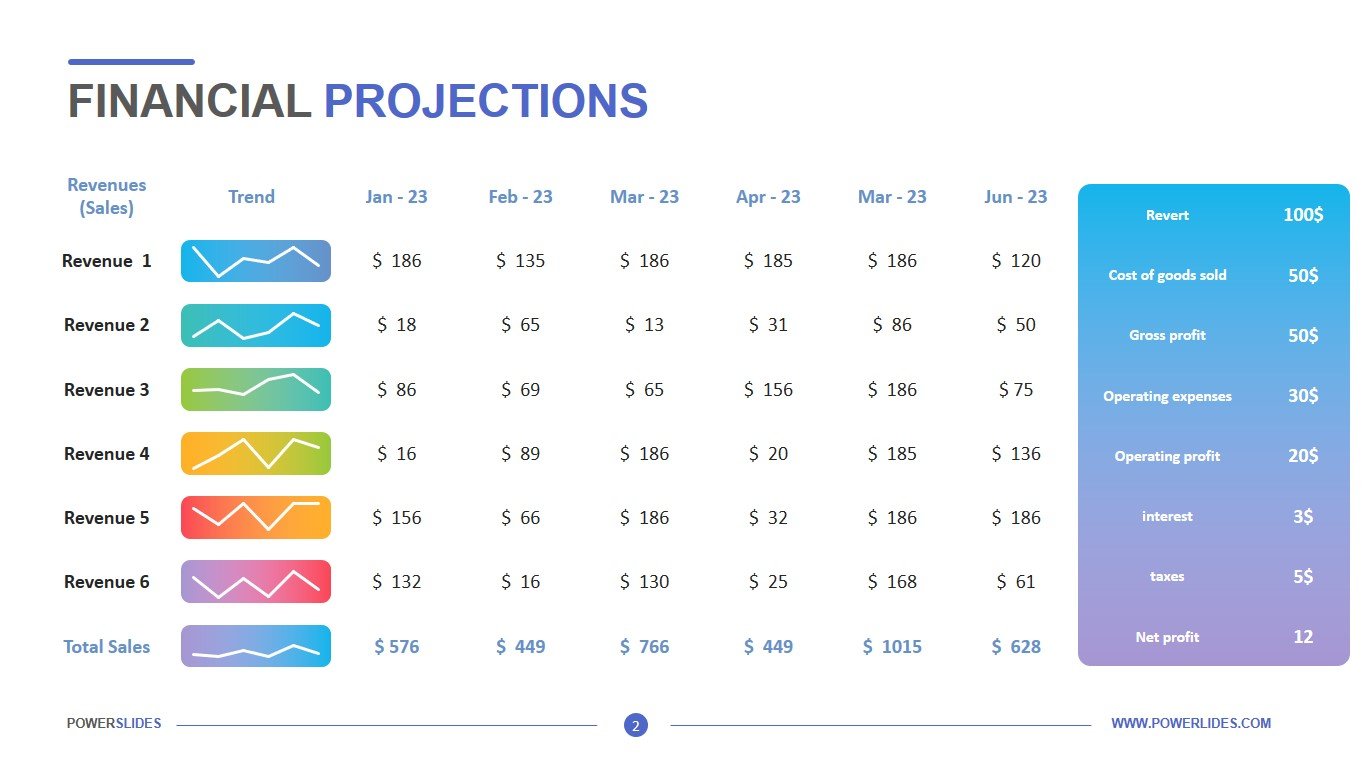
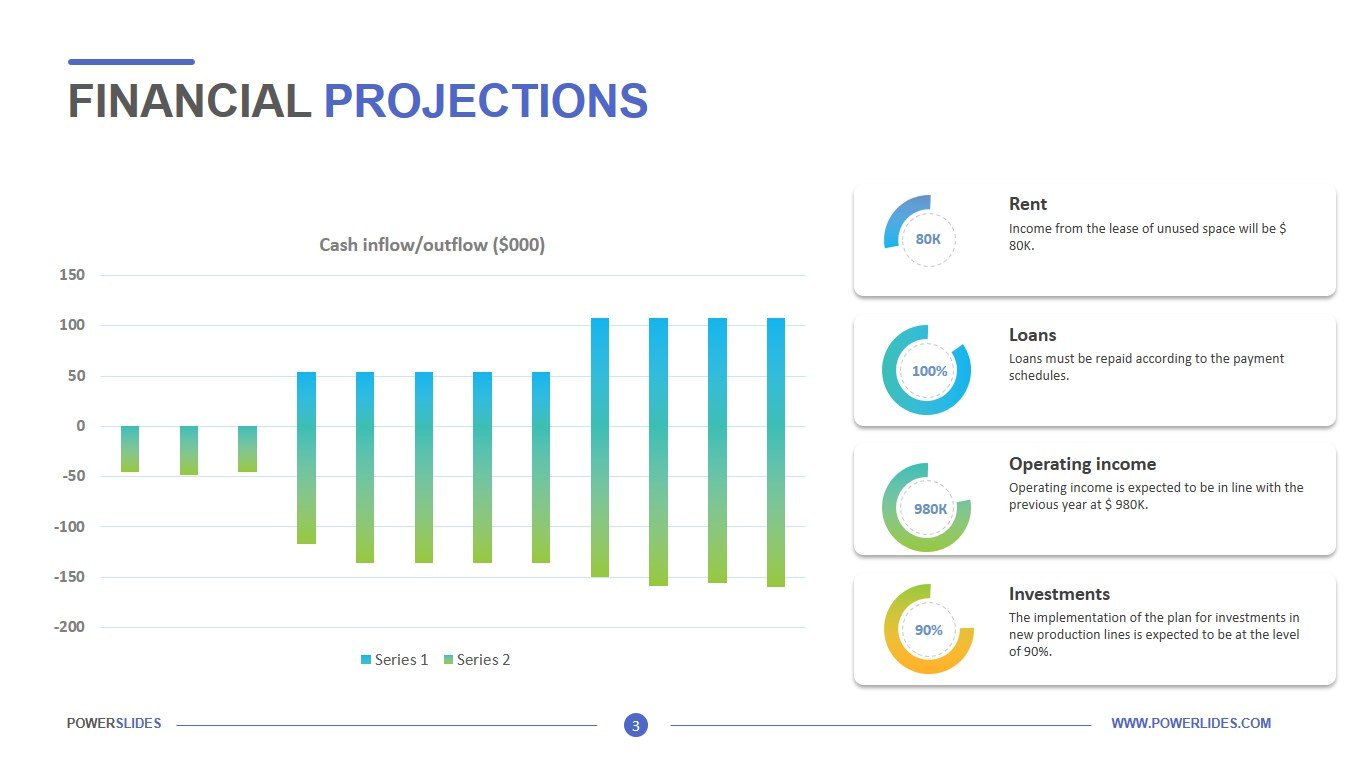
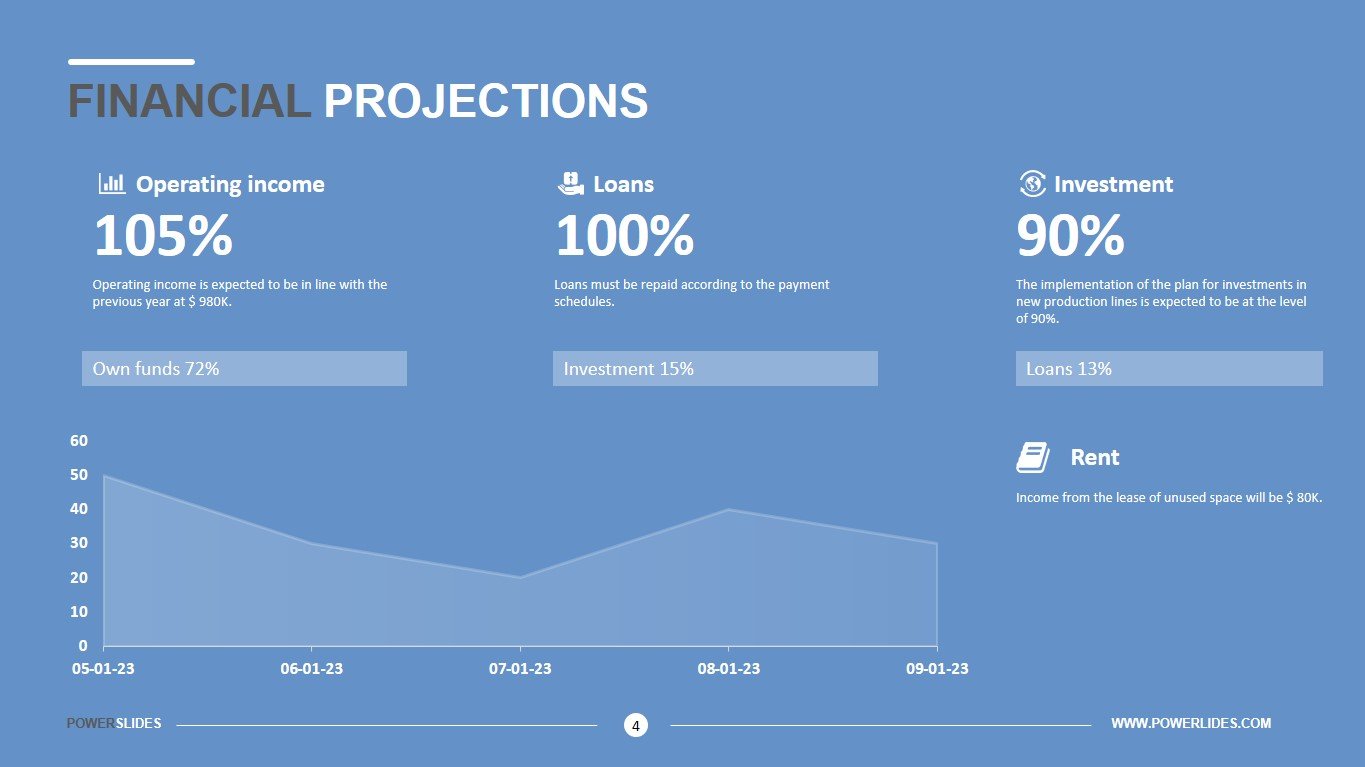
Financial Projections Template is designed in a modern style and has all the necessary tools to build a presentation. The first slide consists of a bar chart and a pie chart. You can also display information about your calculations at the top of the slide in four text boxes. Financiers and economists can use this slide in their daily work. You can present an annual profit or loss statement, and display the percentage of the sales plan on a pie chart. The second slide is a modified table with the ability to provide data for six products. For example, you can specify profitability per stock for different companies or profit per line of your company’s products. This slide will be useful to the sales director when analyzing sales for each of the managers. Also, project managers can use this slide in their work when compiling profitability for projects. The next slide will be useful to all sales and CFOs. This slide gives you the ability to display your data in four pie charts as well as present your profit or loss data. For example, you can provide a sales report for the previous quarter showing sales and cash flows. On the pie charts, you can indicate the total percentage of fixed and variable costs, taxes. This slide will also be useful for investment companies and startups when preparing reports for investors. You can specify the expected profitability of the project and the percentage of the project’s exit plan to break even. The last slide is designed in darker colors, allowing you to integrate it organically into your presentations with dark backgrounds. You can use this slide when analyzing the fulfillment of an income or expense plan. For example, purchasing managers can use this slide when preparing an expense budget execution report. You can indicate items of expenditure for which there is an under-fulfillment or over-fulfillment of the plan, as well as indicate the percentage of fulfillment compared to the previous month.
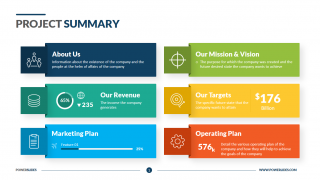
The array of design that come under this template ensure that the presenter has to utilize a very little time in arranging the slides like budgets, long term financial plans, information related to finances, etc. The users also have the independence of customizing every template as they like and use a color palate and text of their own choice. You can add graphics as well as side notes on these templates and can play with these in a variety of ways to make the presentation look more attractive and useful. This template is a must for financiers, economists and sales managers.


