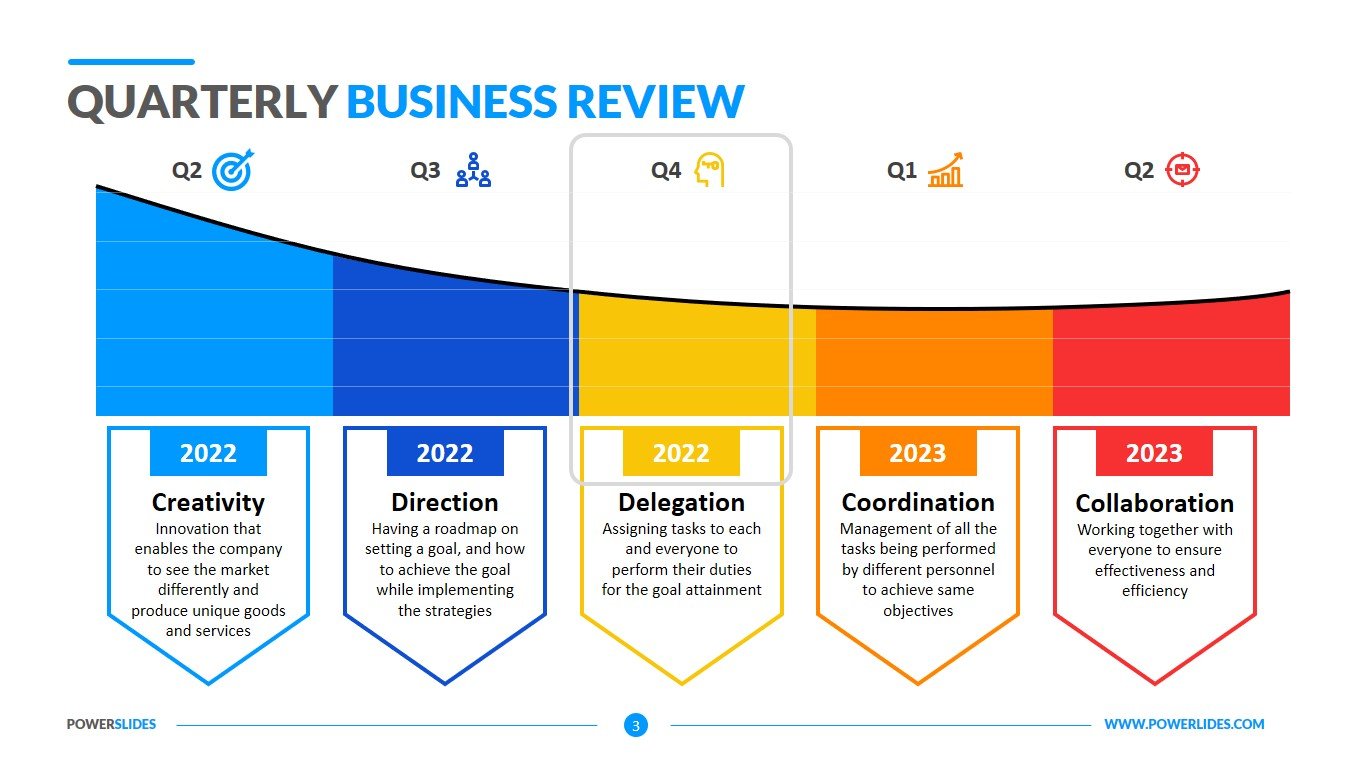
Survey Bar Charts
What do you think of this template?


 (2.33/ 5)
7 ratings

 4 Slides
 File size: 16:9
 Fonts: Lato, Calibri
 Supported version
PPT 2010, PPT 2013, PPT 2016
Supported version
PPT 2010, PPT 2013, PPT 2016

Product details
Communicating your study’s results to your co-workers, managers, and clients in a way that is both professional and easy to understand is a crucial skill for any researcher. Many studies with amazing results are not acted on or fall to the wayside because of its confusing report. In a report, charts go a long way in illustrating findings that are clear and concise.
The main challenge with using charts is selecting the correct type from the wide variety available. Many people do not understand the strengths and weaknesses that come with survey chart types, either deciding off the cuff which looks the nicest or staying in their comfort zone by overloading their report with pie or vertical bar charts. It is important for researchers to use the most effective chart to display their data results.
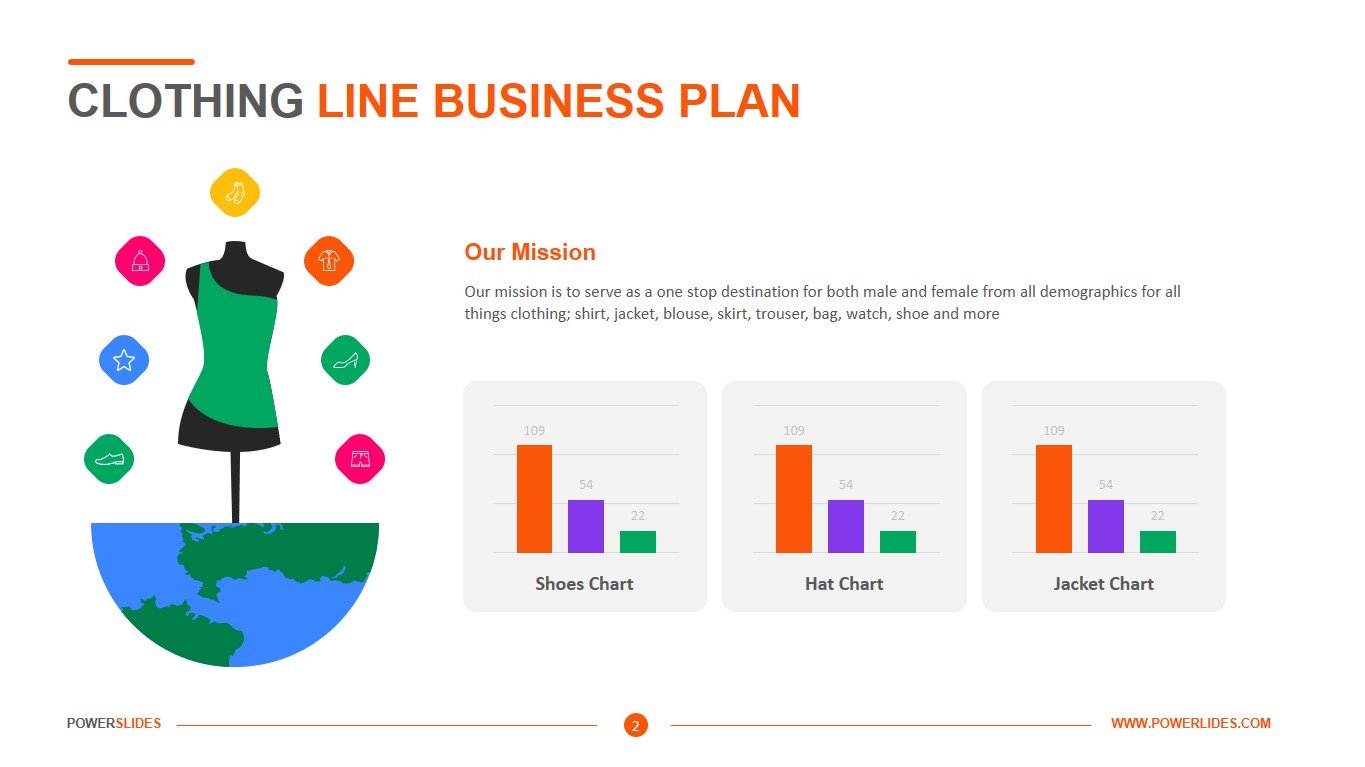
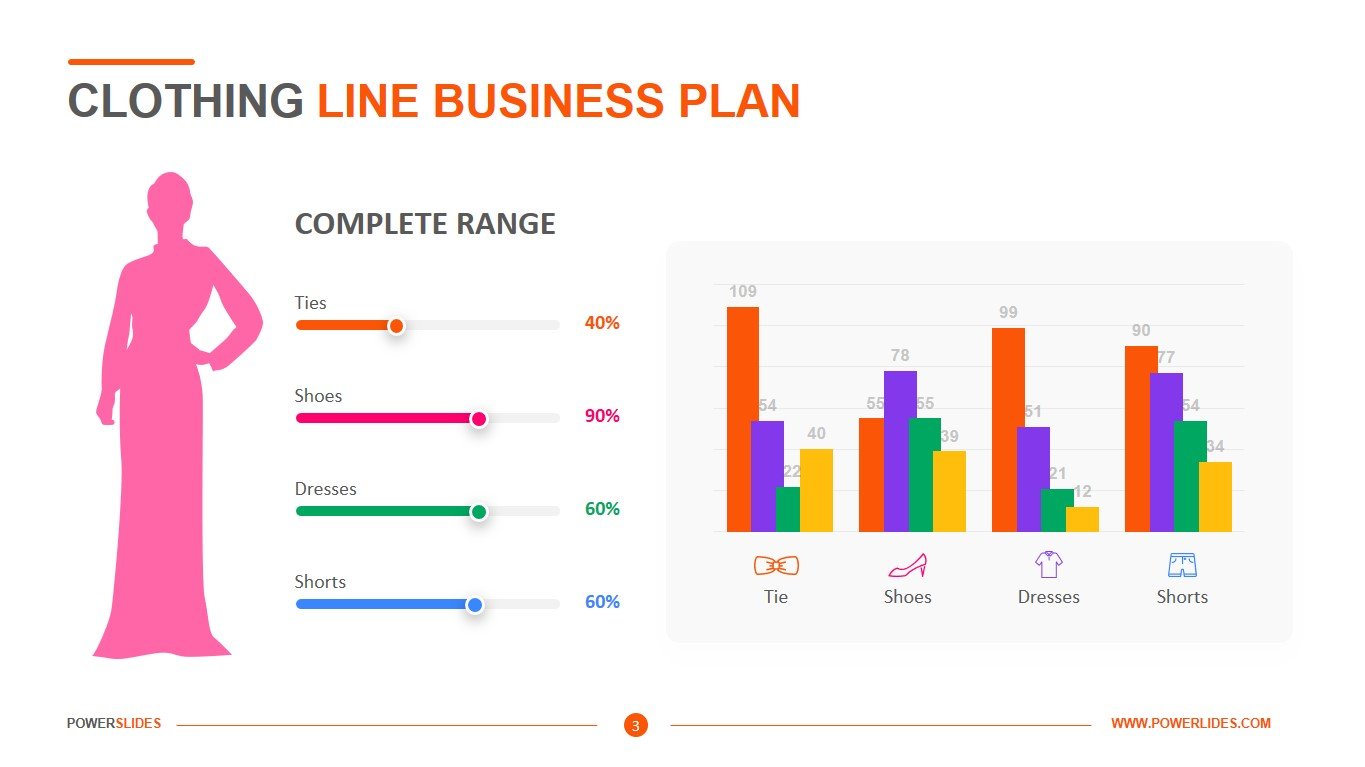
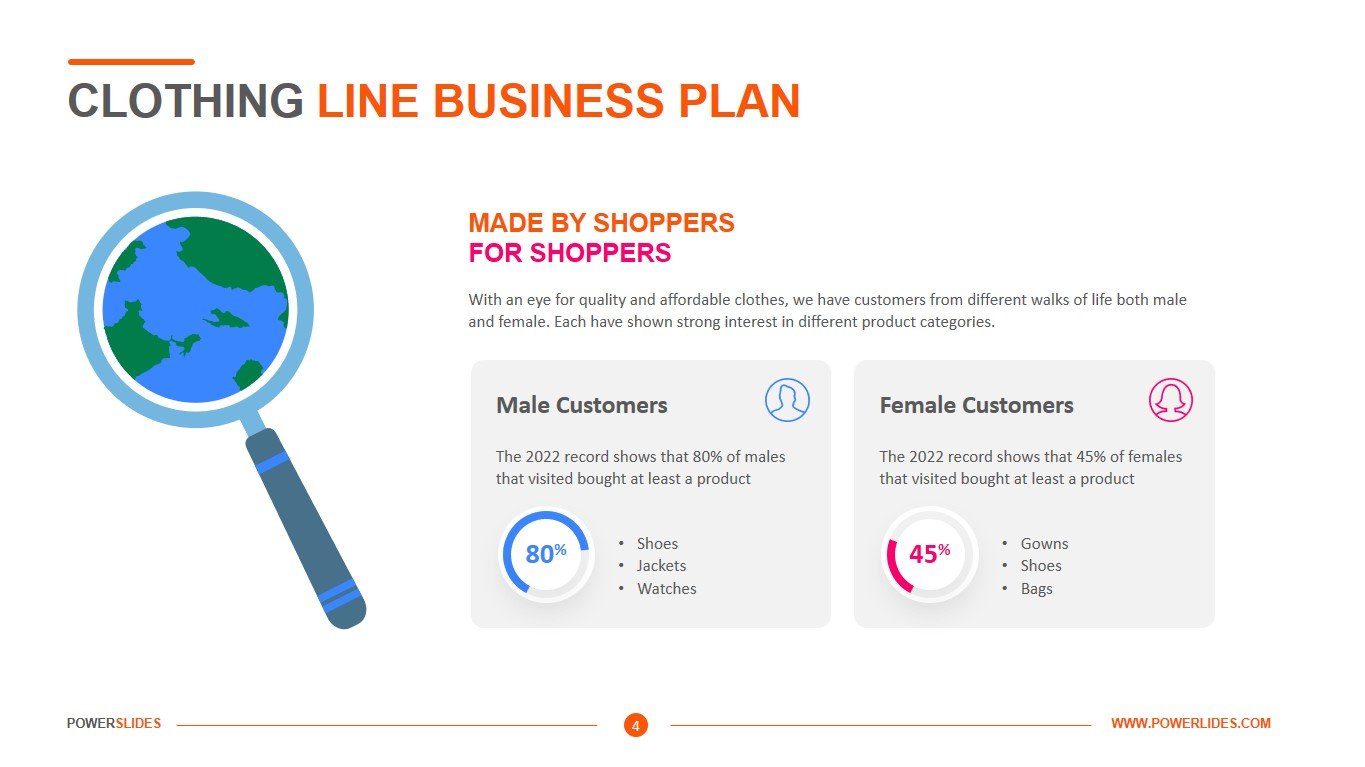
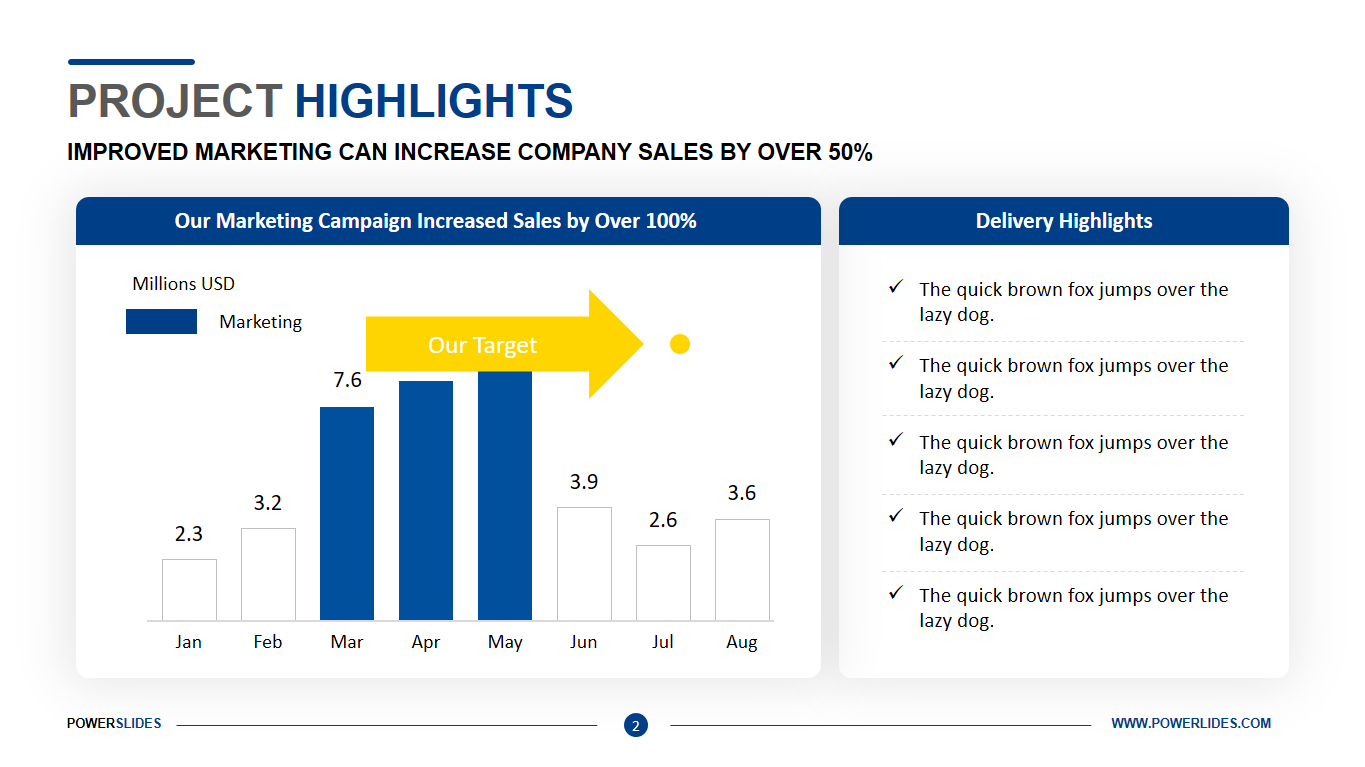
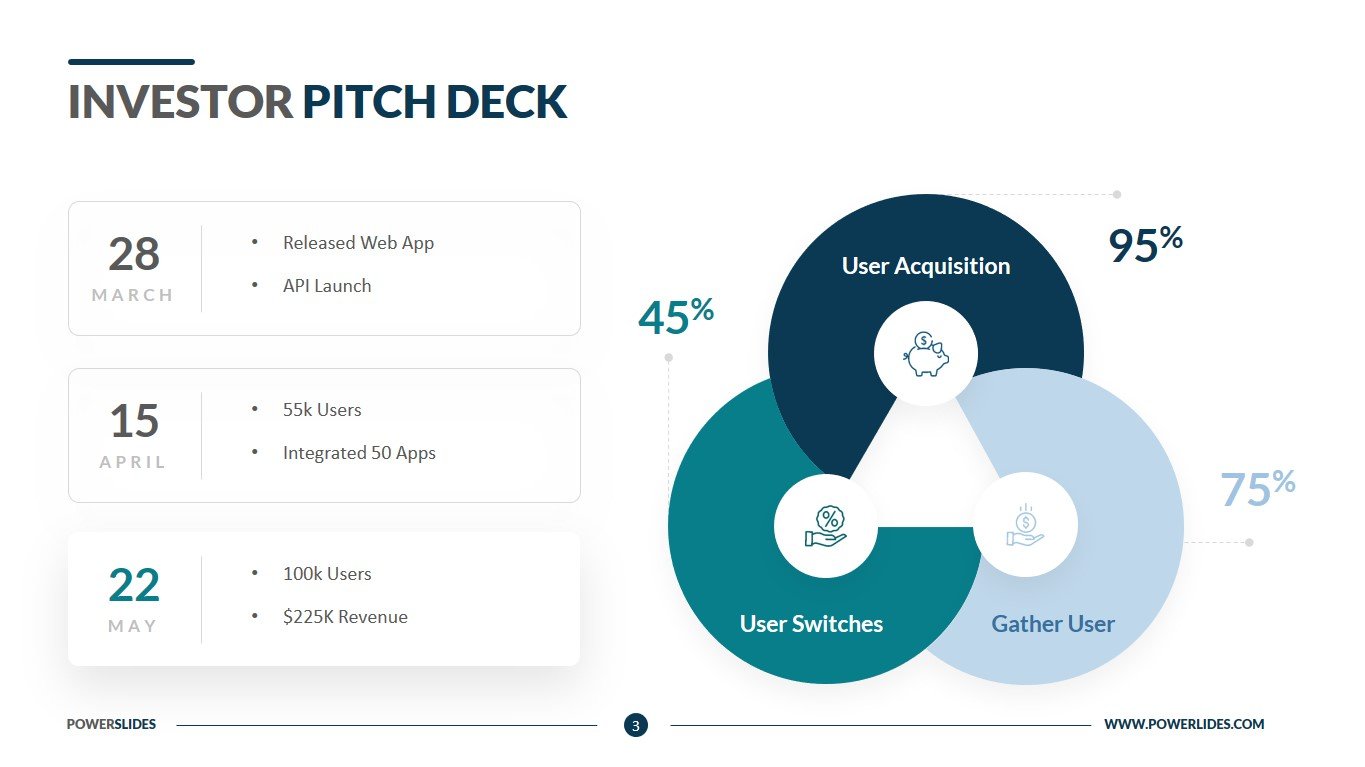
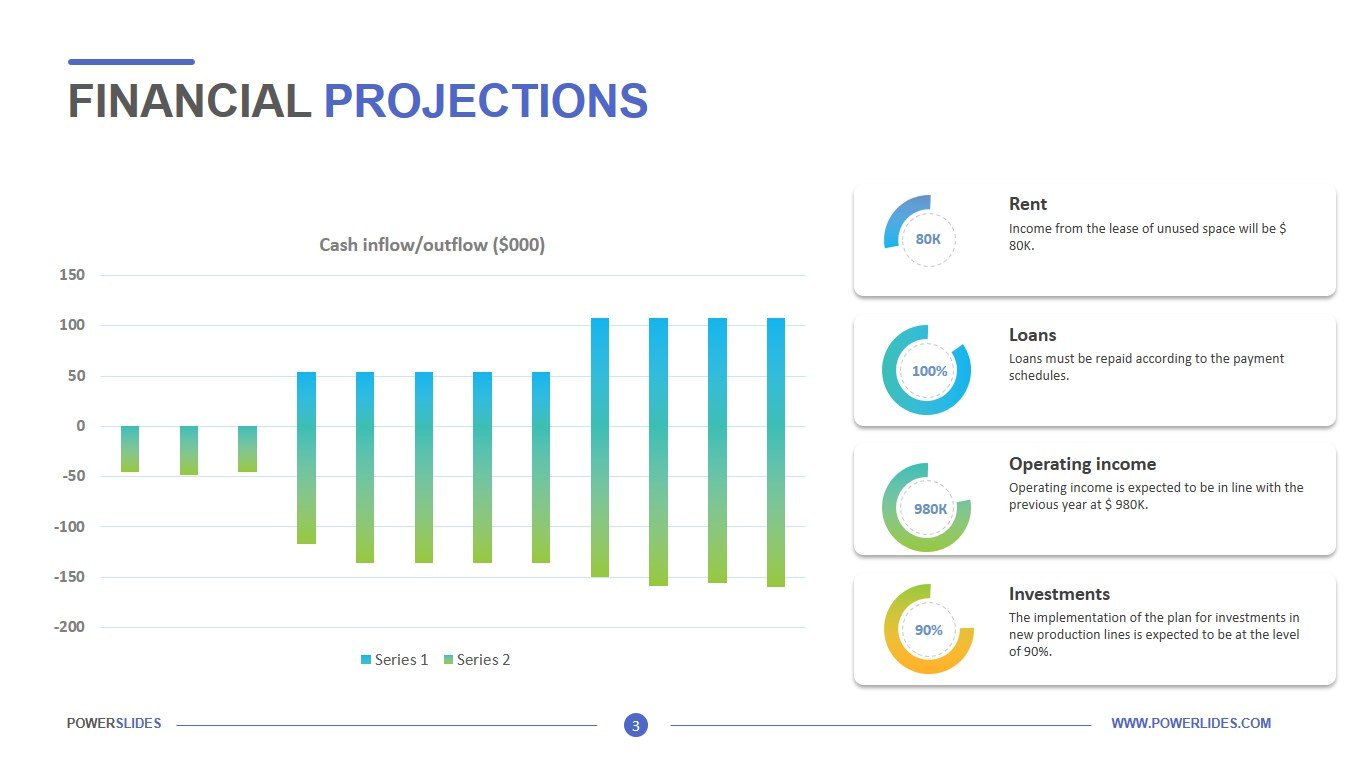
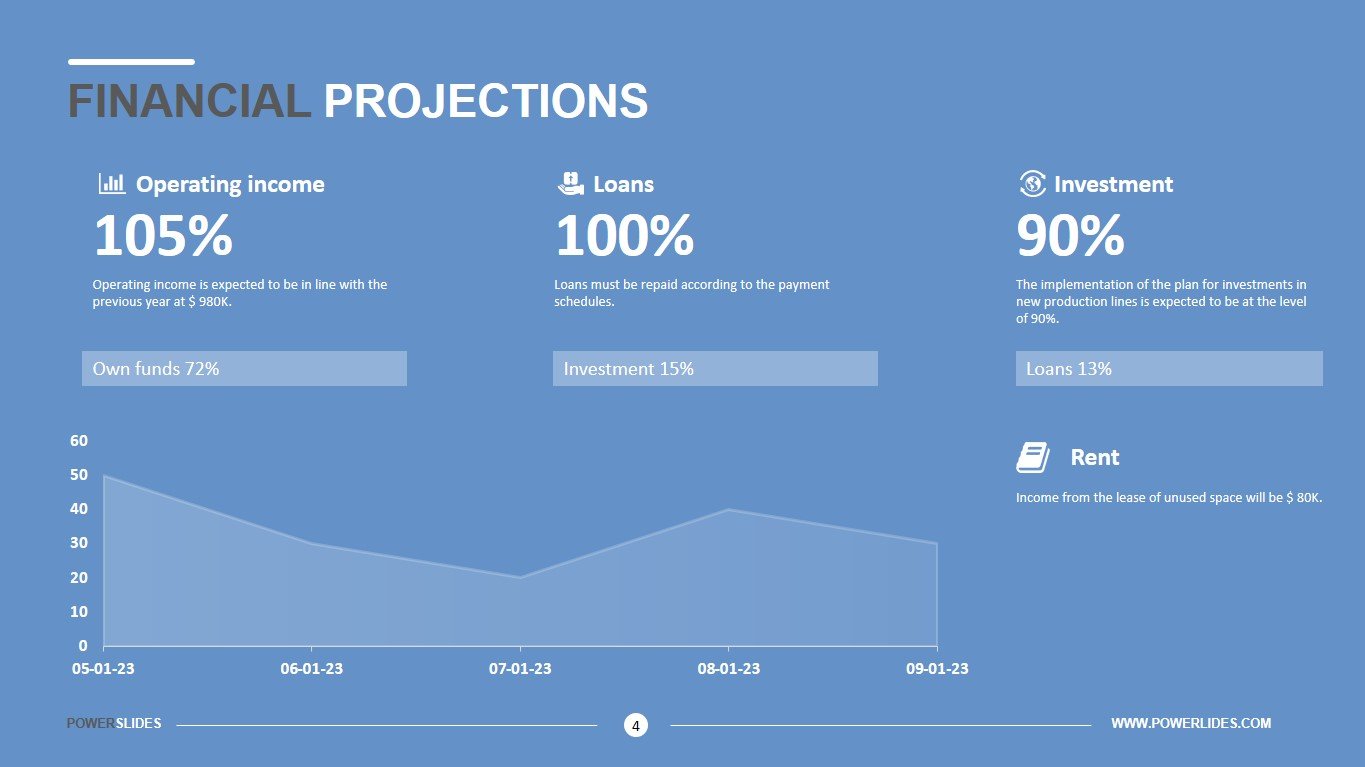
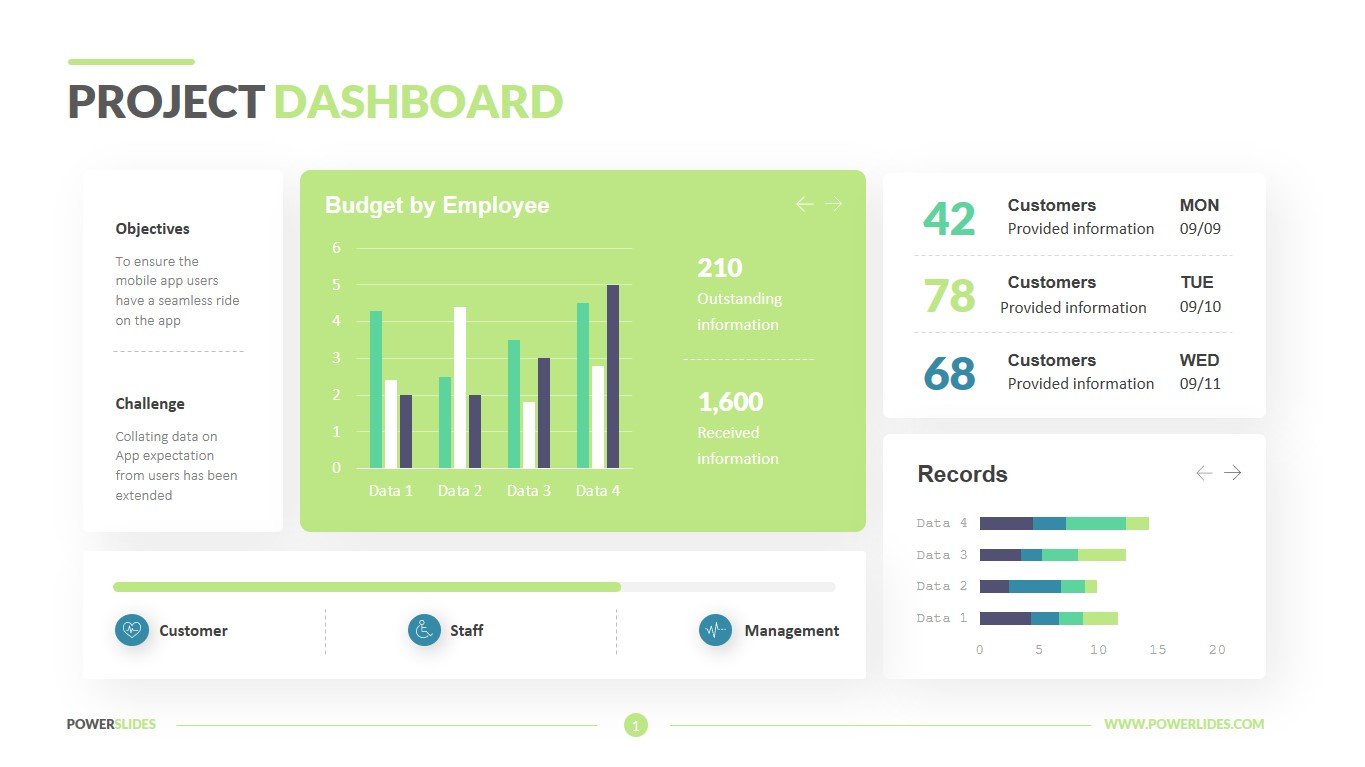
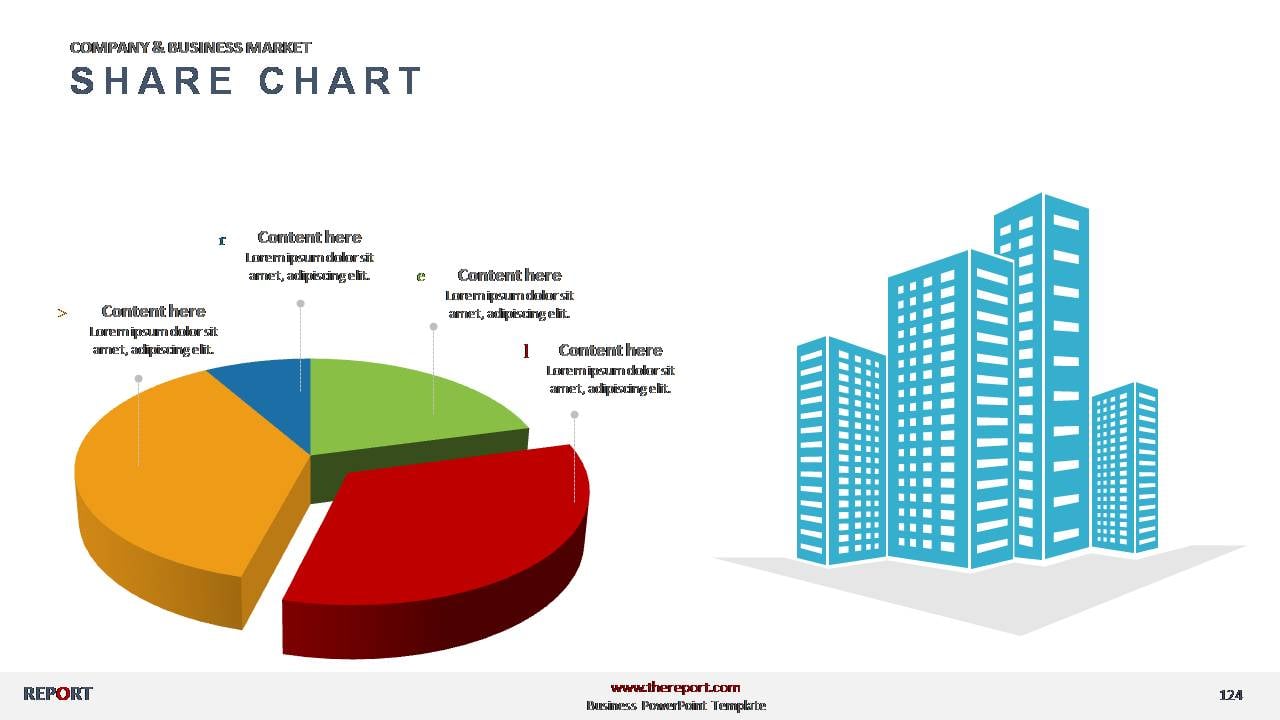
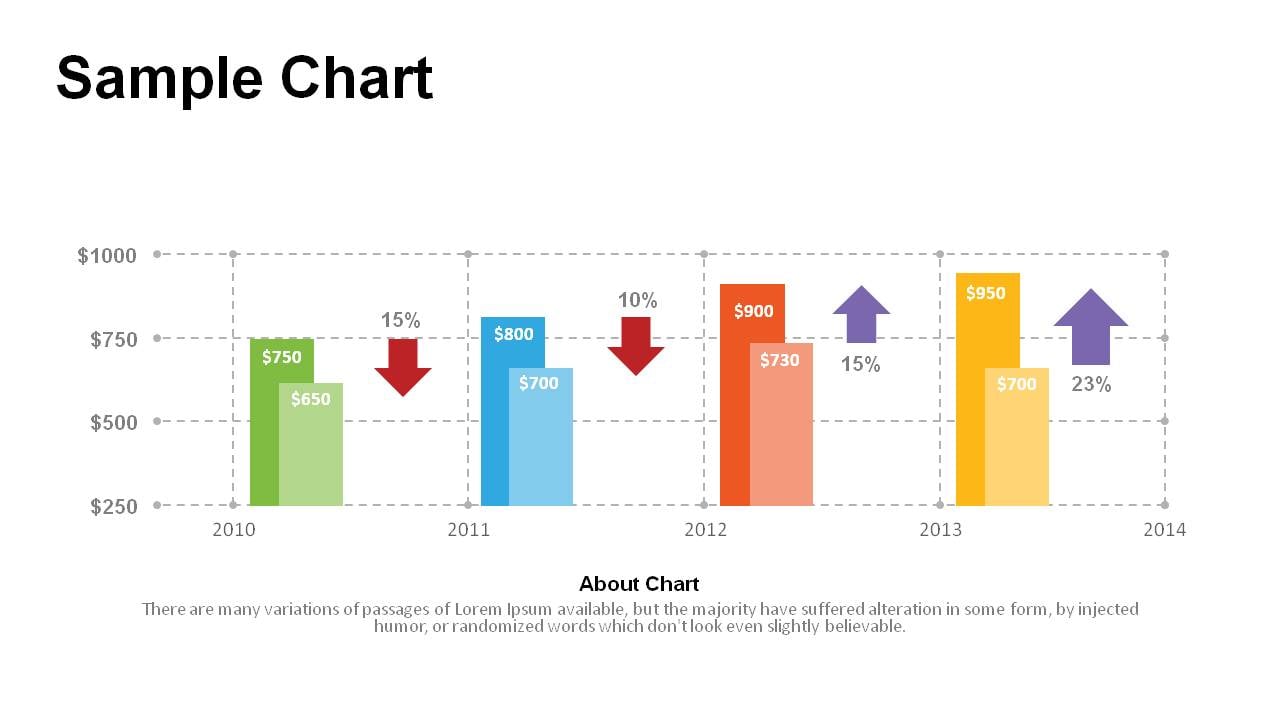
Now analyze your findings with our survey bar chart PowerPoint template. These charts can be used to show a comparison between values overtime or any other scale of your choice. Our template is completely customizable, meaning that it provides you complete autonomy over editing to turn it into your unique presentation.
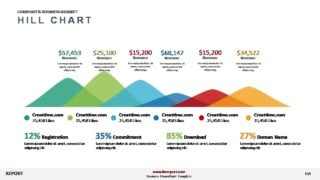
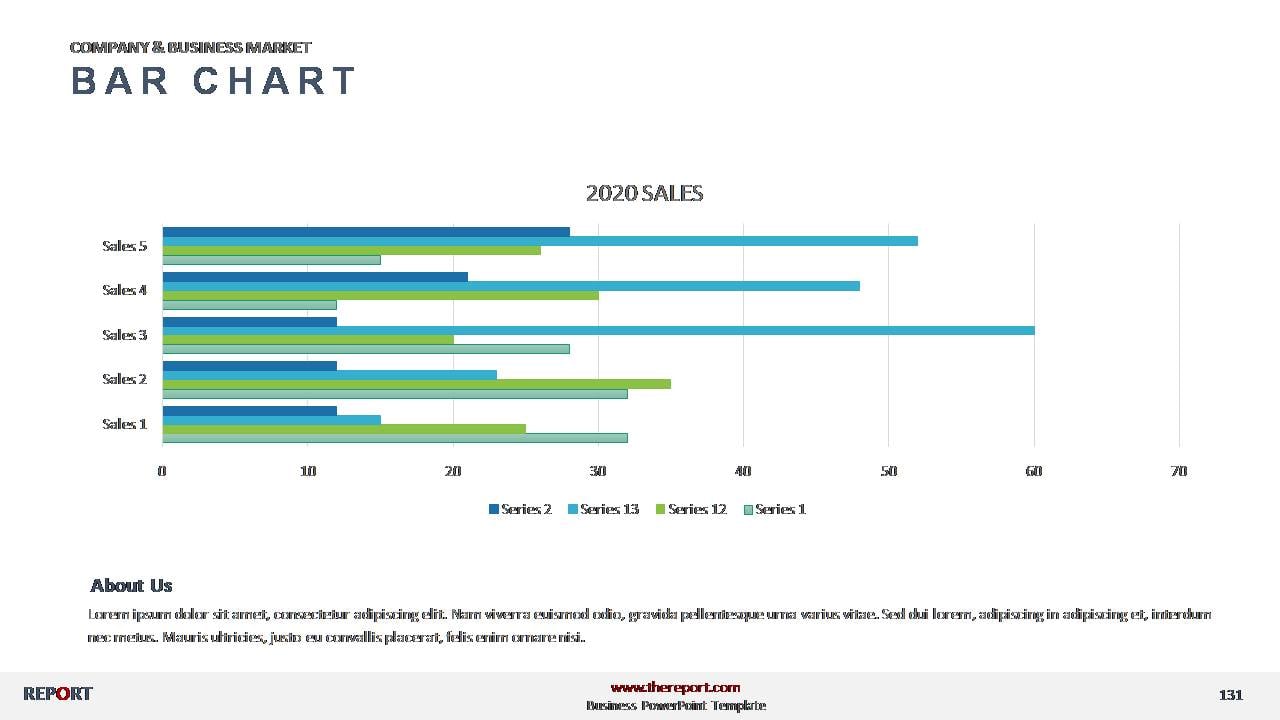
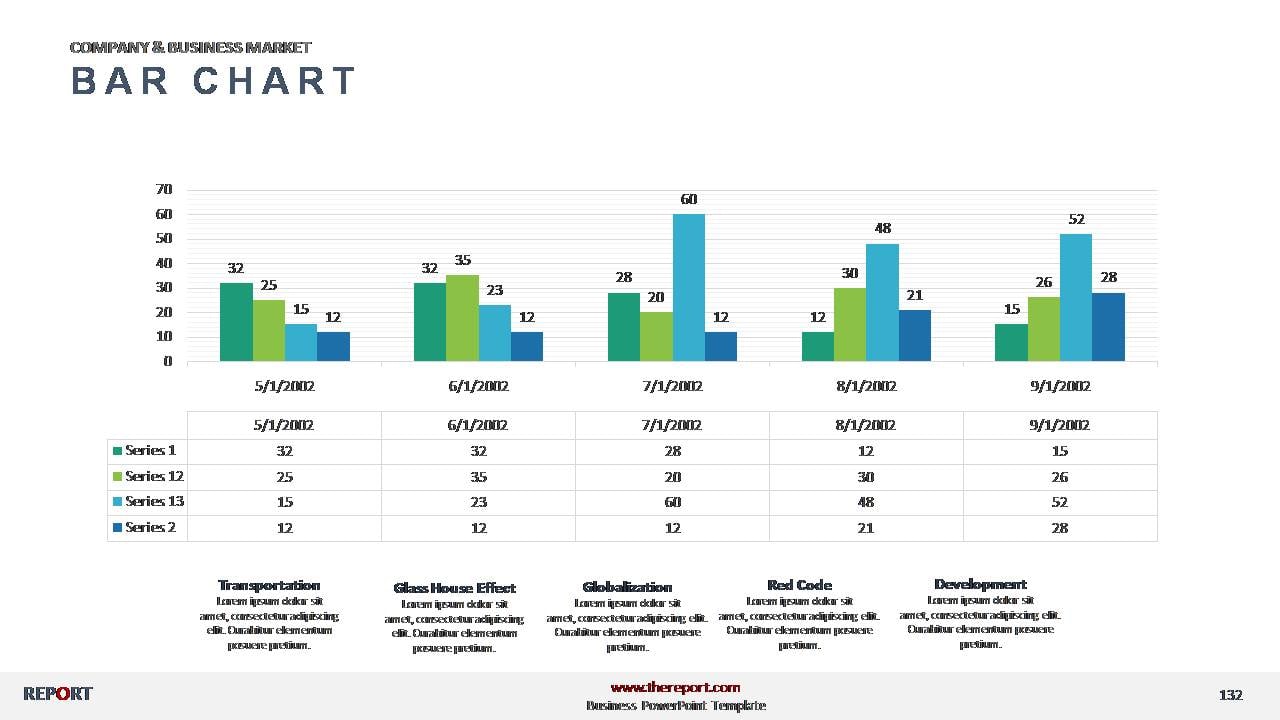
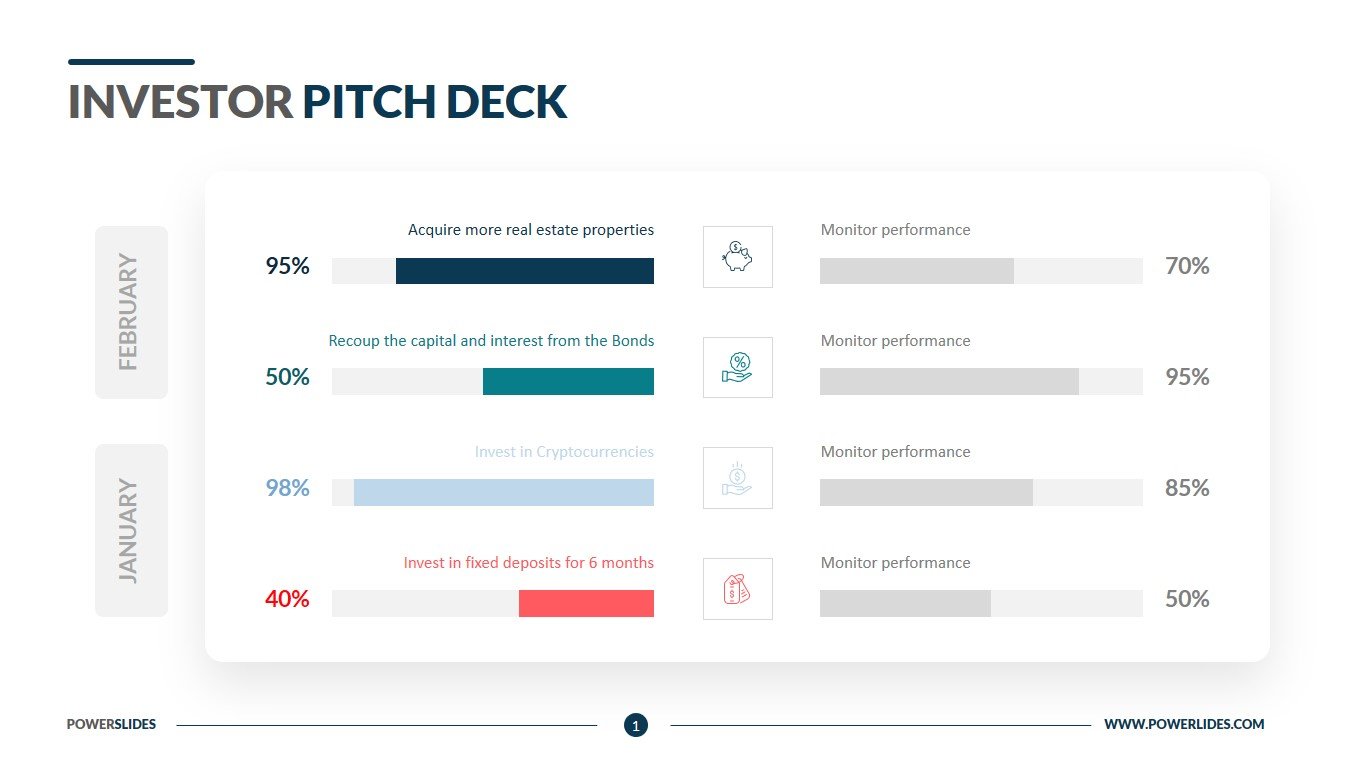
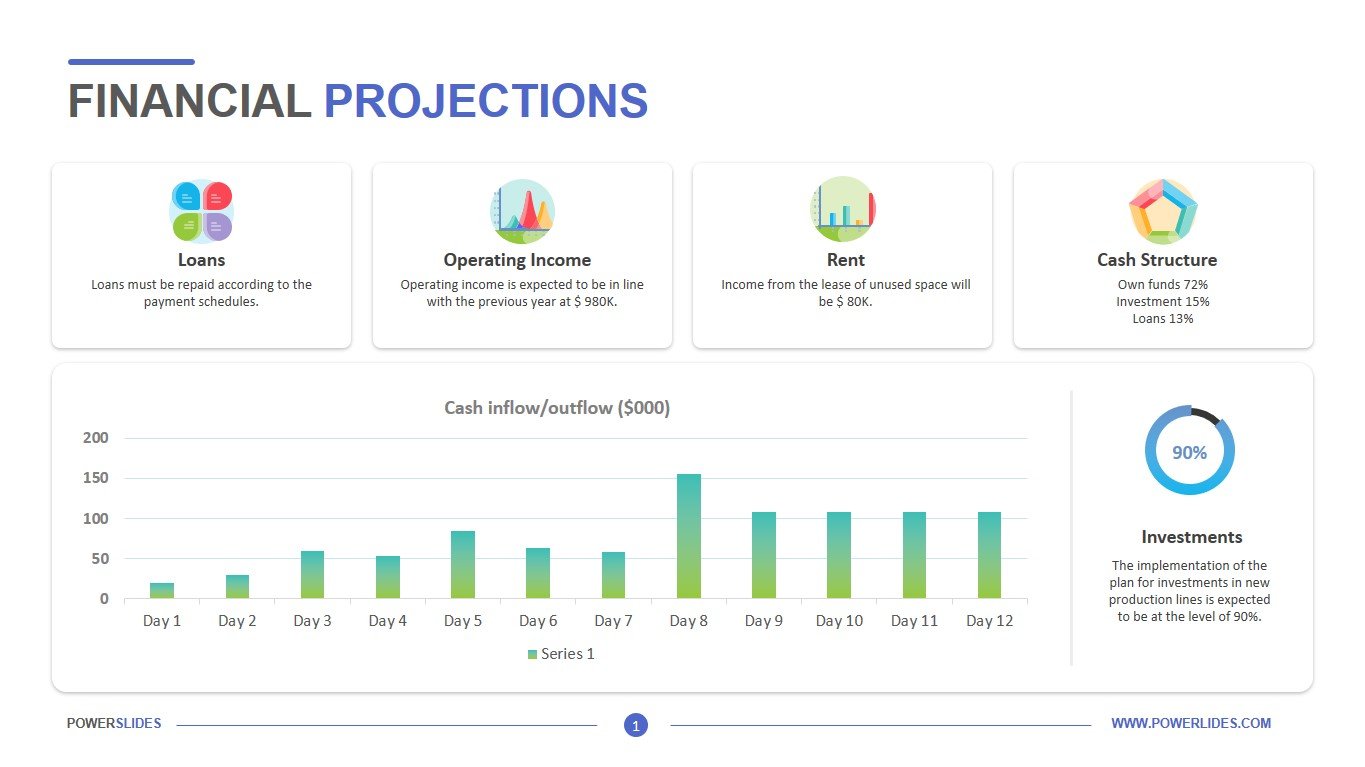
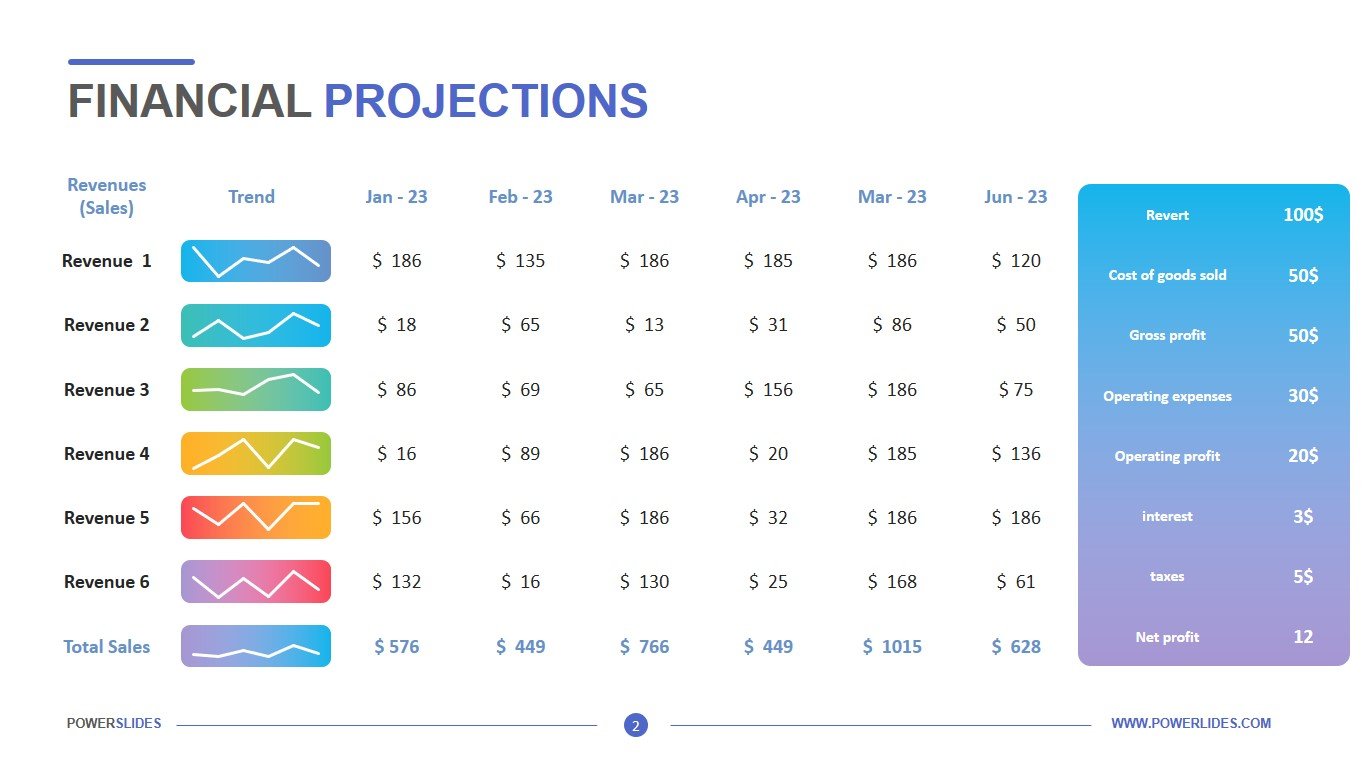
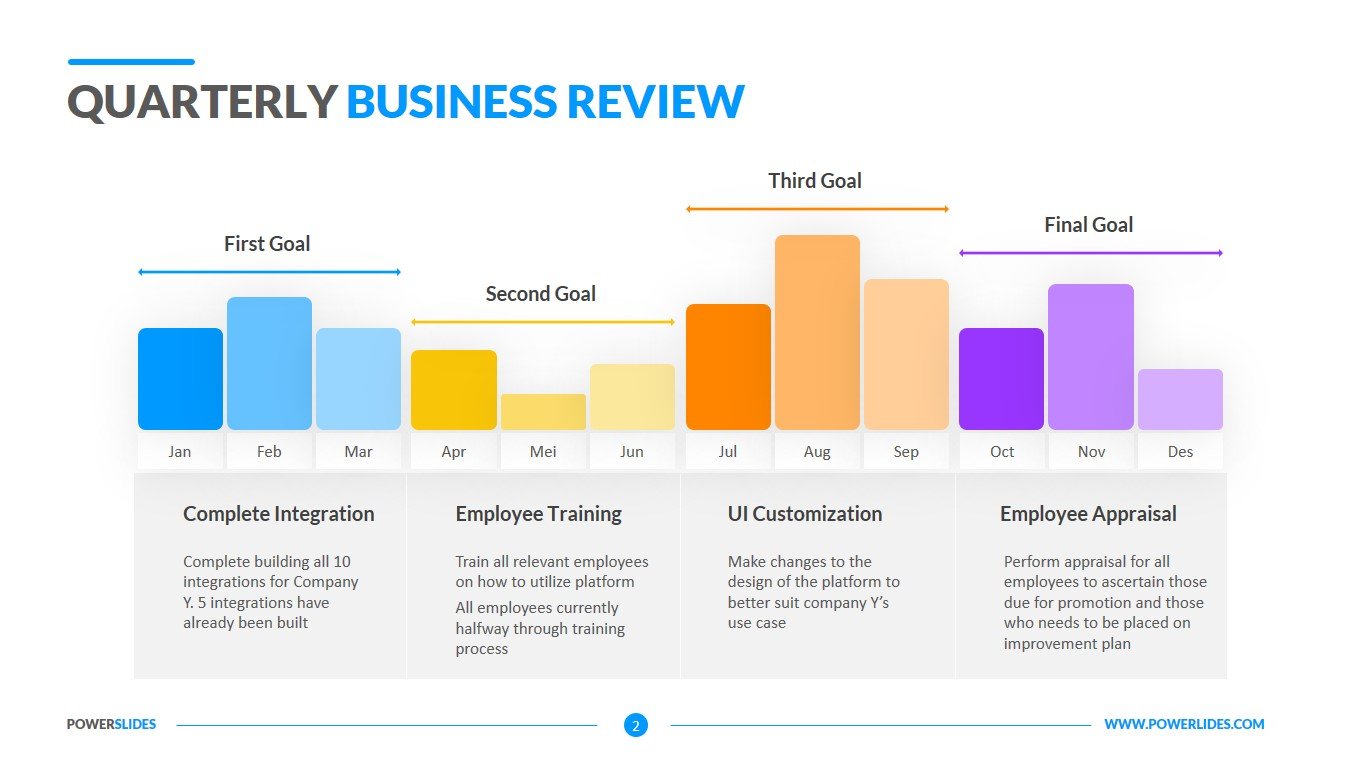
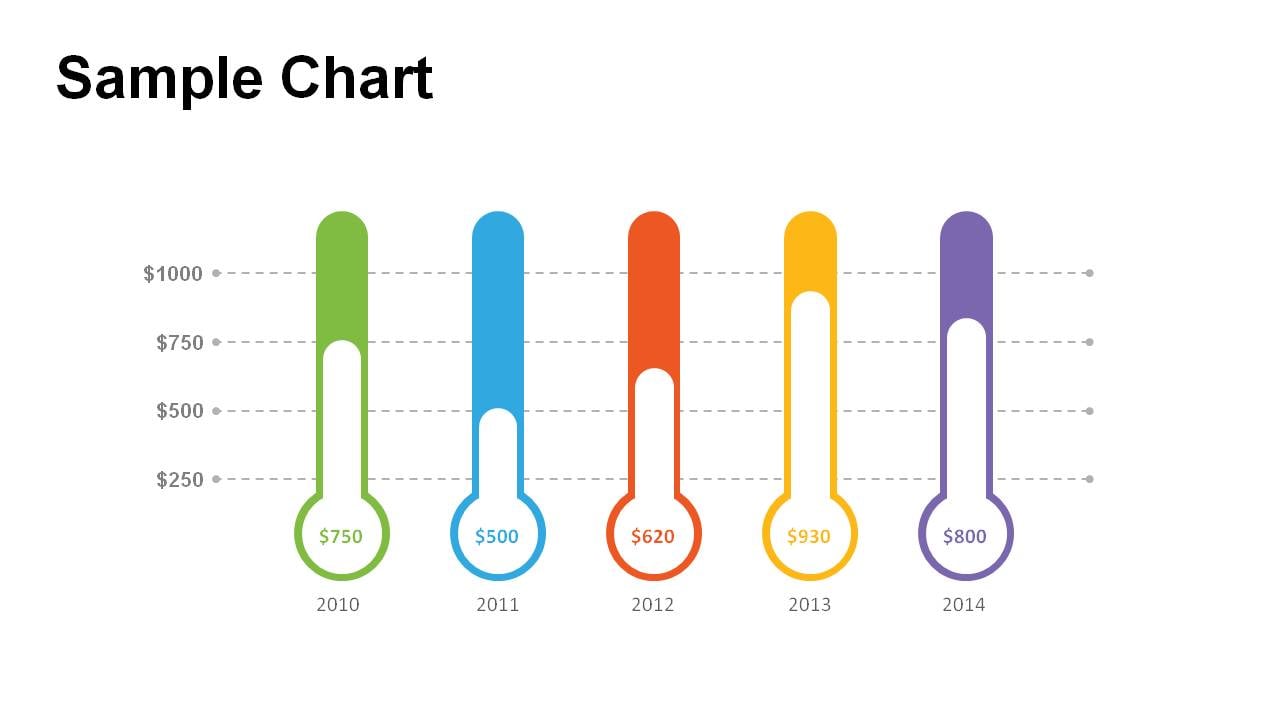
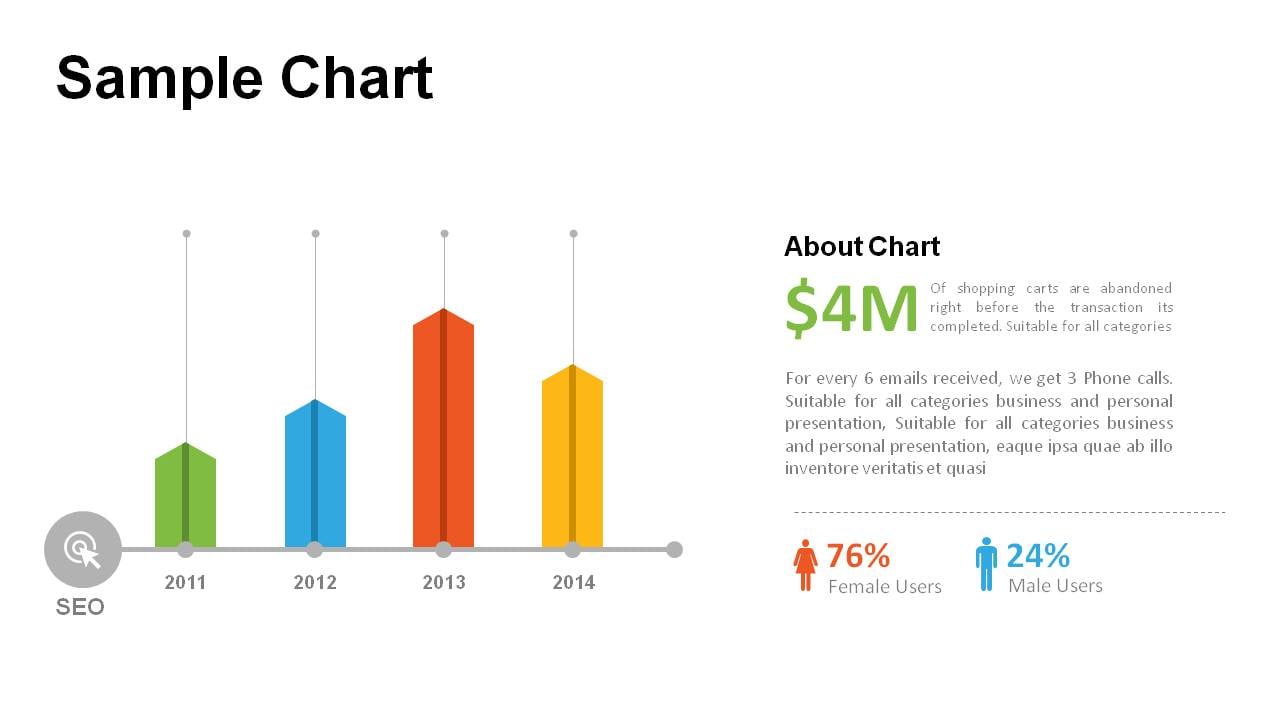
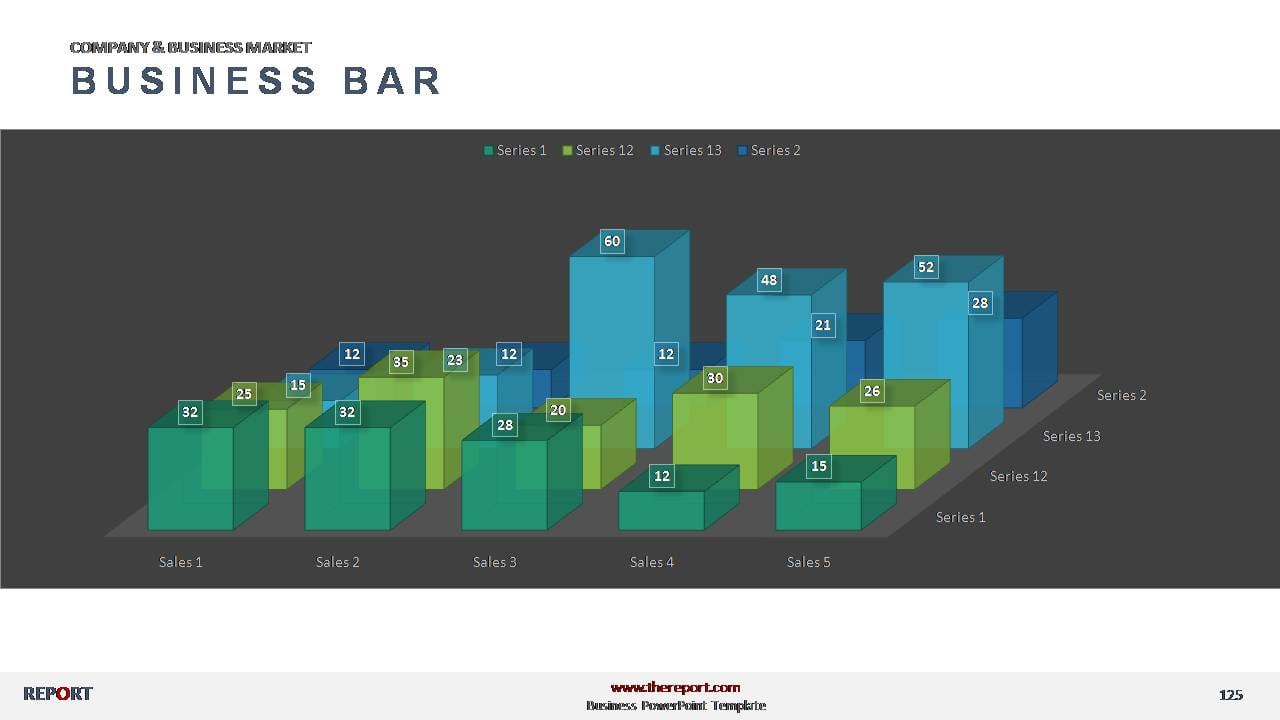
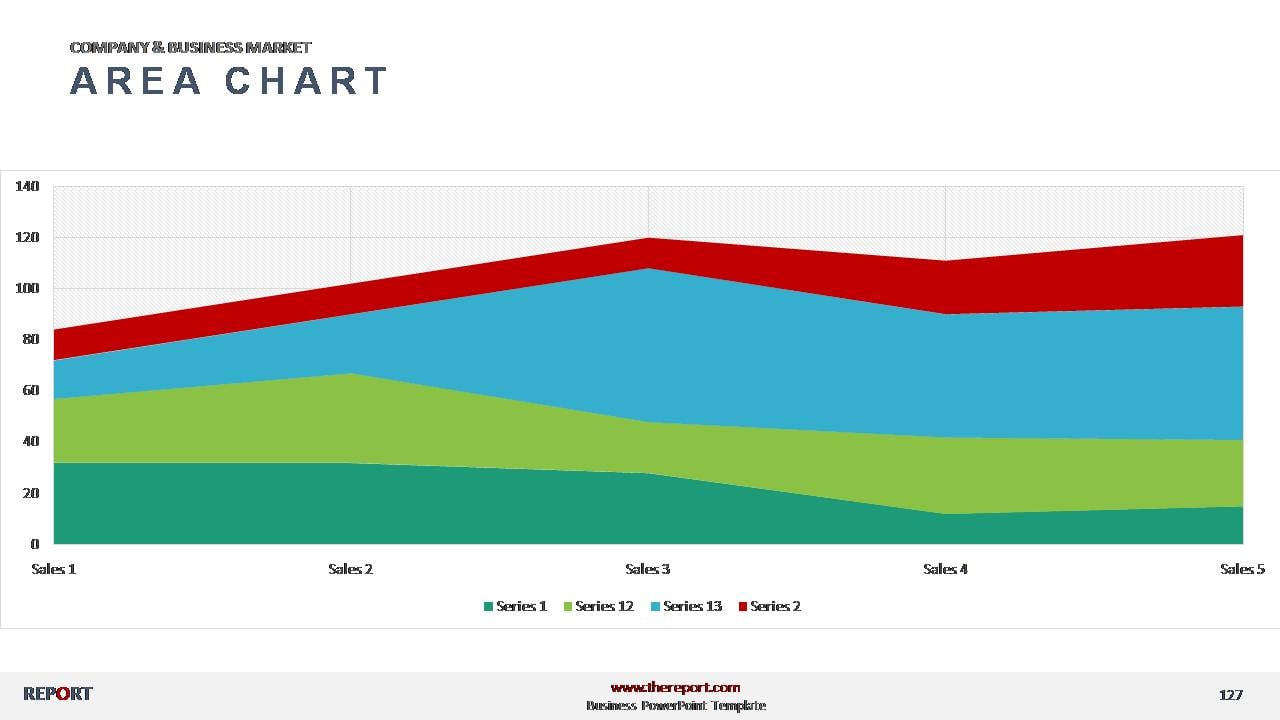
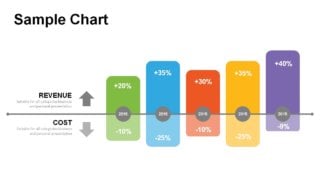
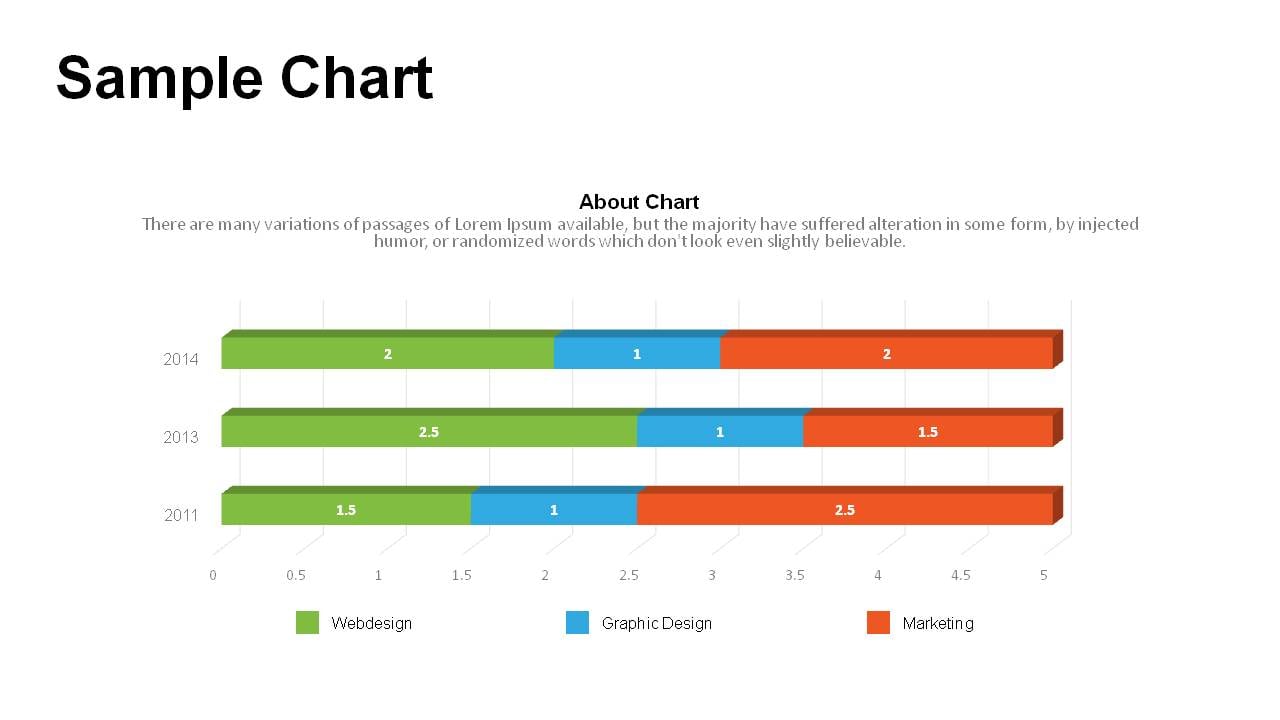
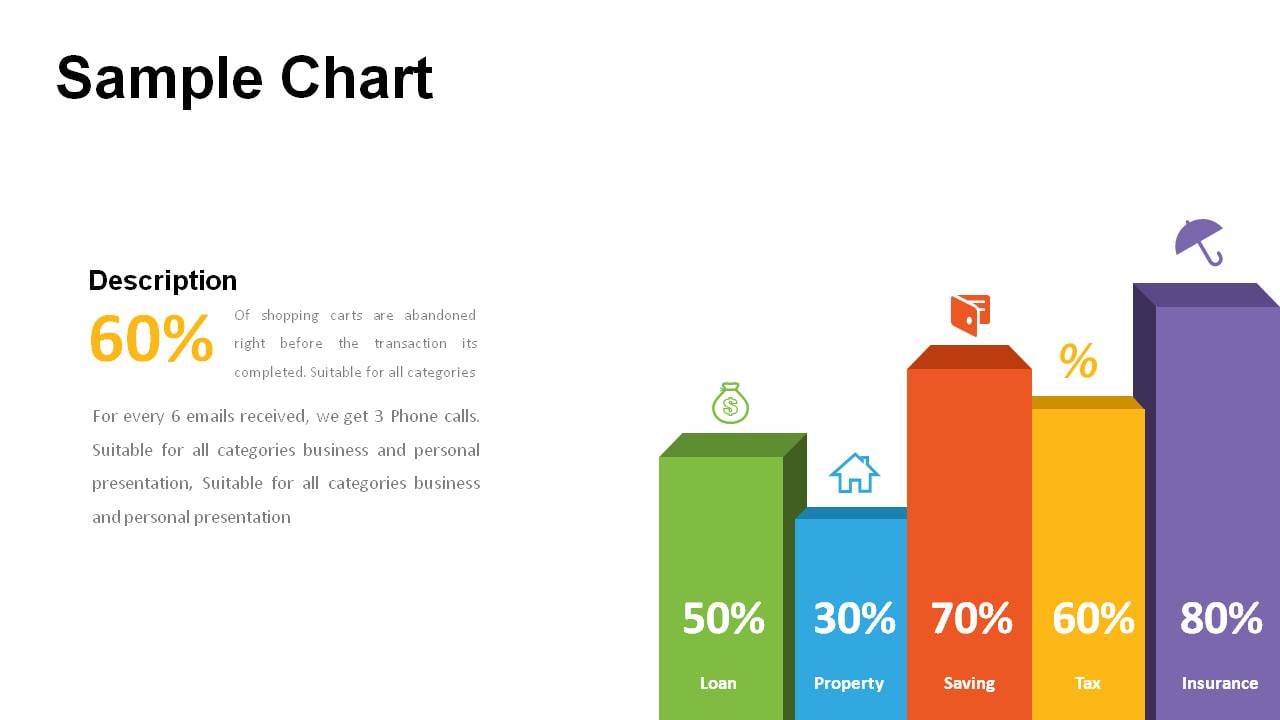
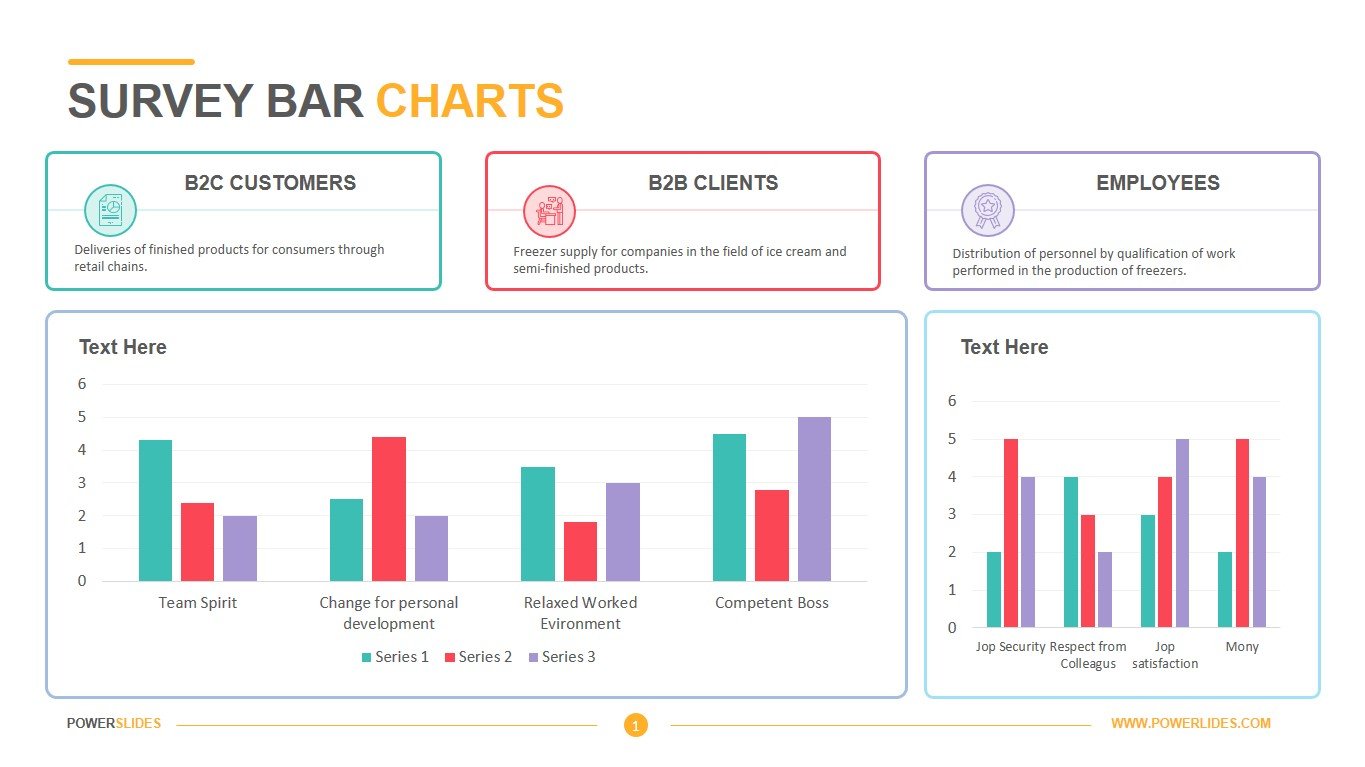
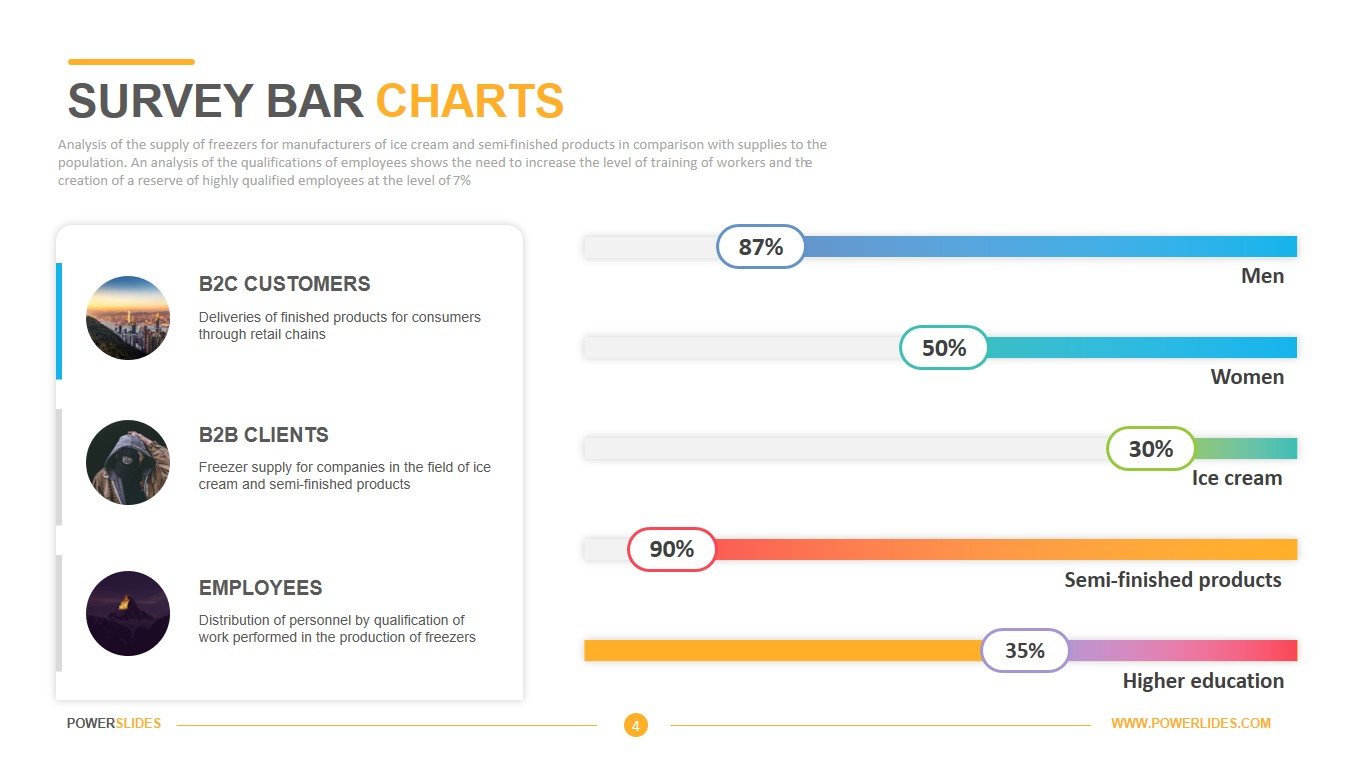
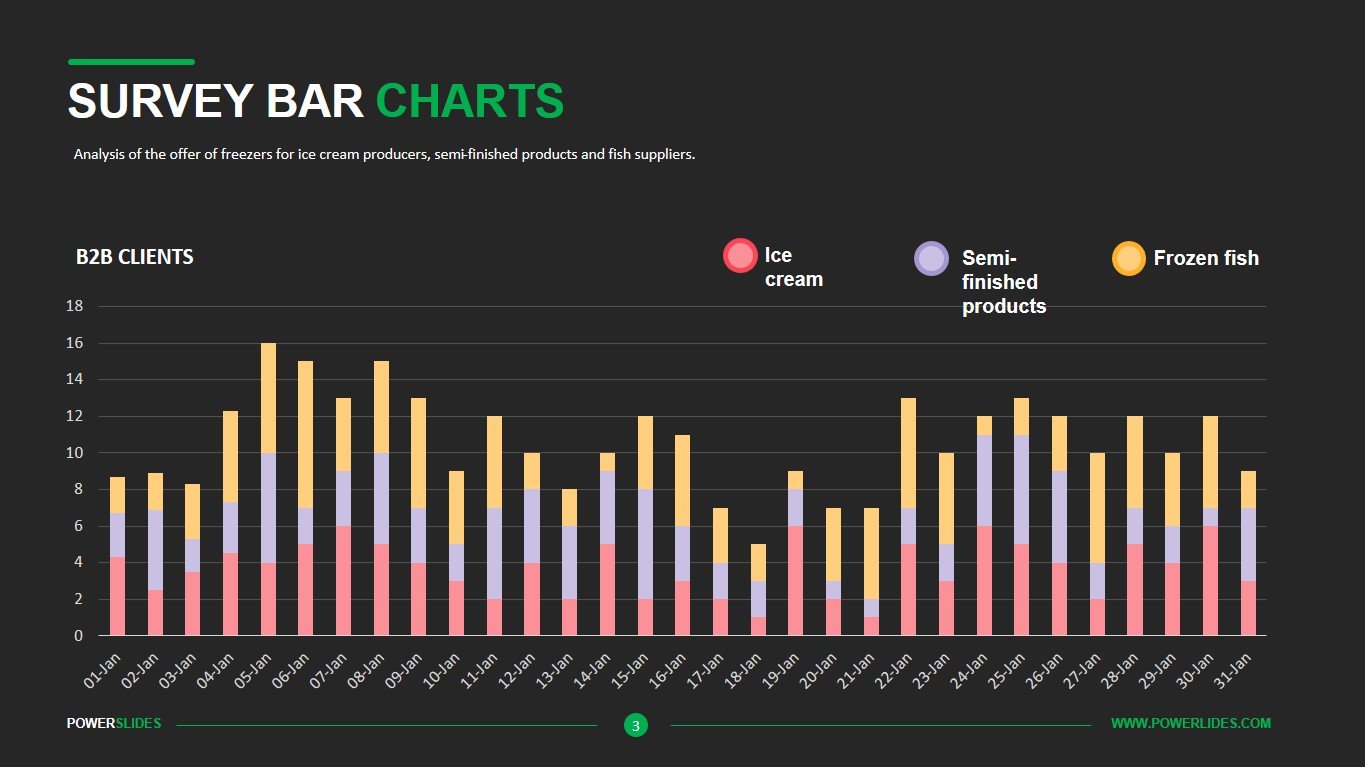
Out of 4 different and 3 of them are lightly themed whereas the remaining one is based on the dark theme. You can pick any one of these based on the theme of your whole presentation. The designs use classic vertical bar charts to represent the minimum and maximum value, helping you analyze your data. Additionally, we’re also providing an innovative horizontal bar chart design with little text boxes on the left to help you insert details about what each bar chart represents.
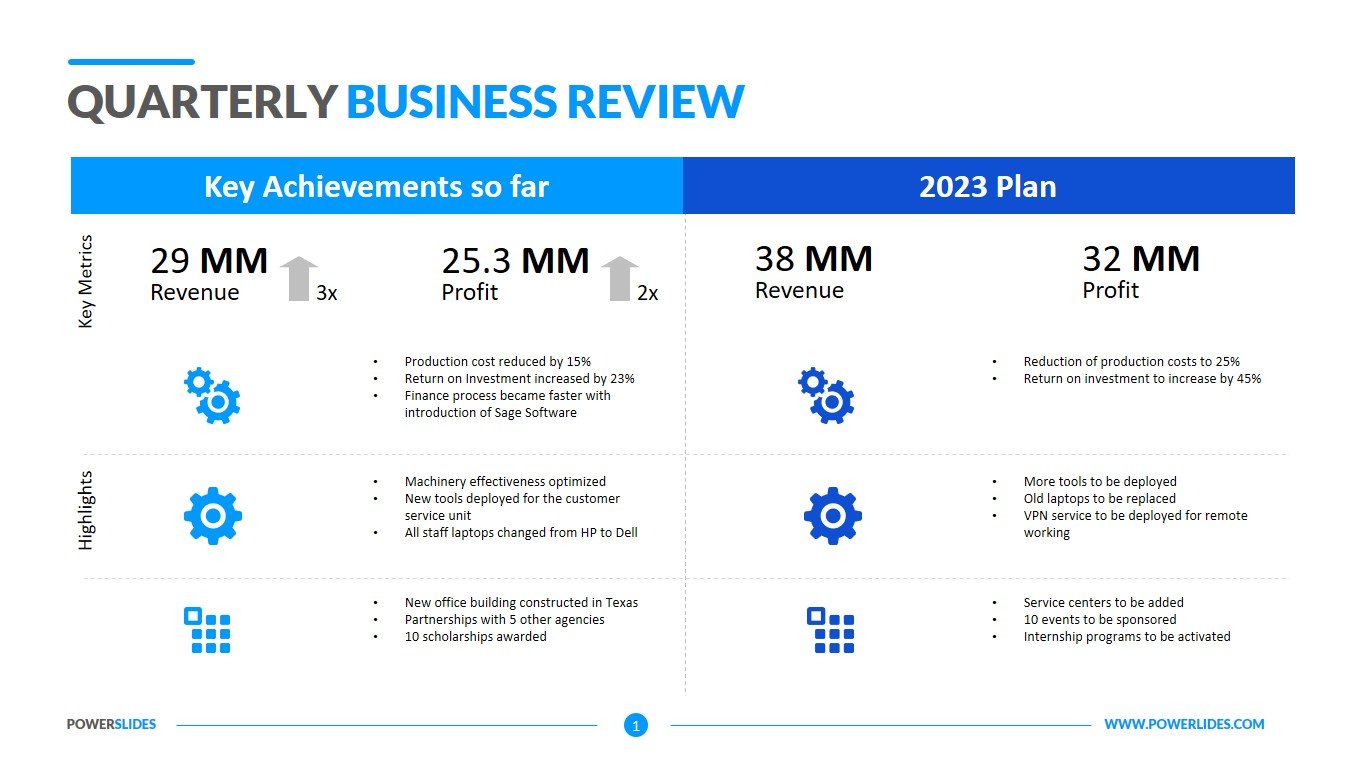
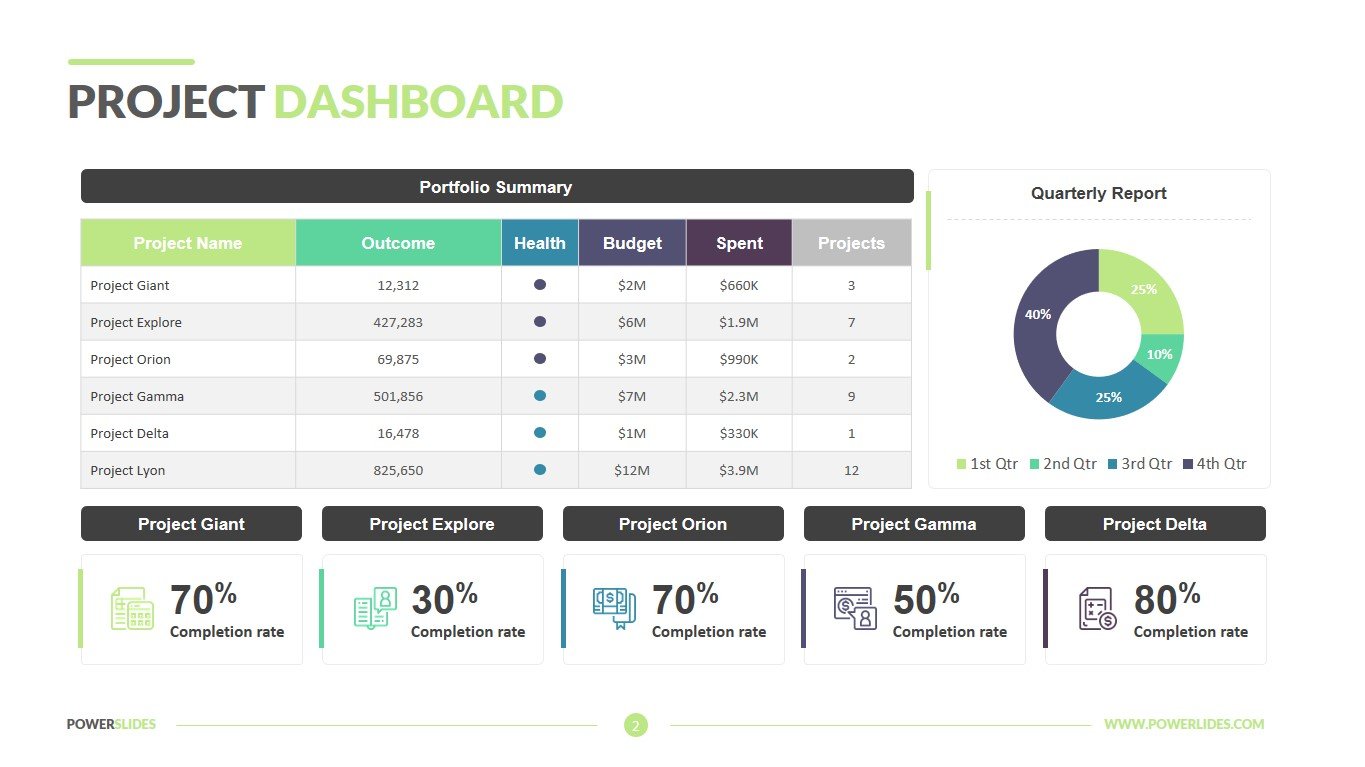
This template will primarily be useful to economists and financiers. You can use the slides of this template when preparing your analytical reports or planning future profits. This template will also be useful for sales managers when preparing information about planned and actual sales to customers for various types of products.
Investment companies can use the slides in this template to prepare information about the financial condition of companies in which they plan to invest. Startup executives can also use this template when preparing to meet with potential investors.
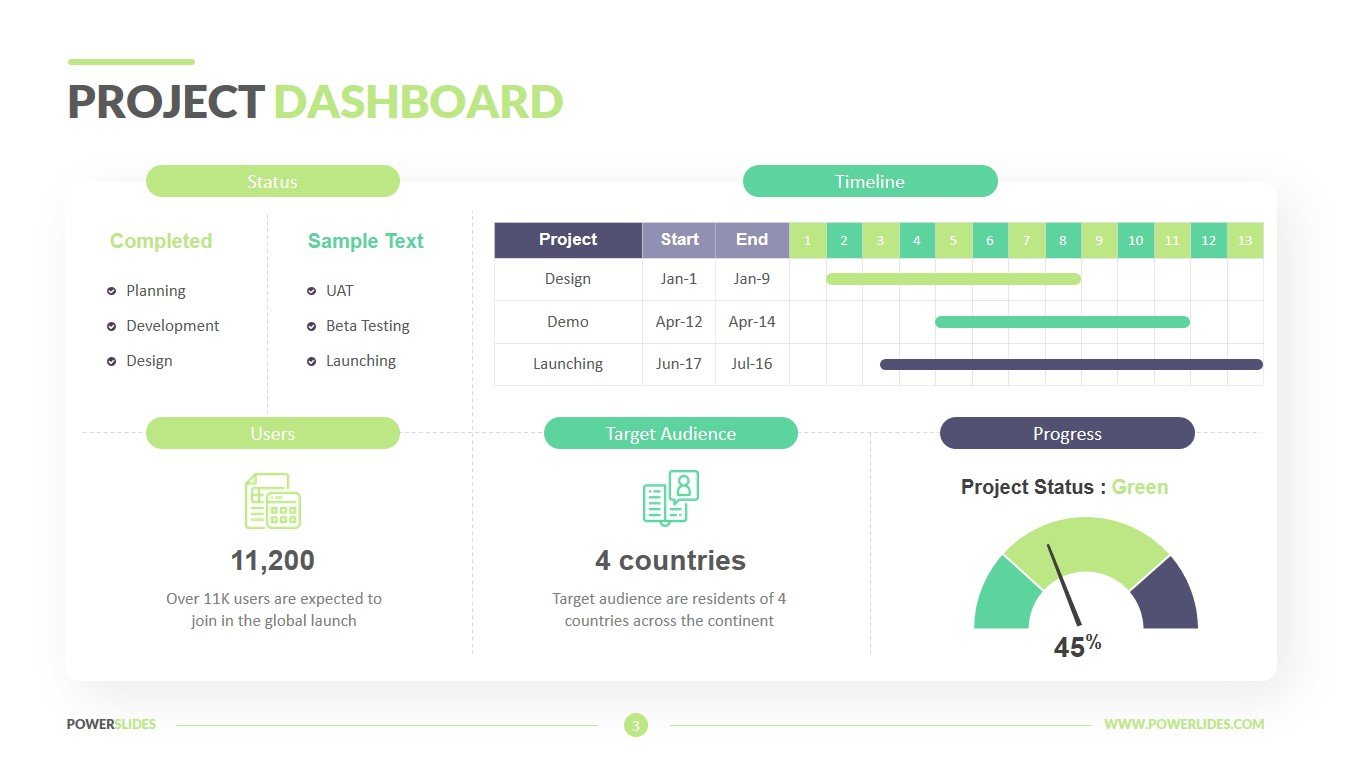
Marketing professionals can use this template when preparing their marketing strategy for the company’s board of directors. University professors and business coaches can use the slides from this template to prepare their courses in economics and financial planning.
Why you should use our template? The bar chart survey template is easily editable. You can choose the color scheme and appearance of your charts as well as change the scales, to what suits you the best. We care about your needs and wants and made the template perfectly elegant to be displayed in front of your boss and colleagues.
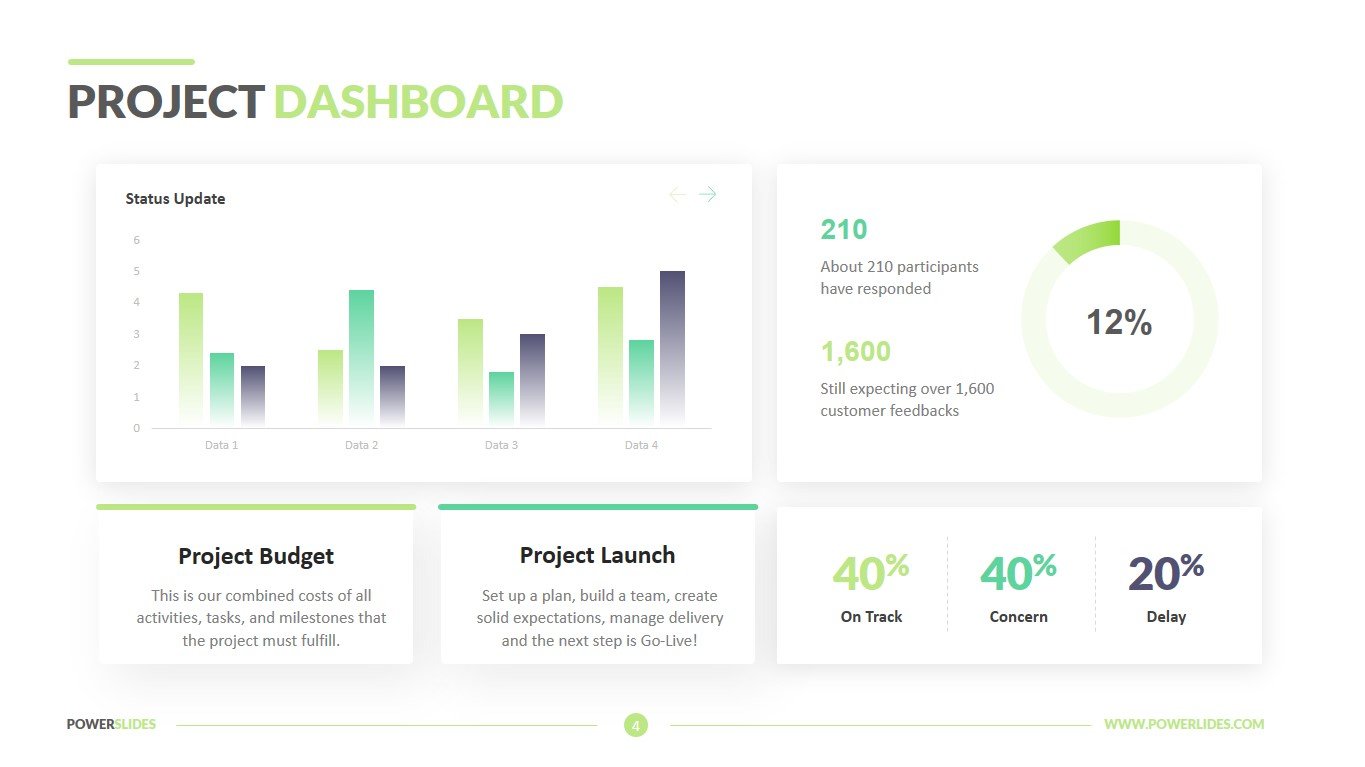
The Survey Bar Charts Template contains all the tools you need to prepare a professional and stylish presentation. If necessary, you can independently change the size and color of infographics and graphs, the location of text blocks and the type of font in accordance with your corporate requirements.


