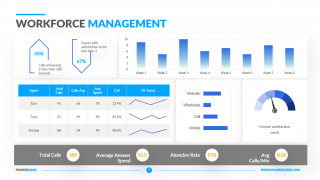
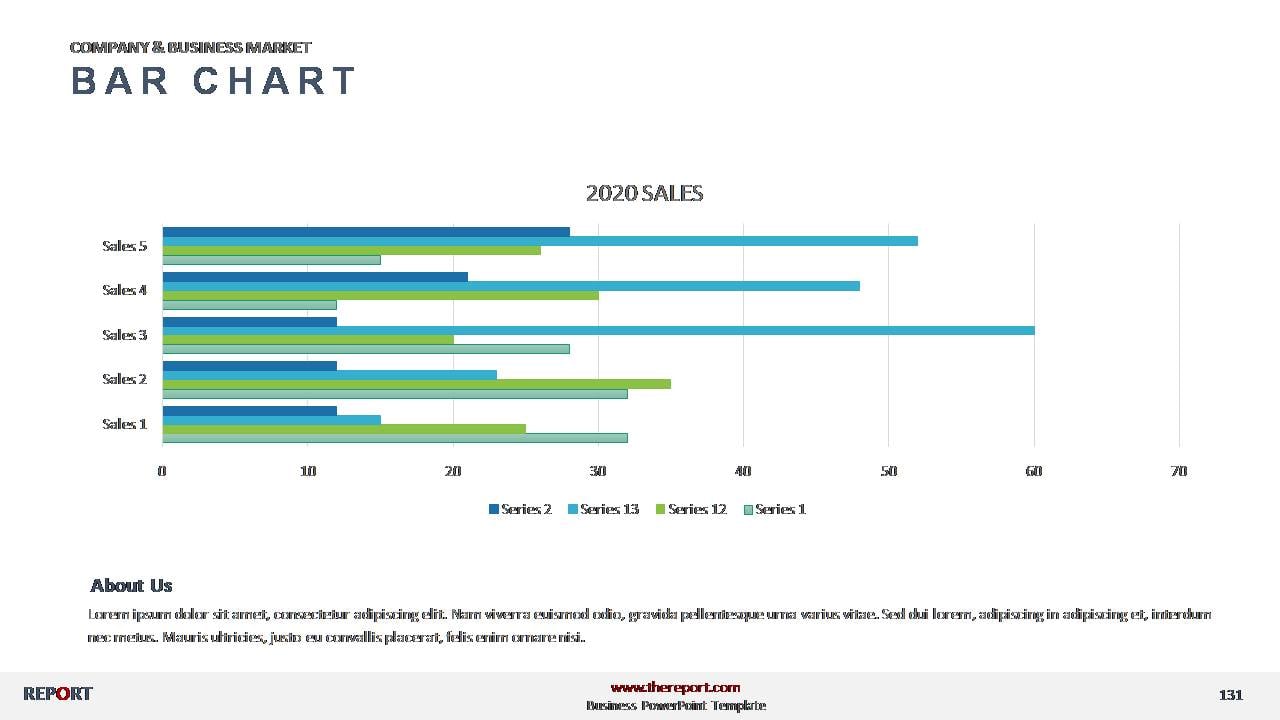
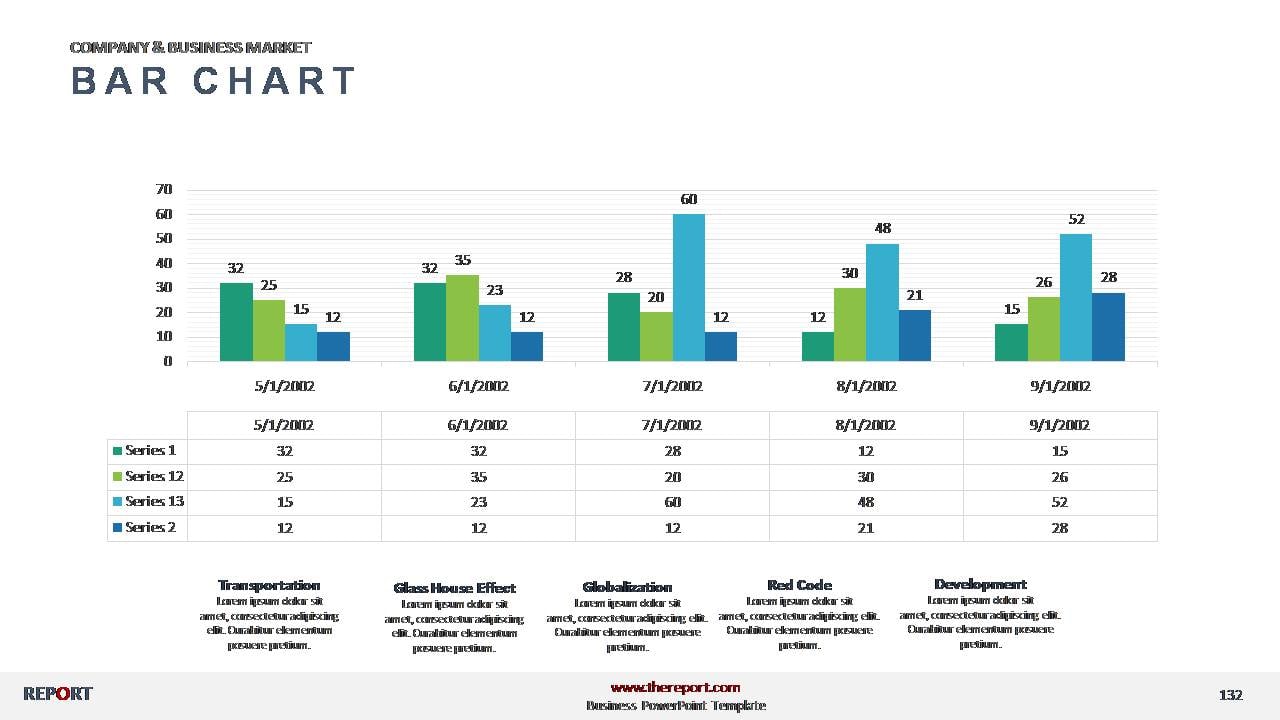
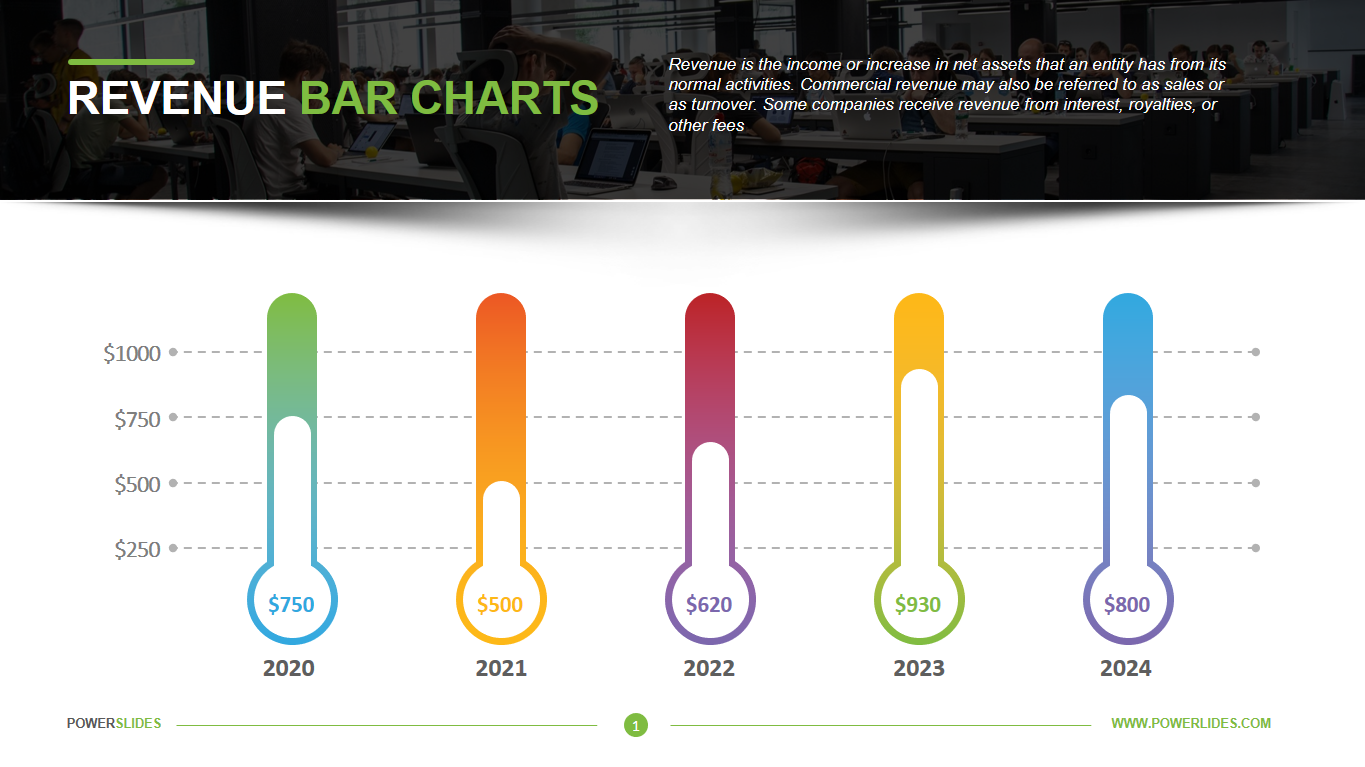
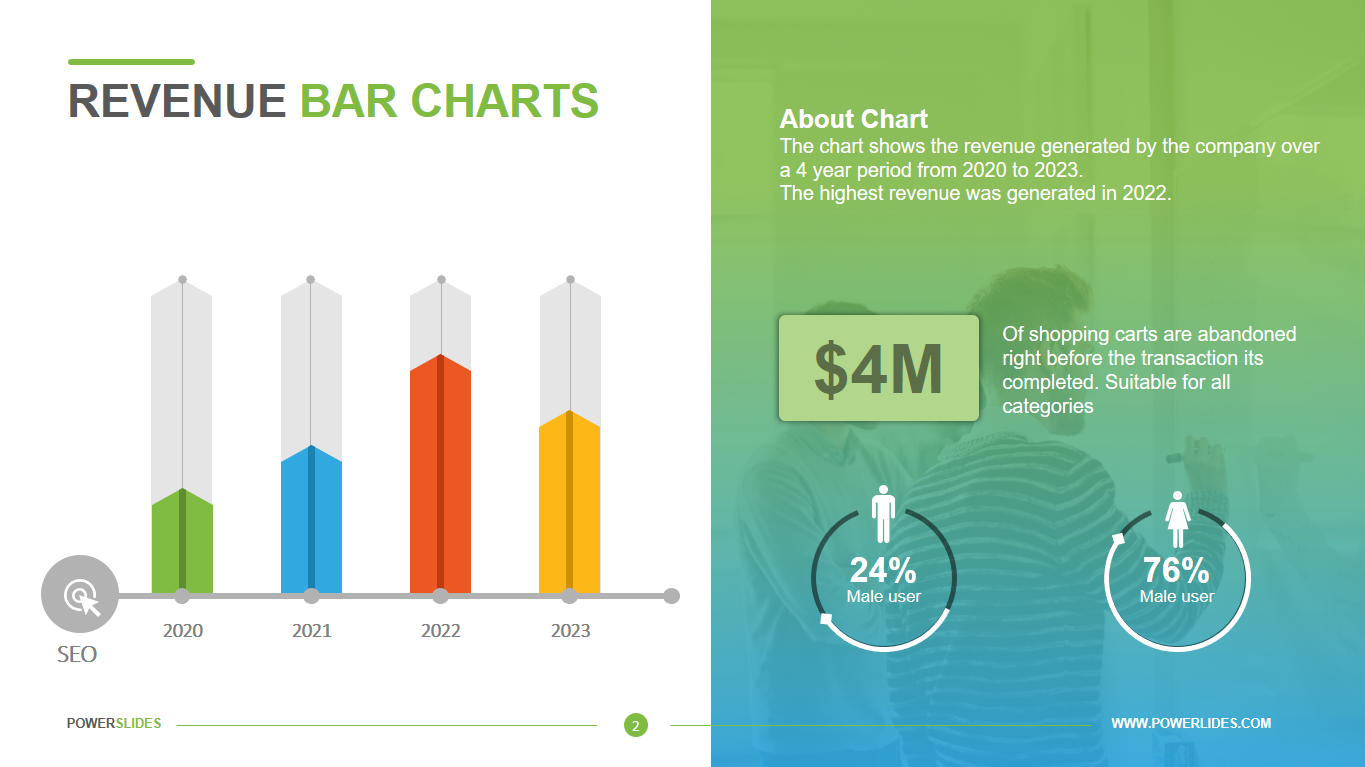
Revenue Bar Charts
What do you think of this template?
 (5.00/ 5)
10 ratings

 5 Slides
 File size: 16:9
 Fonts: Lato Black, Helvetica
 Supported version
PPT 2010, PPT 2013, PPT 2016
Supported version
PPT 2010, PPT 2013, PPT 2016

Product details
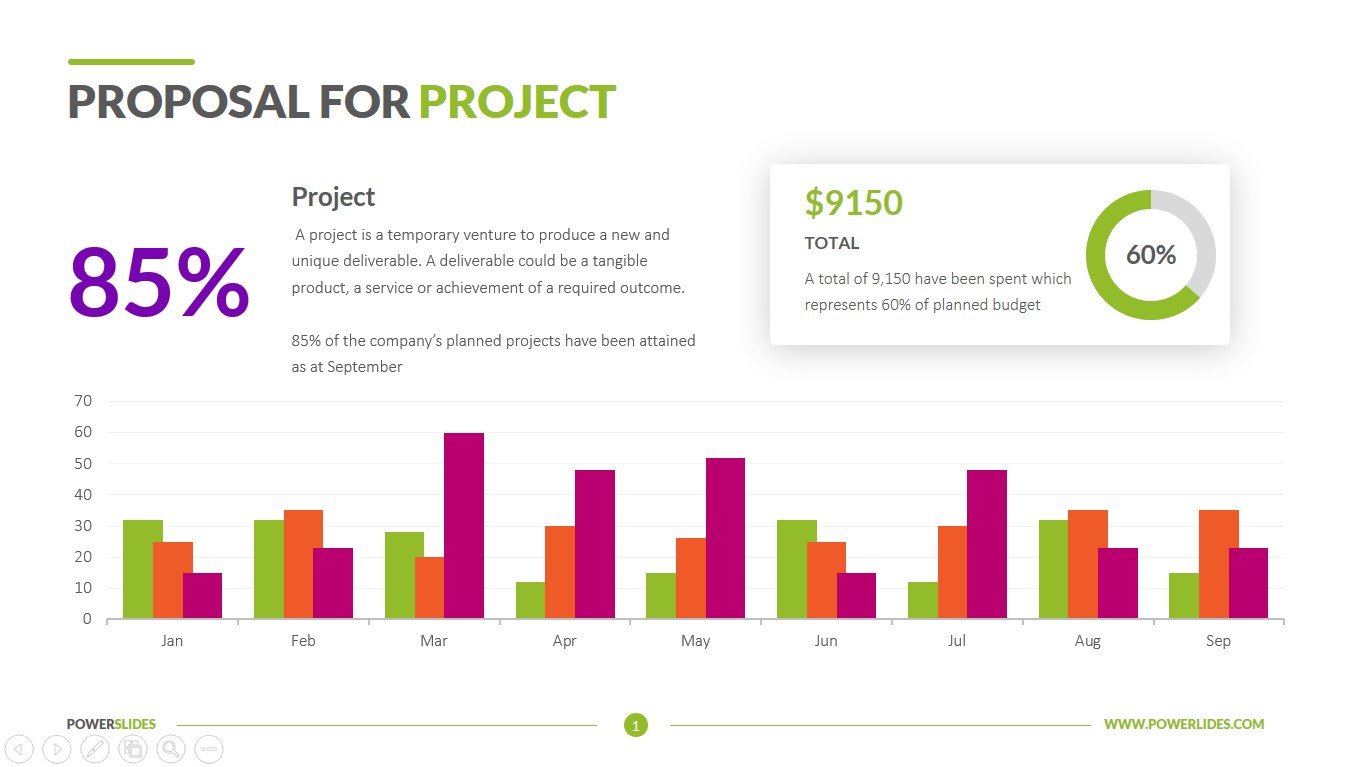
Revenue is the income generated from normal business operations and includes discounts and deductions for returned merchandise. It is the top line or gross income figure from which costs are subtracted to determine net income.
Revenue is one of the most important measures for your business. It proves efficiency, smart strategy, strong sales and it also develops trust from investors. So, it’s important to present this data accurately and appropriately in front of employees, shareholders, executives and investors.
There are different ways to calculate revenue, depending on the accounting method employed. Accrual accounting will include sales made on credit as revenue for goods or services delivered to the customer. It is necessary to check the cash flow statement to assess how efficiently a company collects money owed. Cash accounting, on the other hand, will only count sales as revenue when payment is received. Cash paid to a company is known as a receipt.
Revenue is known as the top line because it appears first on a company’s income statement. Net income, also known as the bottom line, is revenues minus expenses. There is a profit when revenues exceed expenses. To increase profit, and hence earnings per share for its shareholders, a company increases revenues and reduces expenses. Investors often consider a company’s revenue and net income separately to determine the health of a business.
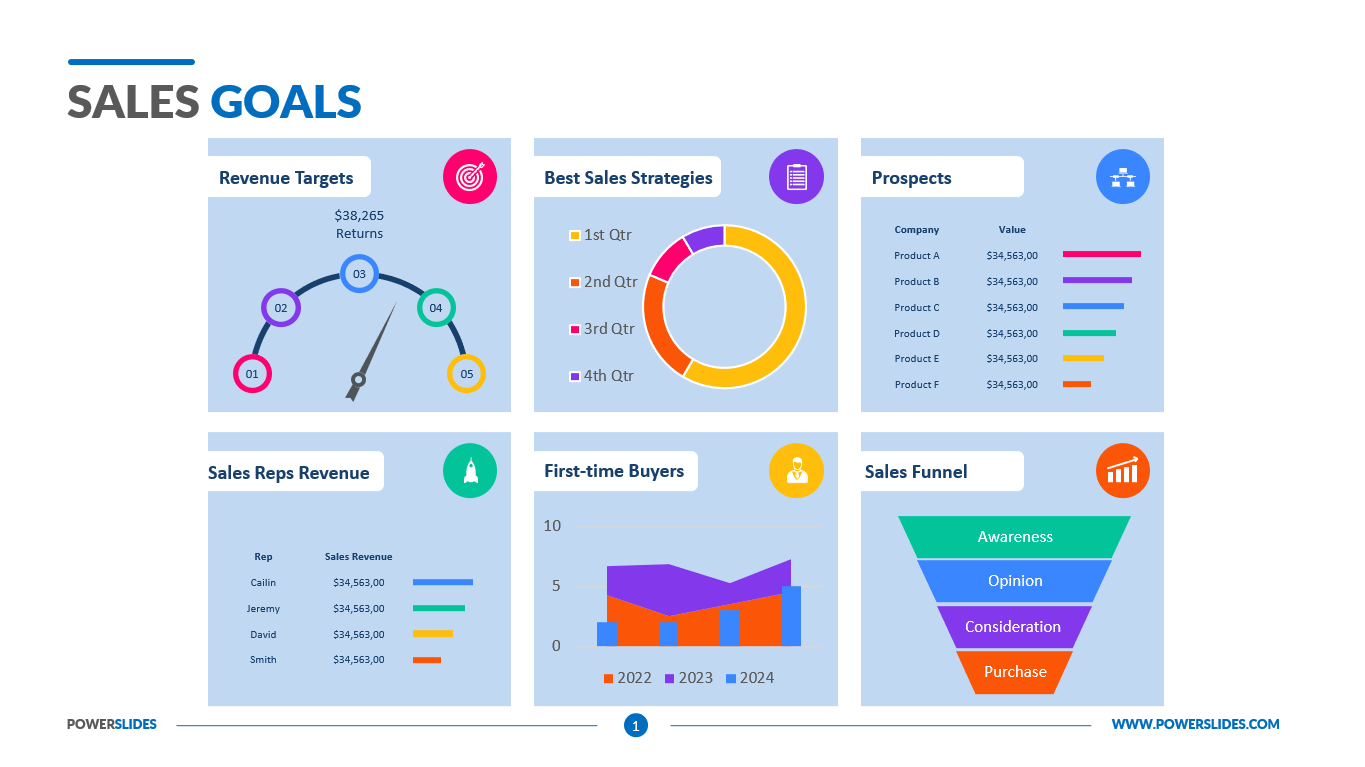
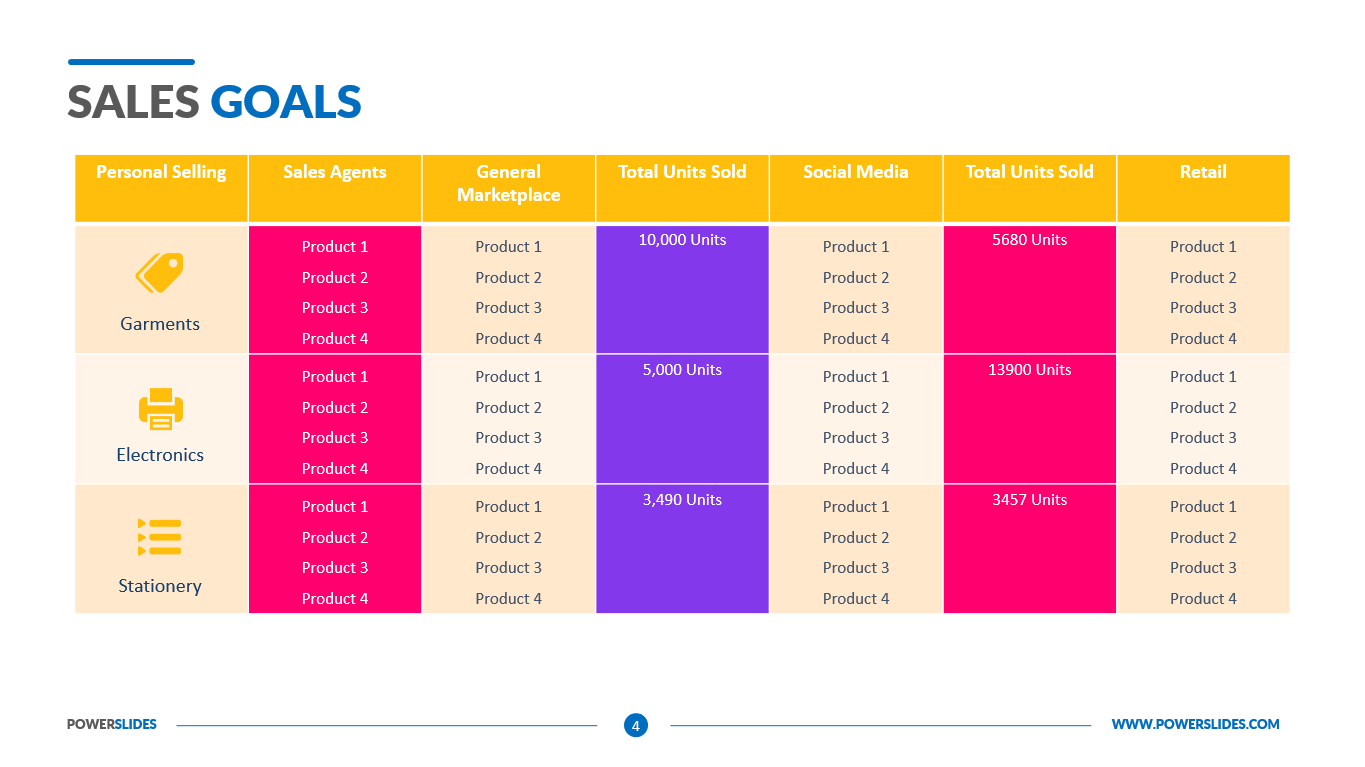
That is why it is very important to have the correct visual representation of your revenue on charts. To do this, you can use various types of charts and graphs, pie charts and bar charts. Also, it will not be superfluous to use different colors and compare for different reporting periods.
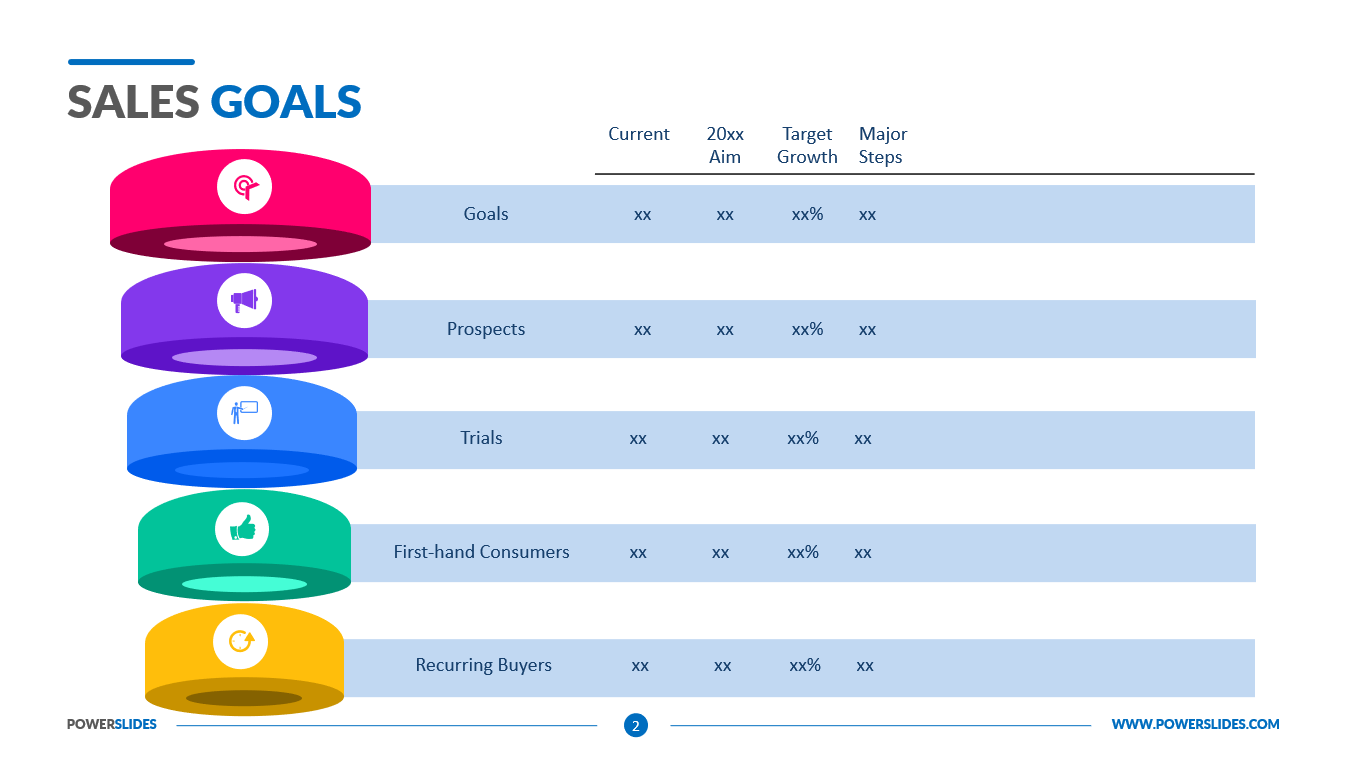
This template will be useful for financial analysts and economists. You can use this template when preparing monthly reports and financial results of the company. You can also use this template when planning your budget for next year. You will detail the revenue data for the previous period and compare with the planned revenue amount for the next year.
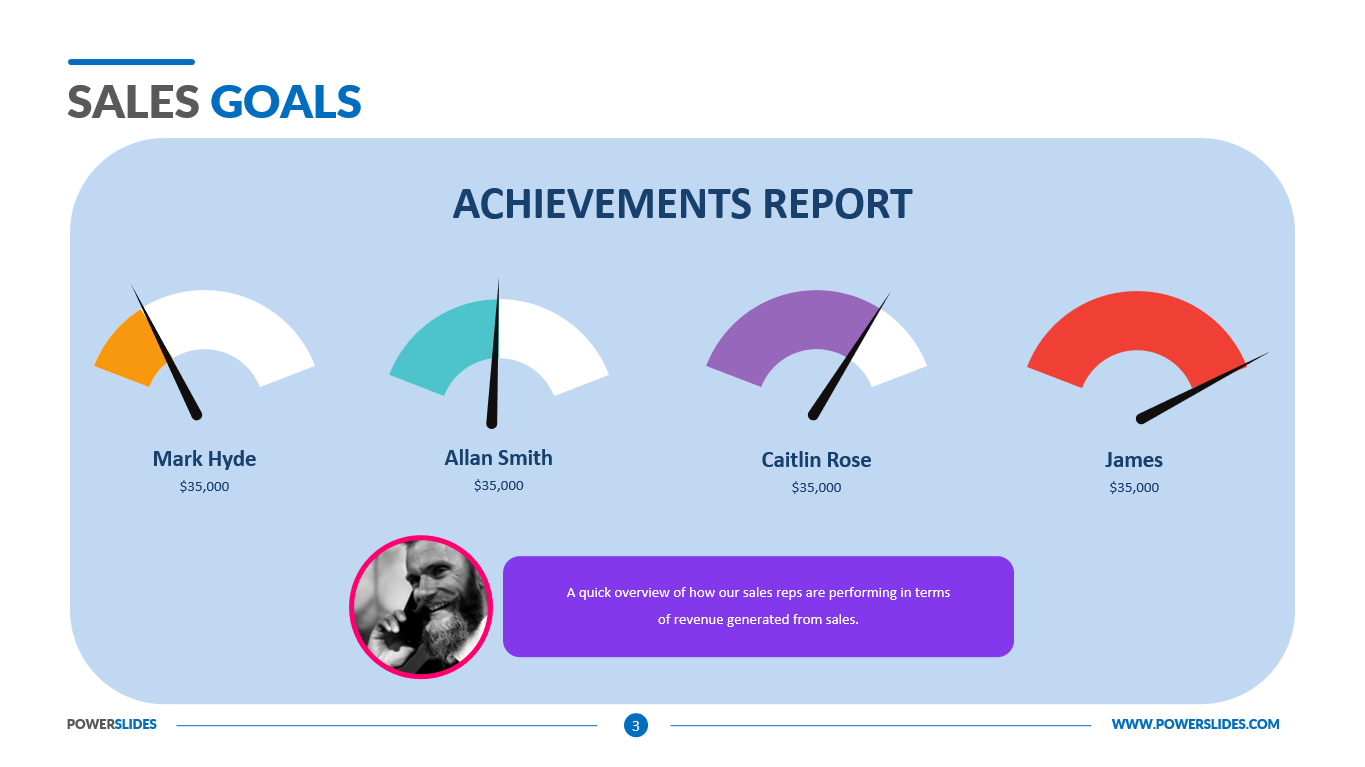
Also, this template will be useful for investment companies. You can use this template when preparing financial analysis of the activities of various enterprises. The visual presentation will enable your audience to better understand the complex data of the analysis. Also, this template will be useful for startup executives when preparing financial statements for potential investors.
University professors can use this template to prepare their courses on financial analysis or financial planning. Marketers and advertising professionals can use this template when preparing an advertising budget for a marketing campaign.
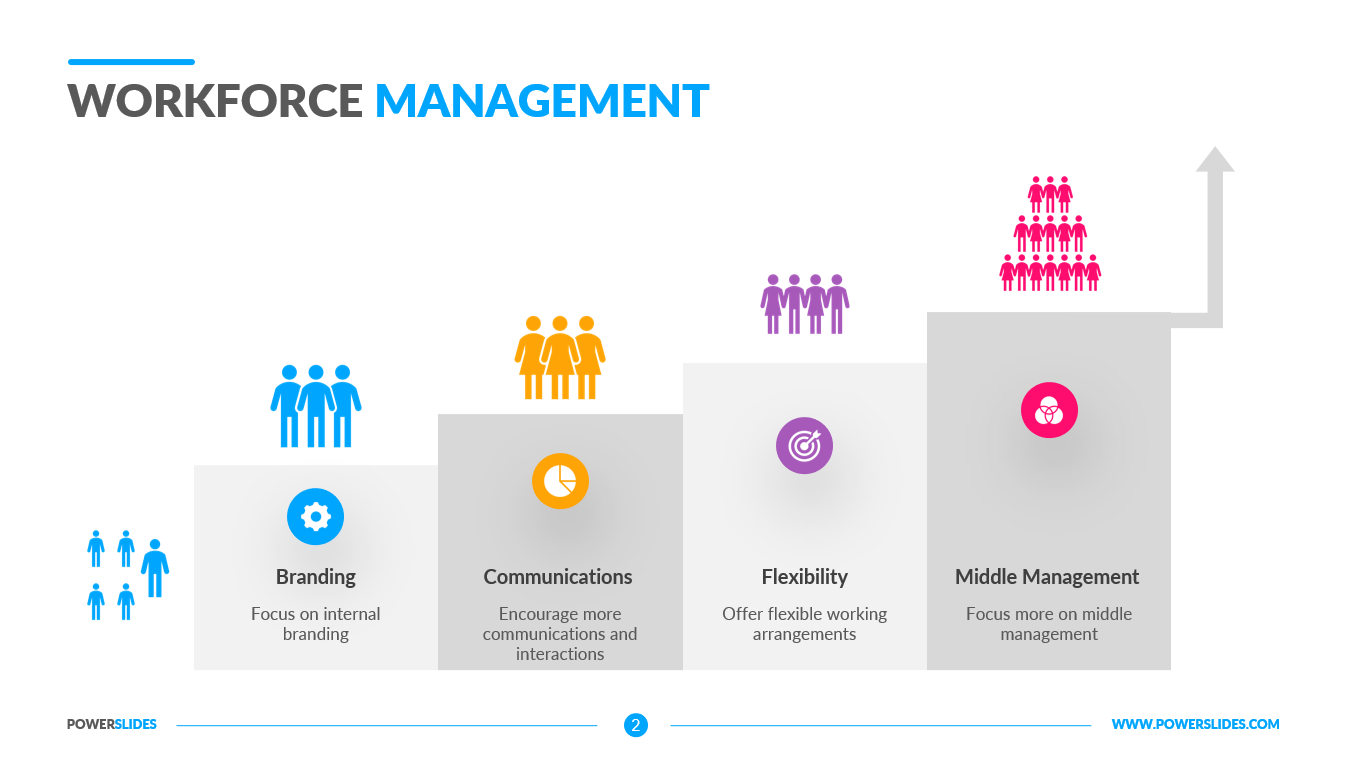
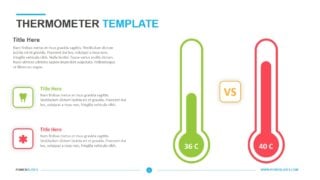
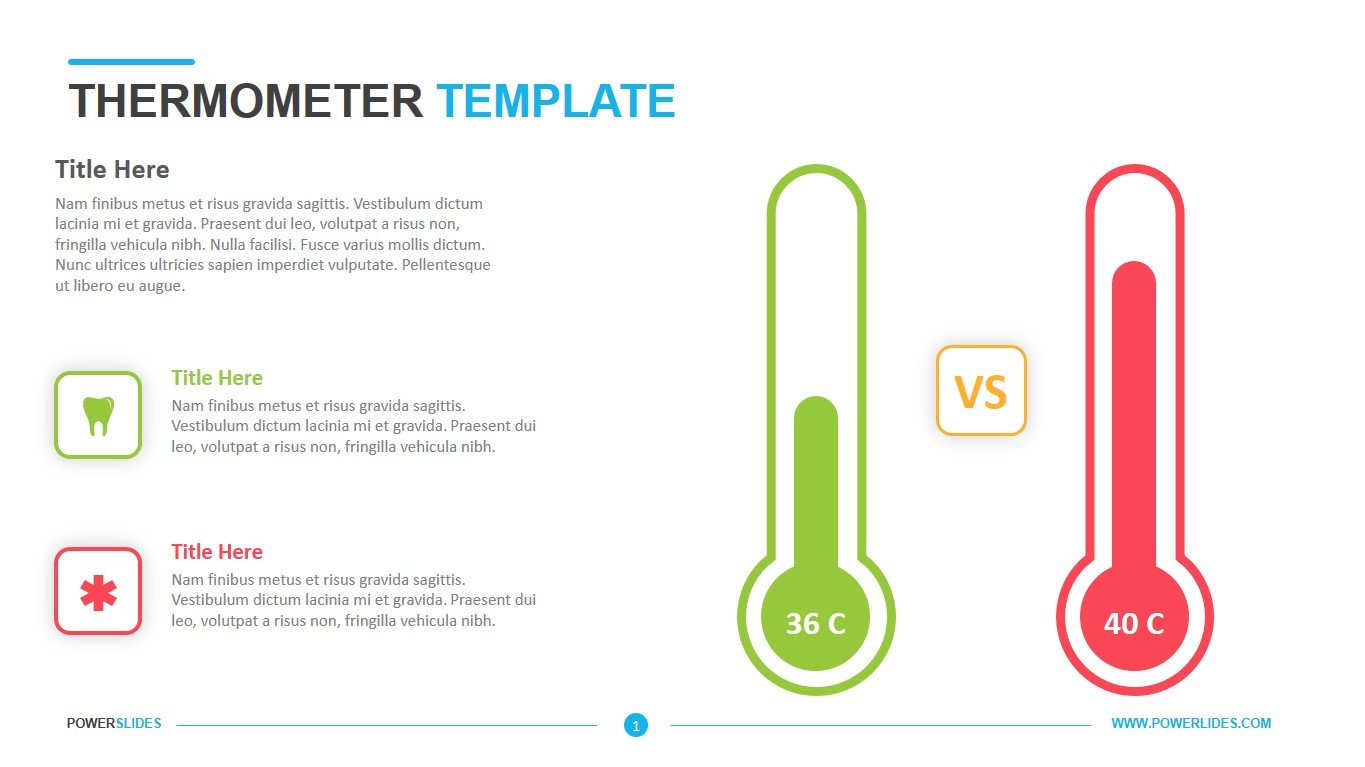
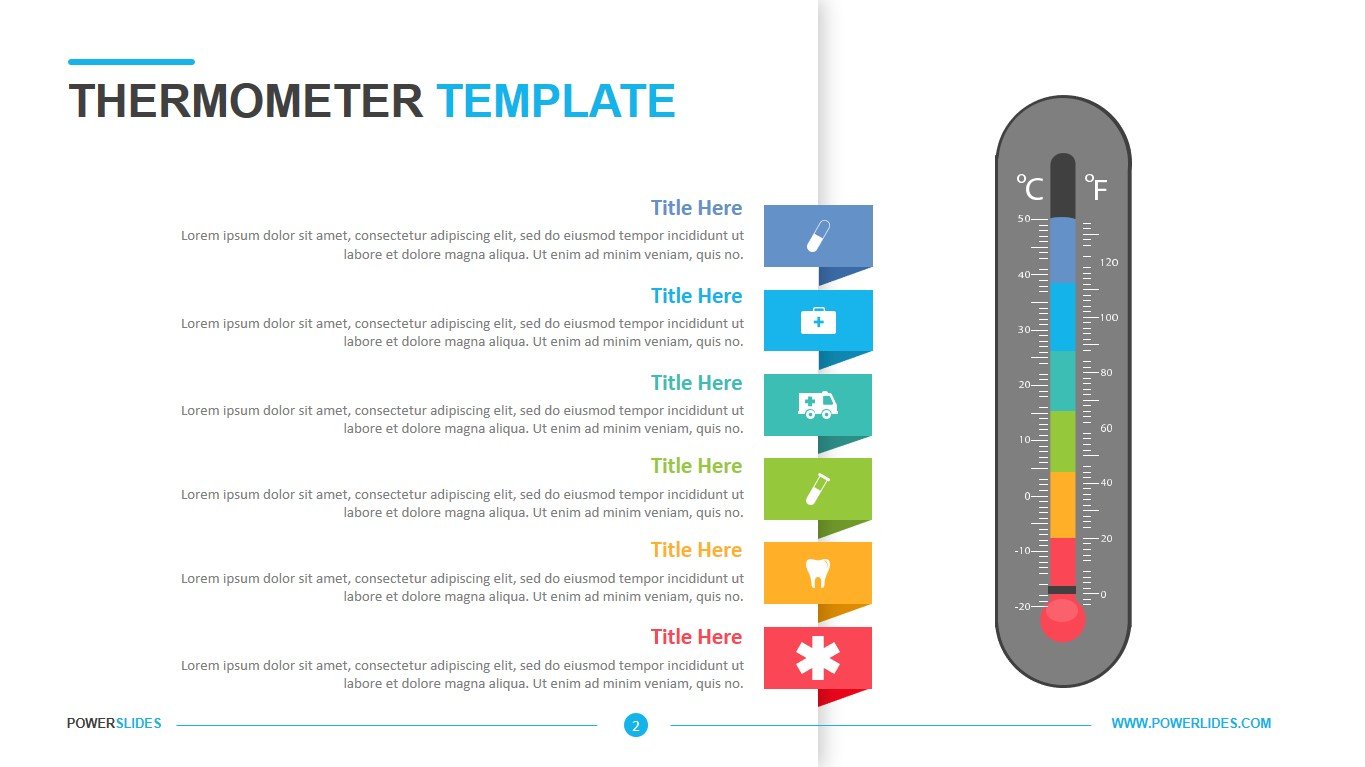
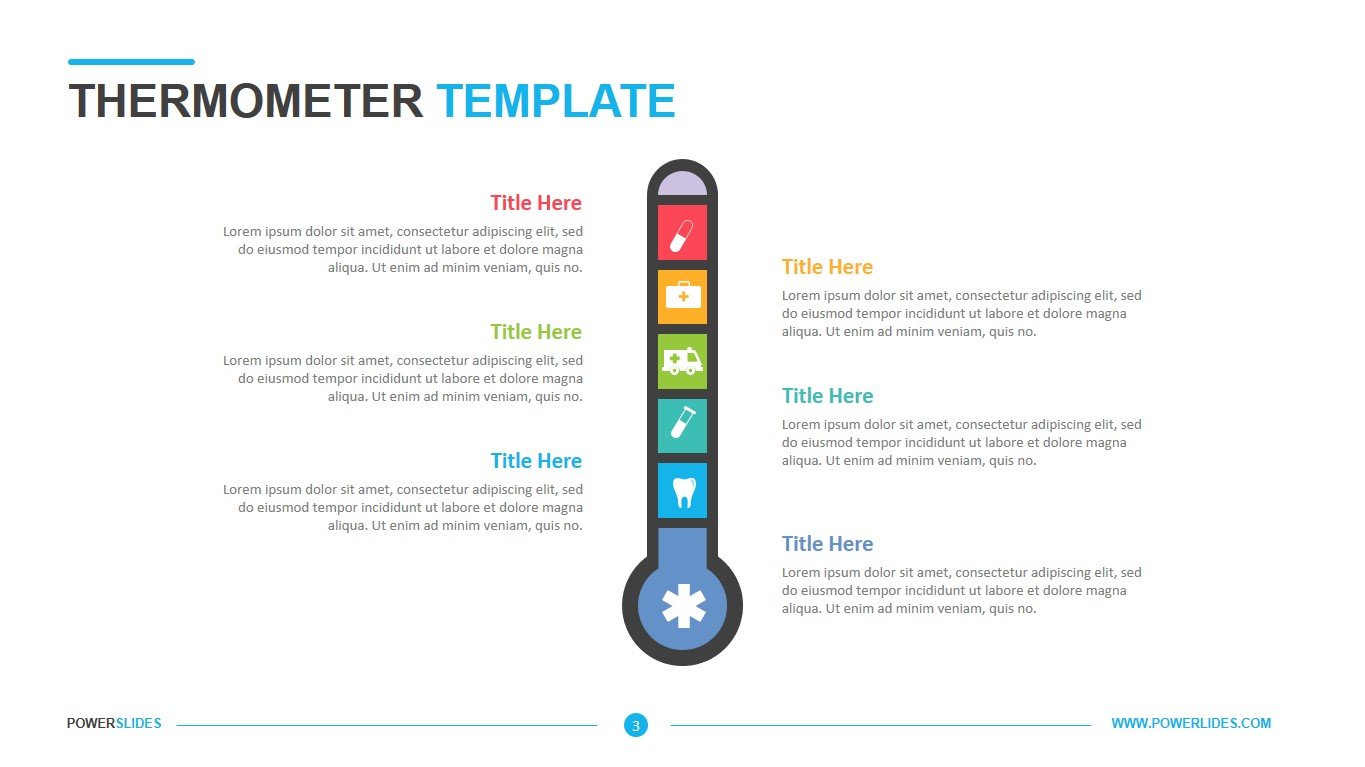
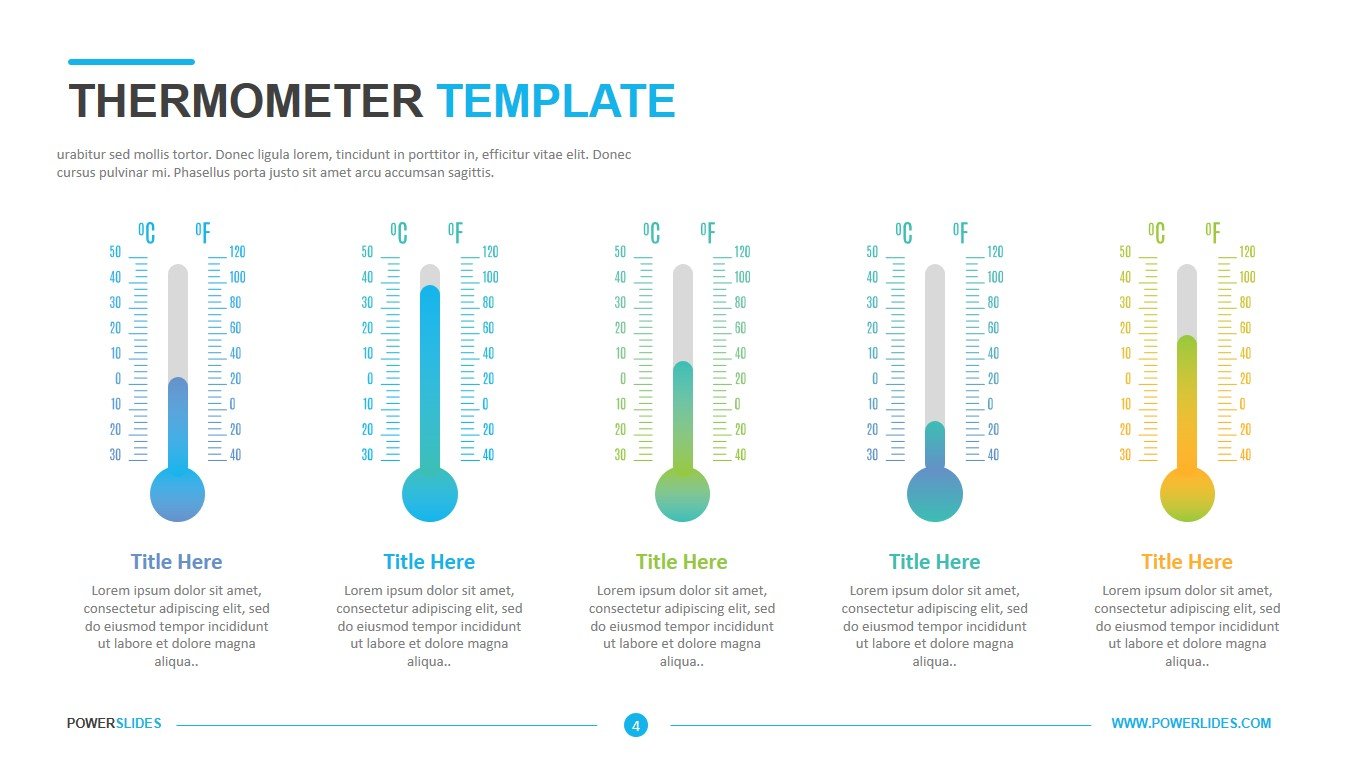
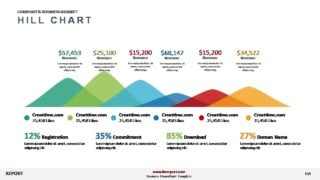
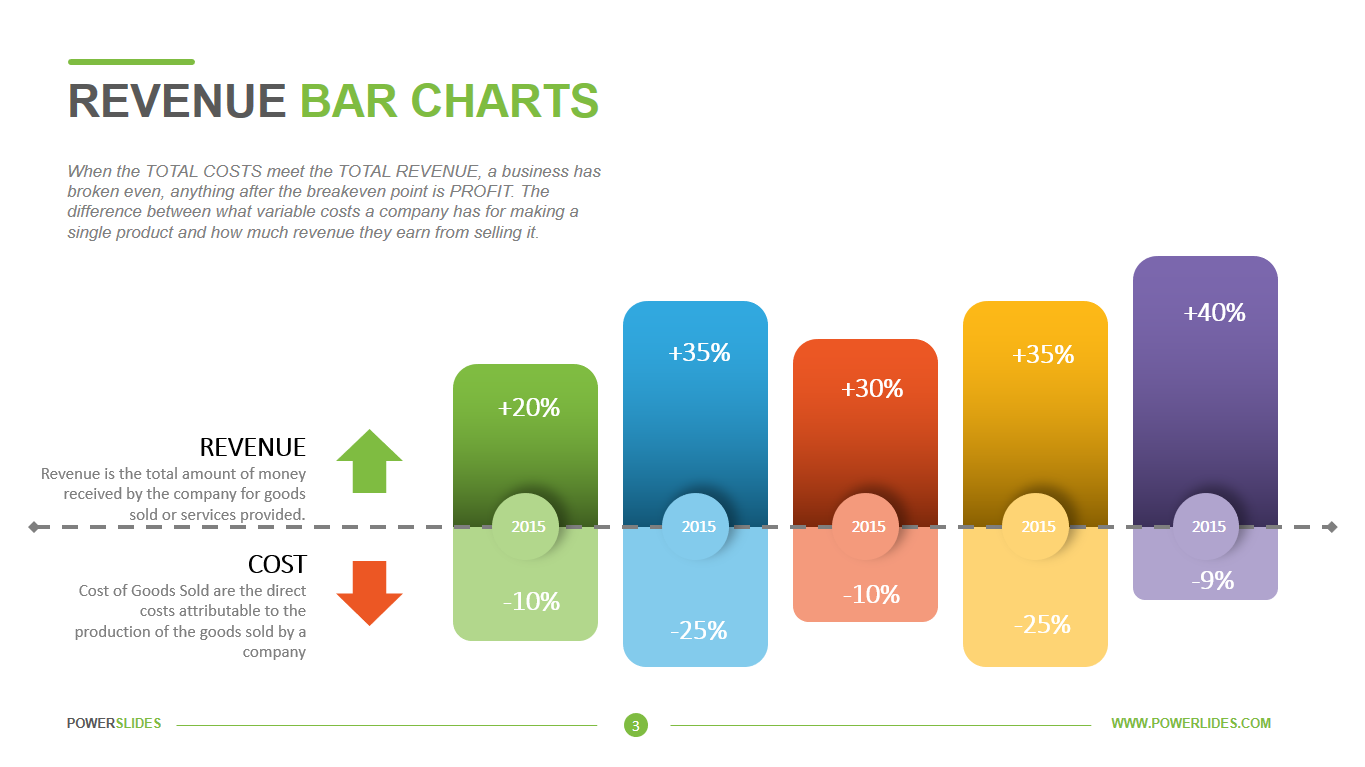
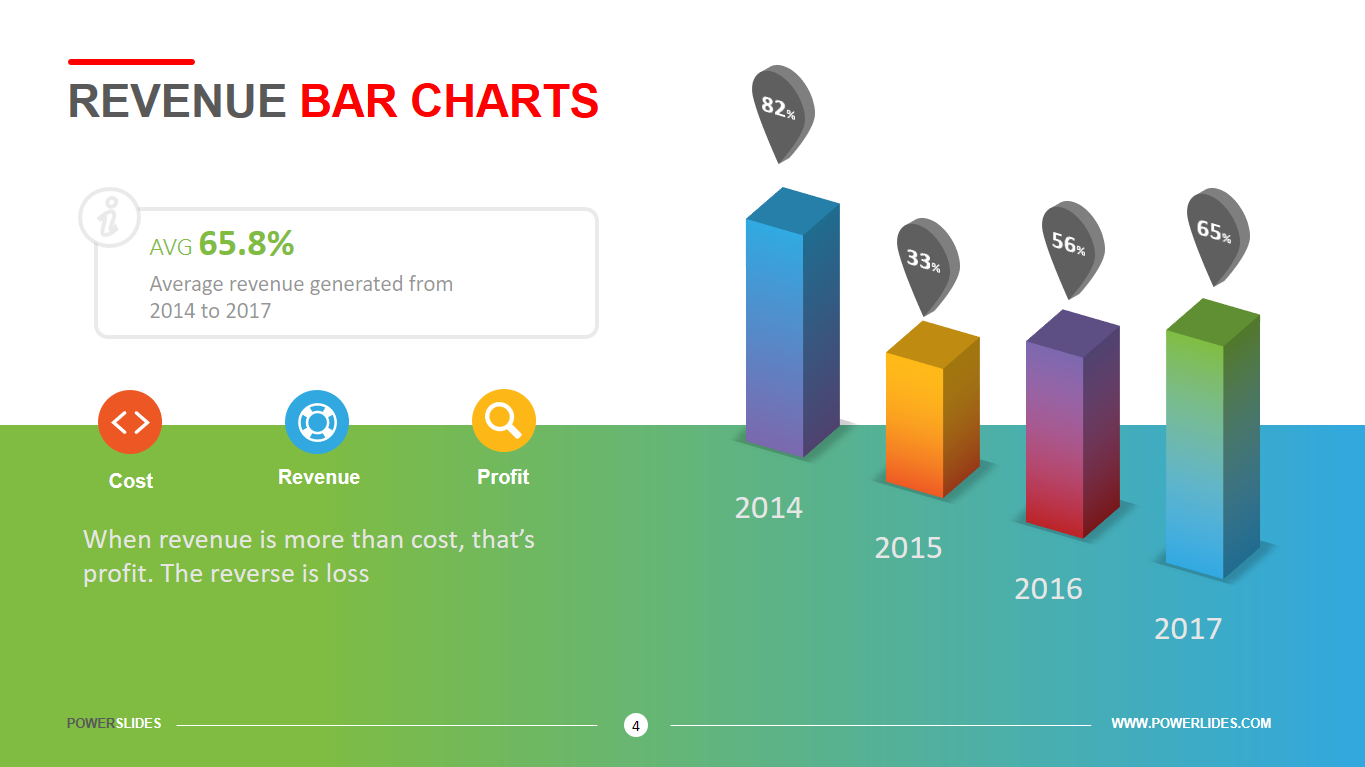
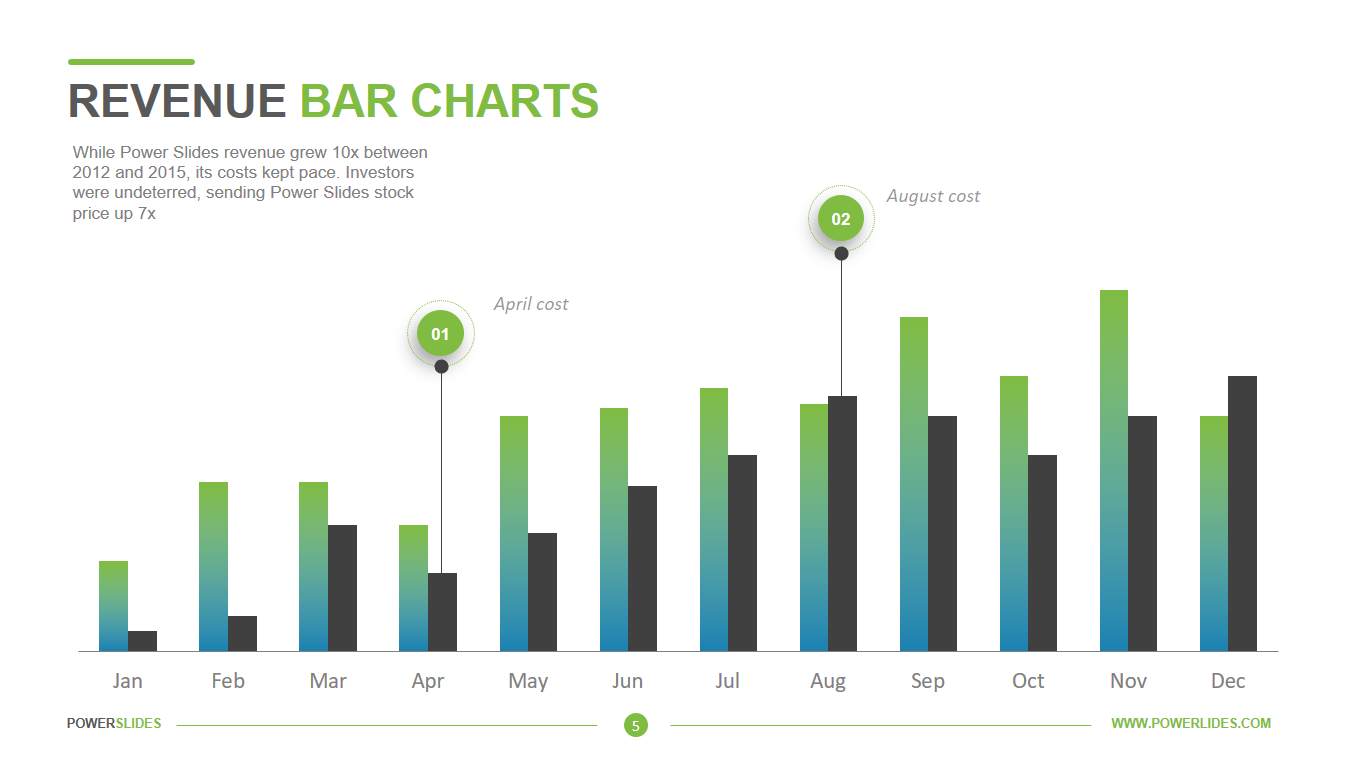
This elegant and unique bar chart template is perfect for displaying financials. Created for organization and efficiency, this PowerPoint template saves you time, while delivering a visually-appealing and informative presentation for your audience. You can show your achievements and targets through a variety of five design options, which include vertical graph bars, thermostat-inspired graphs and arrow-shaped graphs. You can express key data points, costs, dollar amounts and more through the x and y axes. A popular template, this set of revenue bar charts are often used for quarterly earnings, shareholder meetings, annual reports and board reports. Revenue Bar Charts template will be a worthy addition to your collection of professional presentations.


