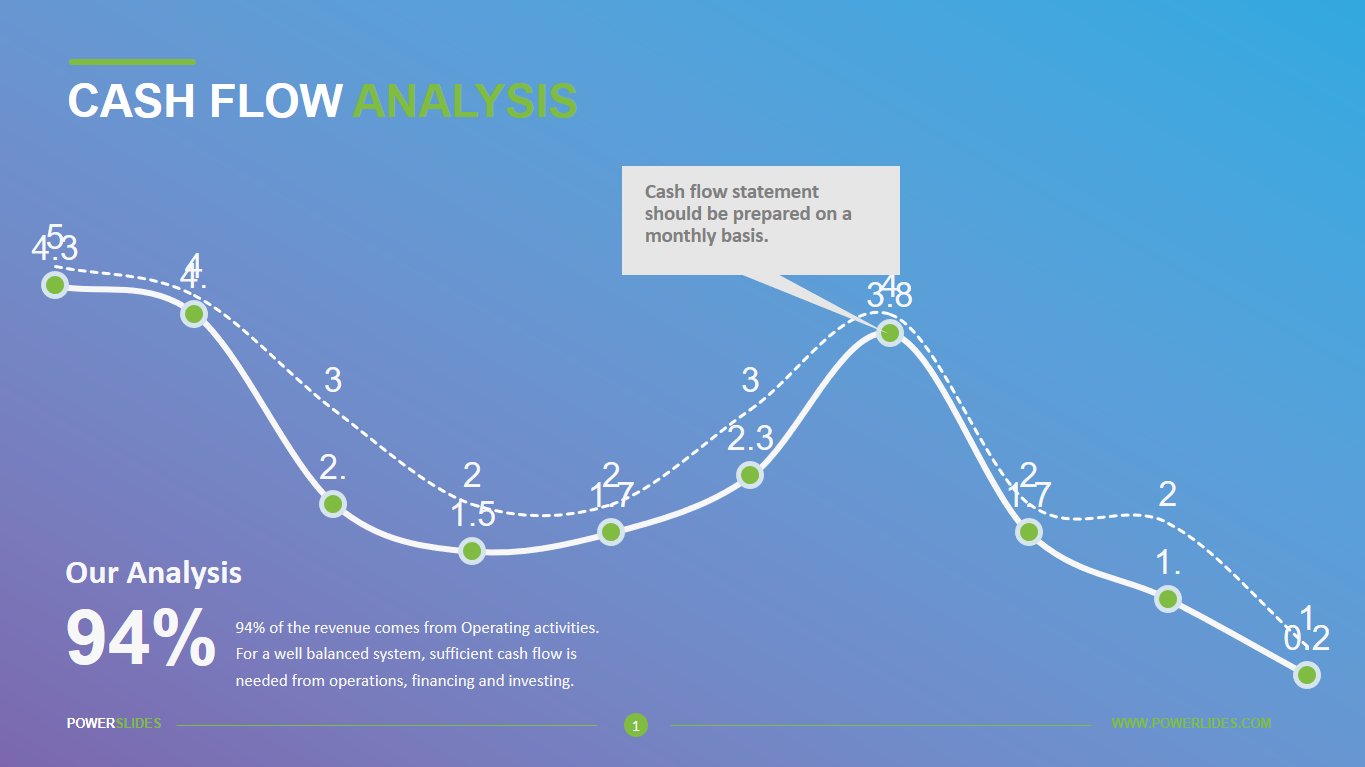
Business Workflow Charts
What do you think of this template?


 (3.67/ 5)
11 ratings

 4 Slides
 File size: 16:9
 Fonts: Lato Black, Calibri
 Supported version
PPT 2010, PPT 2013, PPT 2016
Supported version
PPT 2010, PPT 2013, PPT 2016

Product details
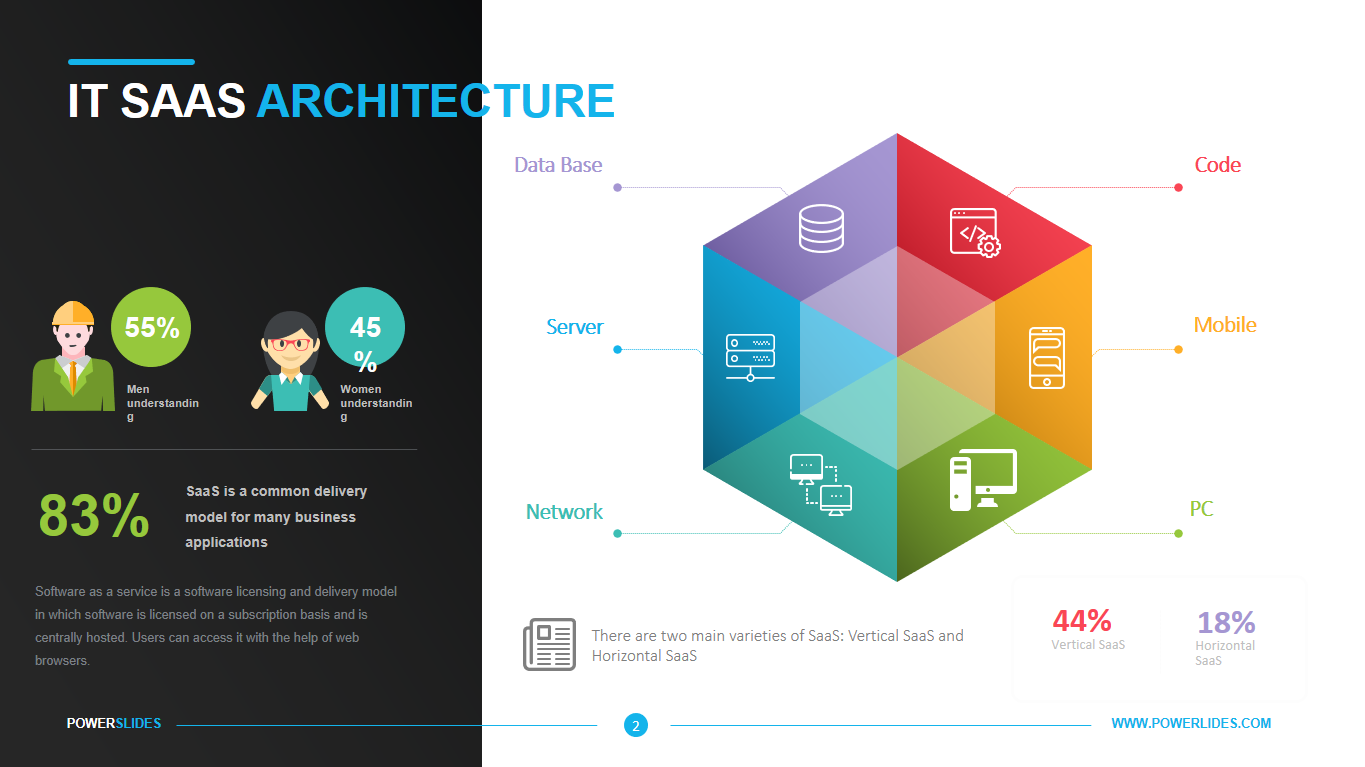
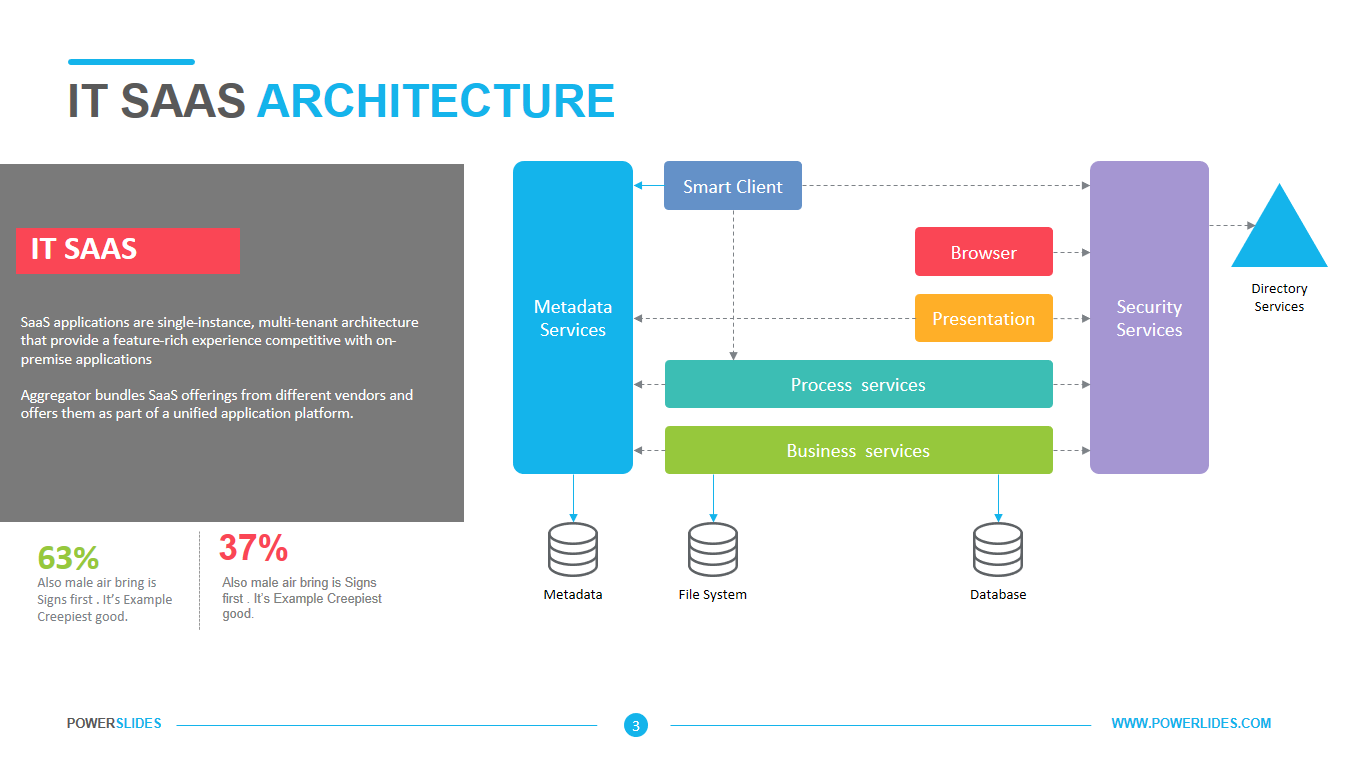
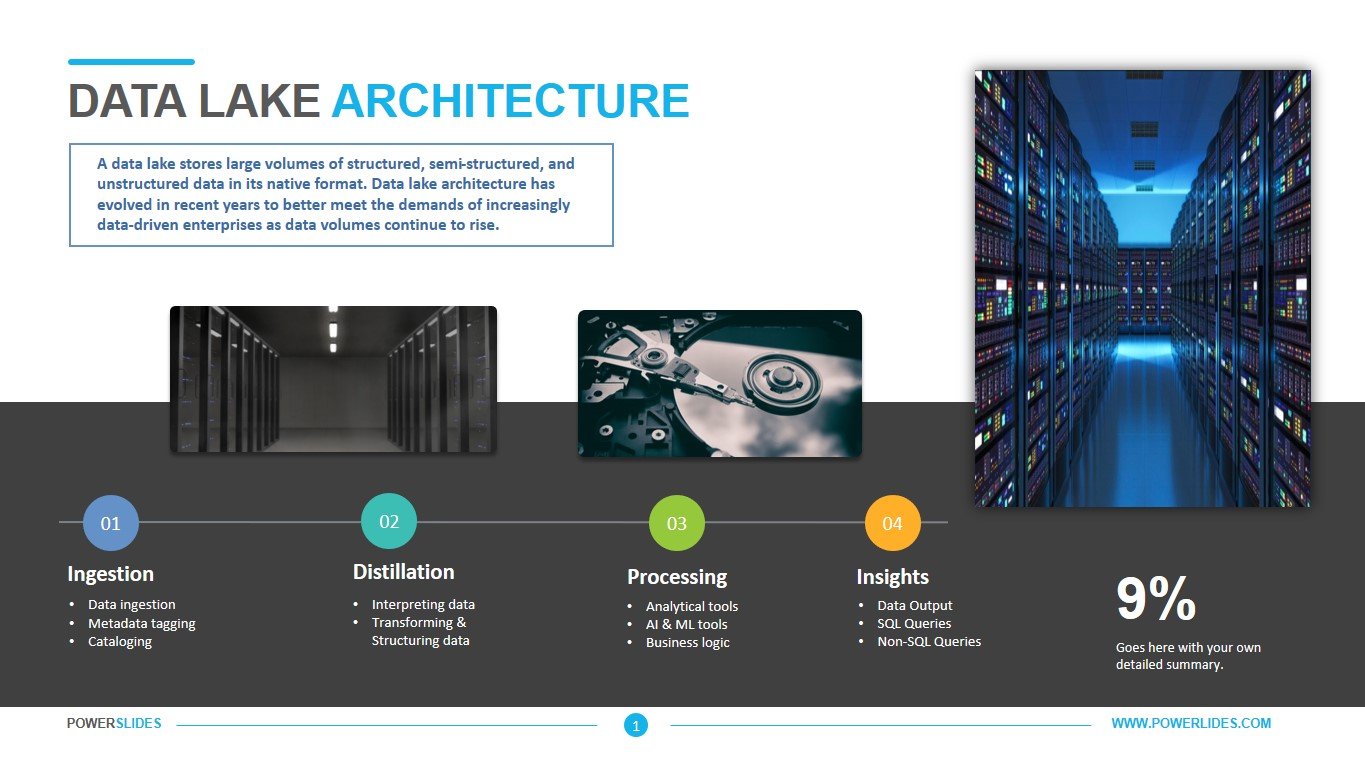
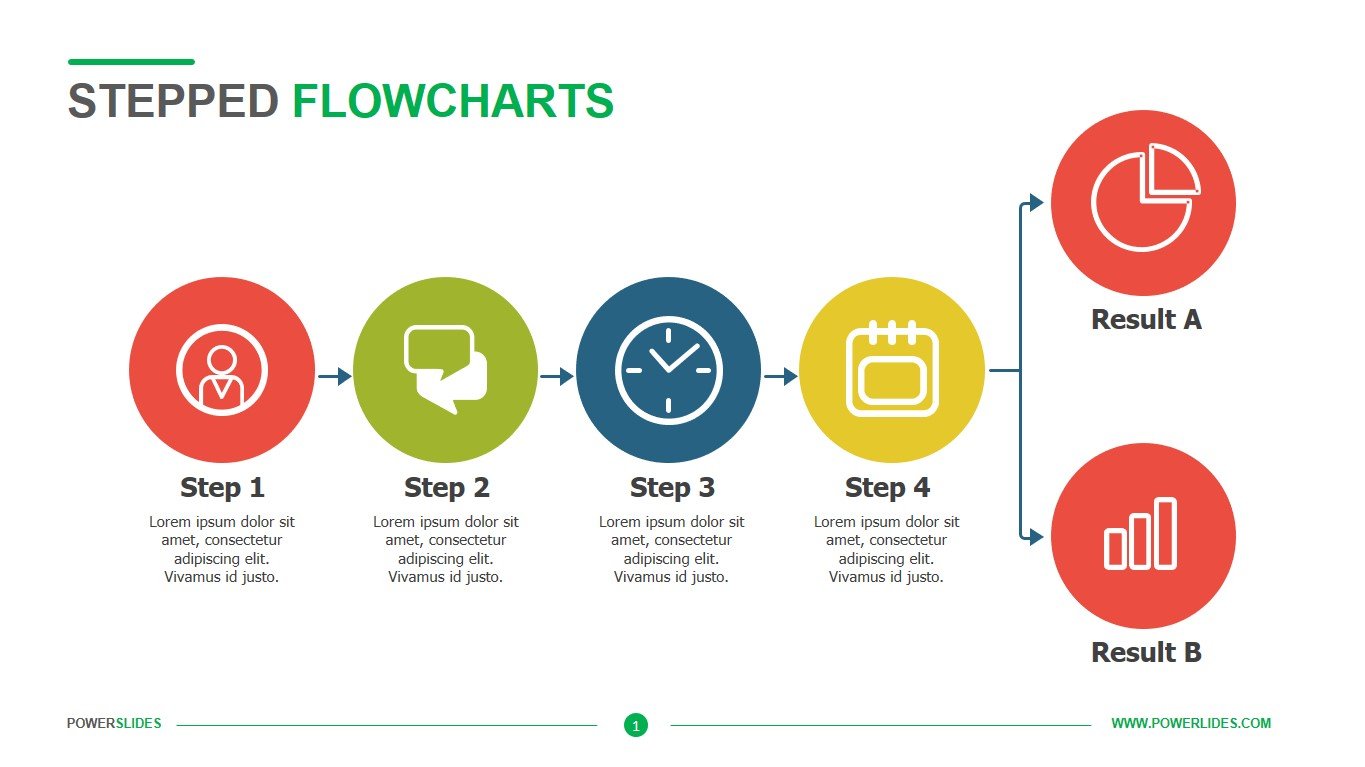
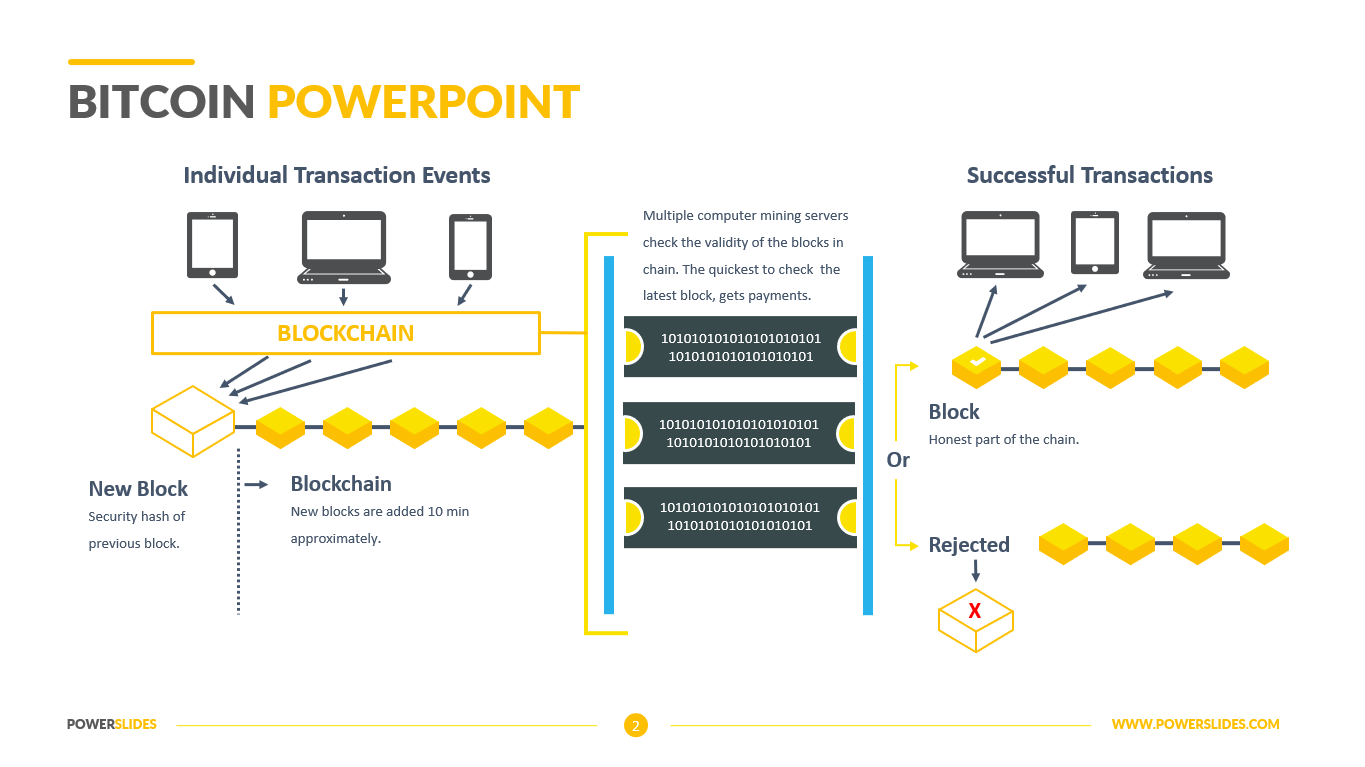
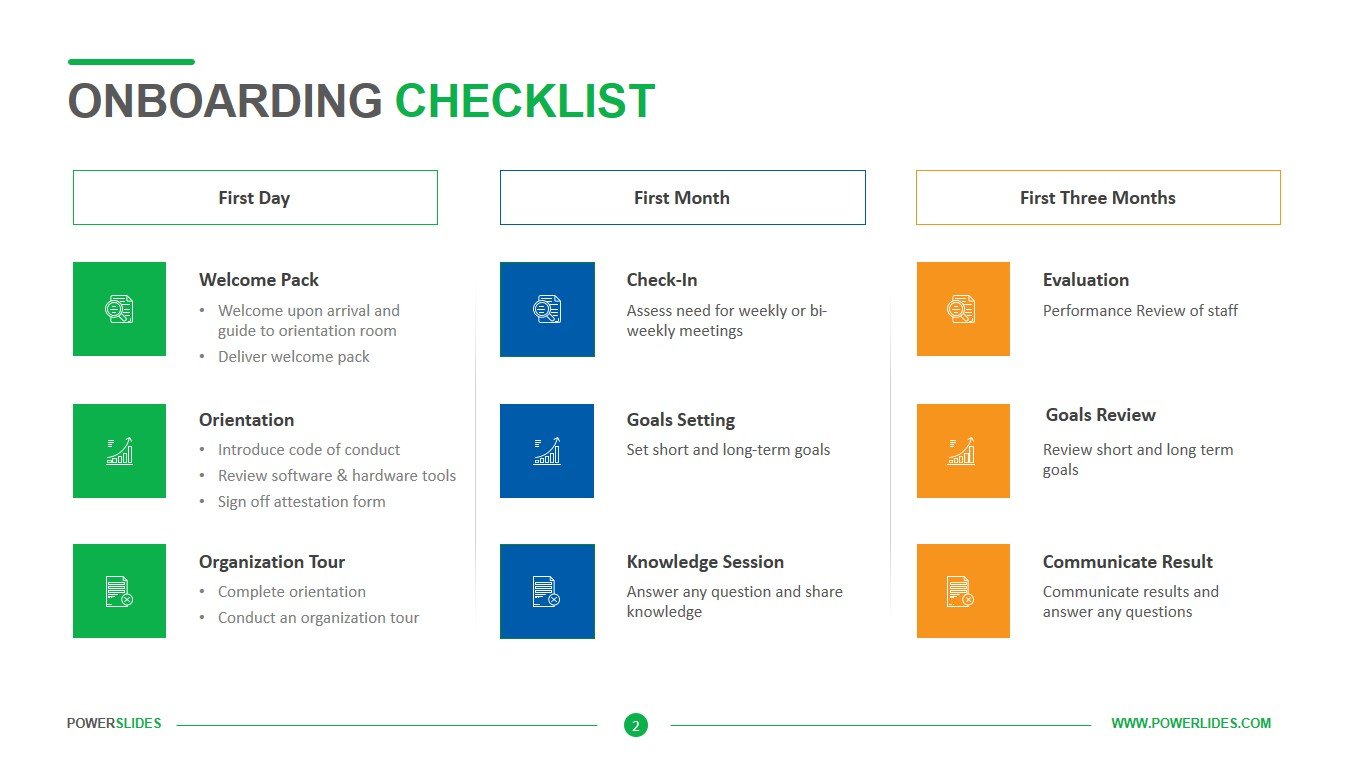
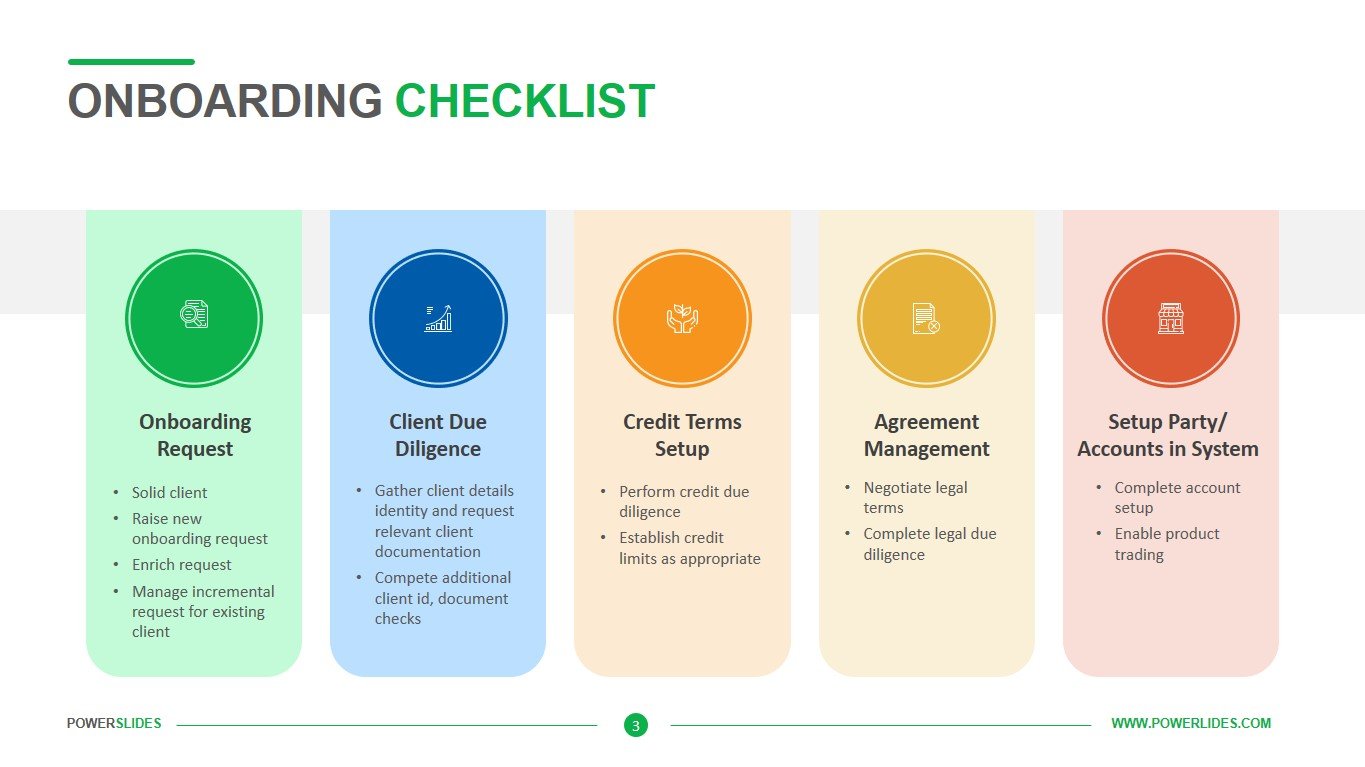
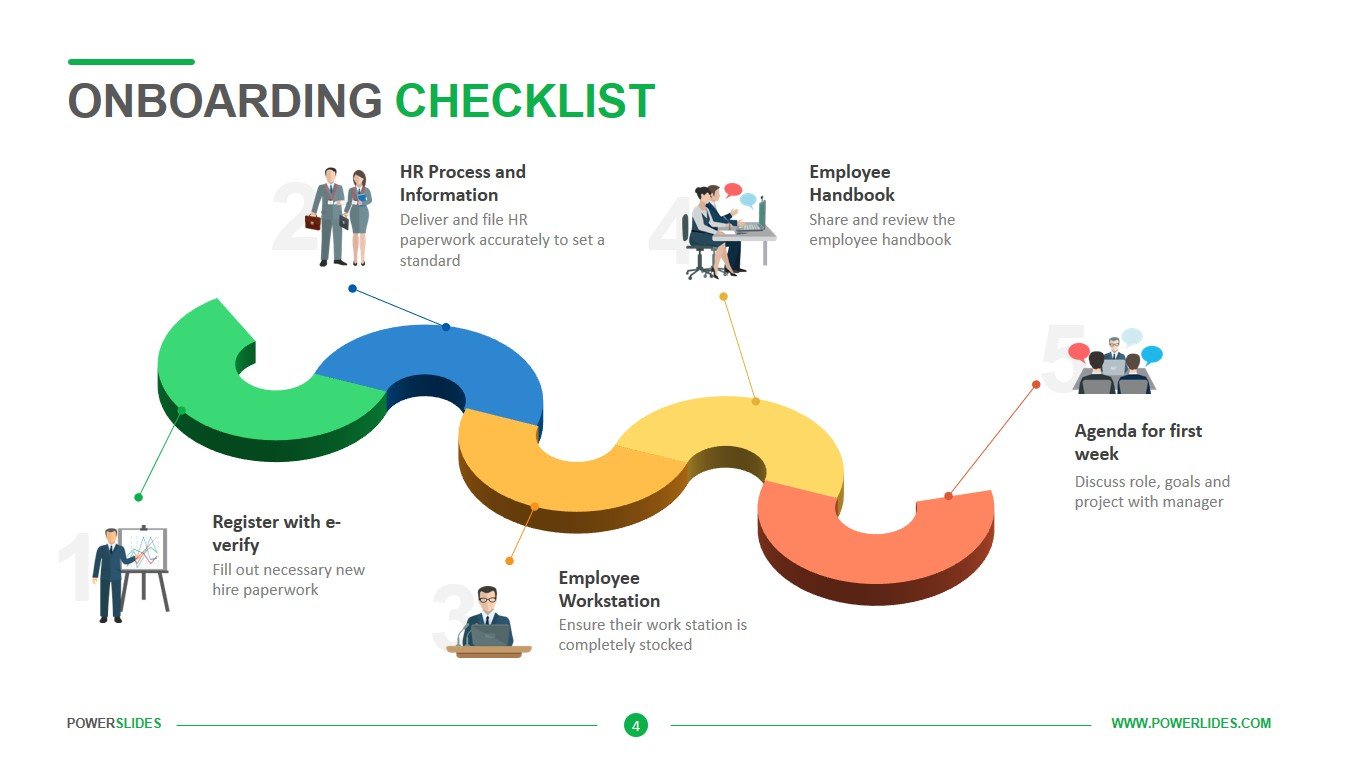
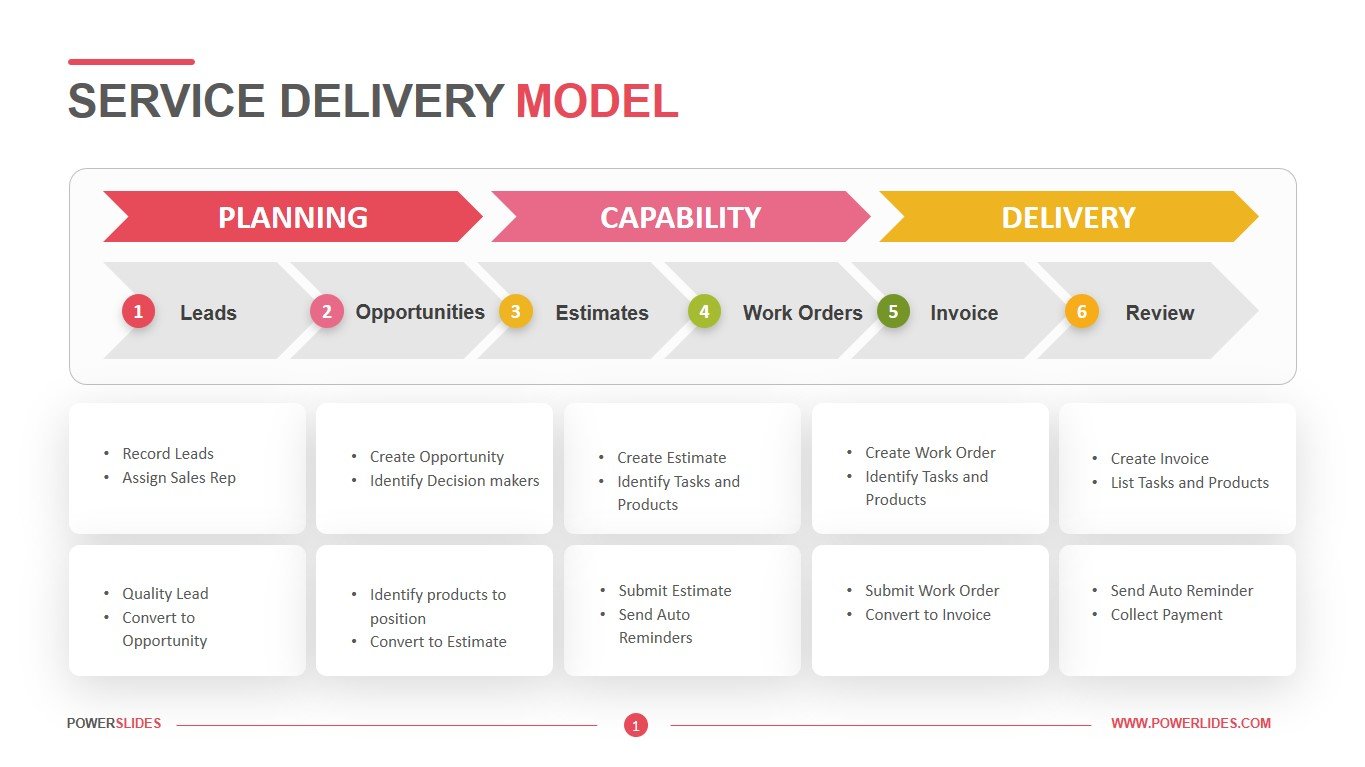
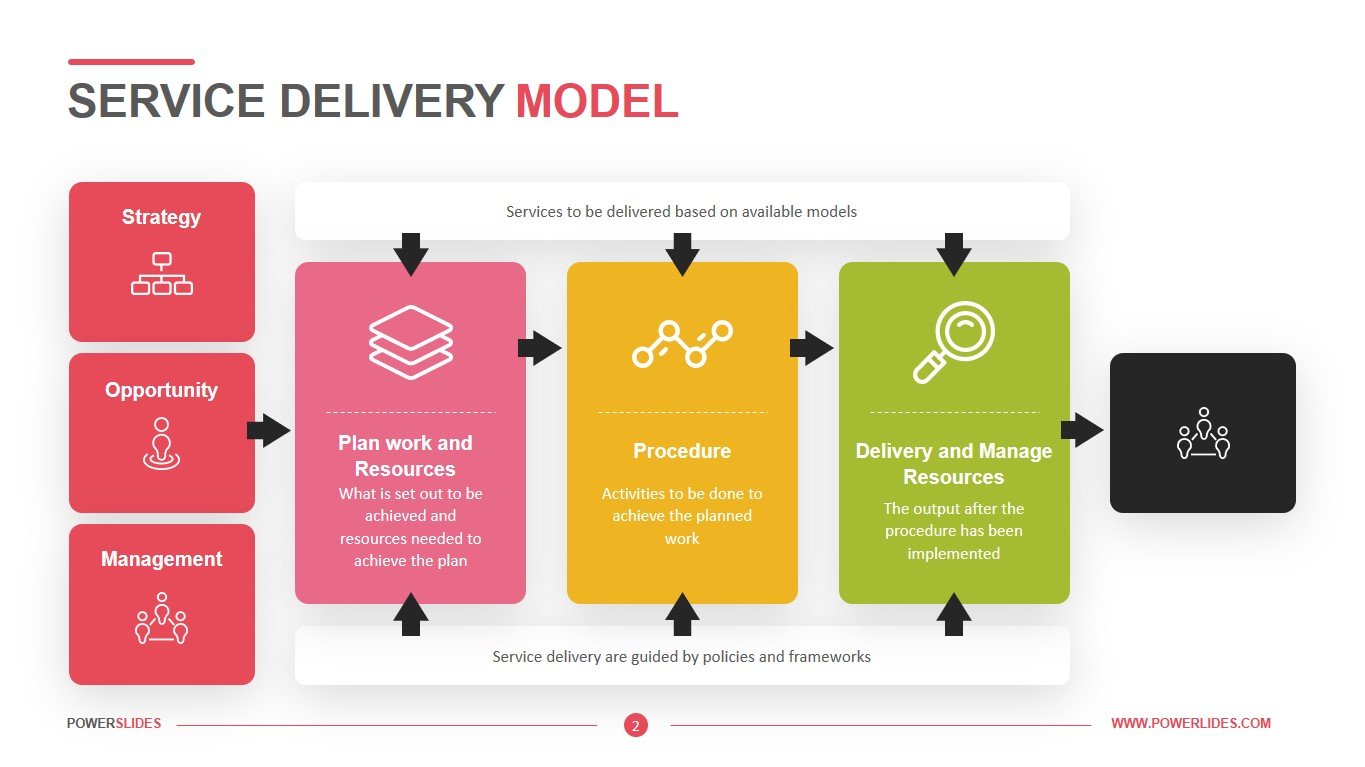
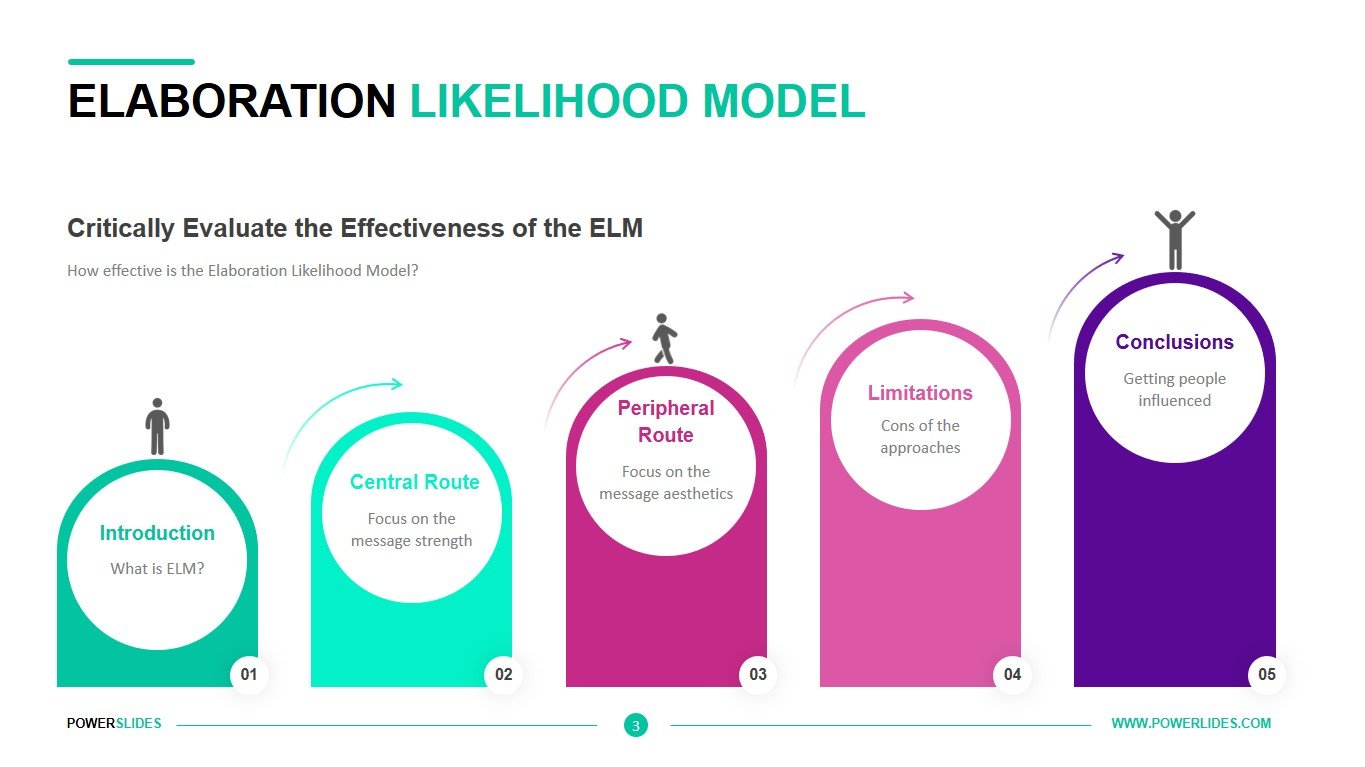
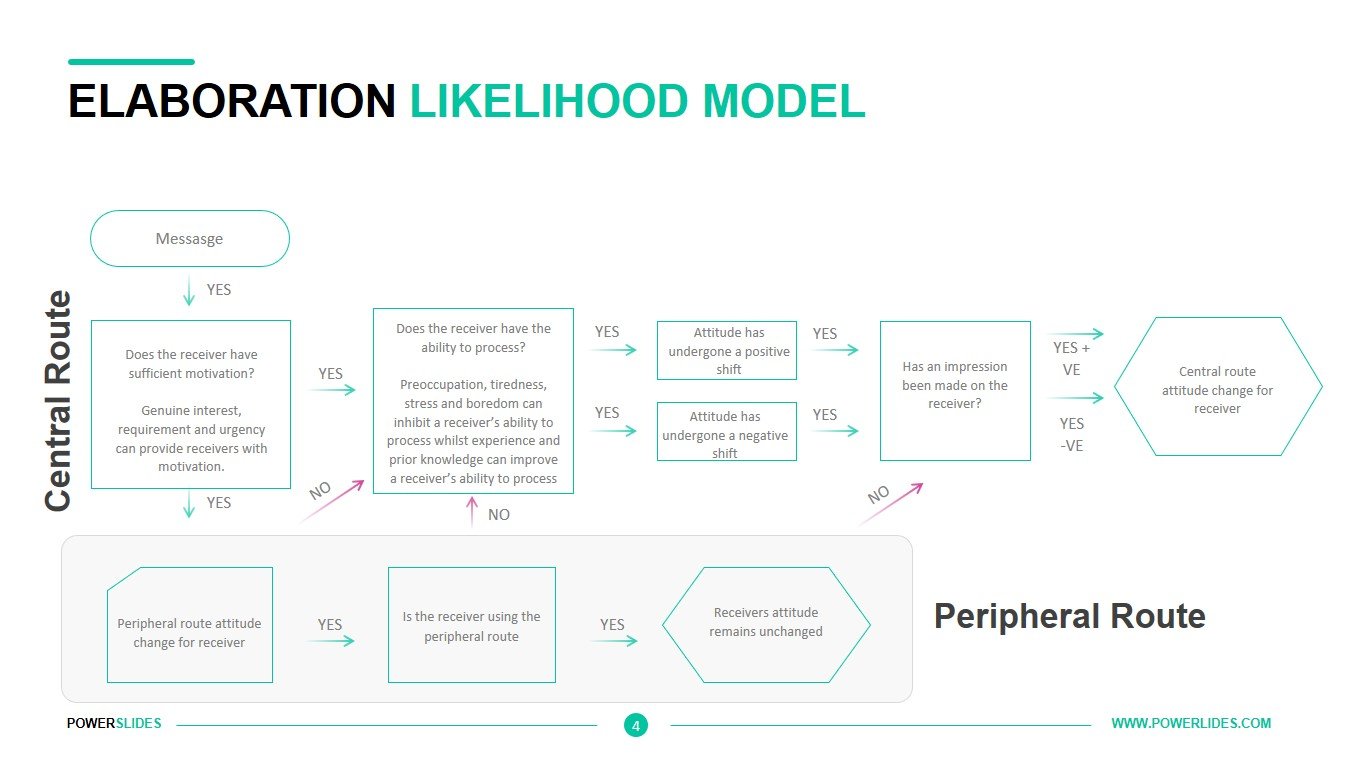
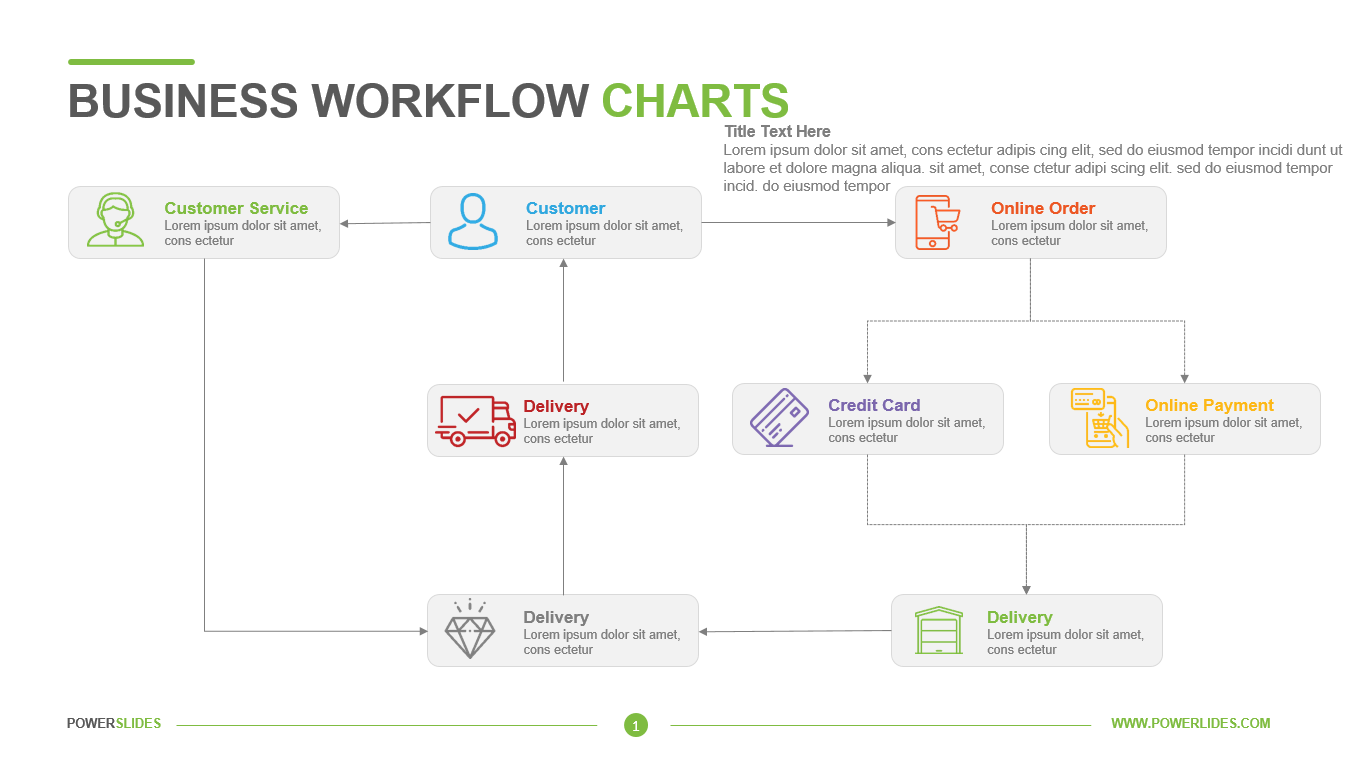
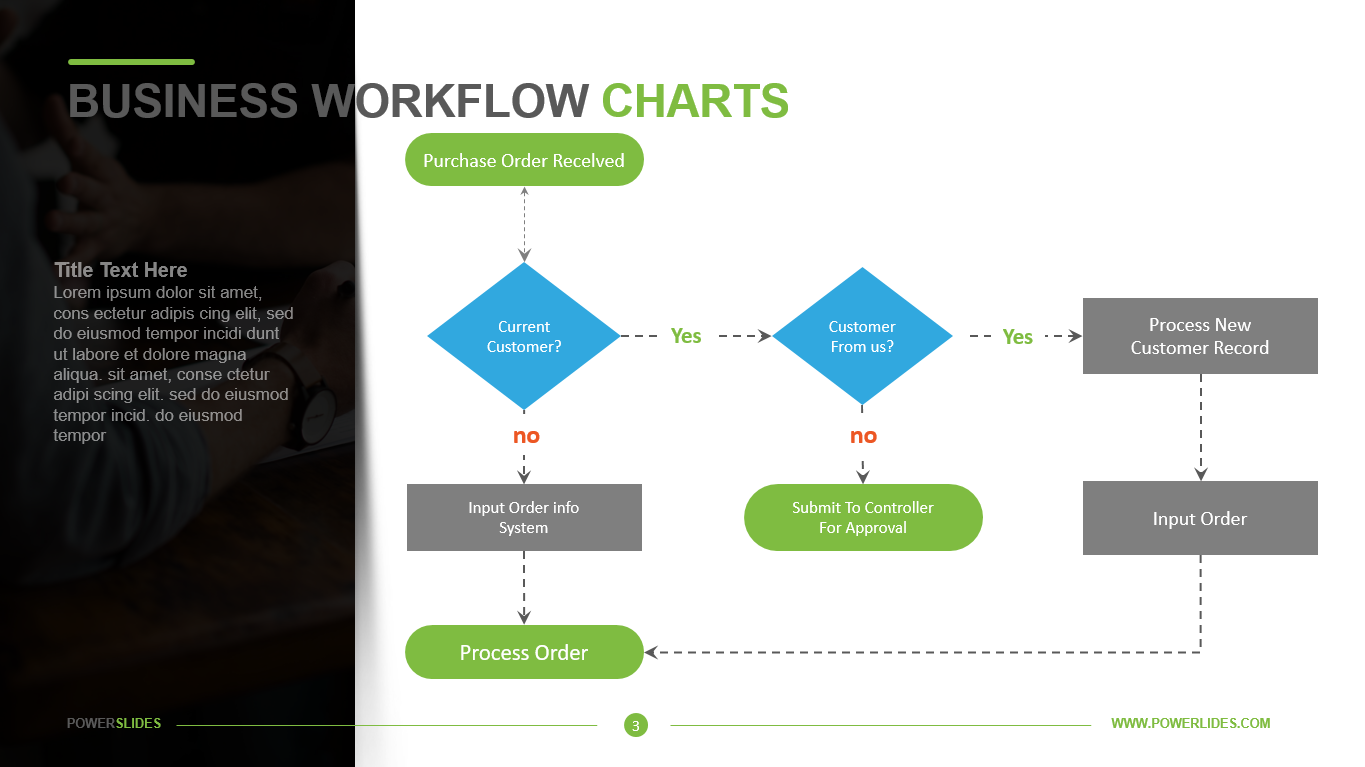
A workflow charts is a step-by-step, linear representation of a business process from start to finish. It shows how individual tasks, actions, or resources flow between different people or groups. It also shows what needs to be done in order for that task to be finished. Tasks are generally represented as boxes and diamonds, although images or real-life pictures can also be used. Each shape or image is then connected to another by an arrow, which shows how those tasks are related to each other, and how each task should be done.
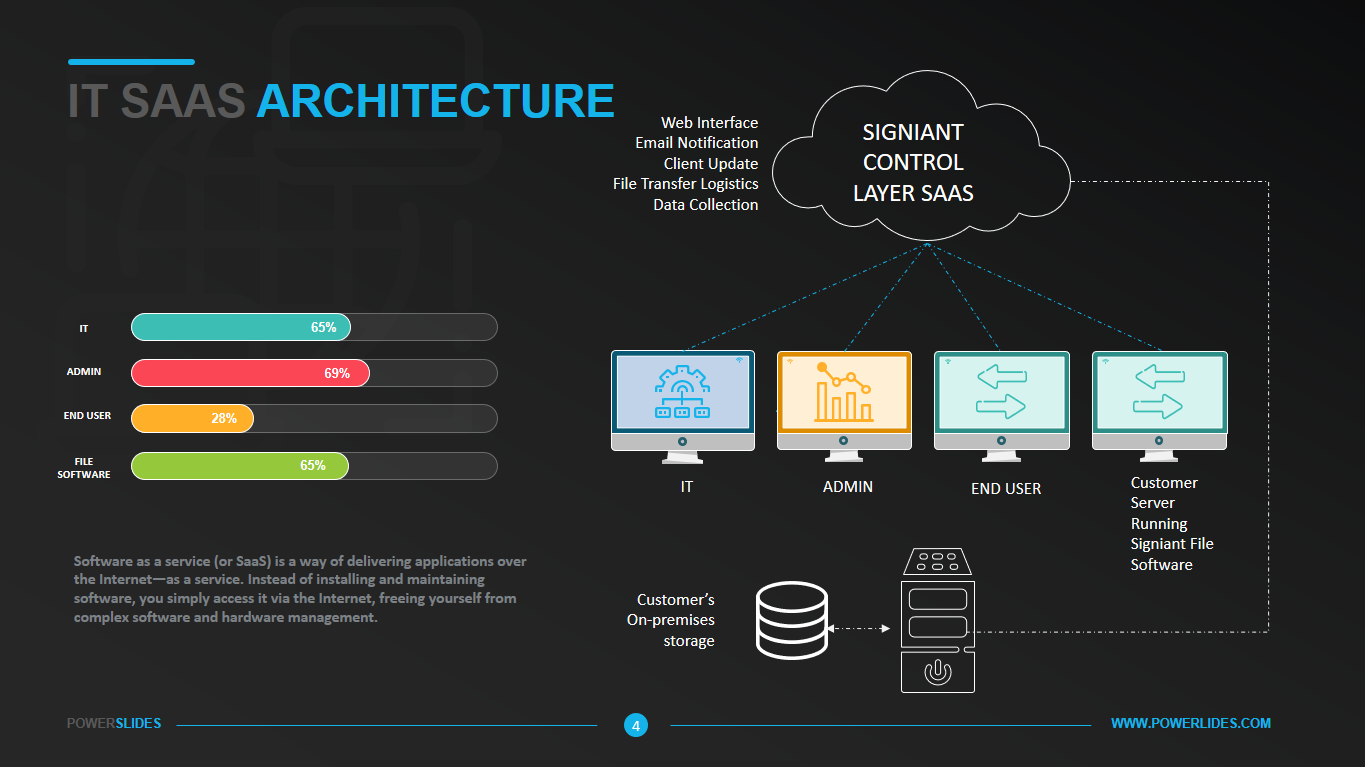
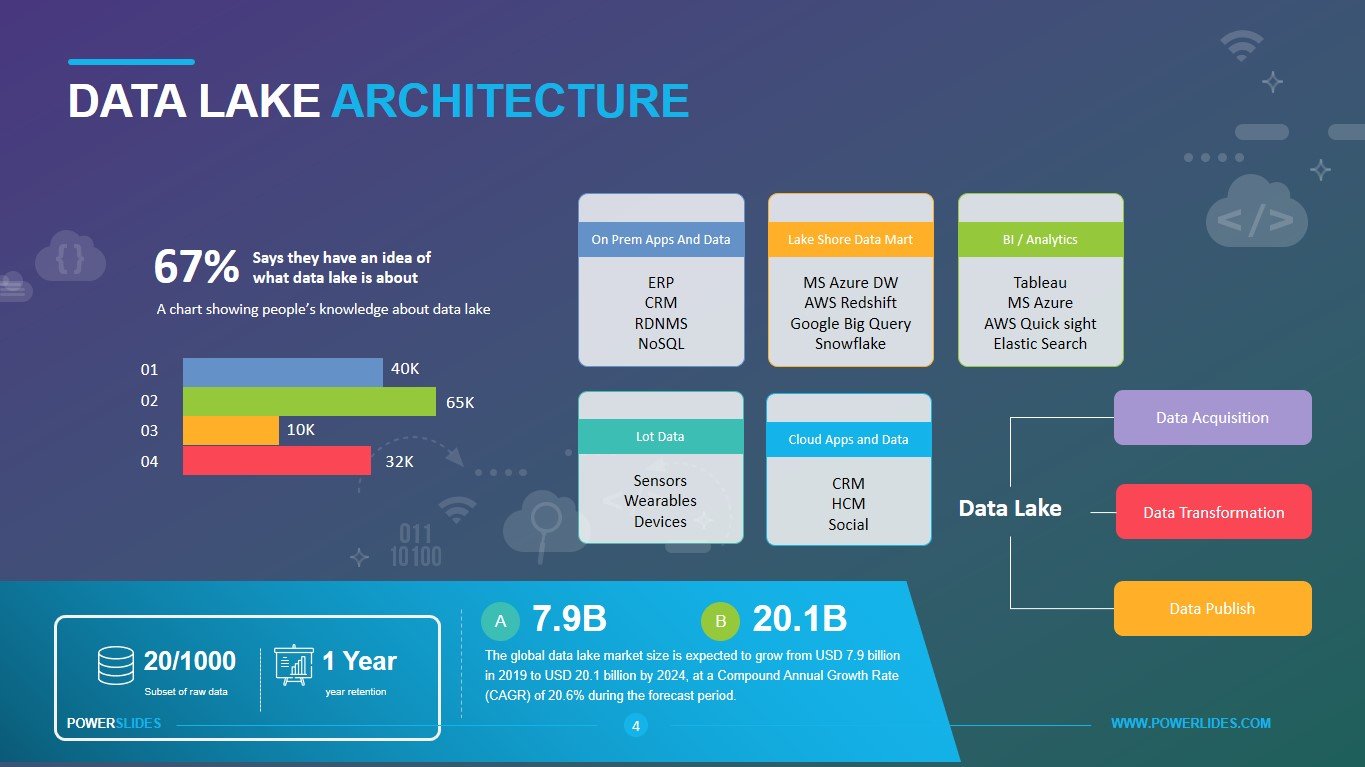
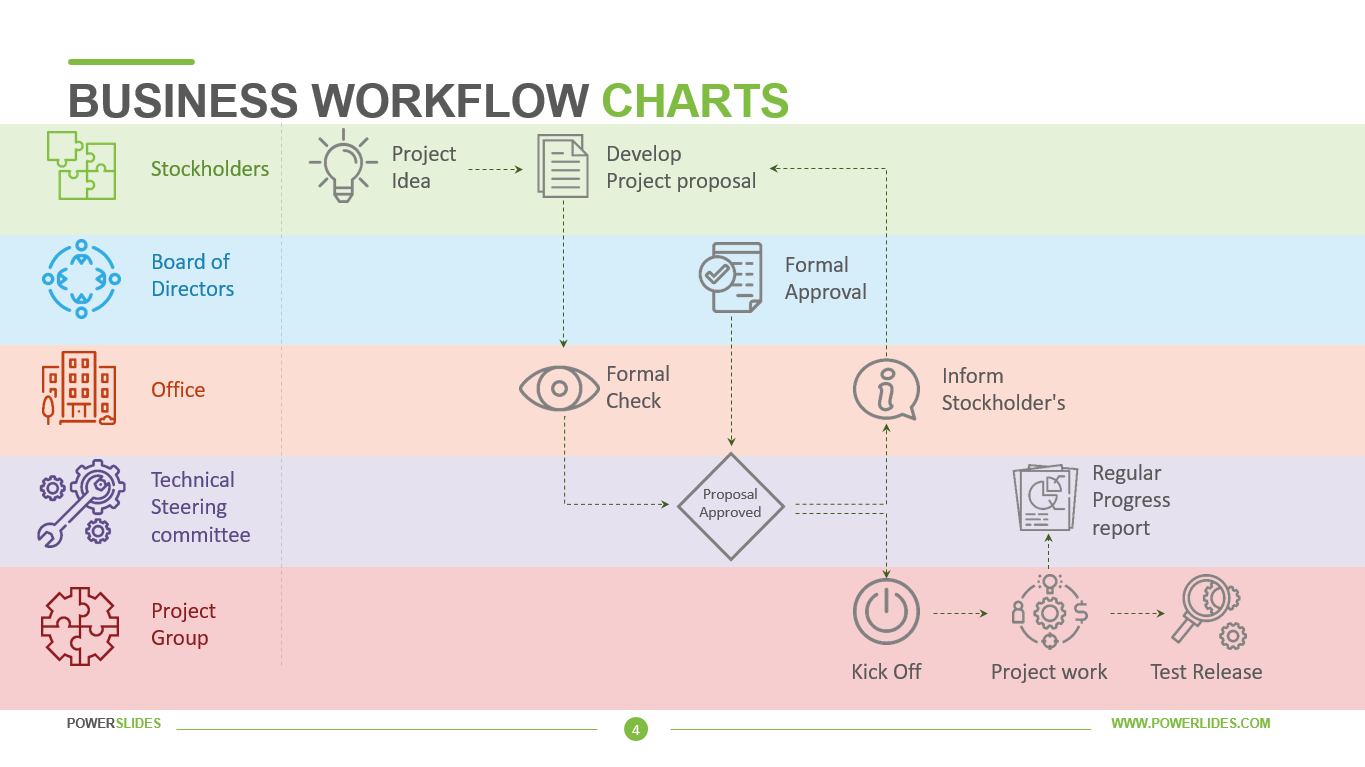
Workflow charts also give a broad overview of a business process, which means they’re often used as a springboard to other more granular process diagrams, such as data flow diagrams, flowcharts, and more. To create a workflow diagram, you’ll first need to conduct a workflow analysis. This is essentially a deep dive into your team or organization’s current way of completing tasks, including the order in which work is completed and the responsibilities of different employees.
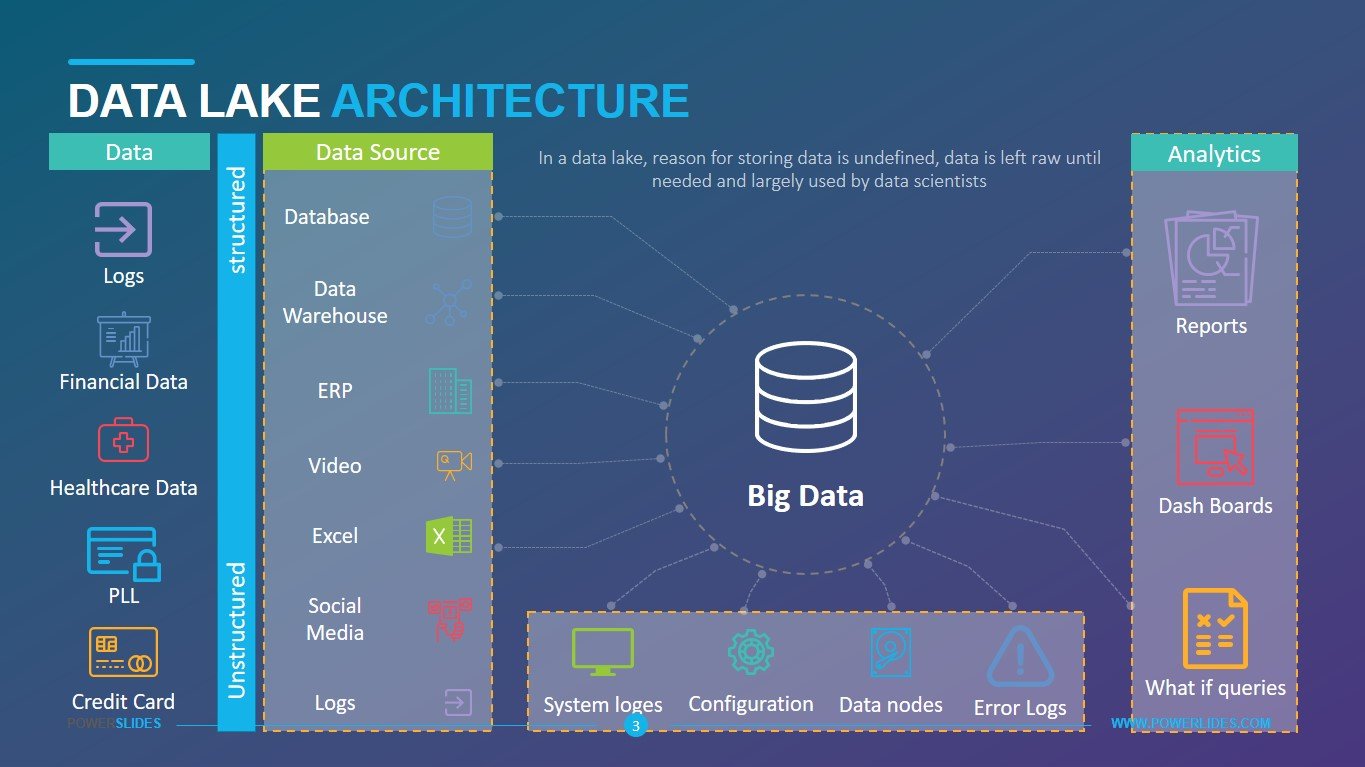
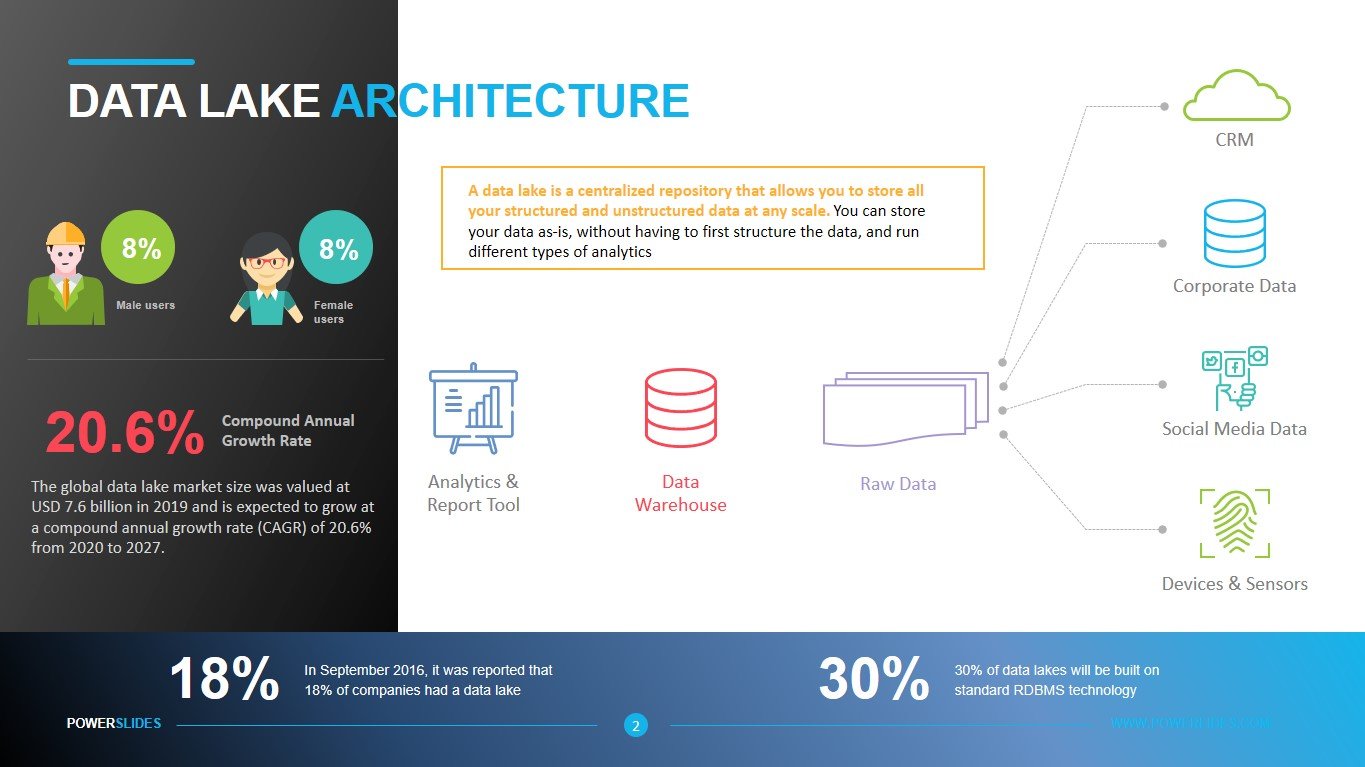
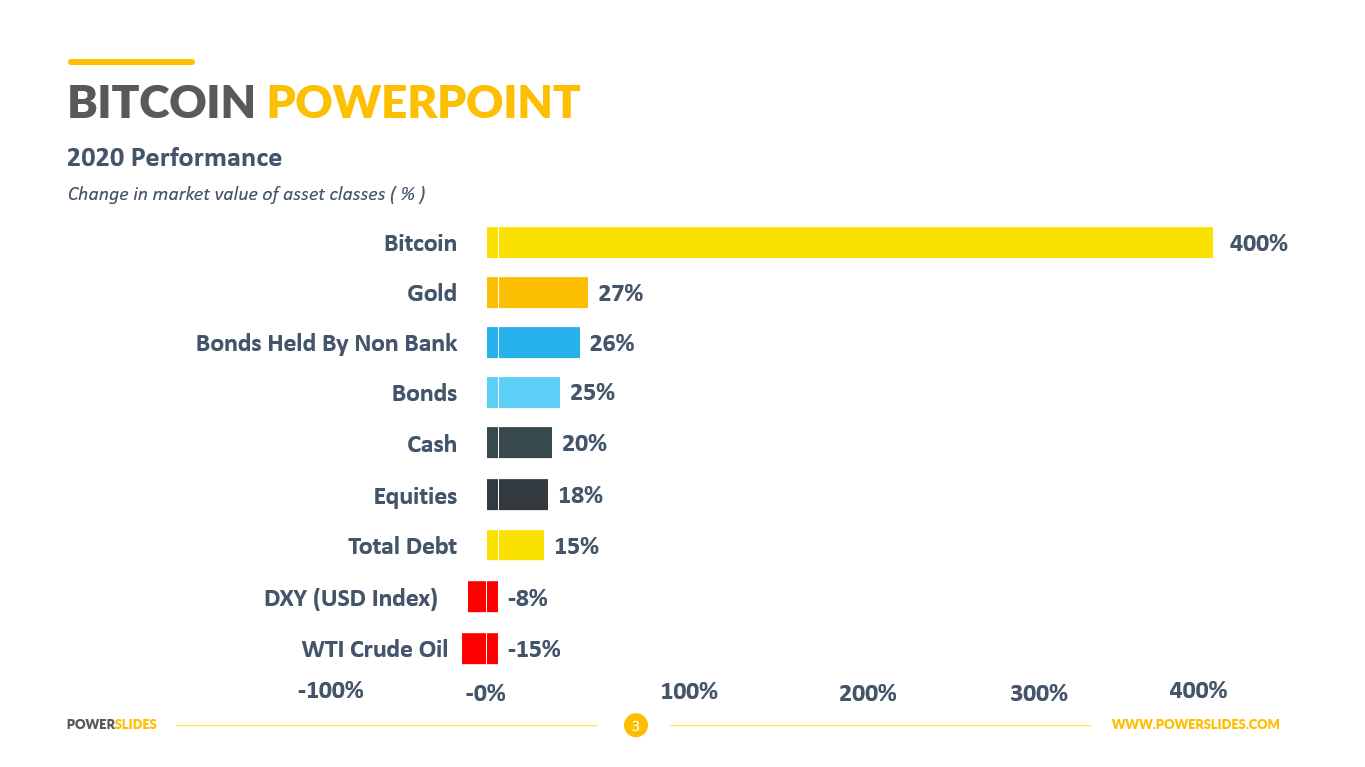
The data you collect will help you layout your initial workflow diagram. Whether your goal is to standardize certain processes, identify project-critical jobs, or locate weaknesses and bottlenecks, visualizing your workflow will help give your plans a broader context. Quick visuals also help every member of the team understand not just what it is they’re doing, but how they fit into the wider business process at a glance, creating greater levels of cohesion and cross-department collaboration.
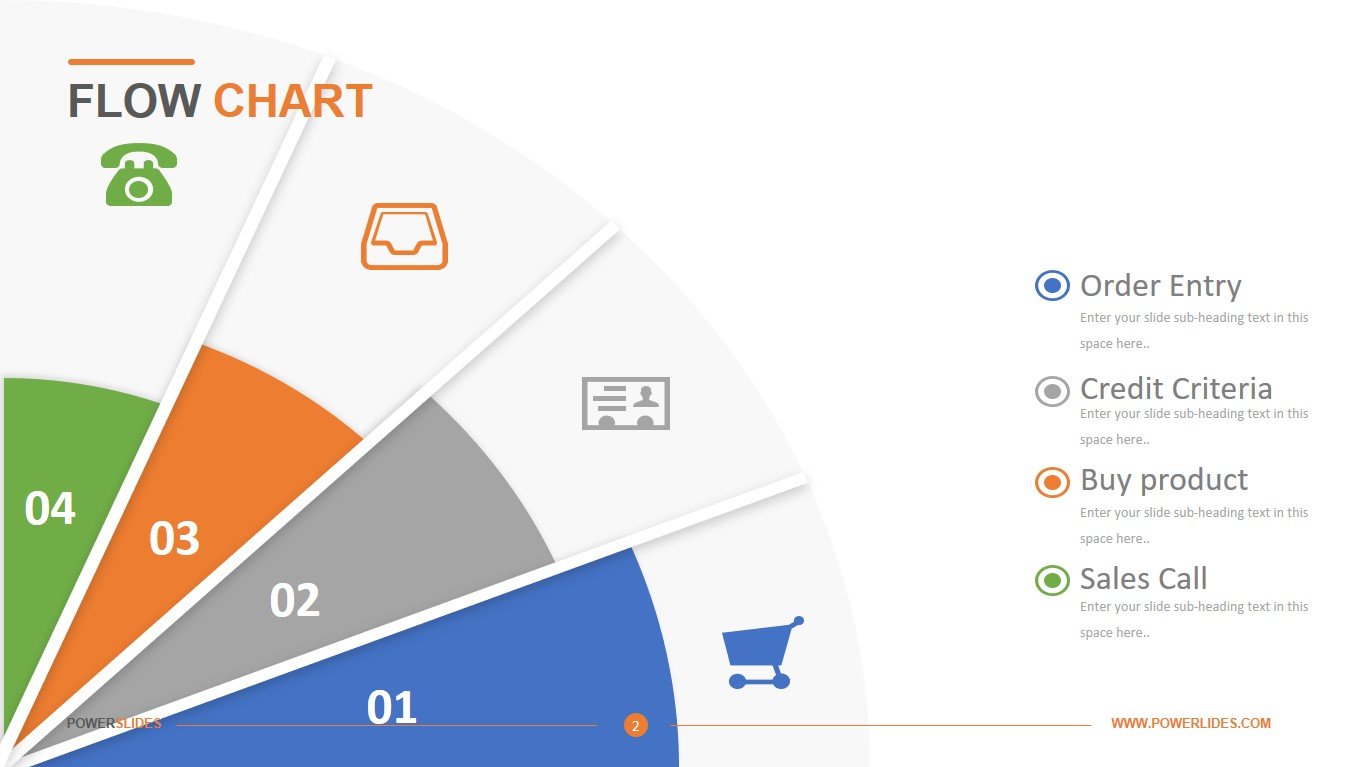
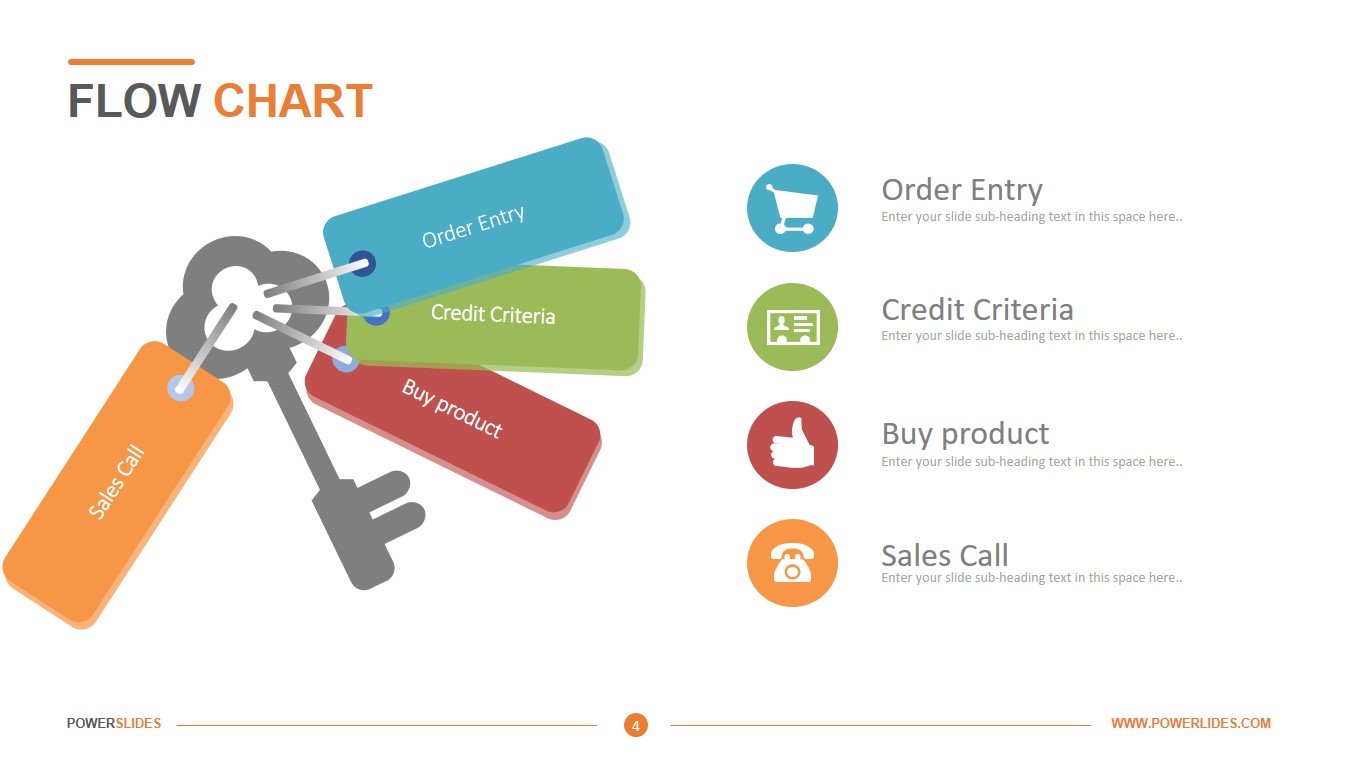
Every team has a unique workflow and way of working. A good workflow template will flex to your unique processes. You’ll be pleasantly surprised with how this PowerPoint template gives you the flexibility to change graphics and create a workflow that matches the way you and your team work.
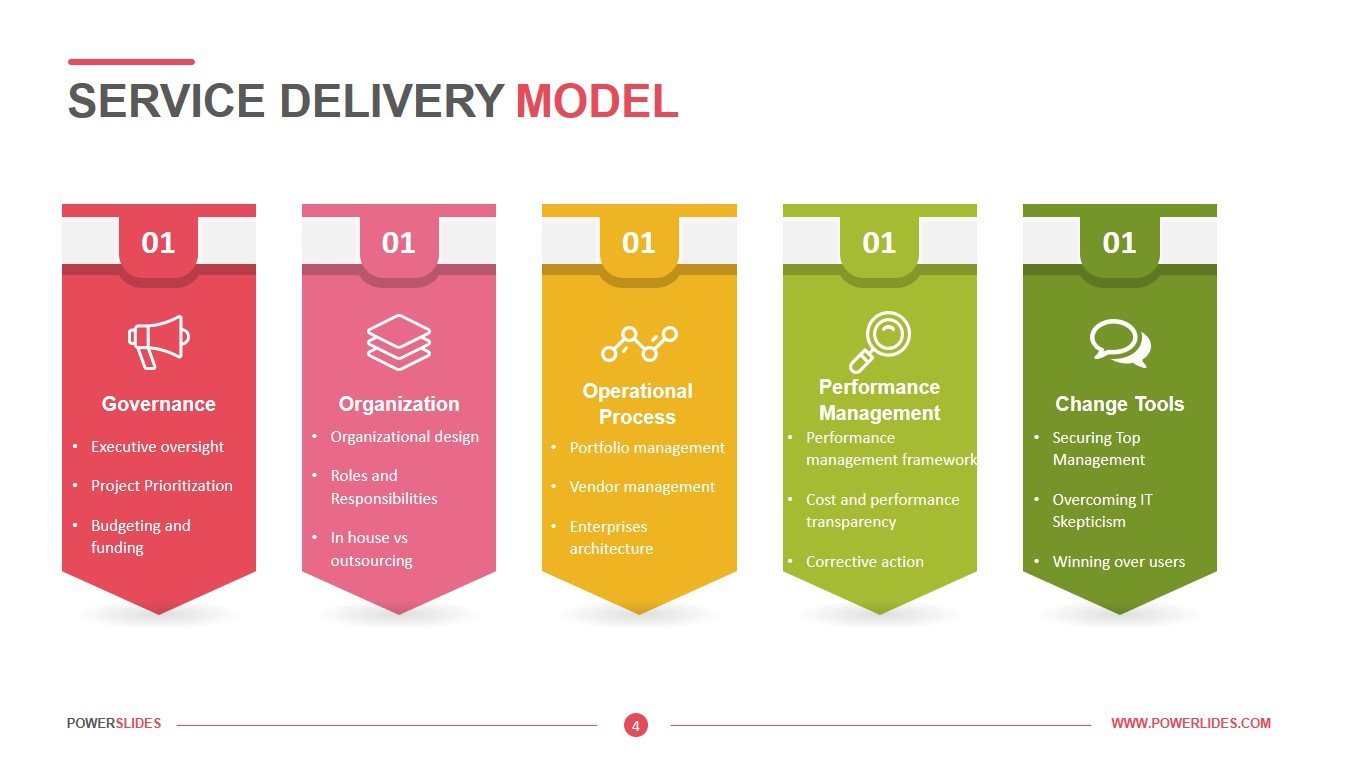
Business Workflow Charts will be useful for business leaders when developing new strategies and functional connections between departments. You can visualize the restructured departments of the company and their processes using the slides of this template. Also, this template will be useful for new department leaders when developing new ways of working and introducing advanced technologies.
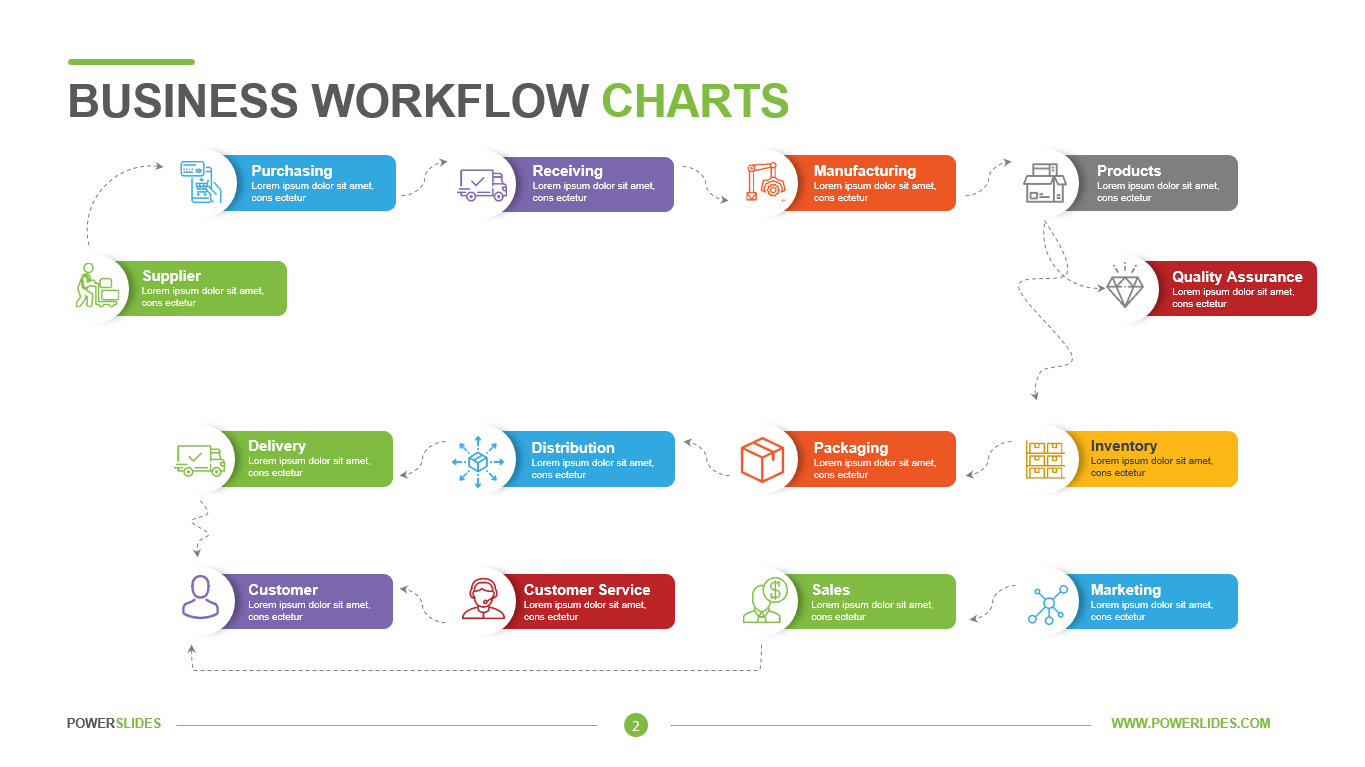
Startup executives can also use this template when preparing to meet with potential investors. You can present your business plan in detail and specify the business processes of your company. Also, this template will be useful for managers when designing production halls and storage areas for finished products. You can describe in detail the stages of transferring raw materials for preliminary processing, sending blanks for further more accurate processing to another workshop.
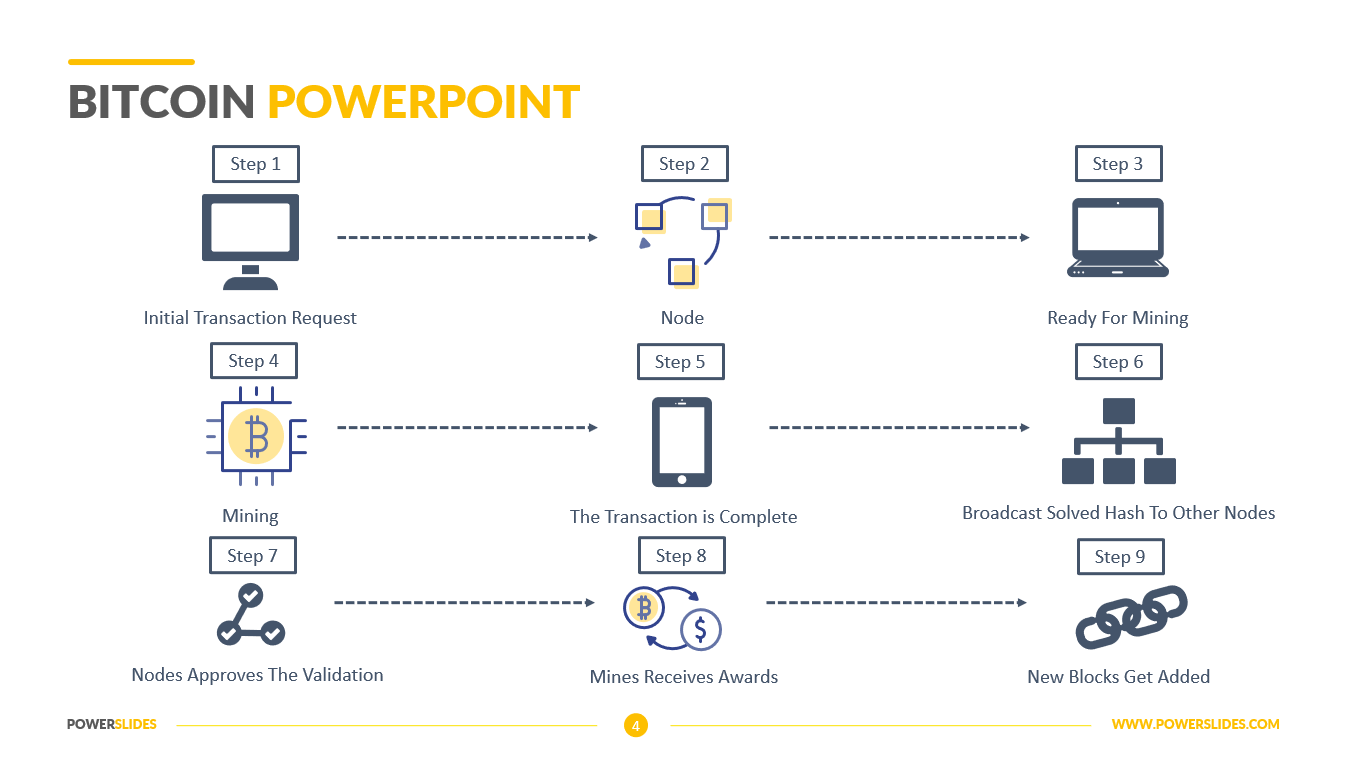
Software developers can also use this template when preparing the algorithms for the program. Visualizing complex data will make complex processes easier for your audience to understand.
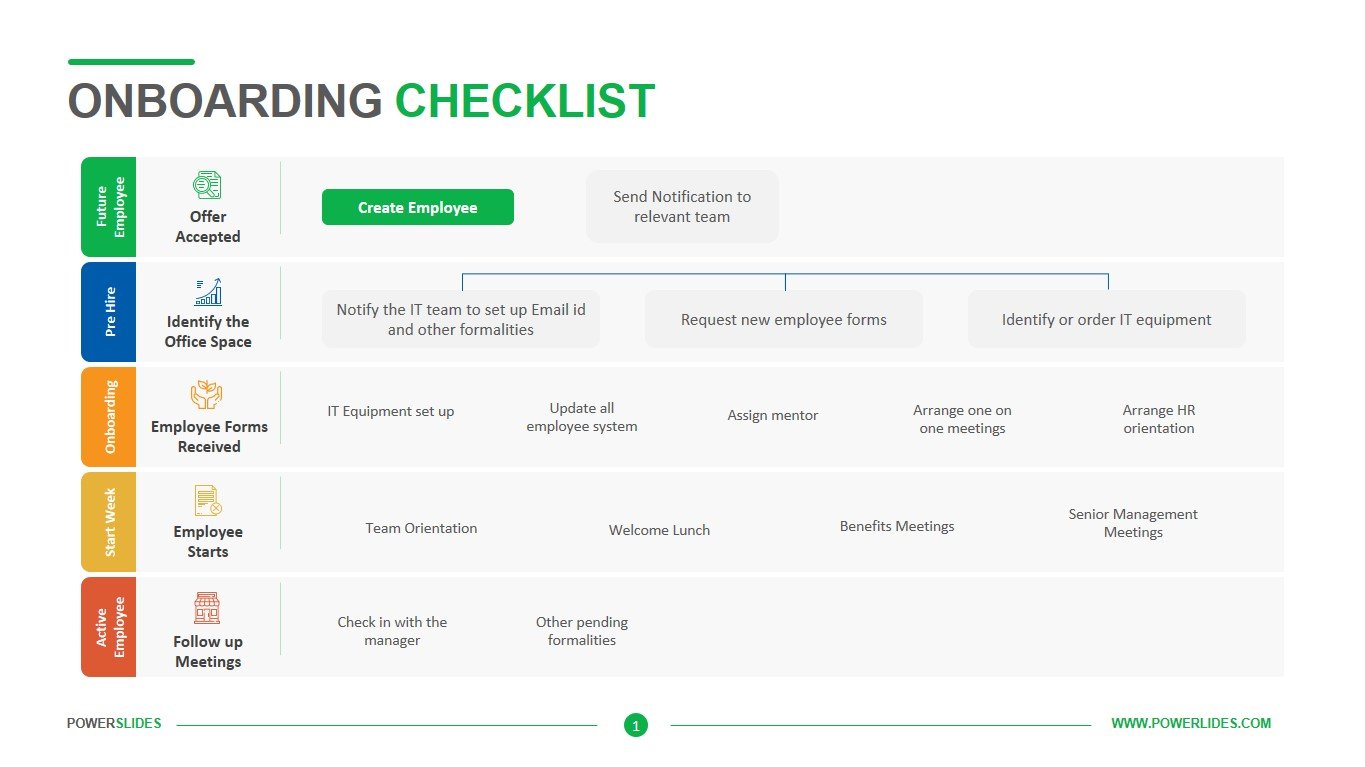
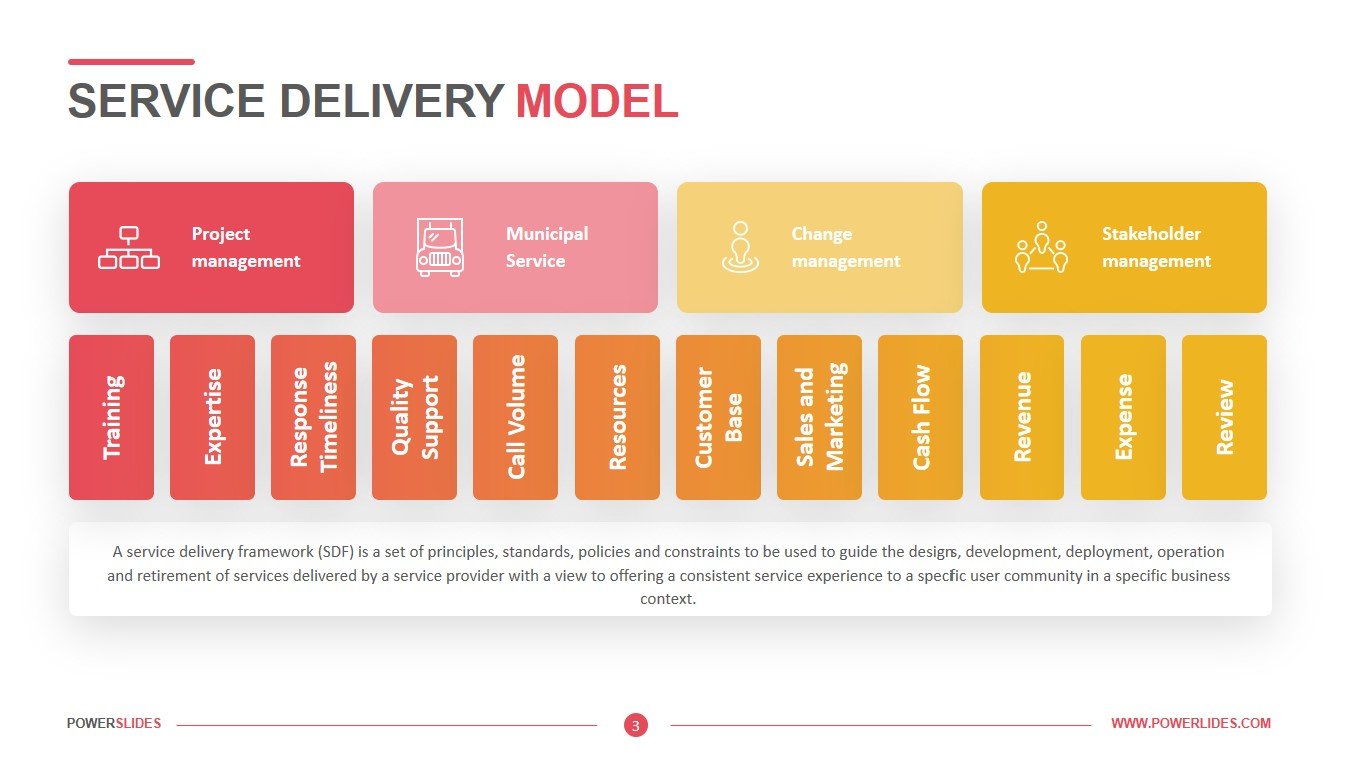
This template is ideal to show supplier processes, logistics and procurement processes. Visually show sequential steps, progression, approvals and tasks for a process or project. Whether your business is small or large, this workflow template will ensure that your team’s tasks and processes are verified to completion. The workflow is centered around internal and external stakeholders to show working relationships. The template comes in four varieties with different backgrounds that can match your brand aesthetic. The colors, text and shapes are customizable and editable. You can add, delete or change tasks and fields. Use this template to show progression, a timeline or sequential steps in a task, process, or workflow.


