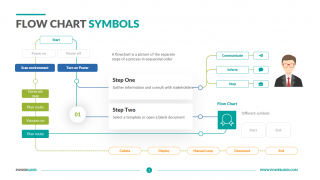
Circular Flow Charts
What do you think of this template?


 (3.67/ 5)
11 ratings

 4 Slides
 File size: 16:9
 Fonts: Lato Black, Calibri
 Supported version
PPT 2010, PPT 2013, PPT 2016
Supported version
PPT 2010, PPT 2013, PPT 2016

Product details
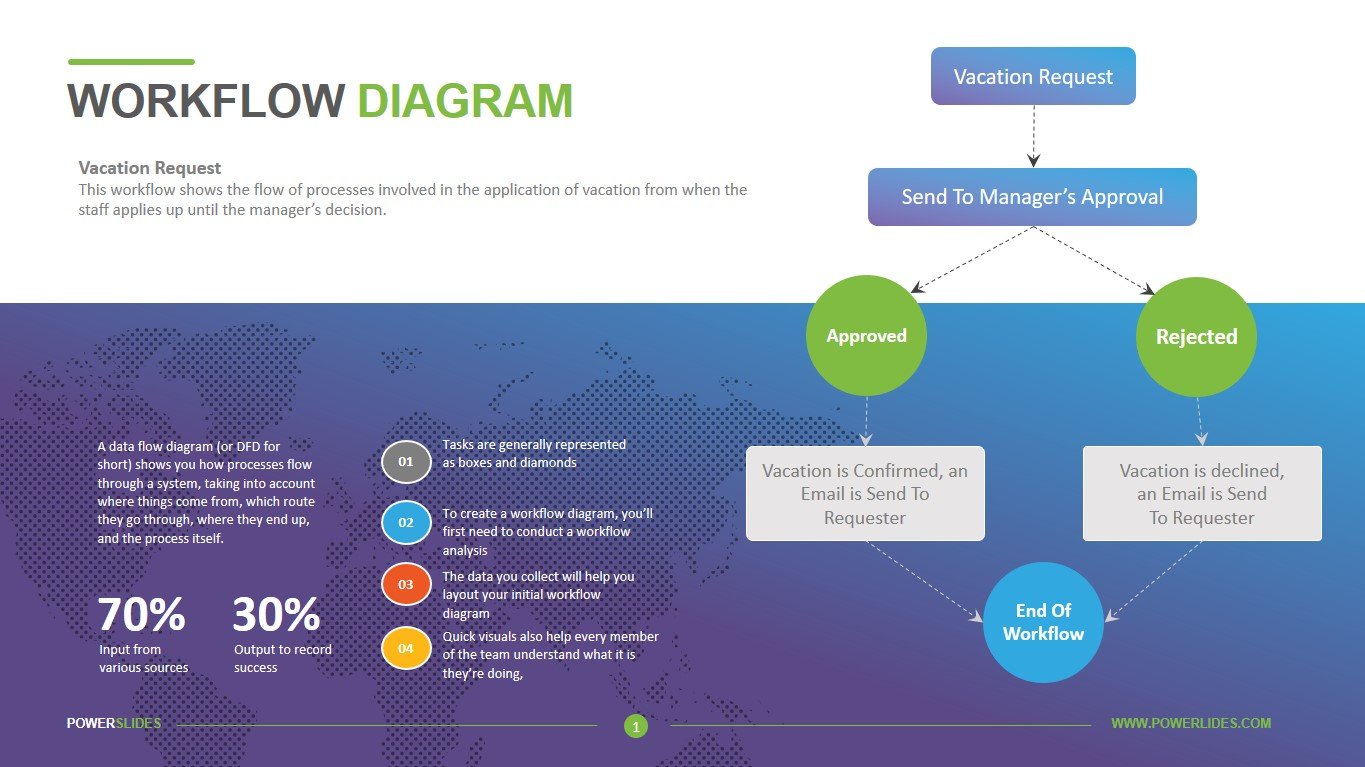
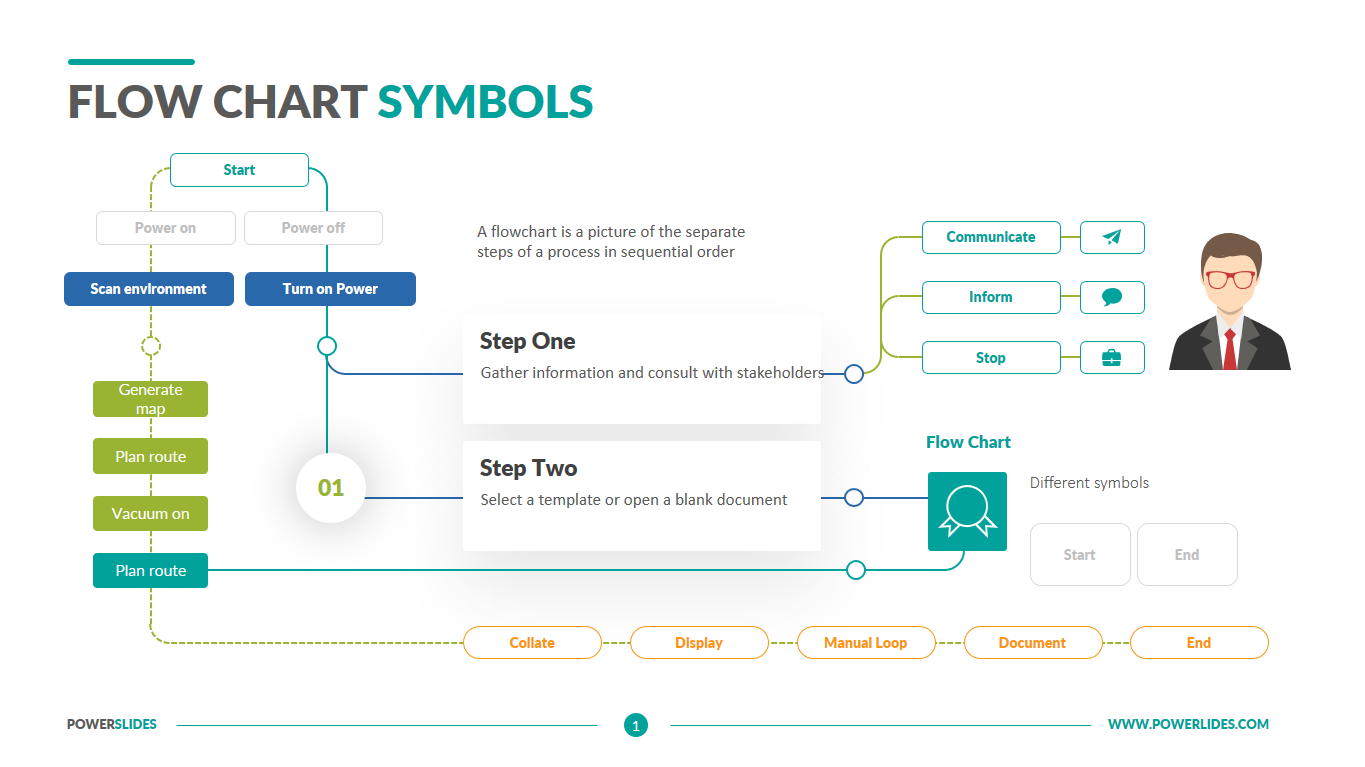
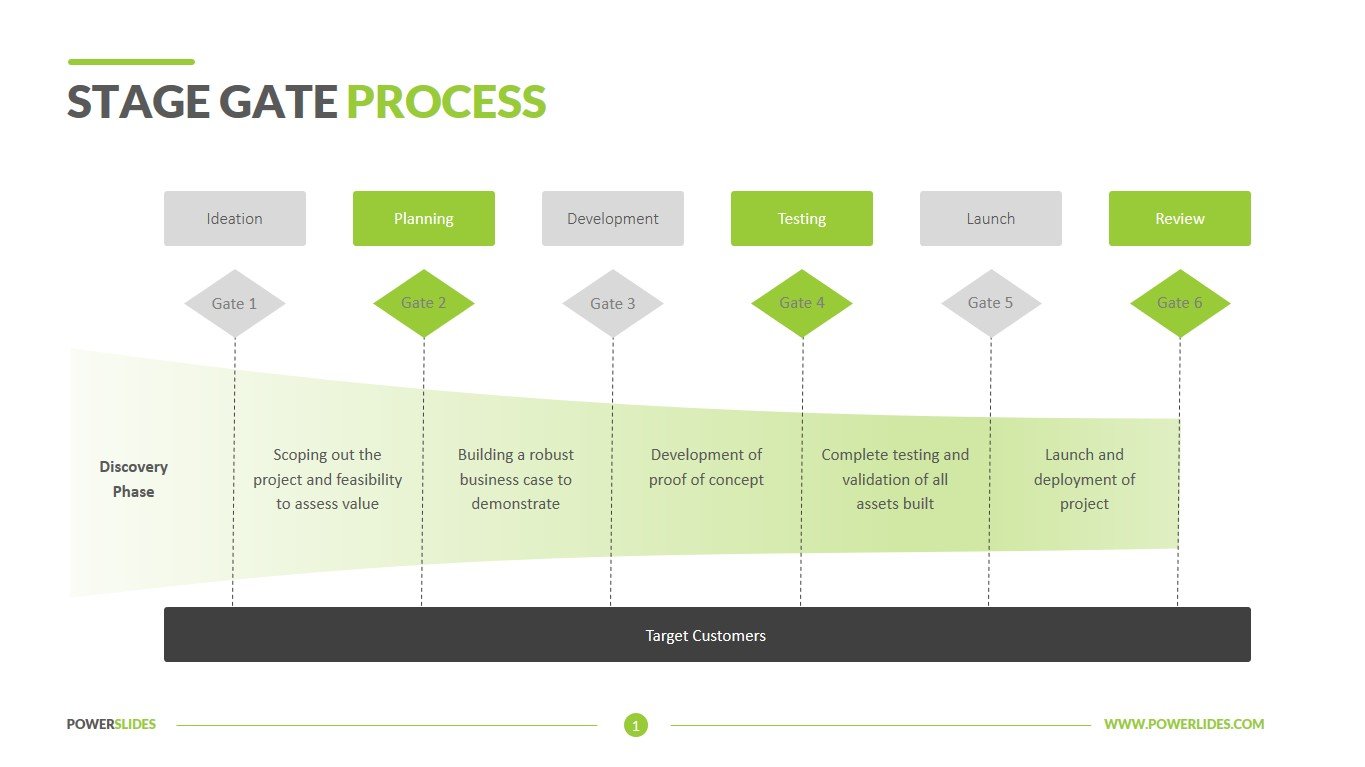
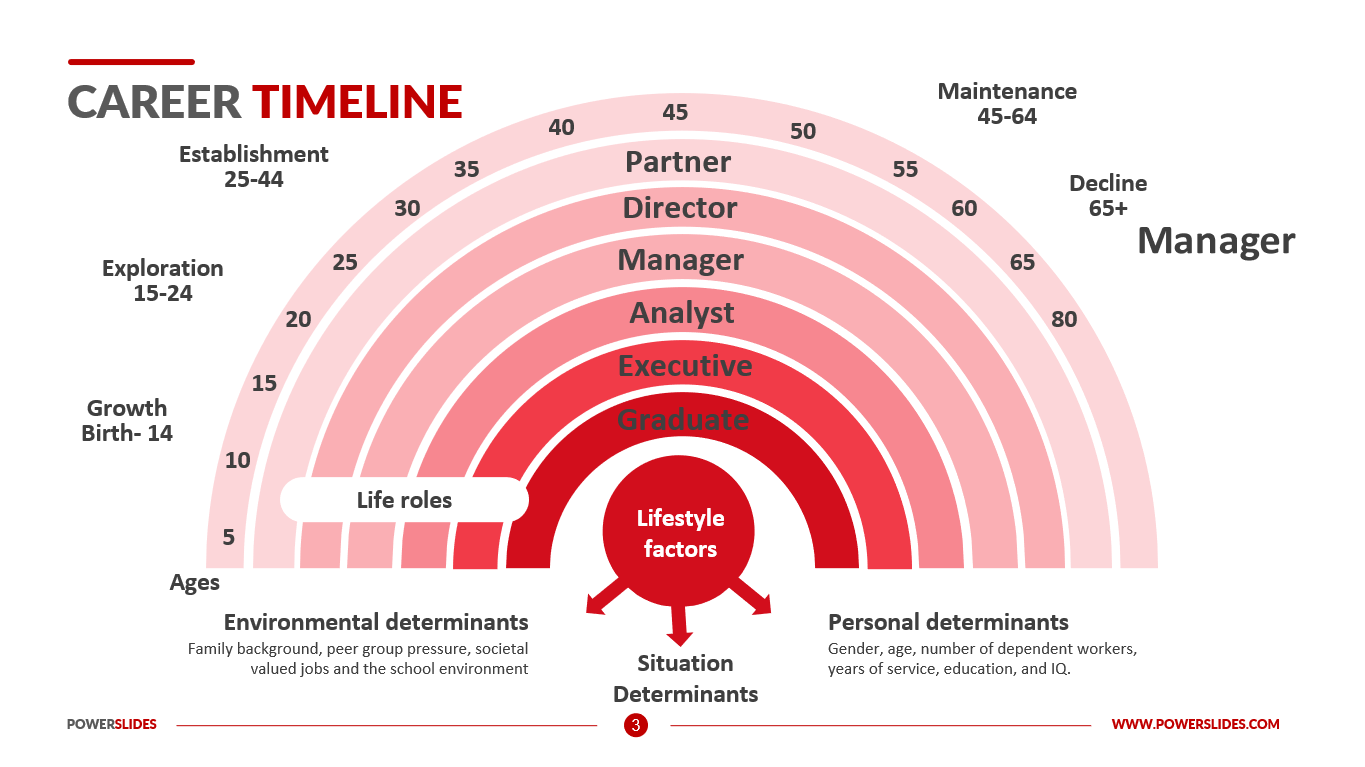
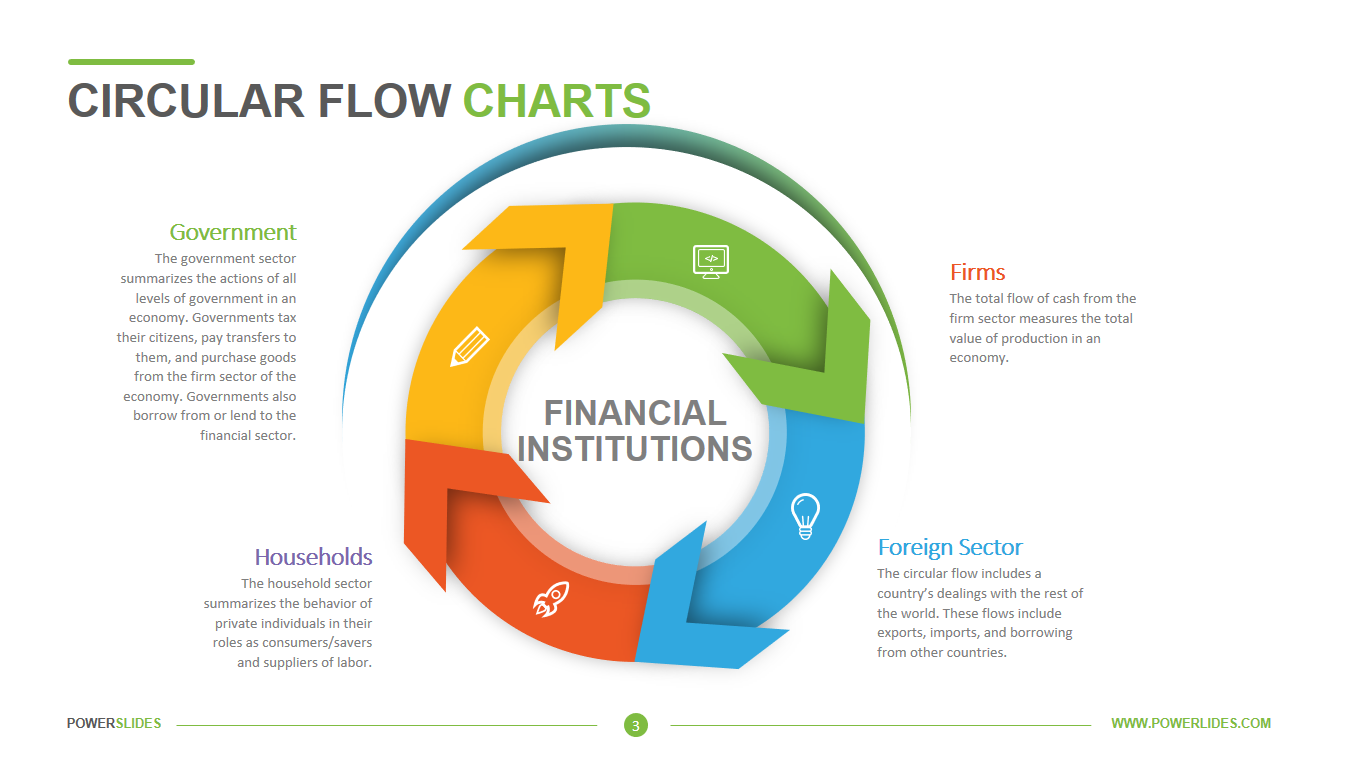
The economy consists of millions of people engaged in many activities—buying, selling, working, hiring, manufacturing, and so on. To understand how the economy works, we must find some way to simplify our thinking about all these activities. We need a model that explains, in general terms, how the economy is organized and how participants in the economy interact with one another. For these purposes, a Circular Flow Chart was developed. In this model, the economy has two types of decisionmakers—households and firms.
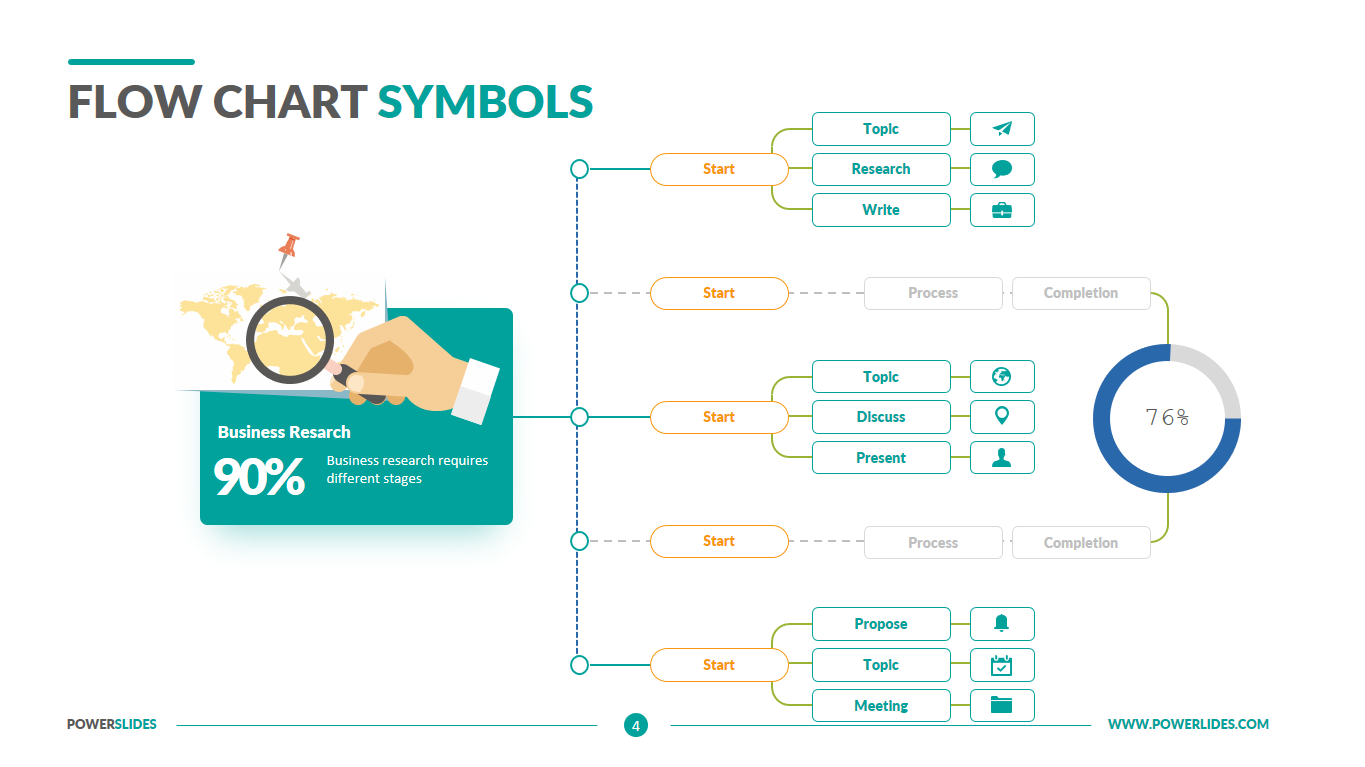
Firms produce goods and services using inputs, such as labor, land, and capital (buildings and machines). These inputs are called the factors of production. Households own the factors of production and consume all the goods and services that the firms produce. Households and firms interact in two types of markets. In the markets for goods and services, households are buyers and firms are sellers. In particular, households buy the output of goods and services that firms produce. In the markets for the factors of production, households are sellers and firms are buyers. In these markets, households provide firms the inputs that the firms use to produce goods and services. The circular flow diagram offers a simple way of organizing all the economic transactions that occur between households and firms in the economy.
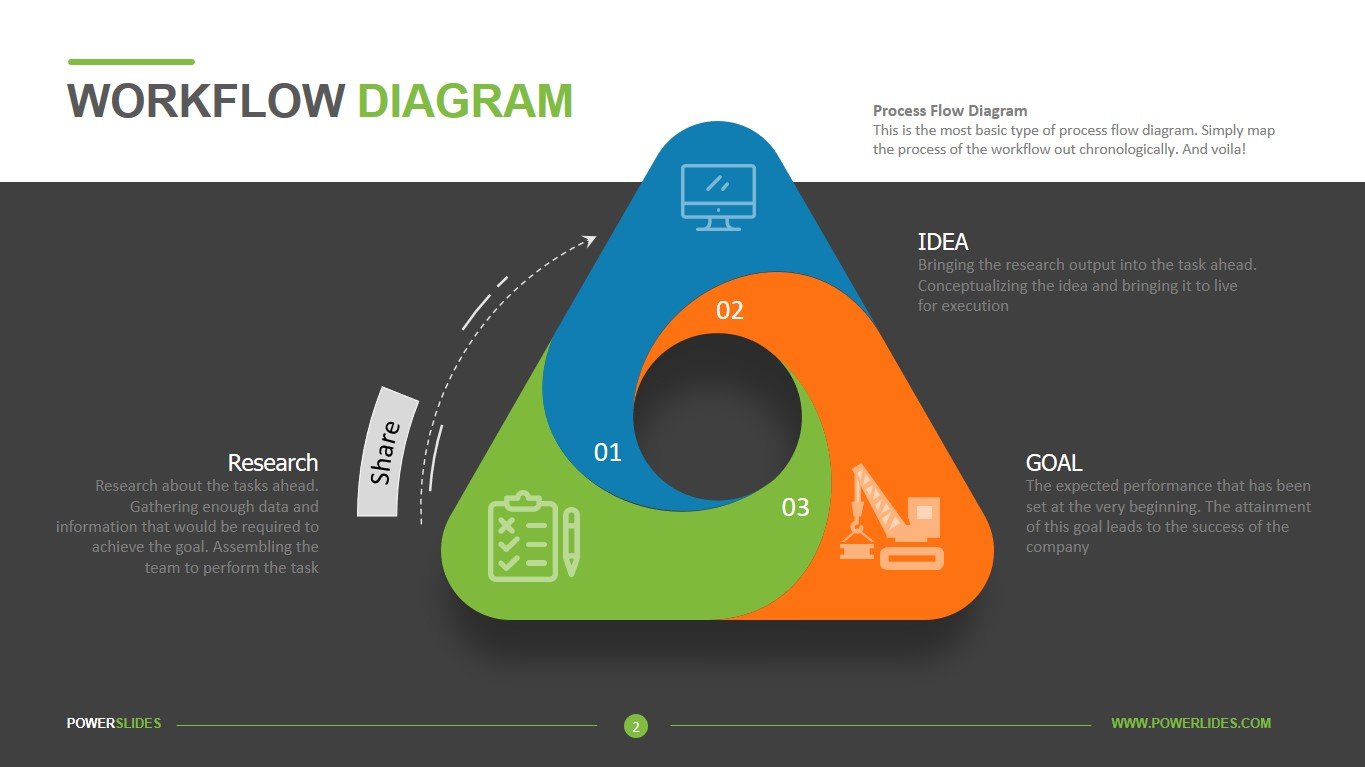
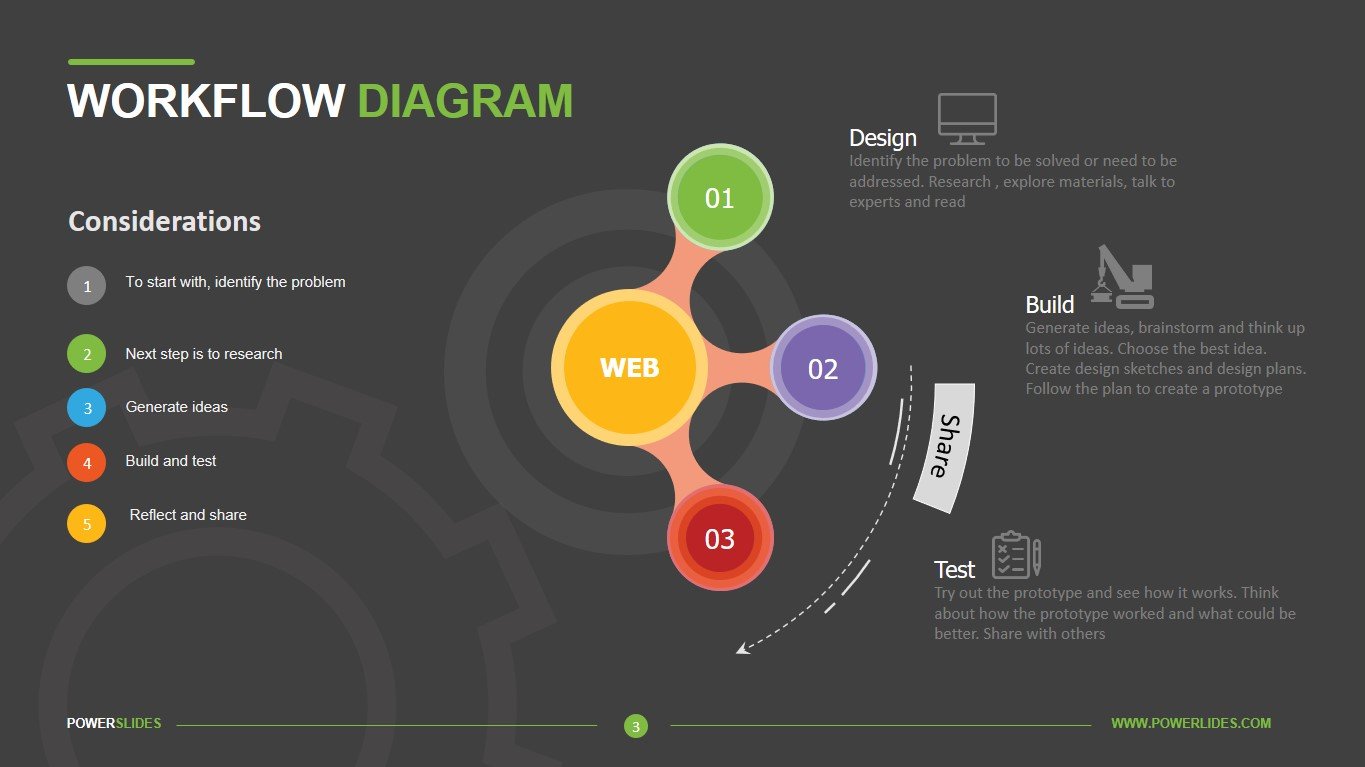
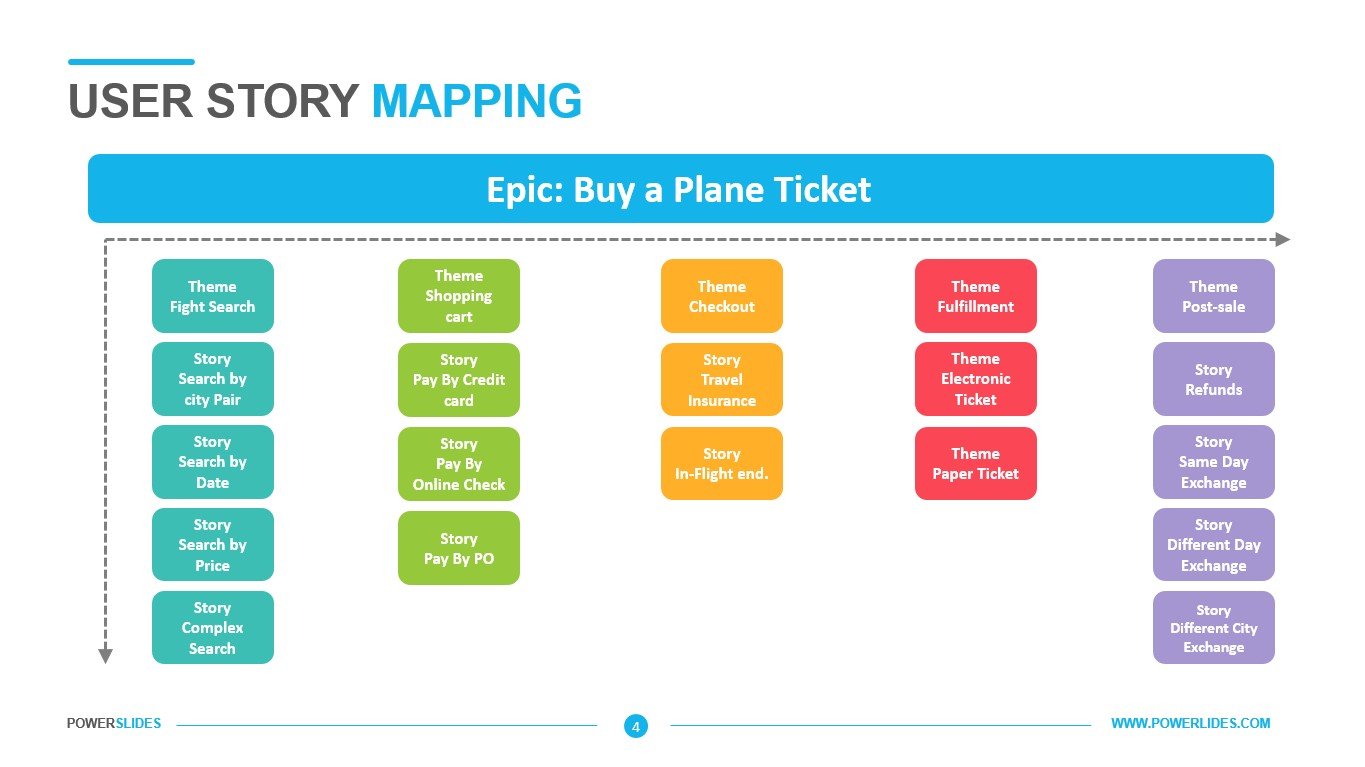
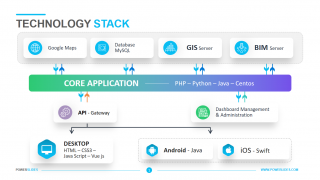
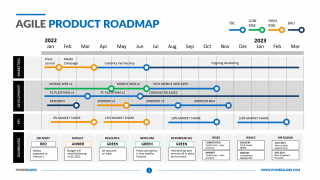
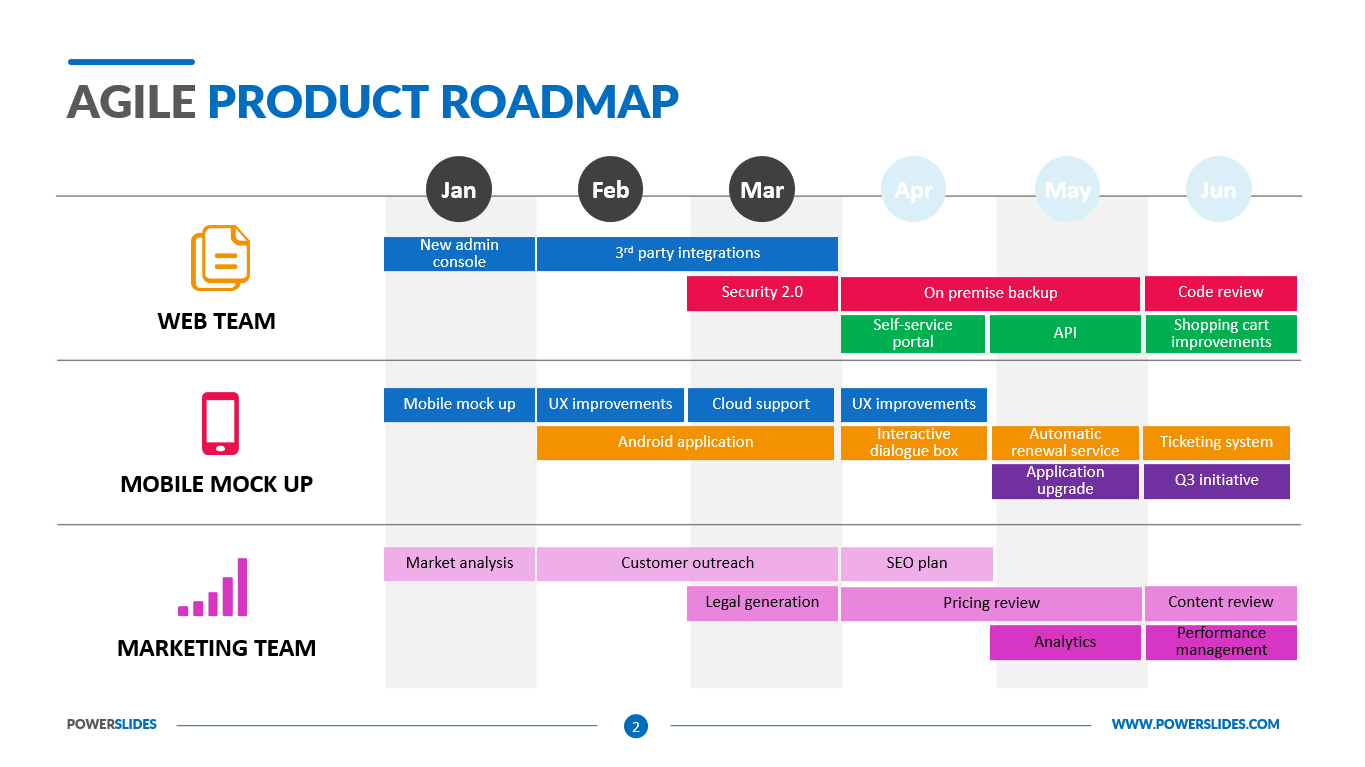
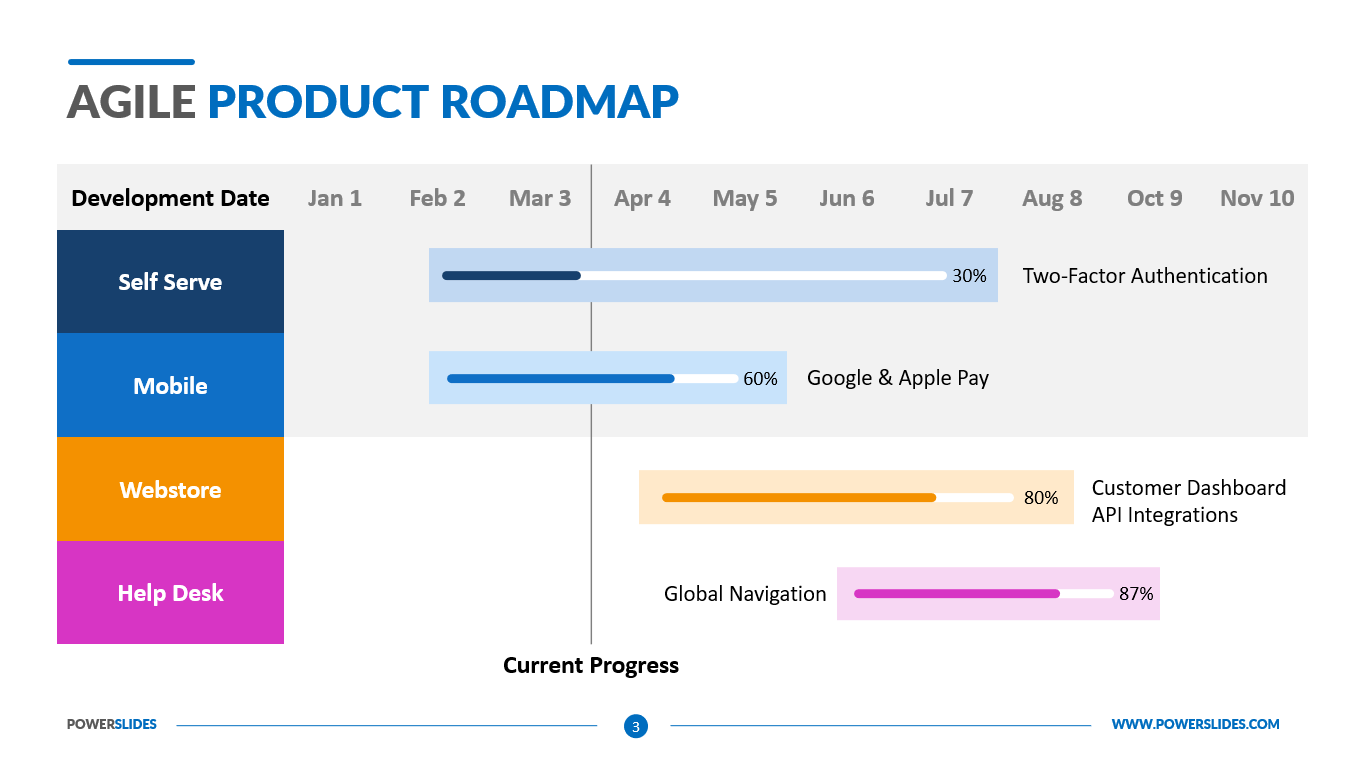
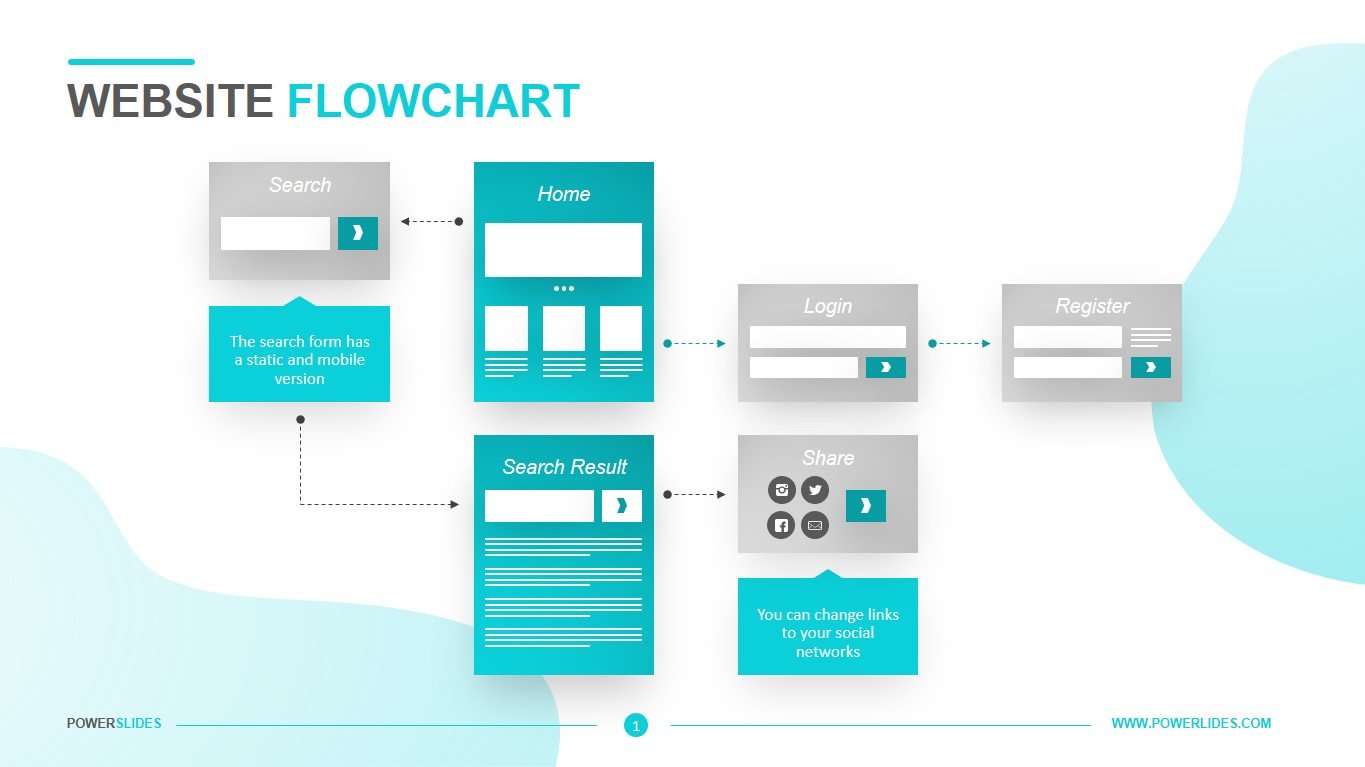
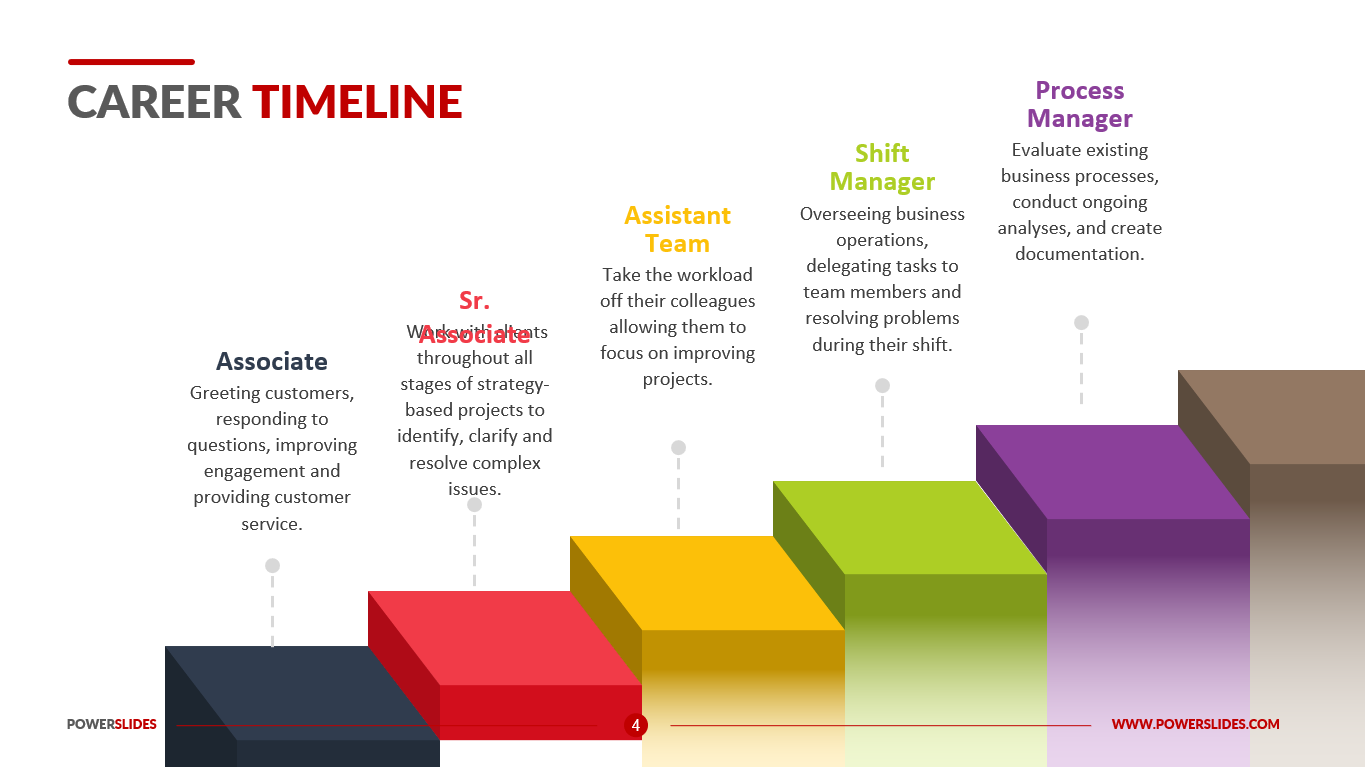
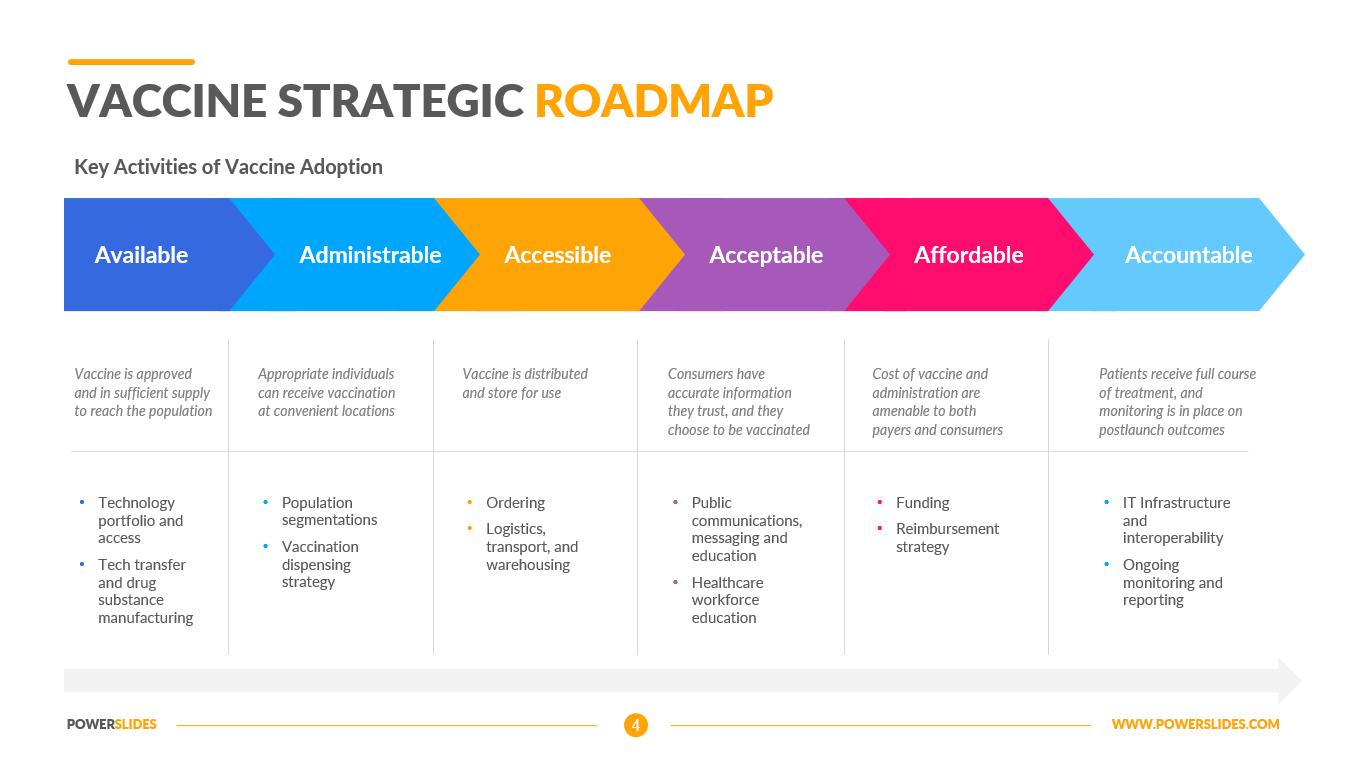
This PowerPoint template is ideal to show financial processes, procurement processes, human resources processes, information technology processes, software development lifecycles and more. Ideal for project managers, team leads and scrum masters, you can visually show sequential steps, progression, approvals and tasks for a process or project.
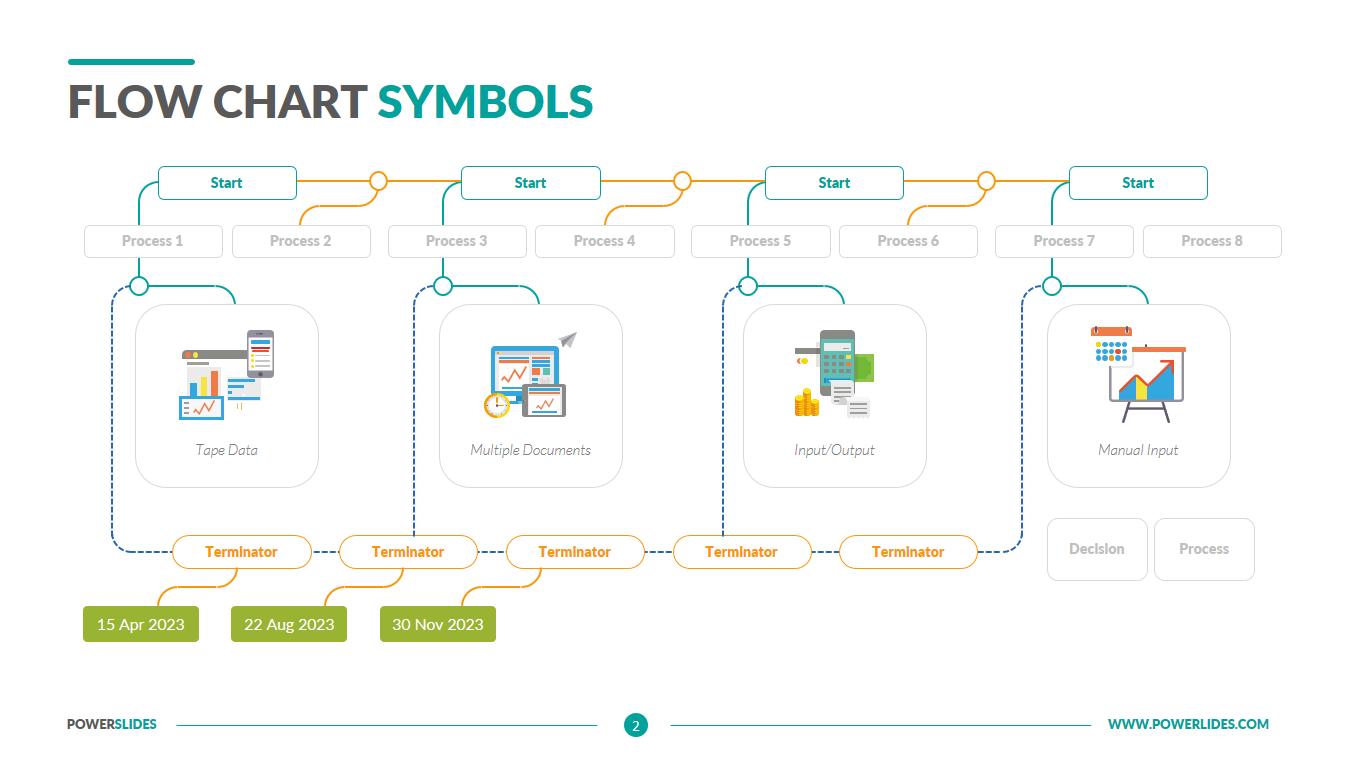
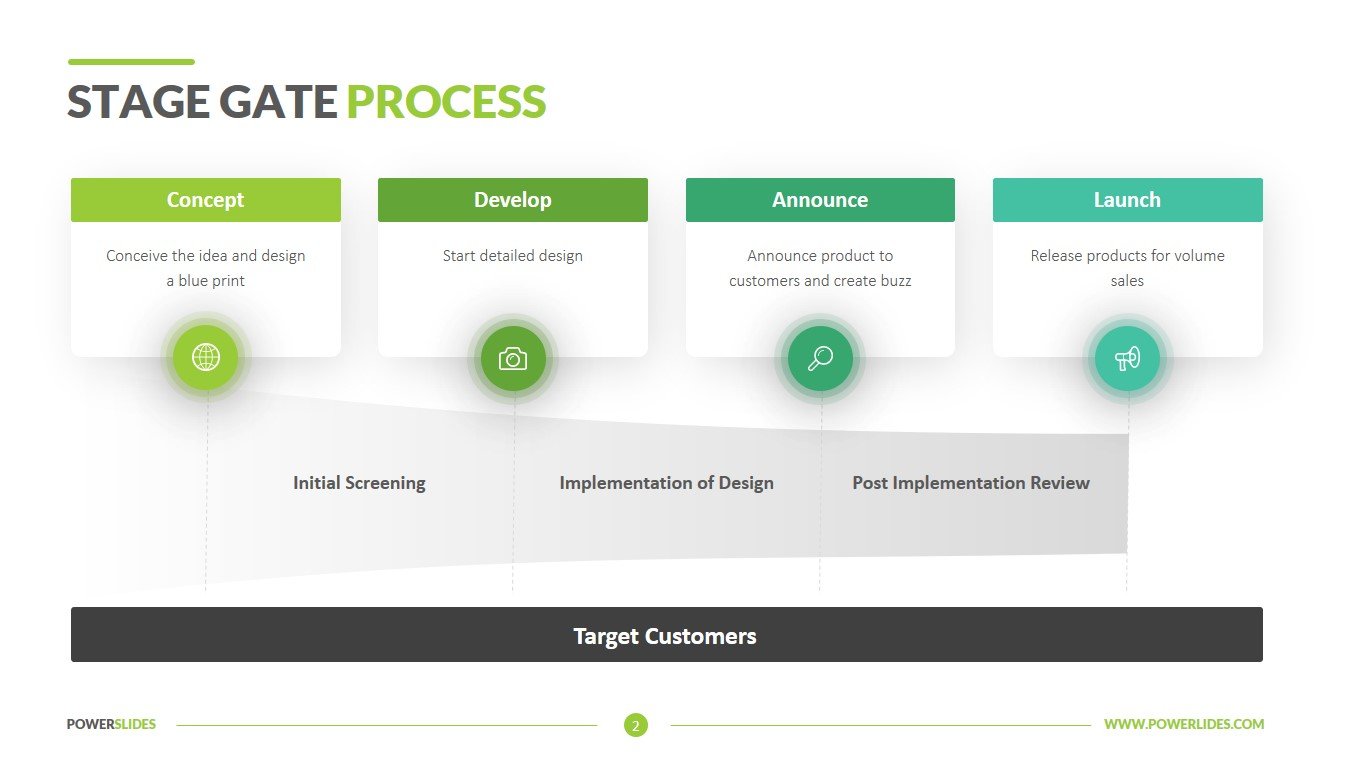
The Circular Flow Charts template will be useful for startup executives. You can use the slides in this template to prepare a cash flow model and reinvest it in the future of the firm. This template’s infographics will allow you to present your information in a way that is accessible to your audience.
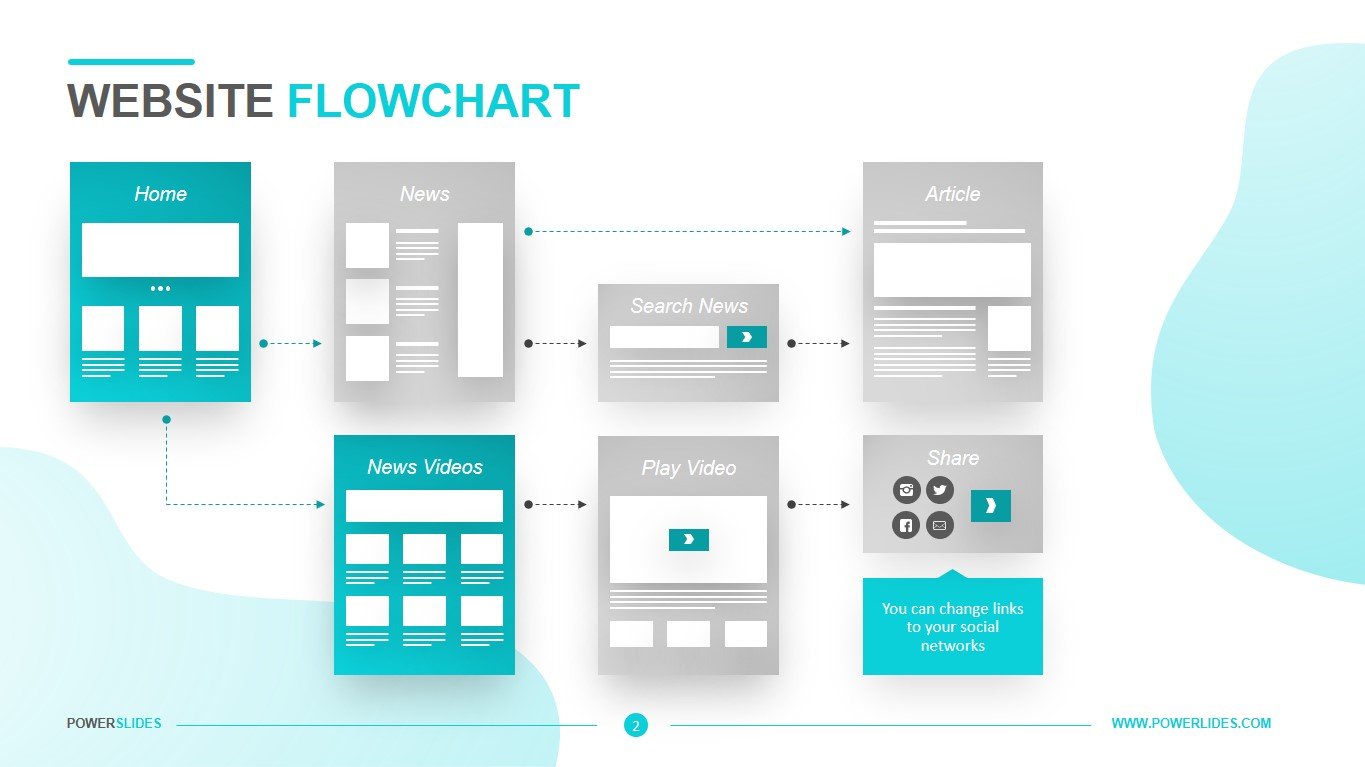
Team leaders and software developers can use these slides to prepare a custom application model. Engineers and technicians can use this template to show continuous improvement in manufacturing technology, similar to Japanese Lean models.
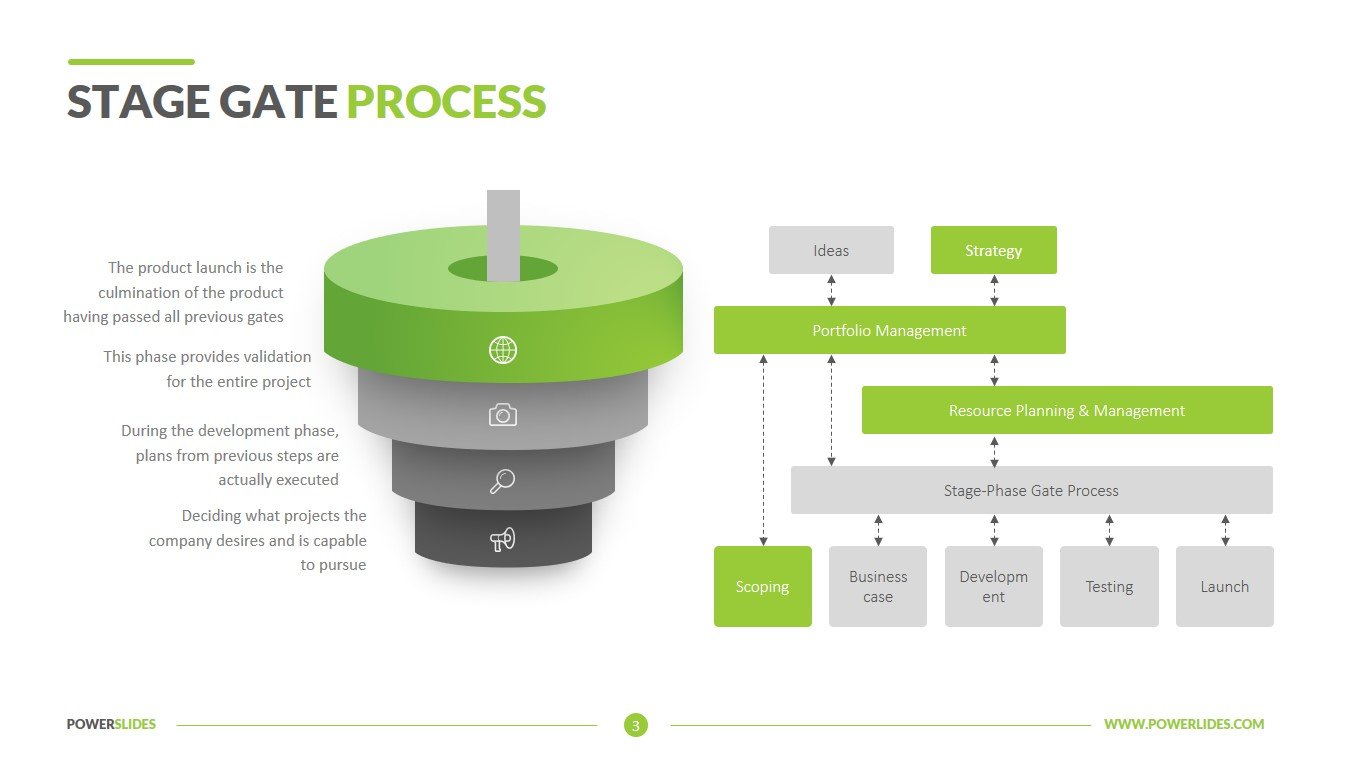
This template can also be useful for logistics managers. You can imagine the cyclical nature of the processes of delivering raw materials to production. Quality managers can use this template when preparing a visualization of the cyclicality of the product inspection process for compliance with norms.
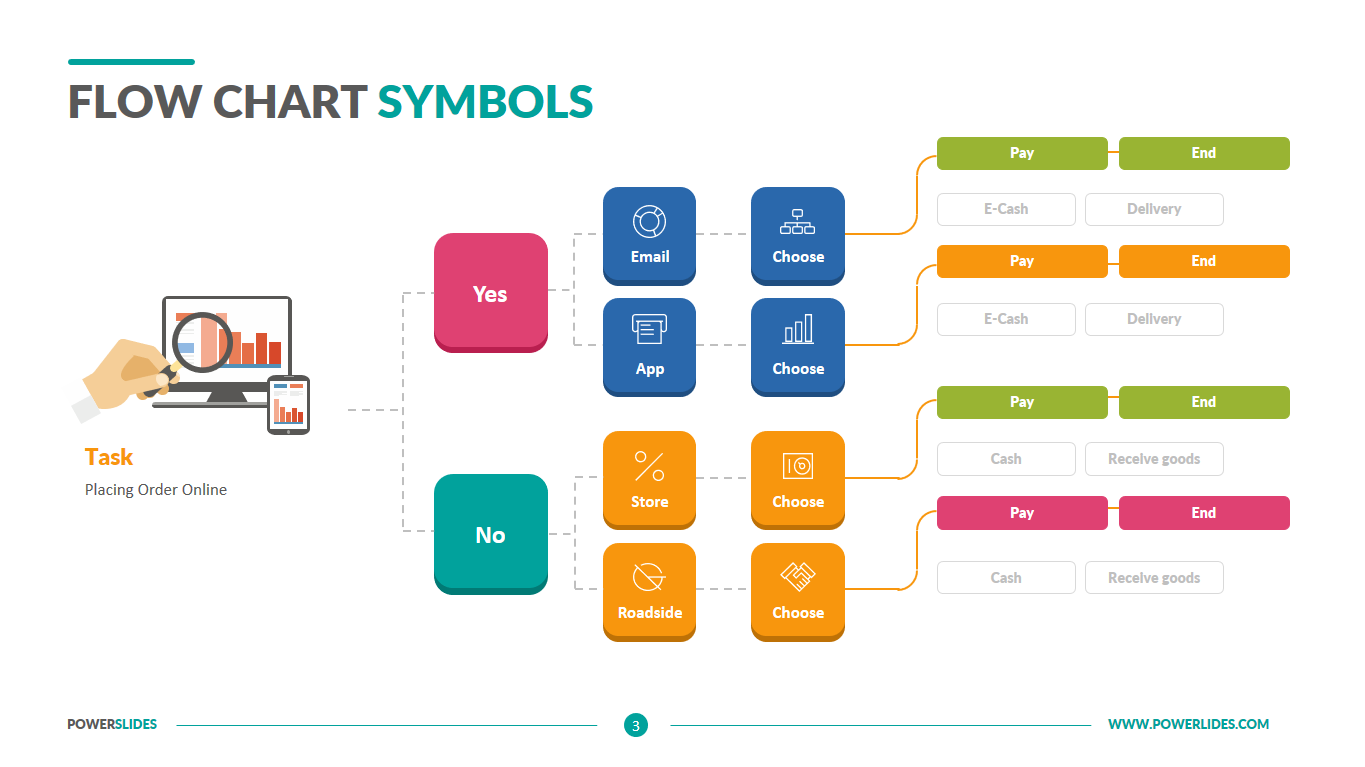
Business trainers and university educators can use this template when preparing their courses on Lean or Cycle Selling. This template can also be used by company leaders when preparing materials on the topic of teamwork. Environmentalists can use this template when preparing a waste management and recycling model.
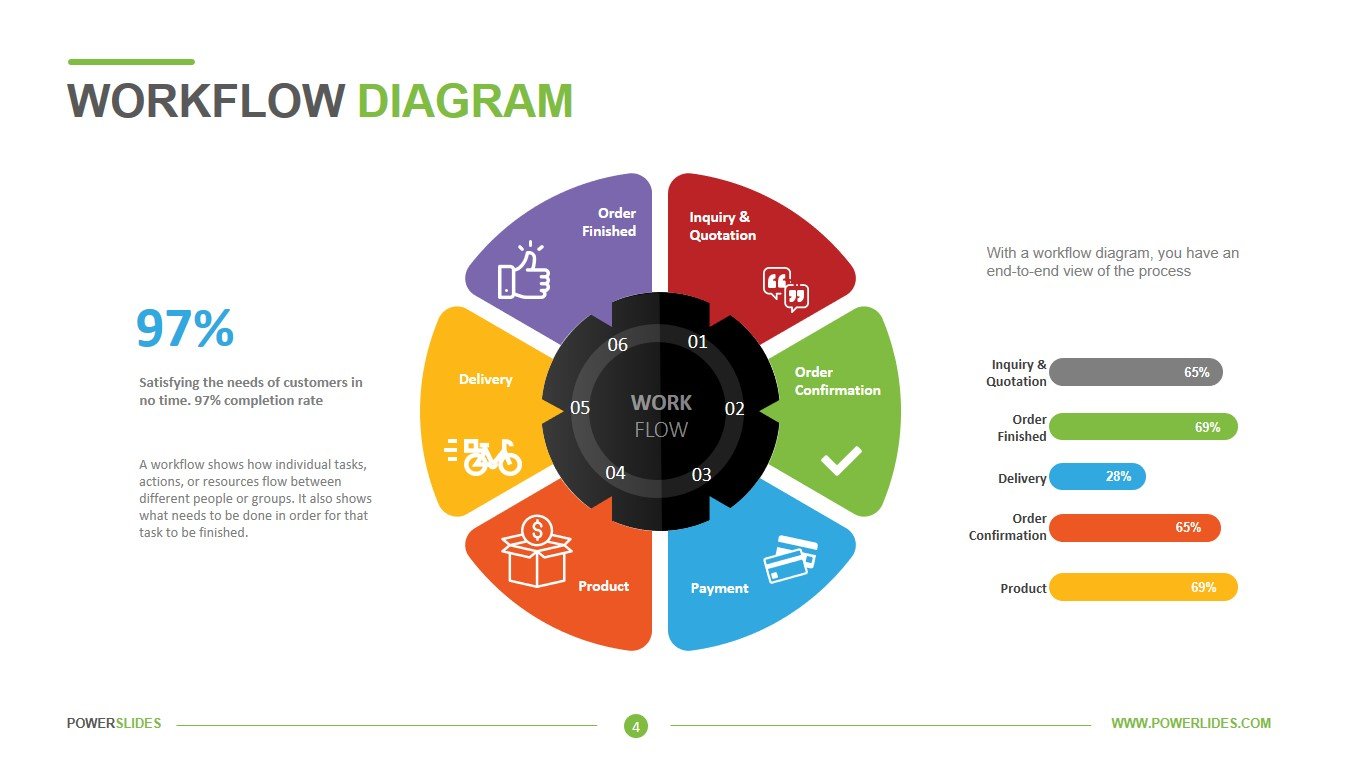
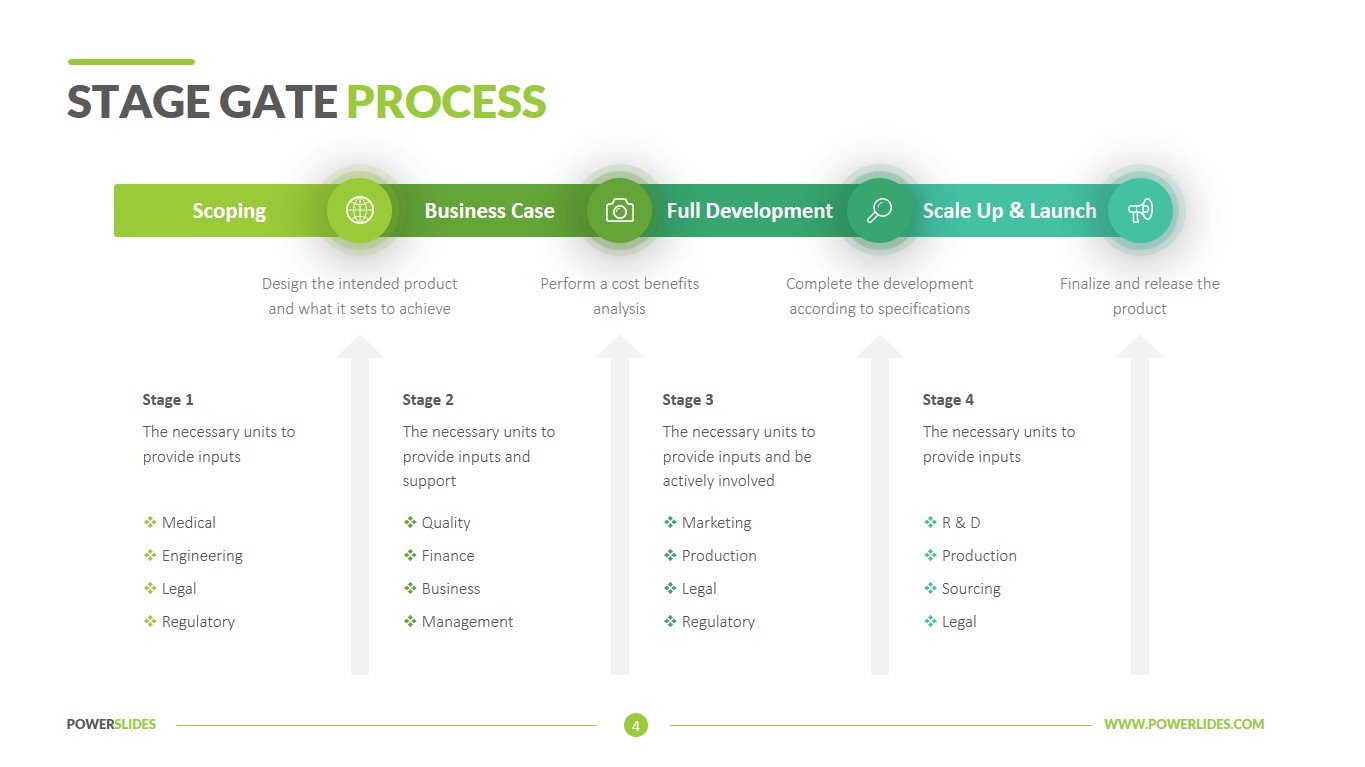
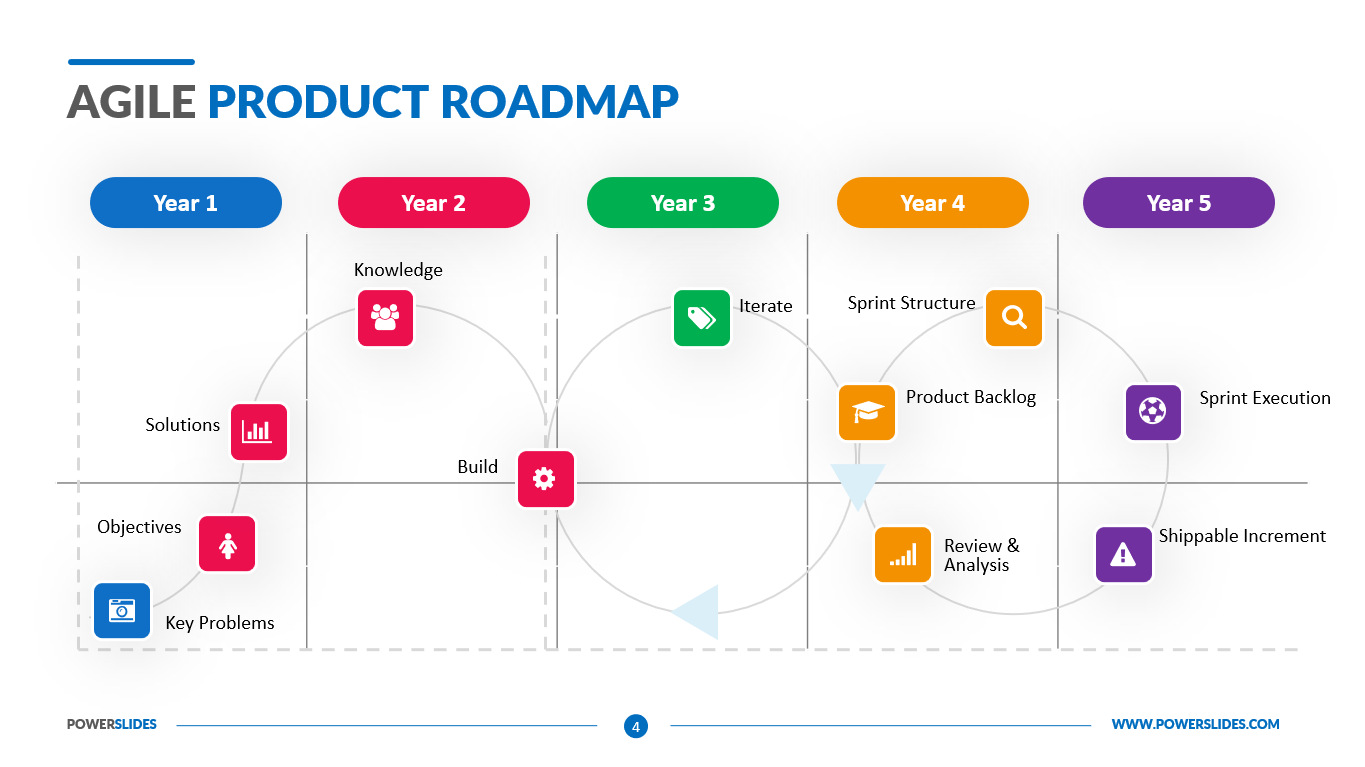
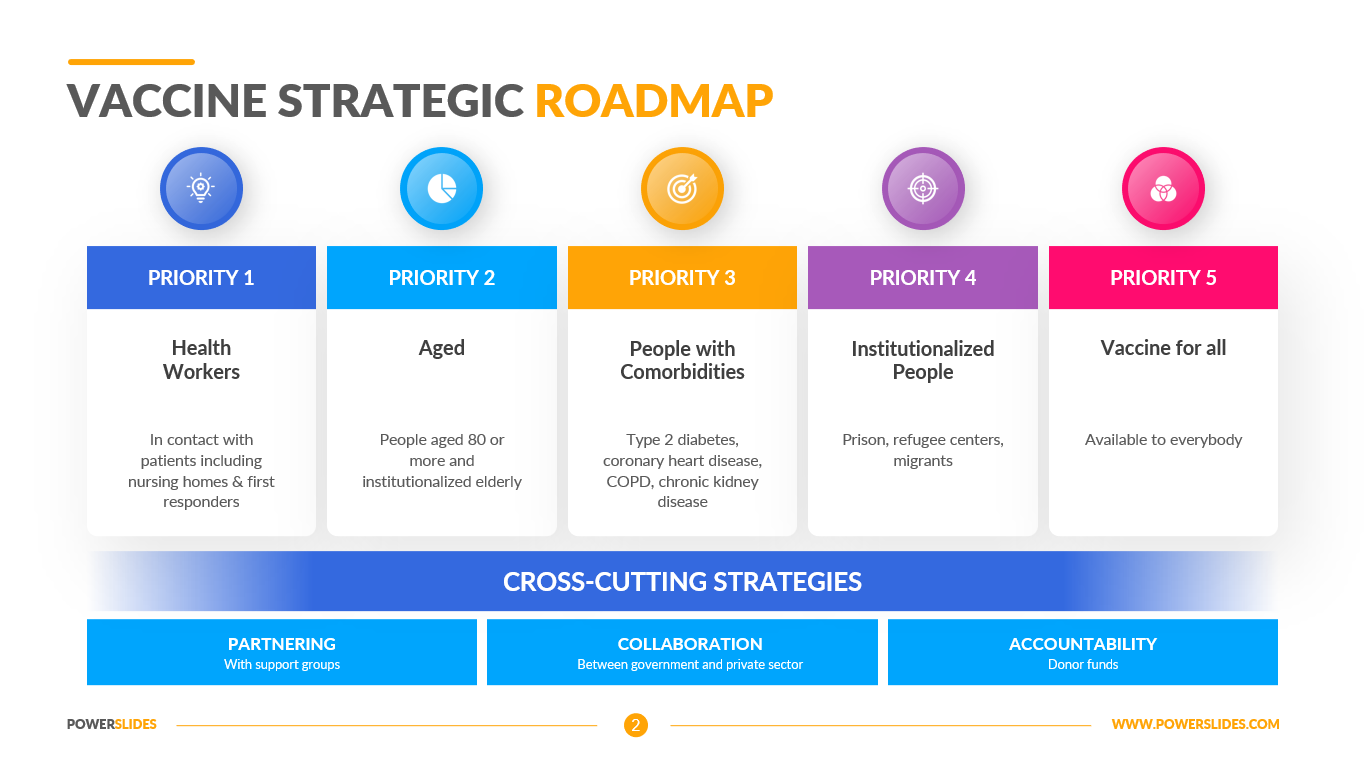
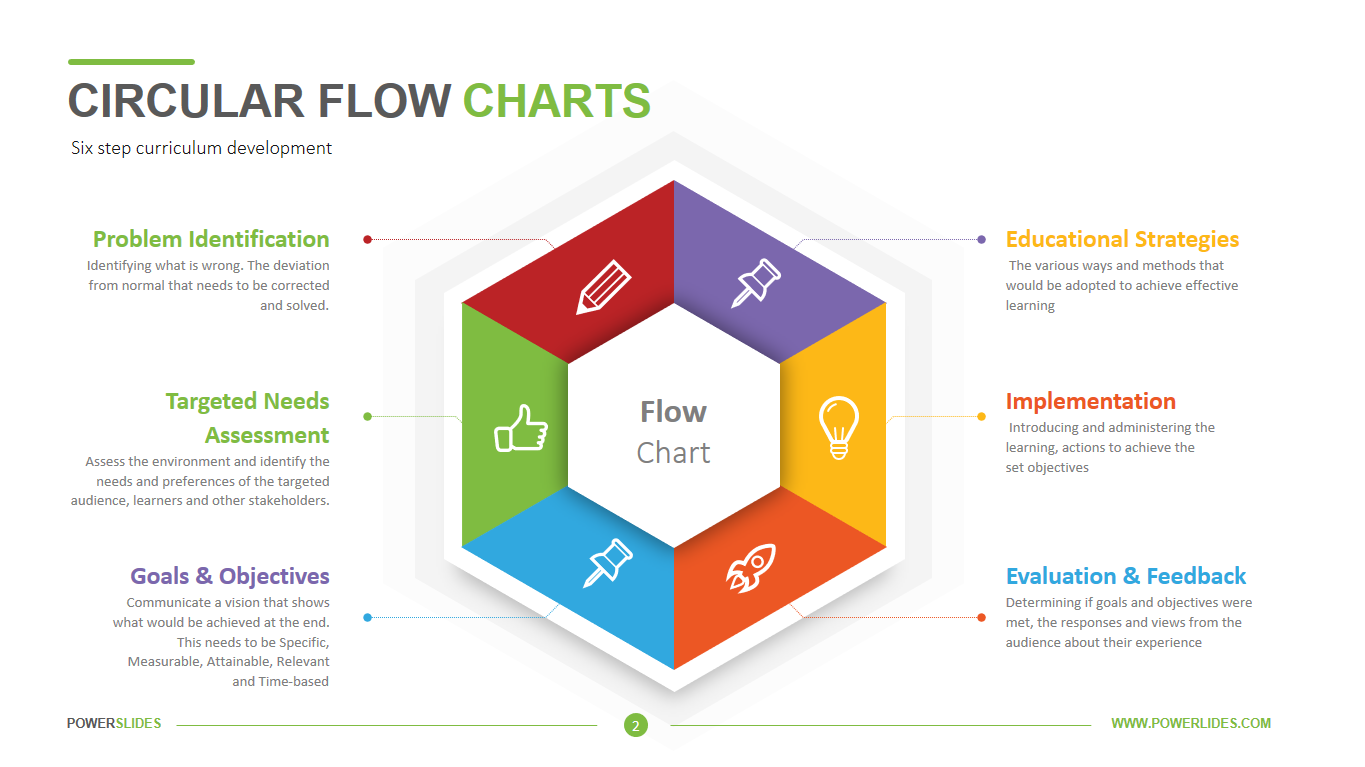
Visually, you can use this circular shape to show interconnectivity, sequencing or four individual concepts. This is an effective slide that can easily be used in existing presentations to convey organizational information. Each category can be edited to meet your business needs. Your audience will be able to view. You can independently change the color, size and arrangement of blocks according to your corporate requirements. The Circular Flow Charts template will be a great addition to your collection of professional business presentations.


