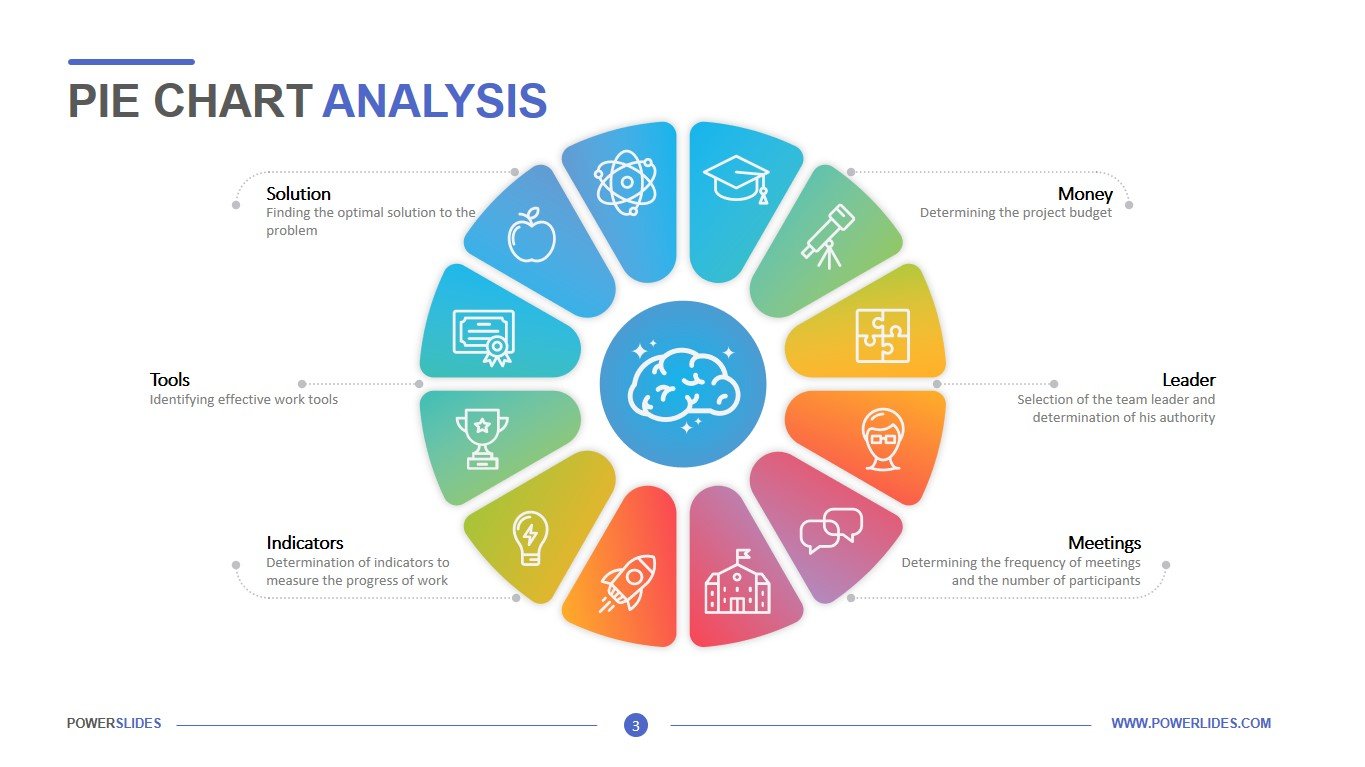
Spider Web Diagram
What do you think of this template?
 (5.00/ 5)
10 ratings

 4 Slides
 File size: 16:9
 Fonts: Lato, Calibri
 Supported version
PPT 2010, PPT 2013, PPT 2016
Supported version
PPT 2010, PPT 2013, PPT 2016

Product details
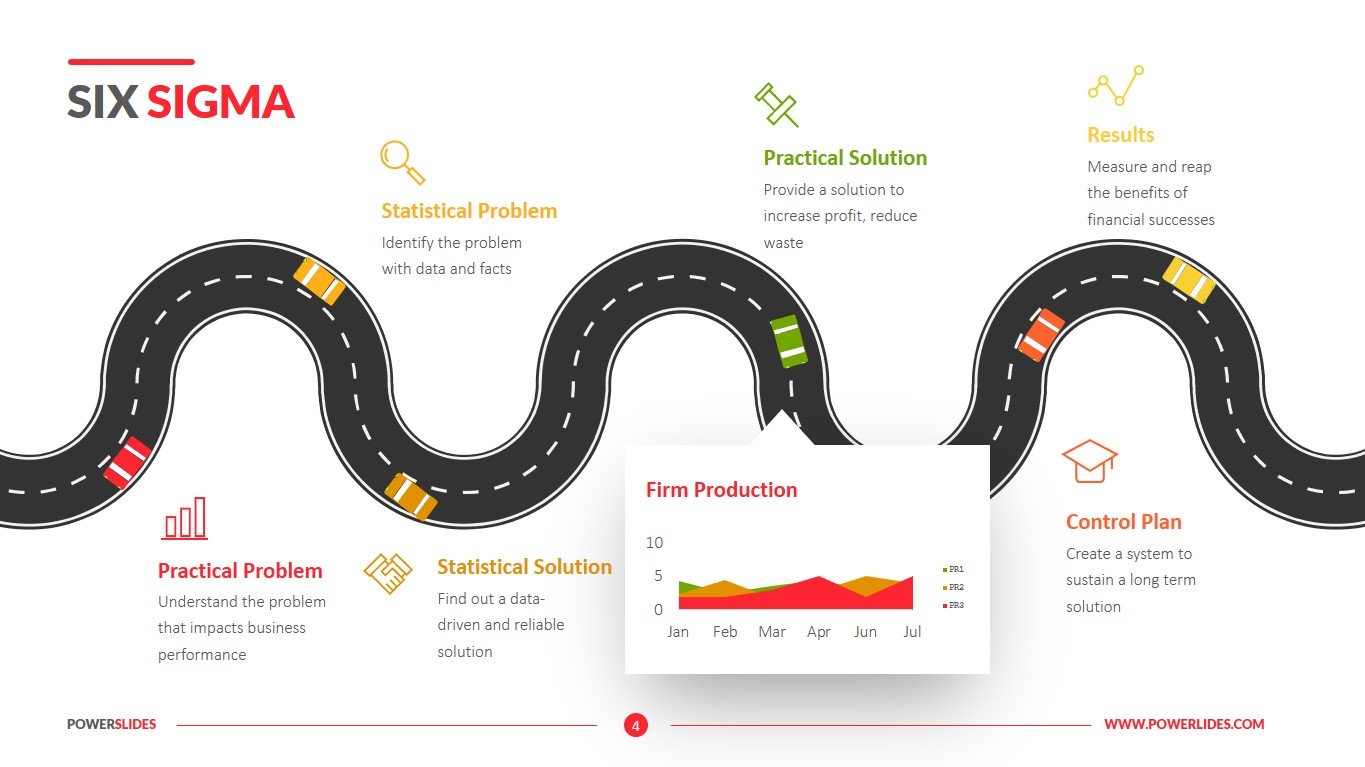
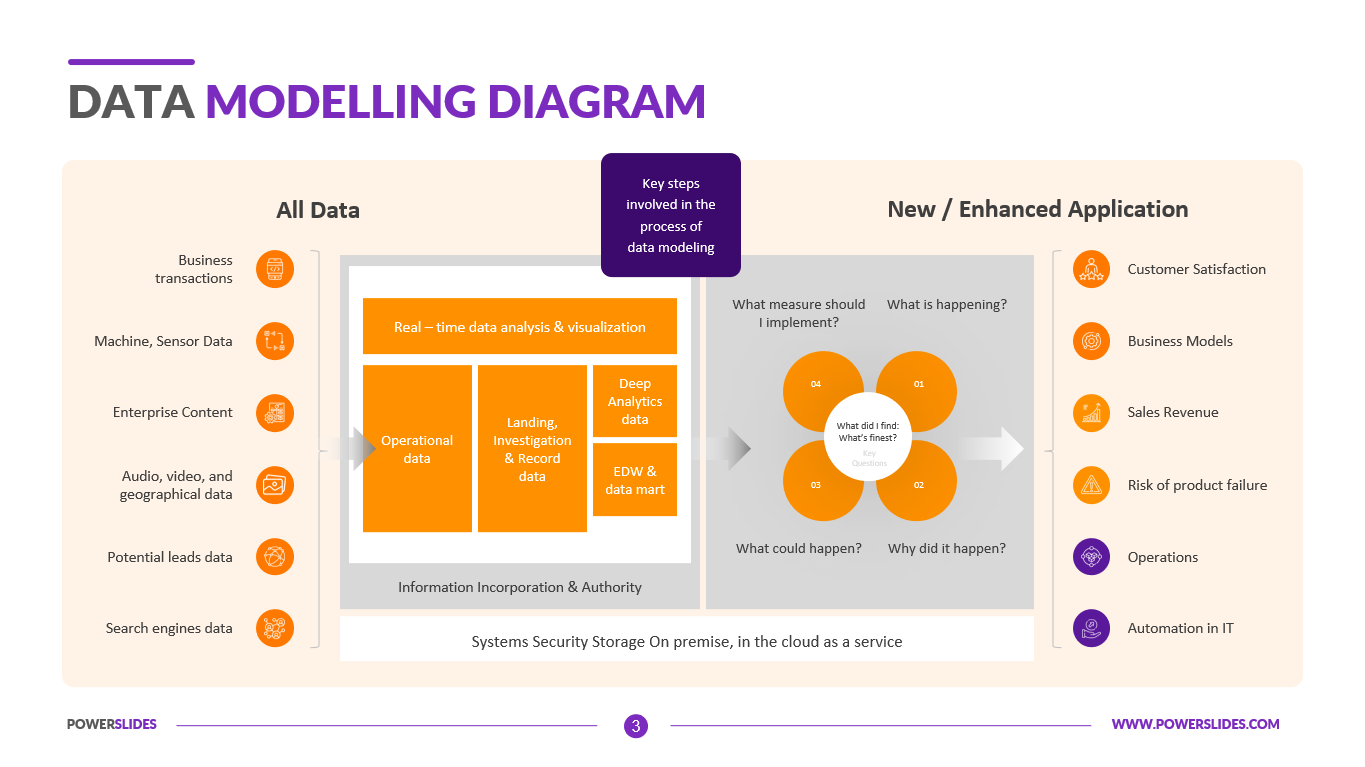
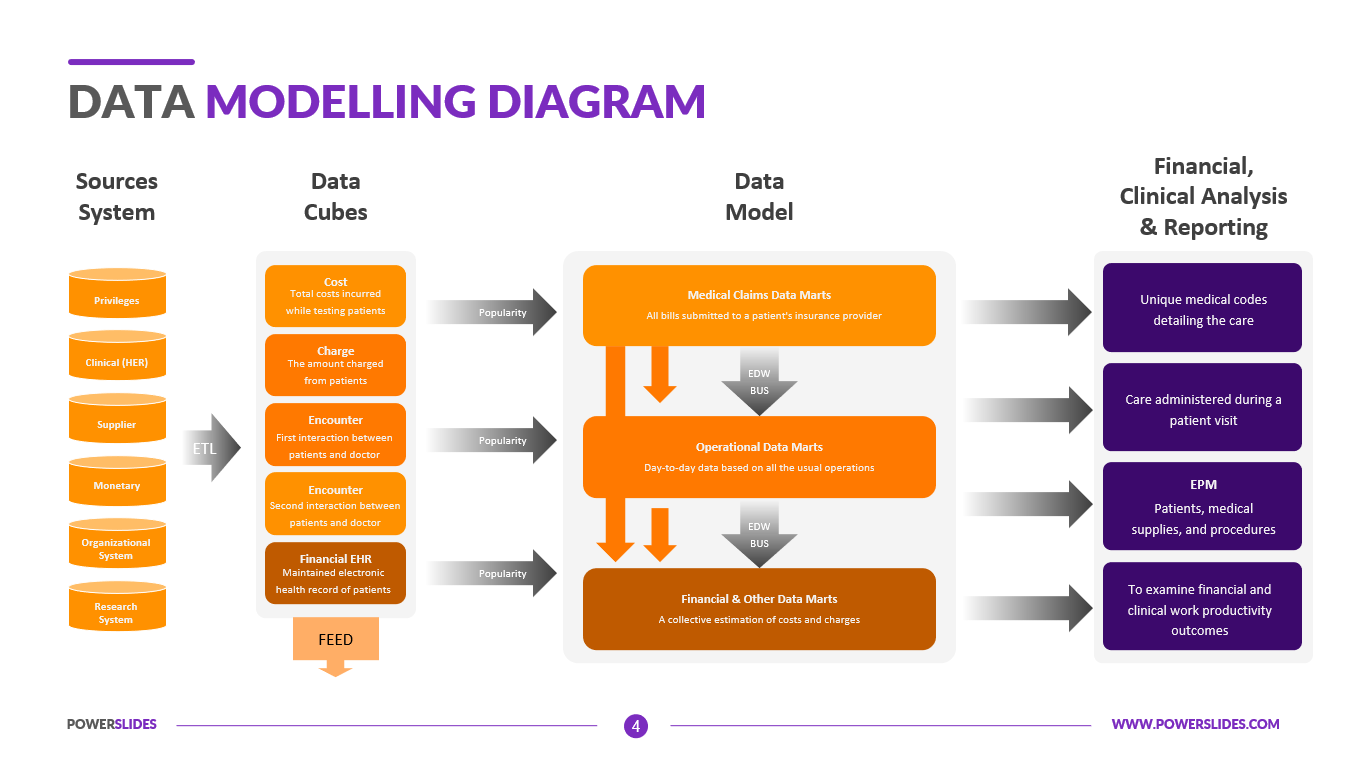
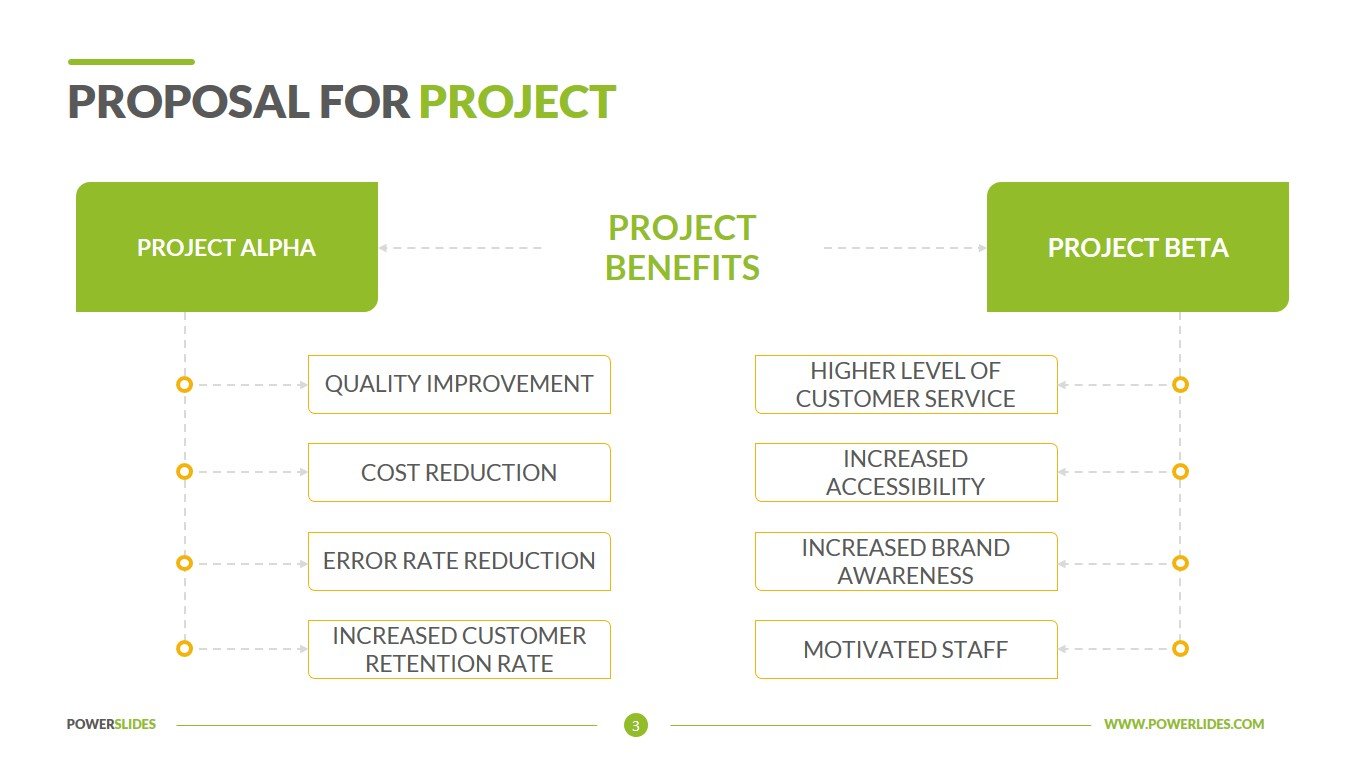
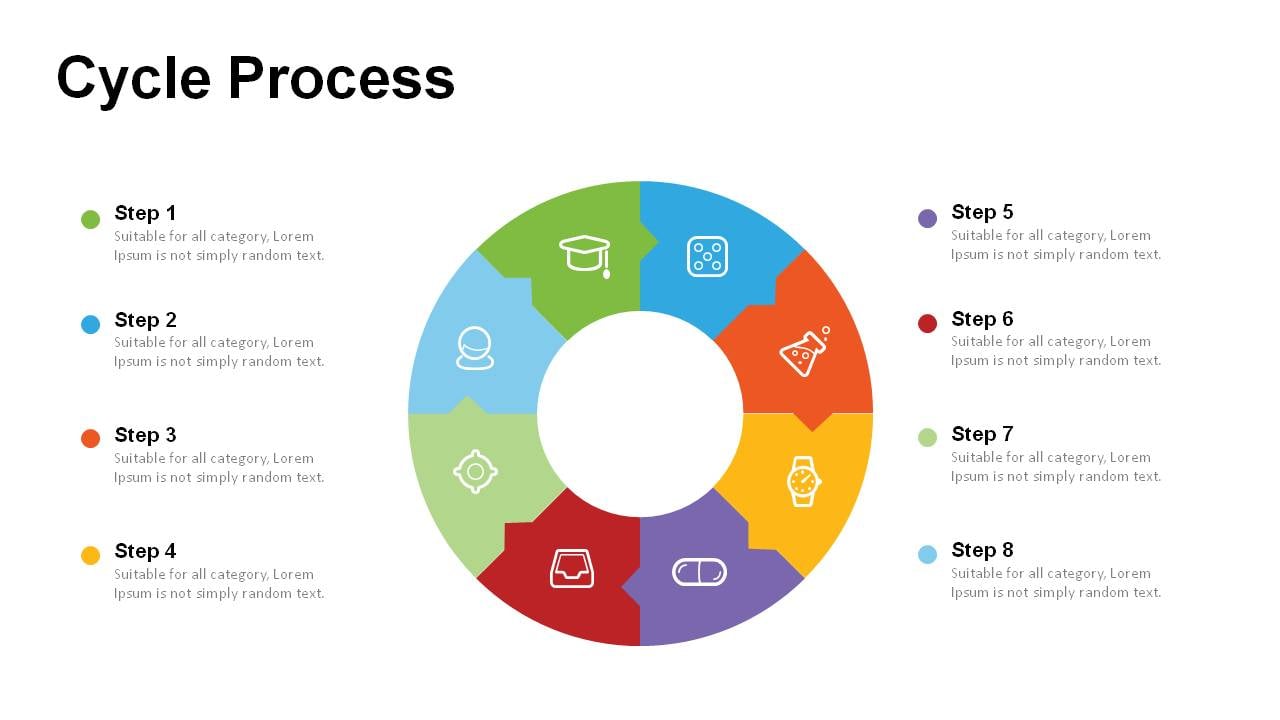
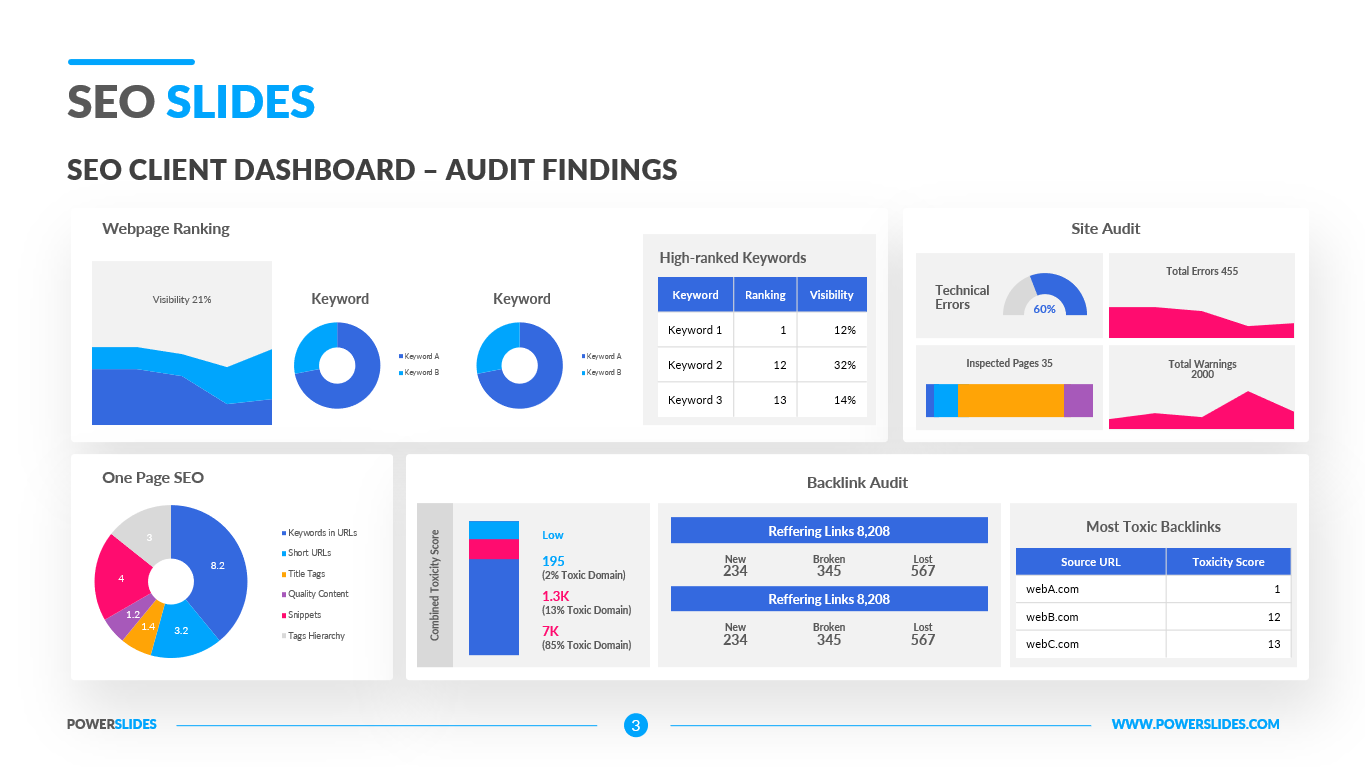
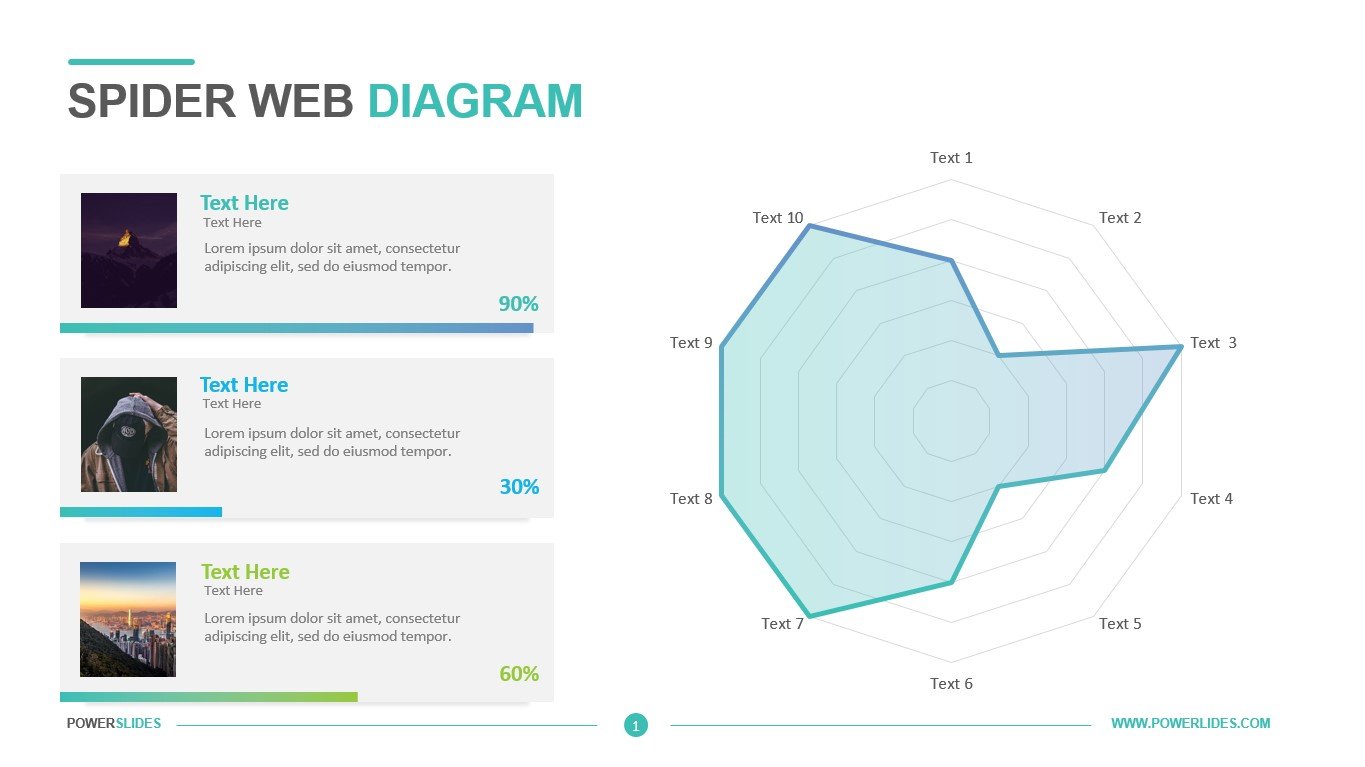
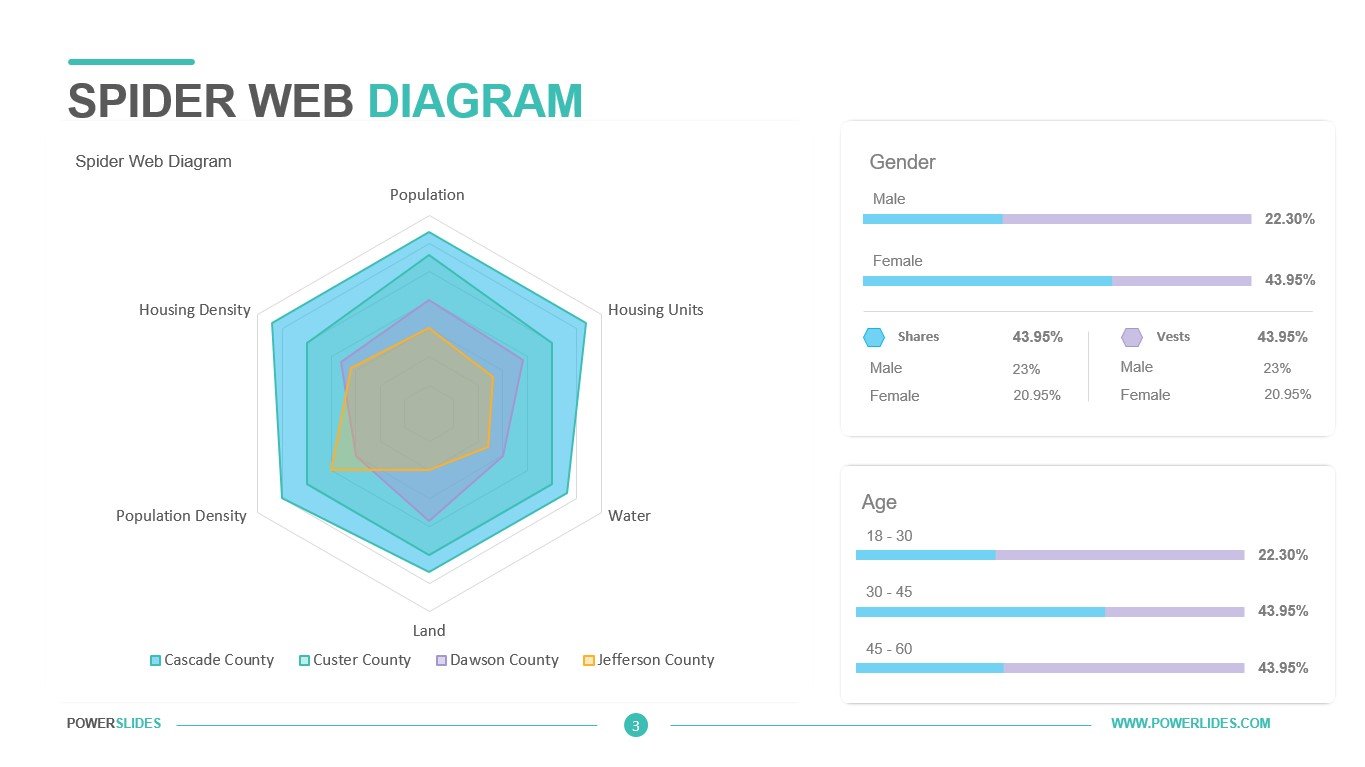
Spider Web, more commonly known as Radar Chart, comes handy when you need to represent your analysis in 2D graphics. It can have three or more multivariate data on the corners and an axis beginning from zero at the center of the web extended until the end of the web.
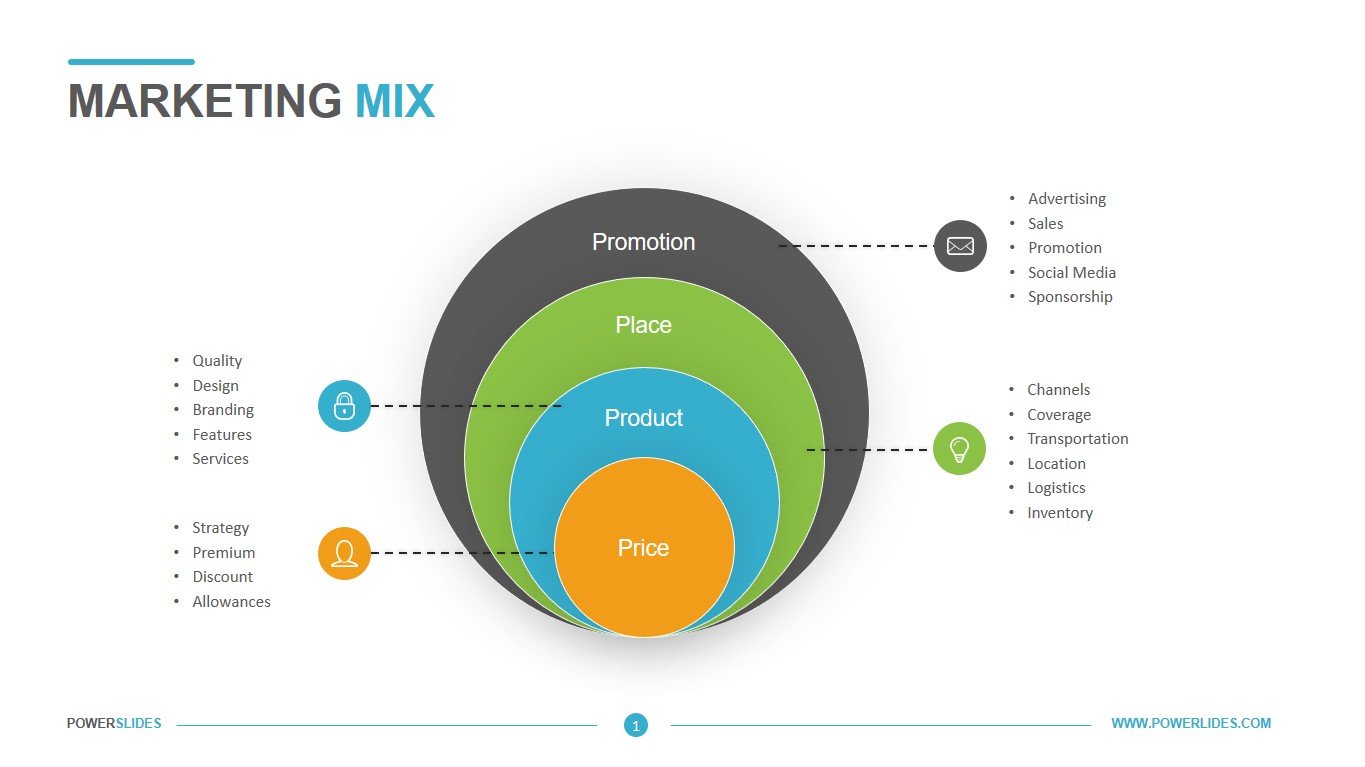
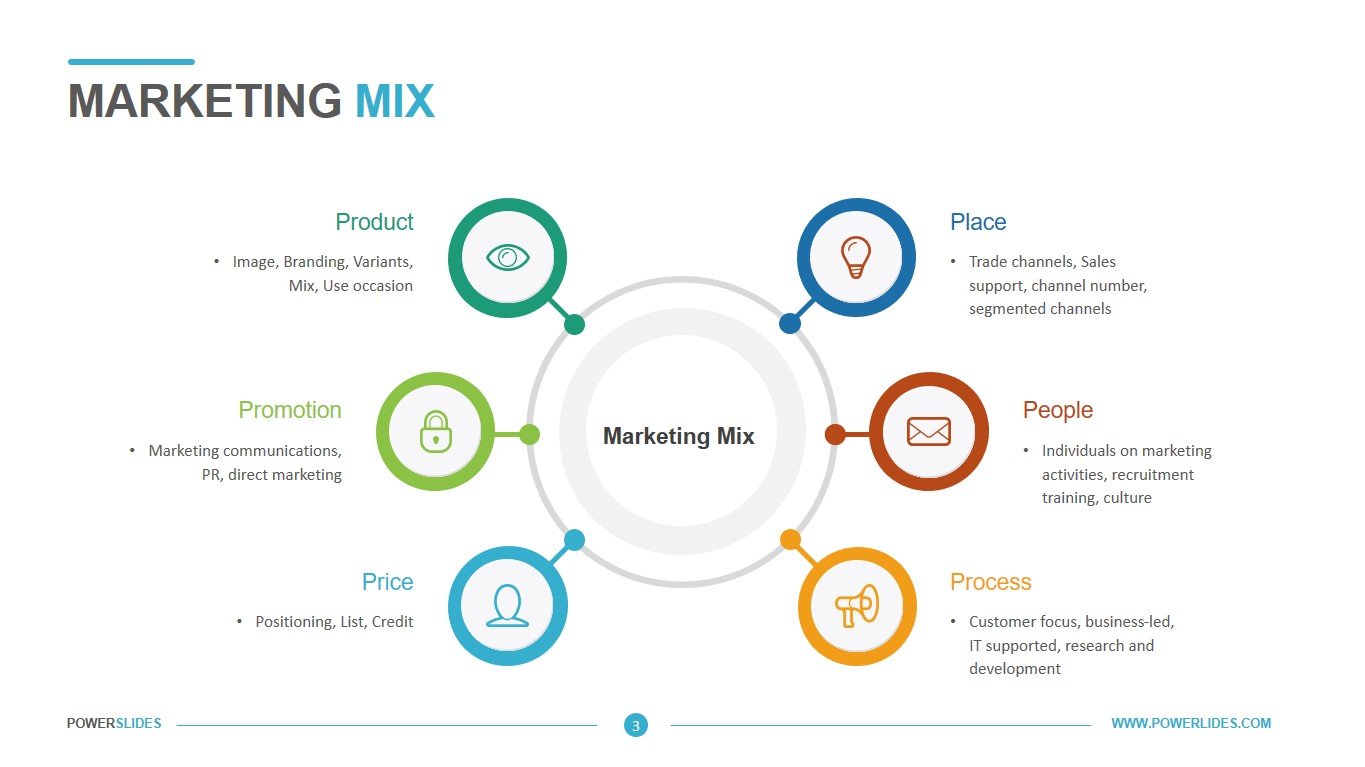
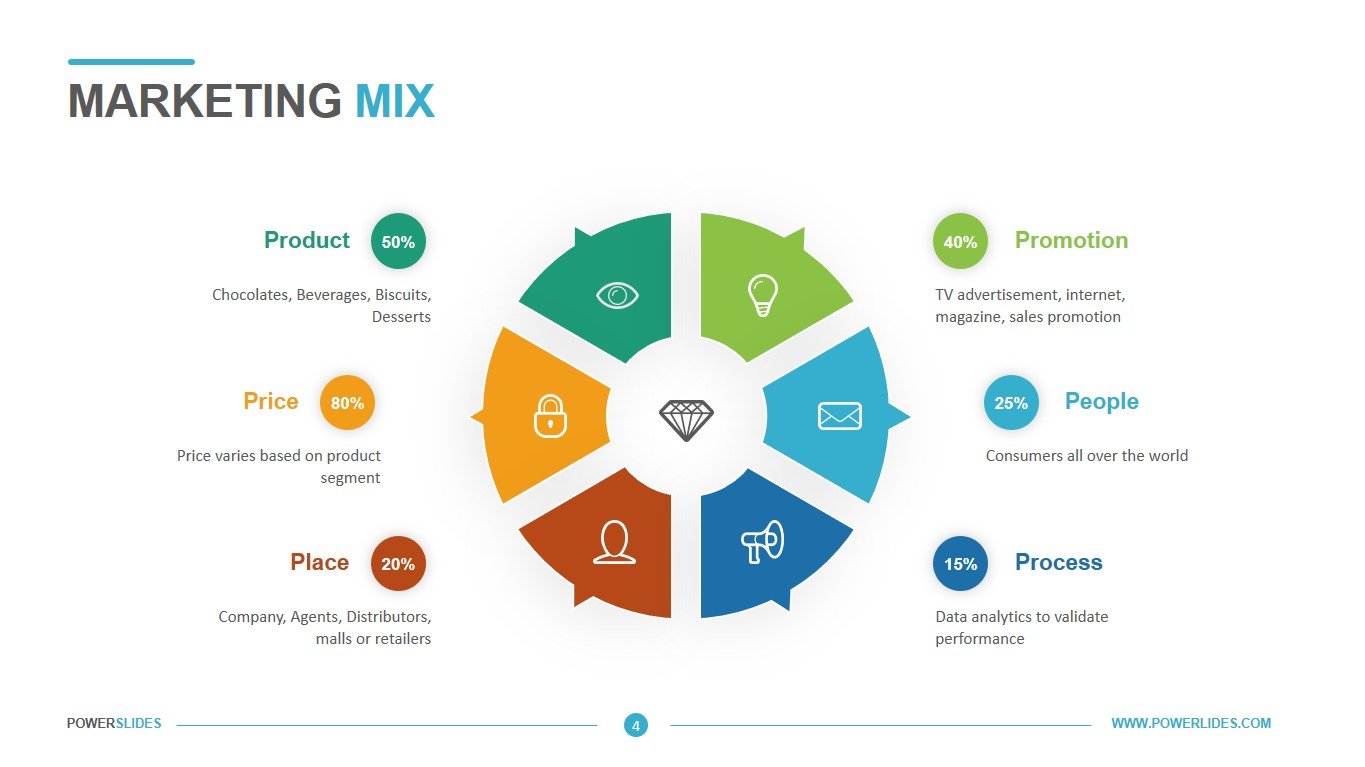
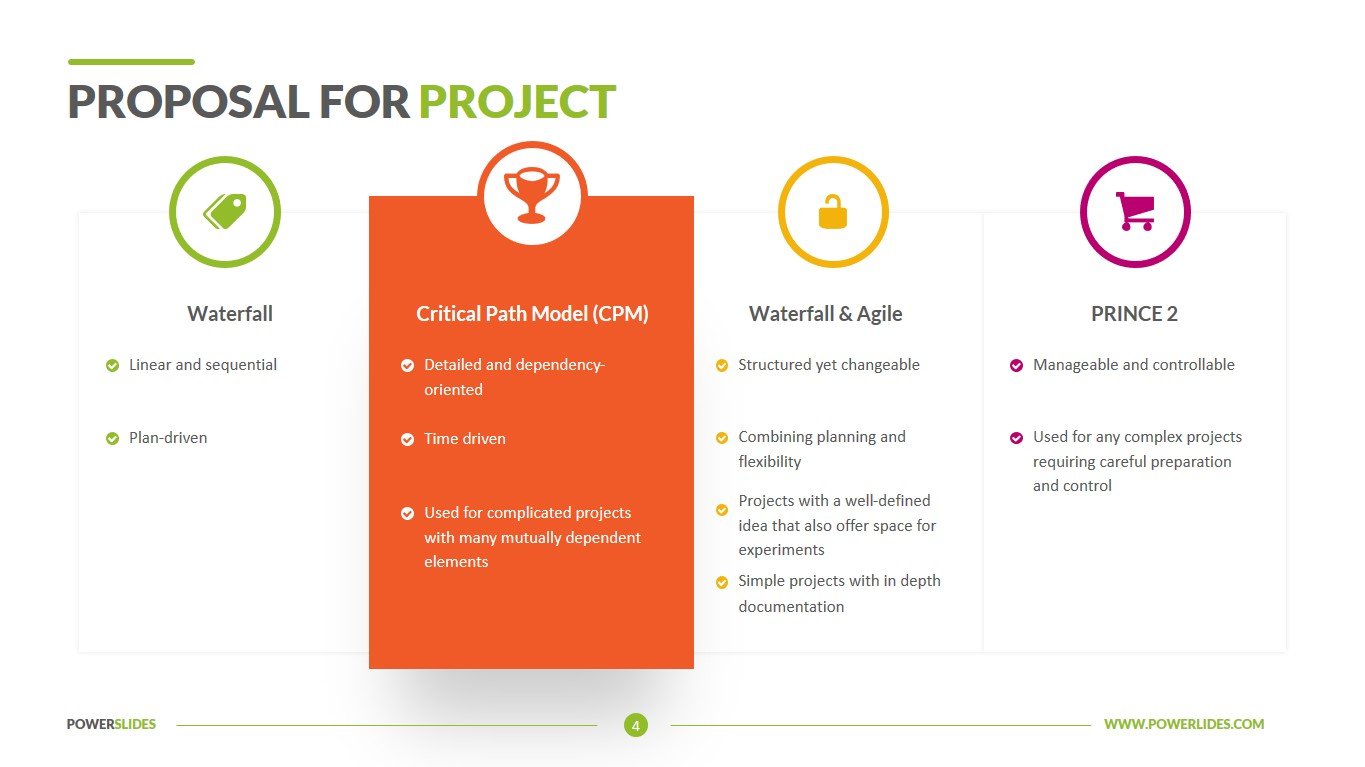
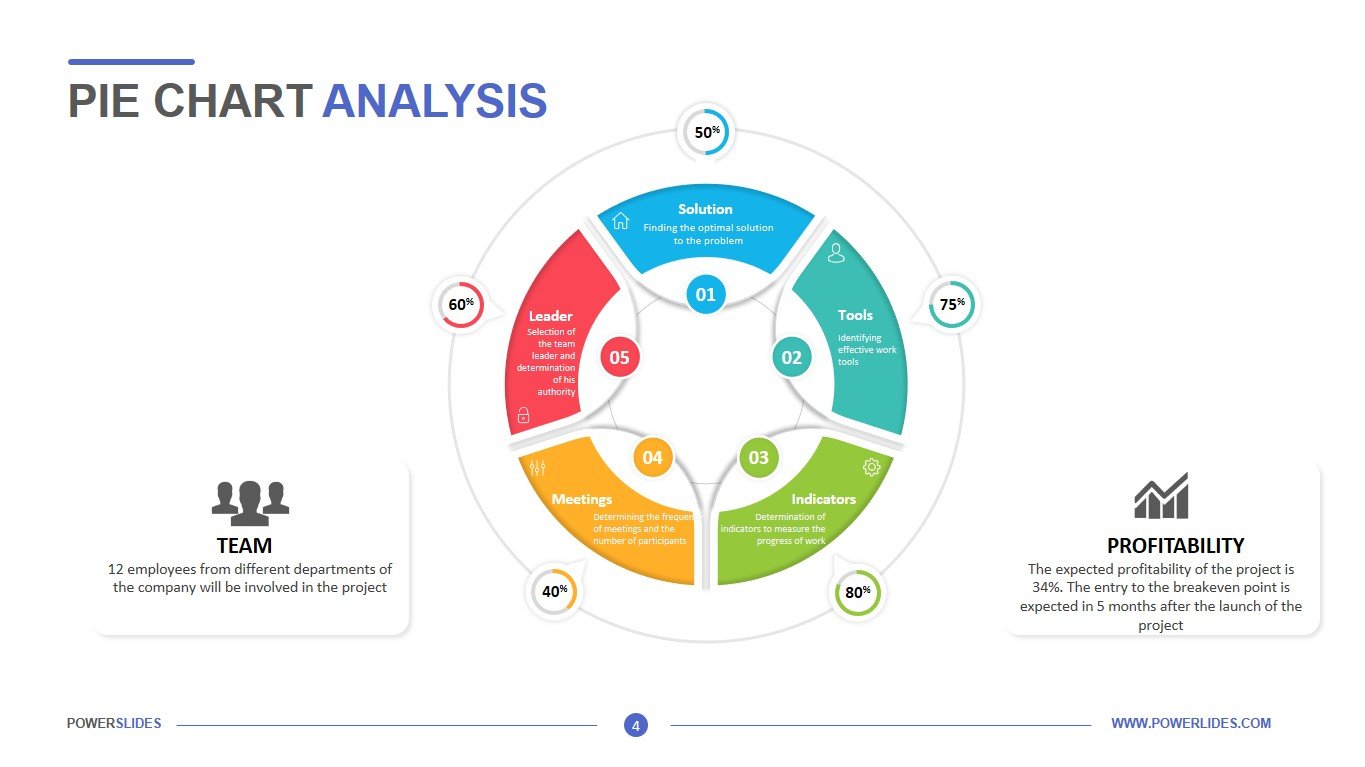
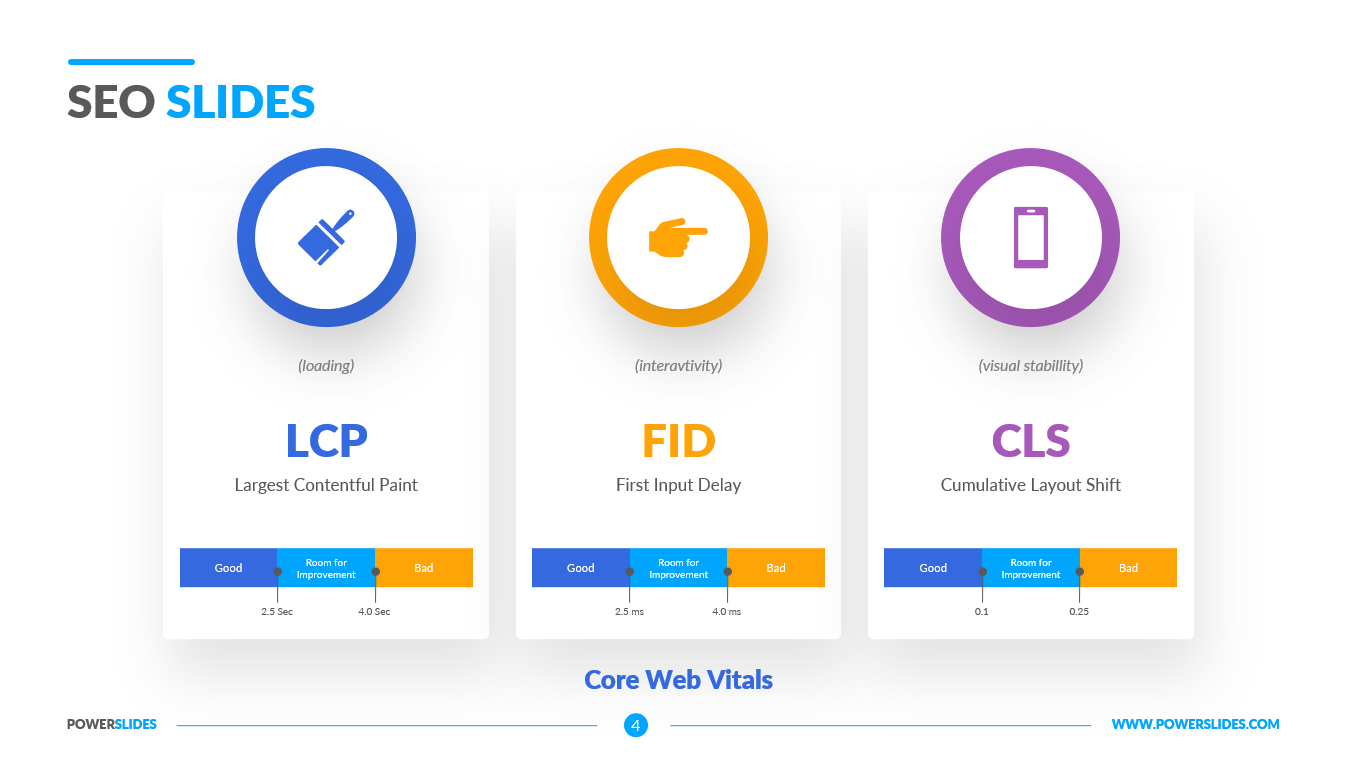
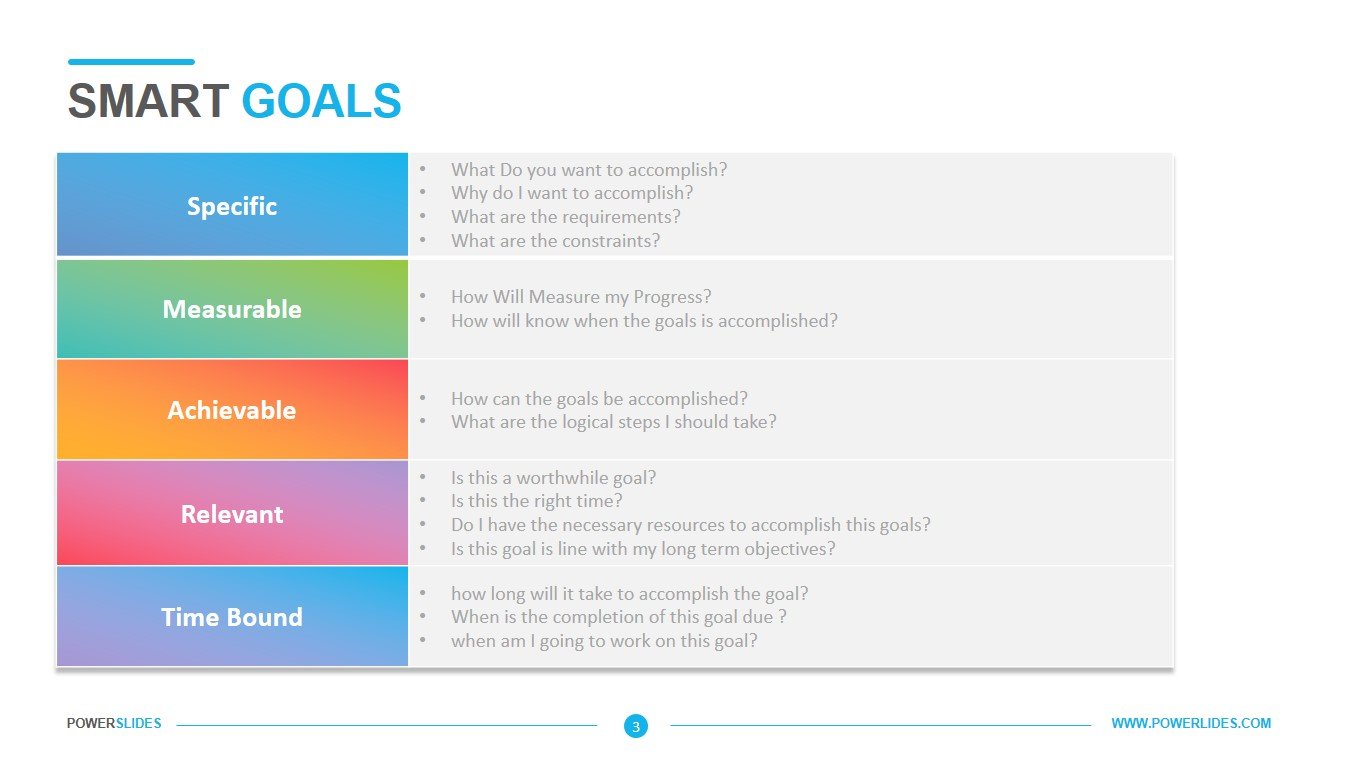
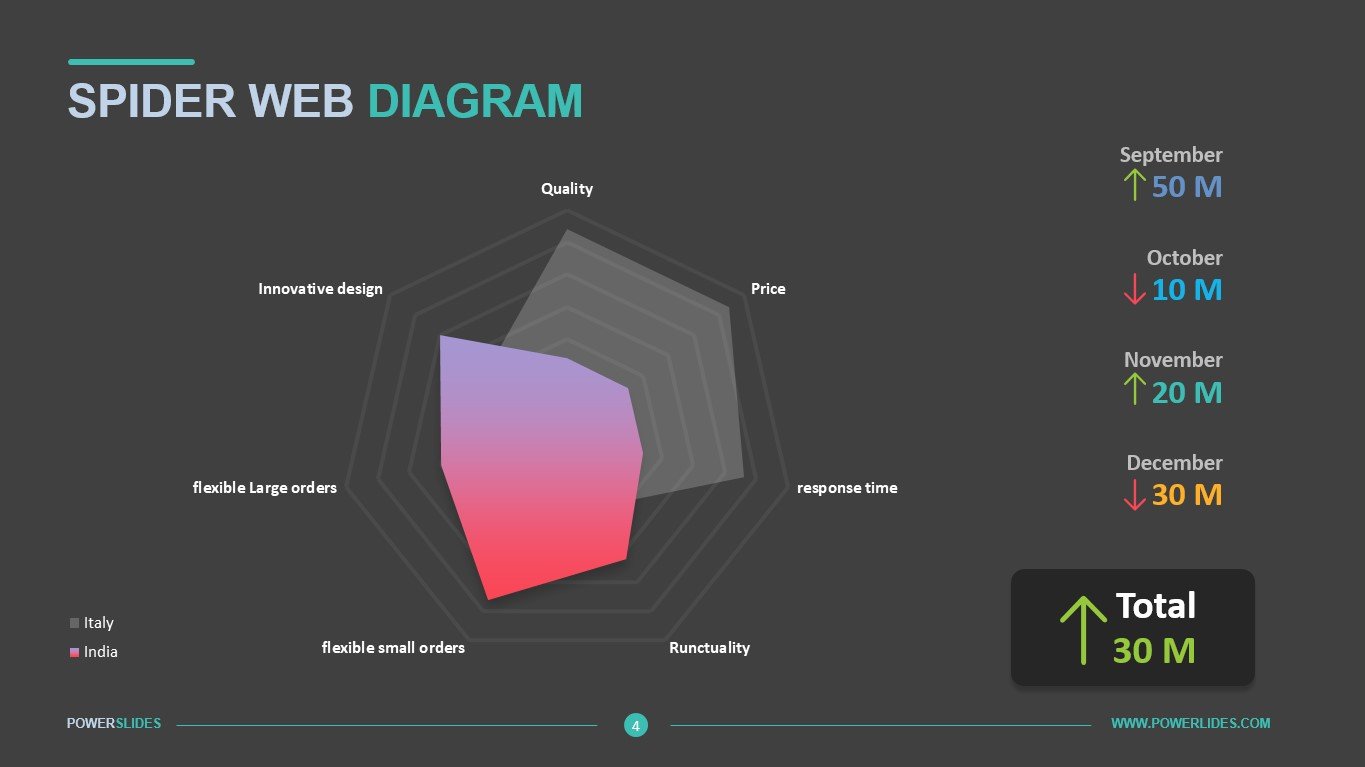
Awe the audience with our detail-focused spider web diagram. Our template comes with 4 different styles. Three of them are based on the beautiful flat color palette while the remaining one is dark themed.
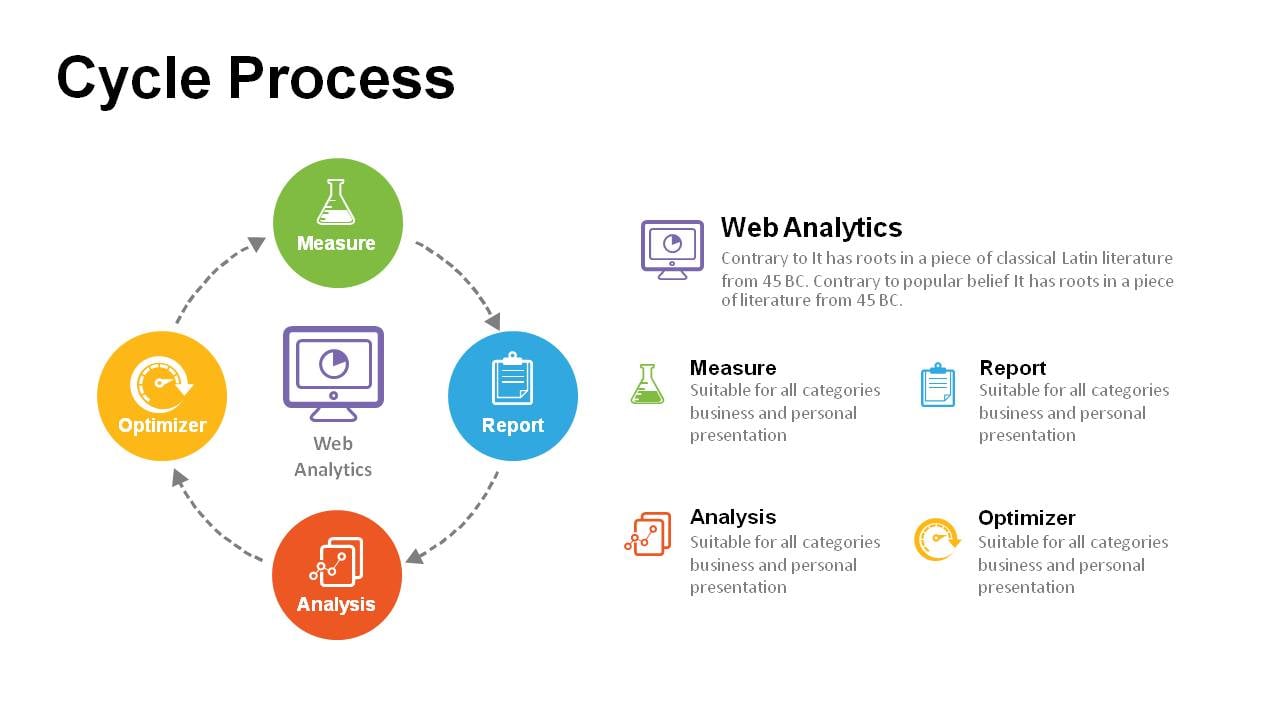
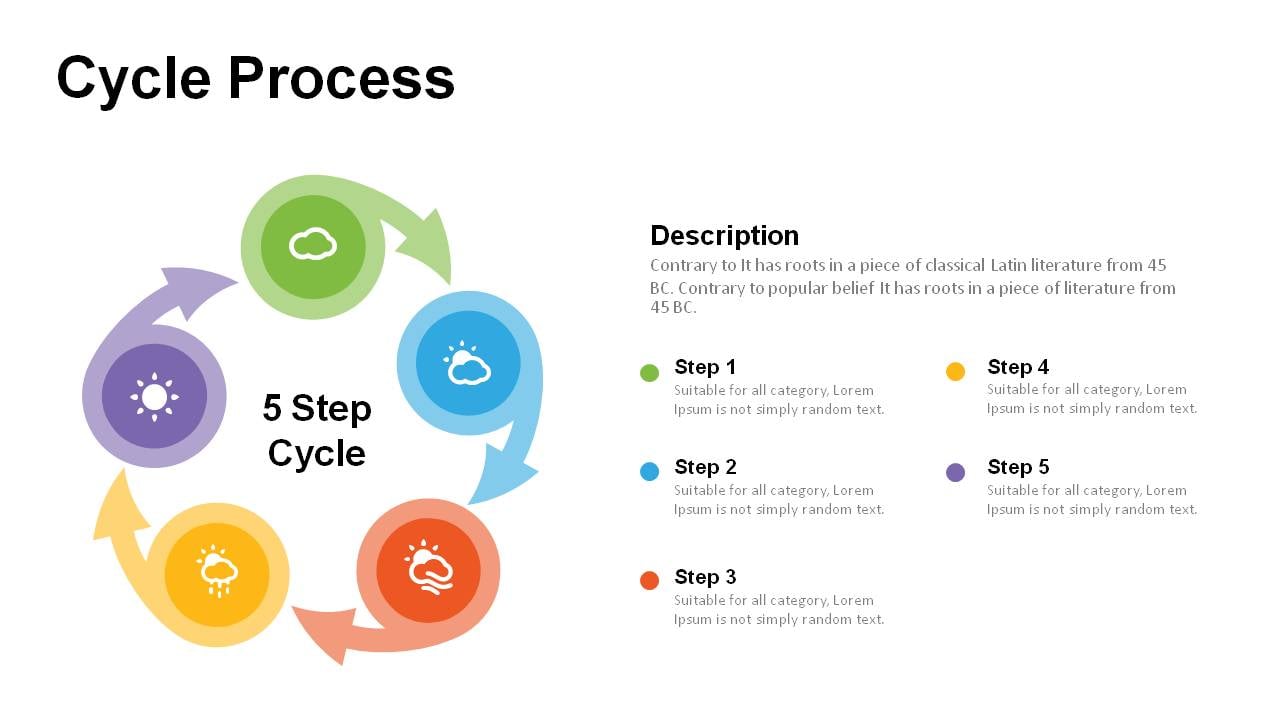
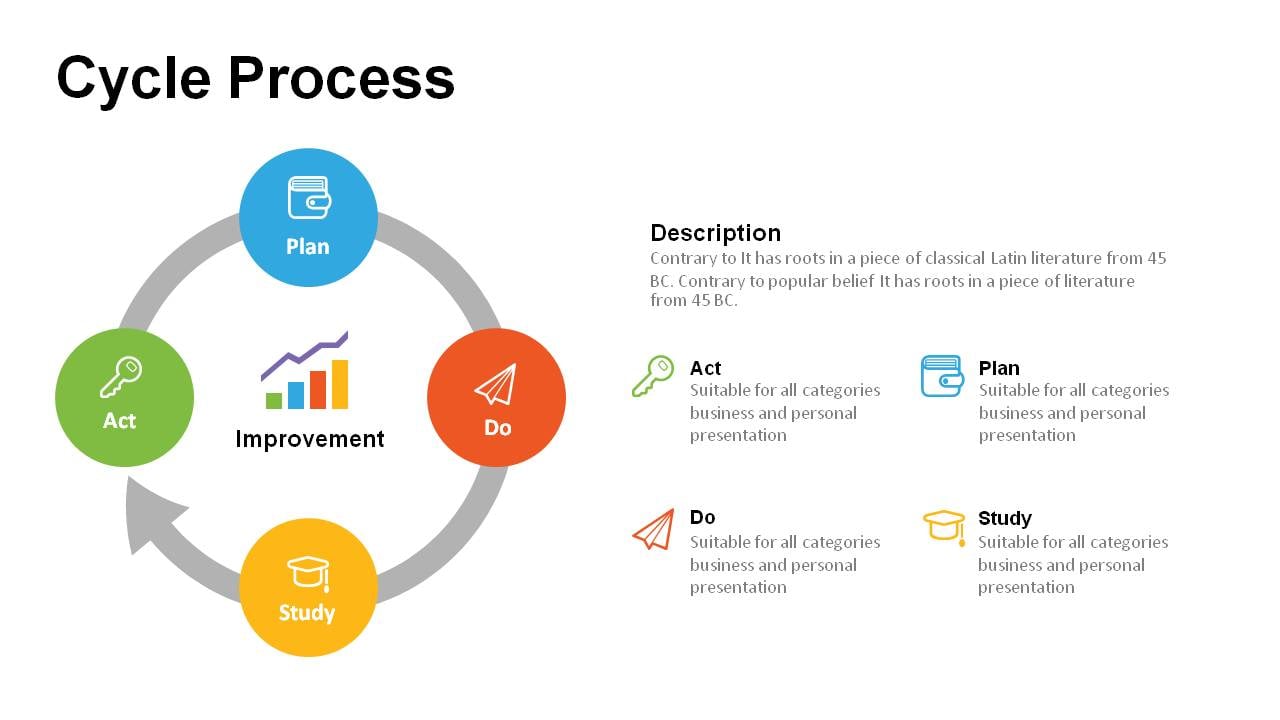
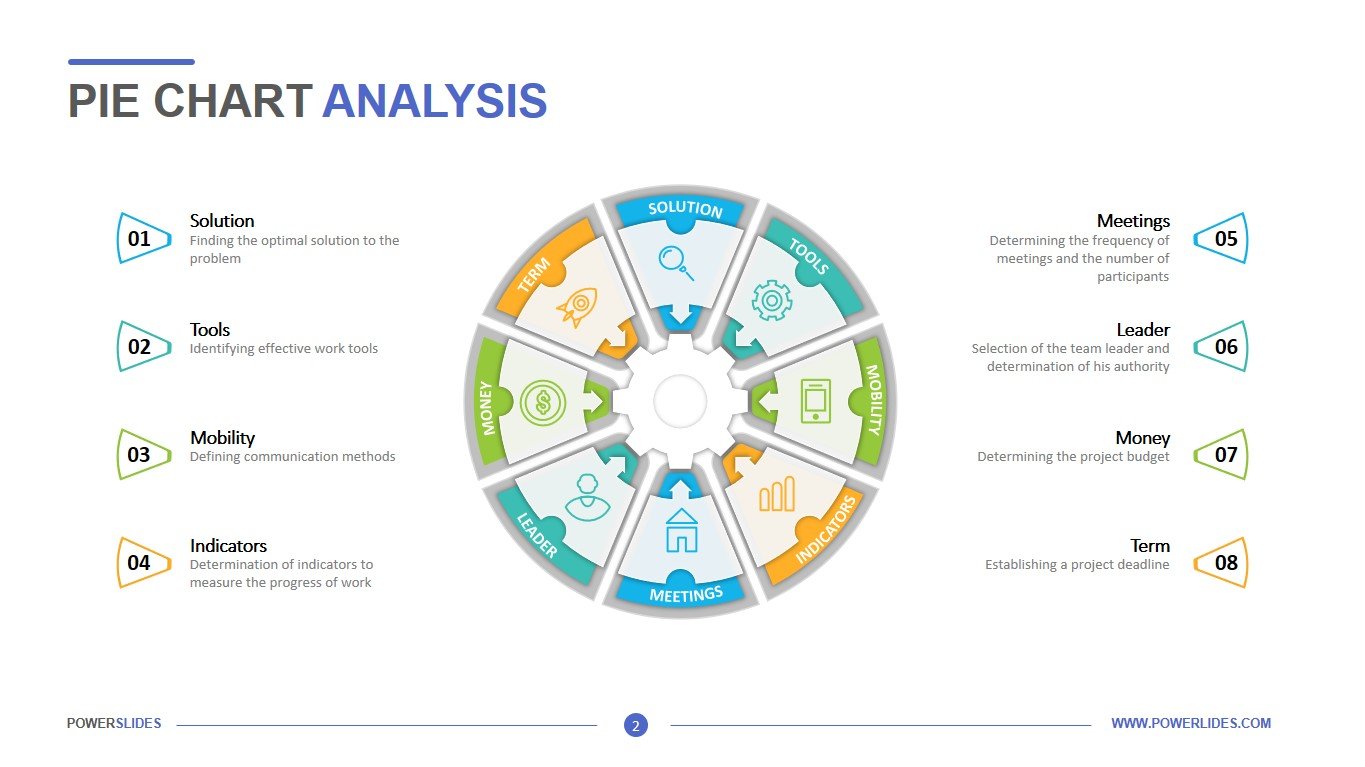
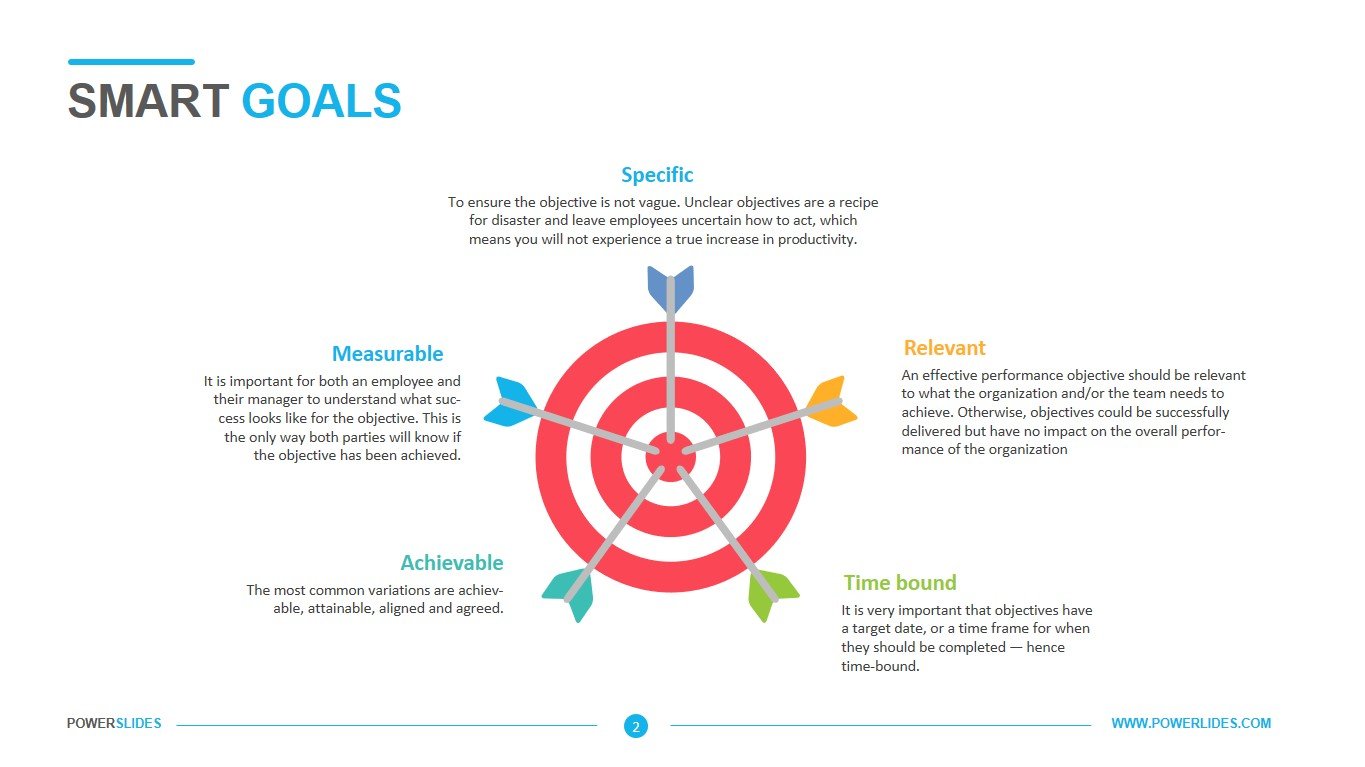
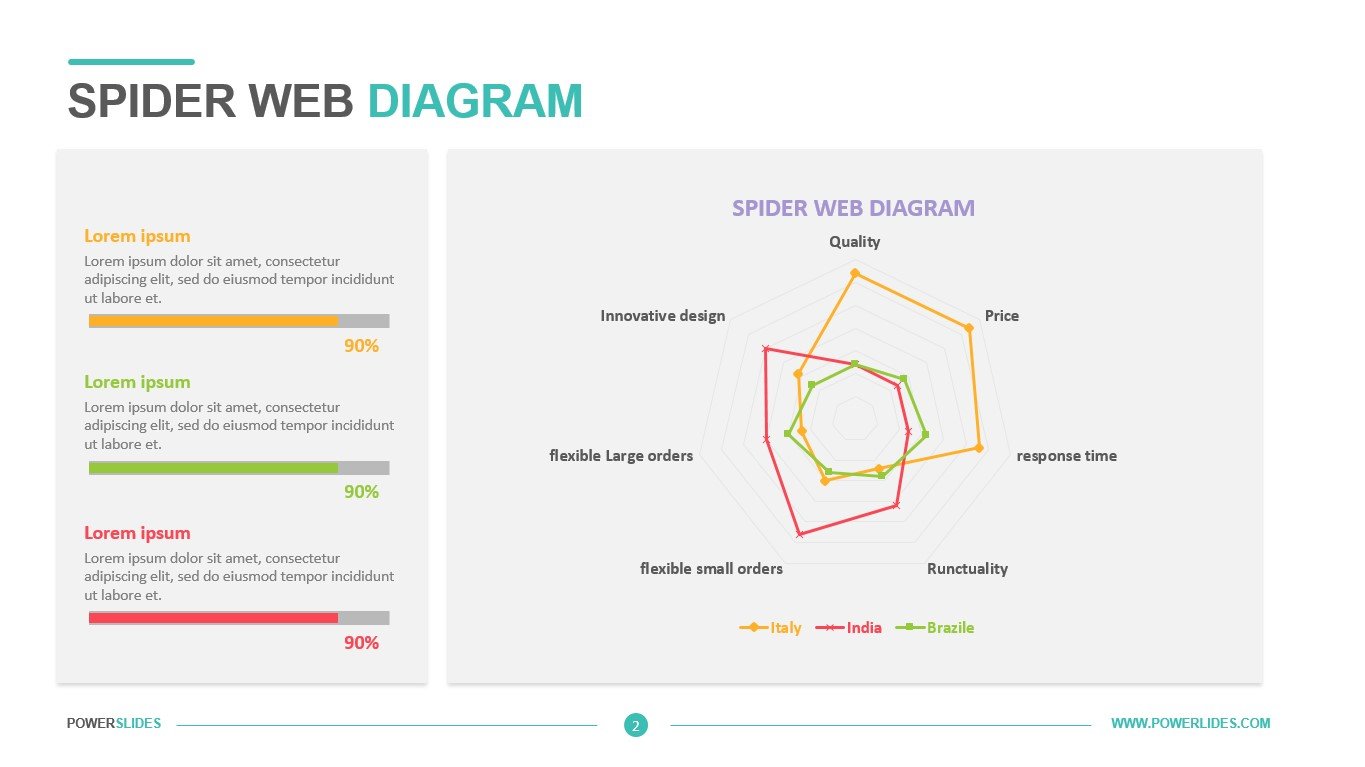
Our web diagram template provides users the ability to customize the chart without any need for editing the shape of the chart. You can use the diagram to present quality development, departments of an organization or product comparisons. The visual representation of the chart represents the occurrence of cyclic events. For example, if you’re demonstrating sales by month then the chart will be divided into twelve regions and each point on the diagram will represent the count of sales.
Each design comes with text boxes for you to add details about what each corner in the web represents or you can even summarize your findings. 100% customizable and compatible with PowerPoint. Combine any of our other templates to create audience appealing presentations.


