Visual Decision Tree
What do you think of this template?

 (4.25/ 5)
17 ratings

 4 Slides
 File size: 16:9
 Fonts: Lato, Calibri
 Supported version
PPT 2010, PPT 2013, PPT 2016
Supported version
PPT 2010, PPT 2013, PPT 2016

Product details
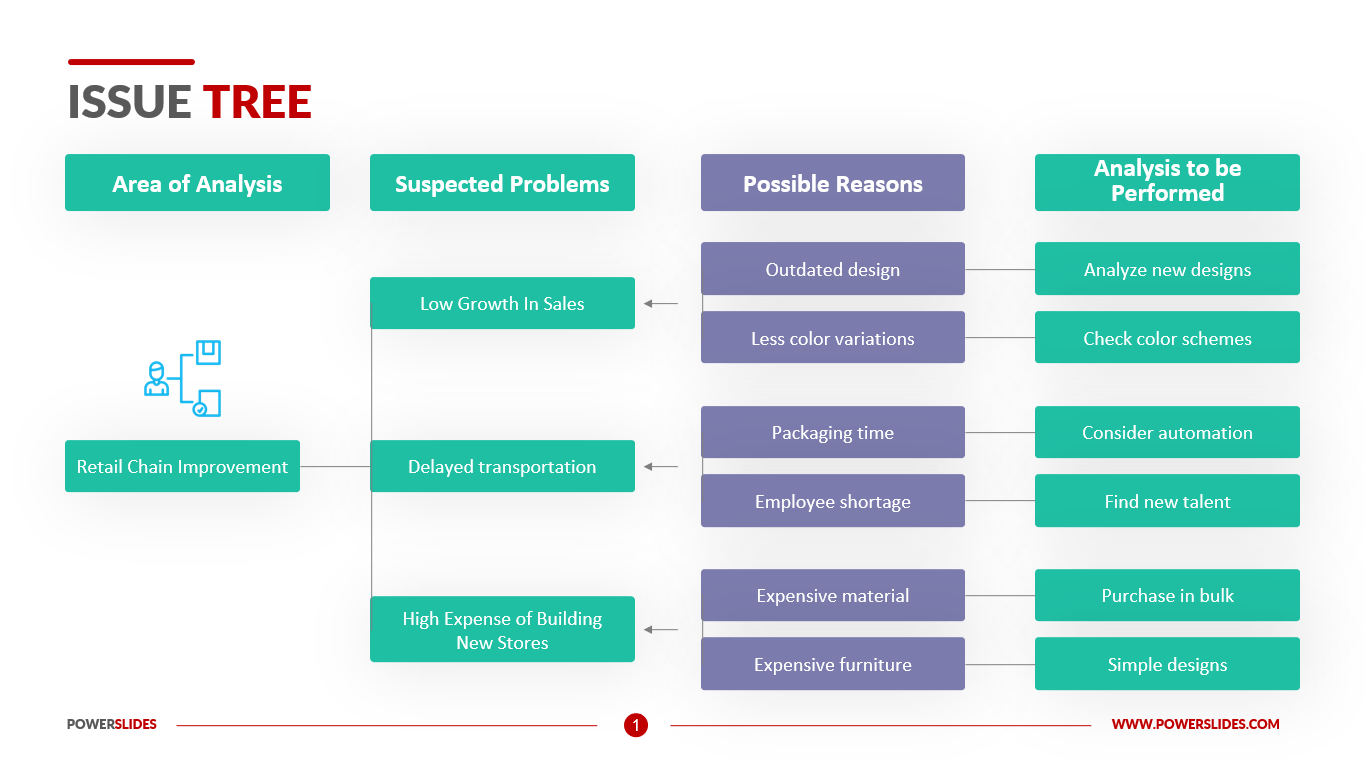
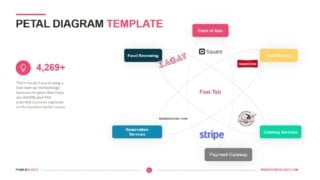
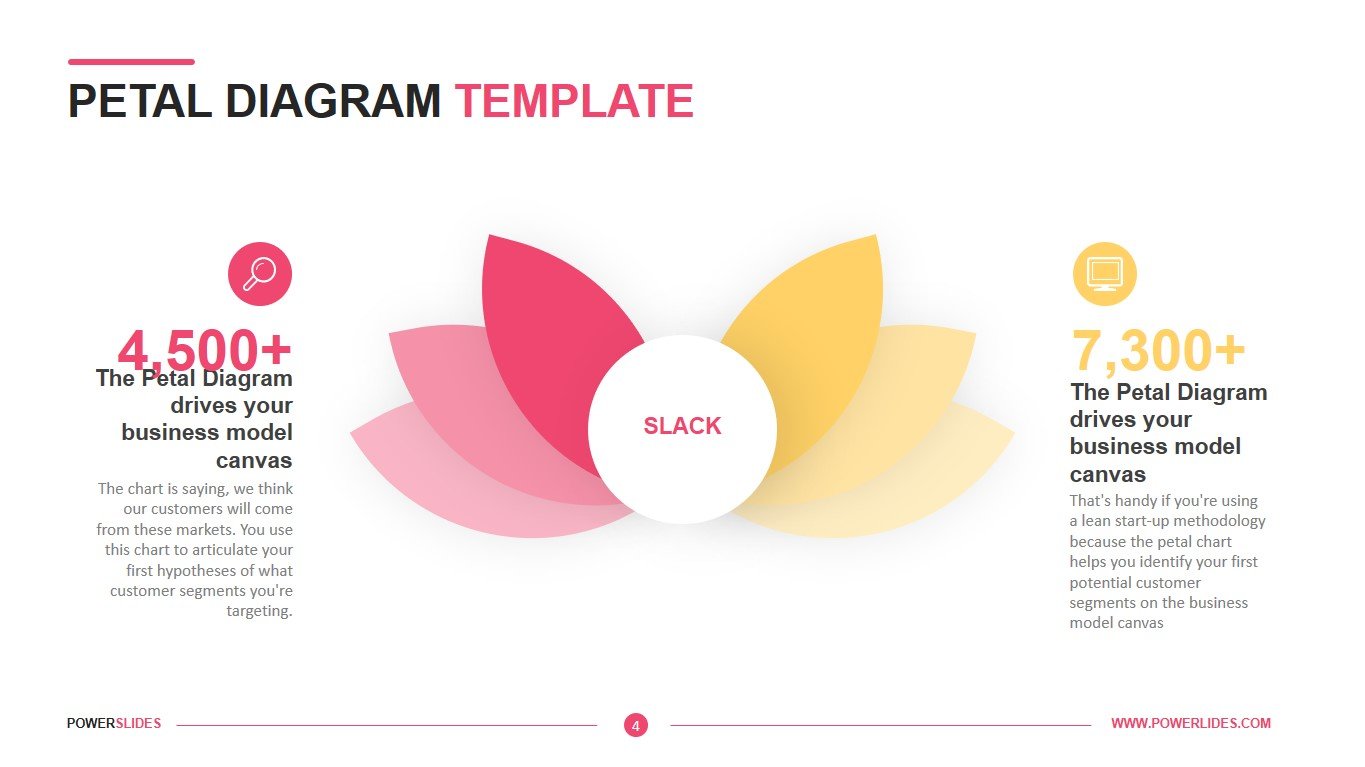
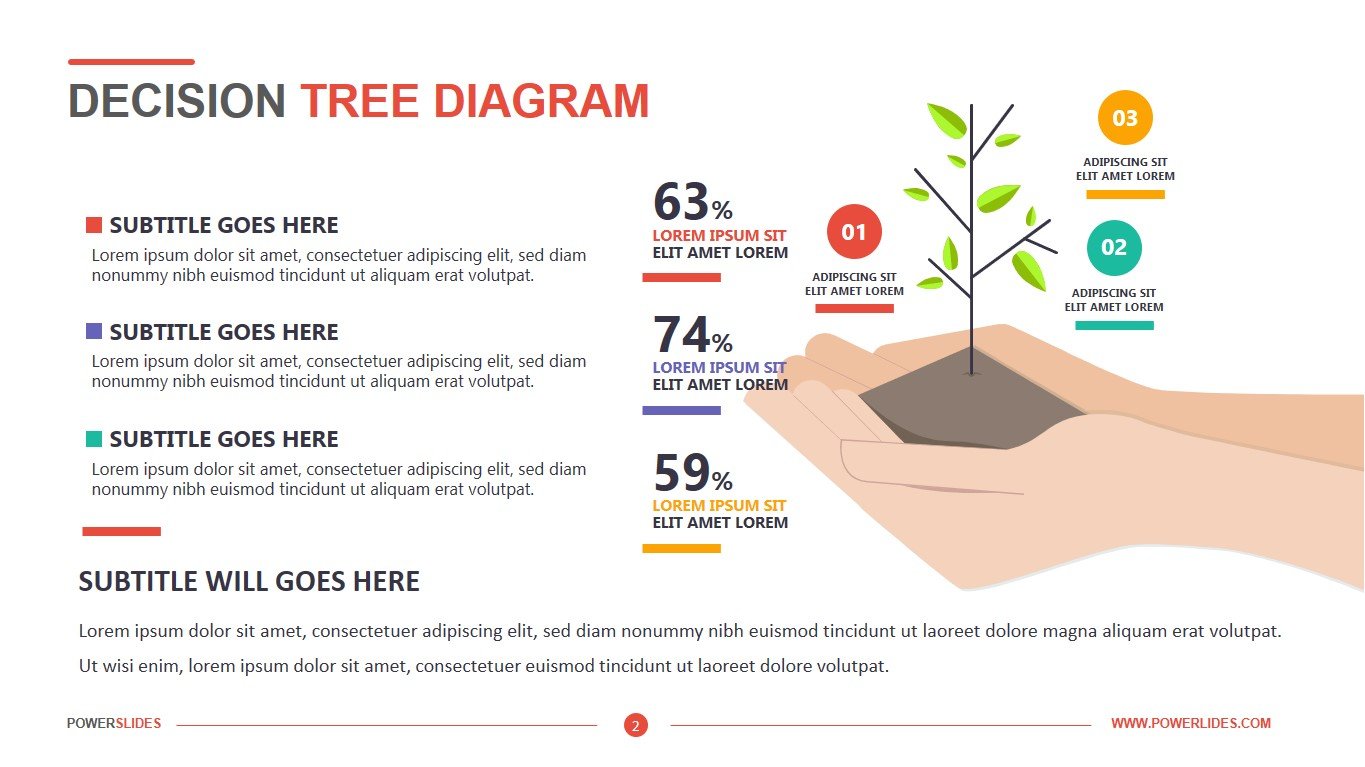
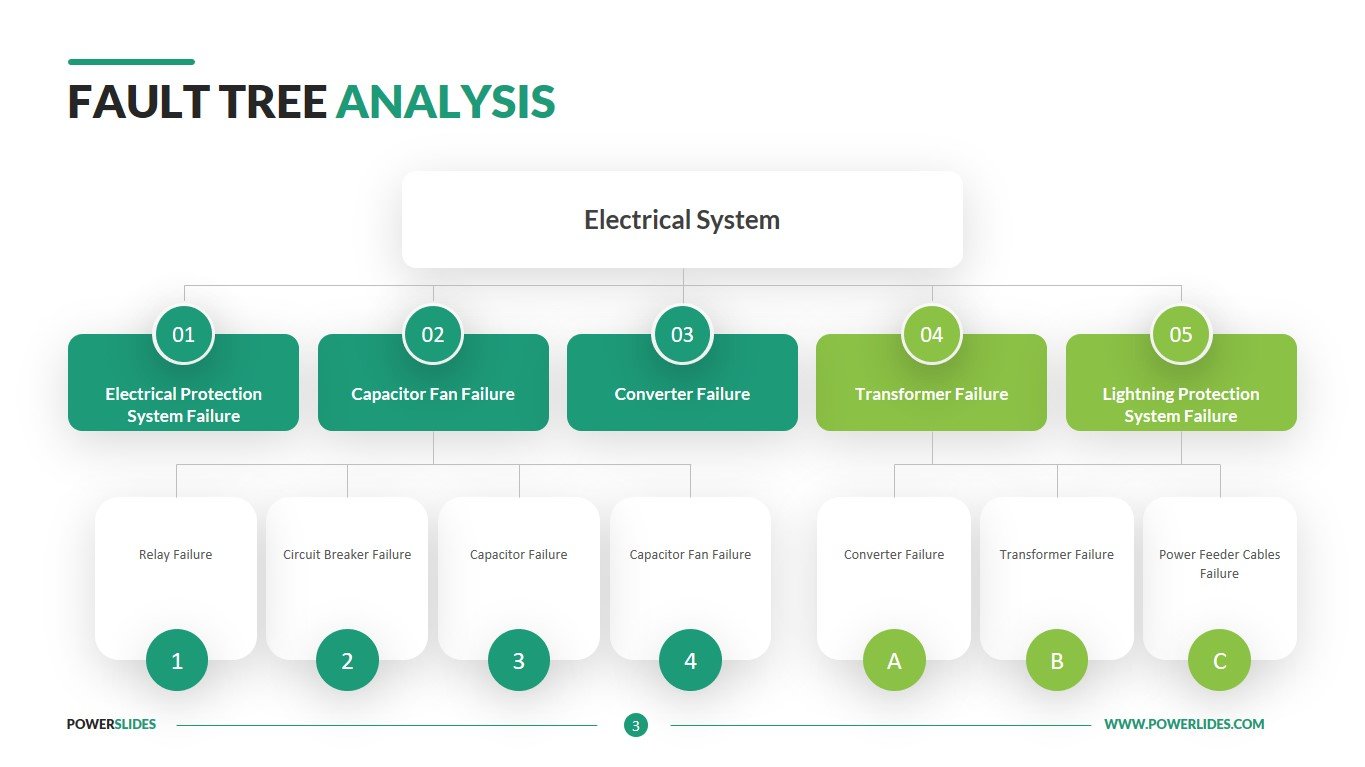
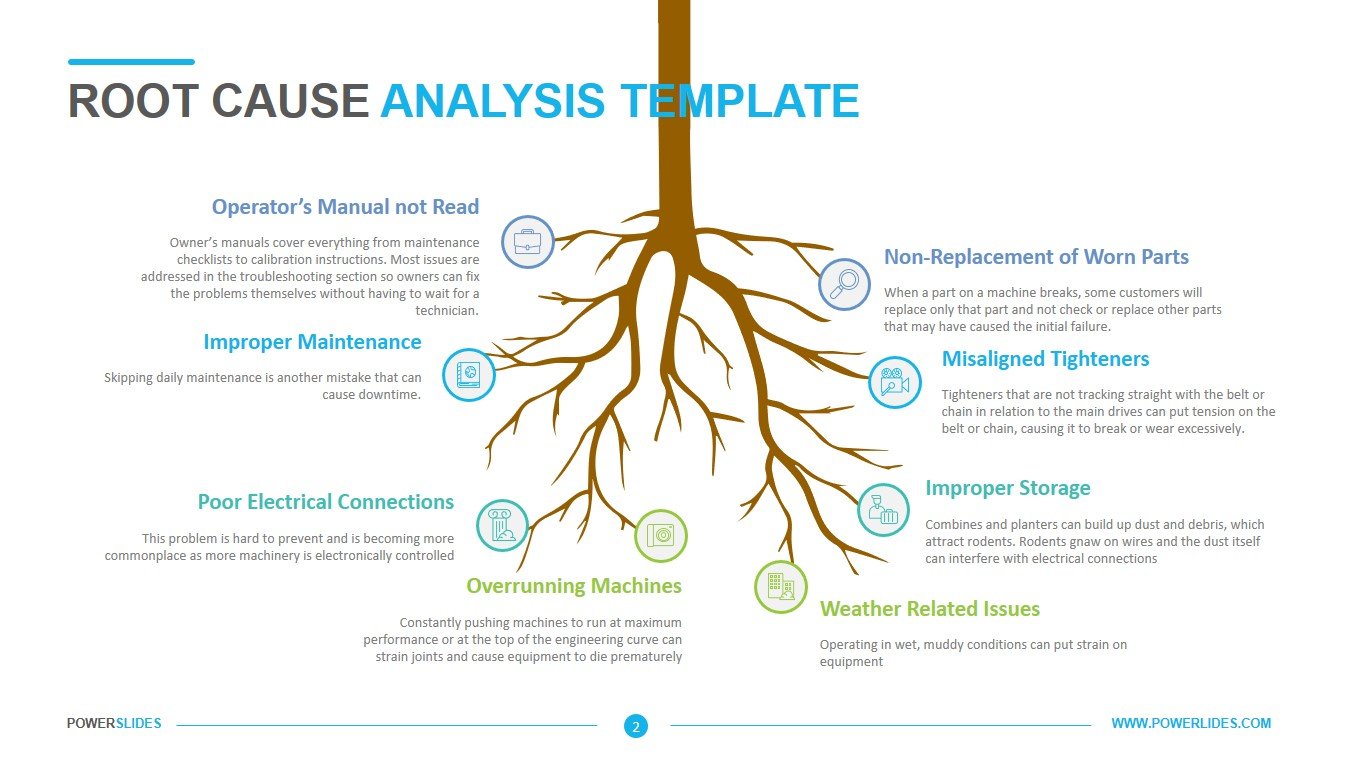
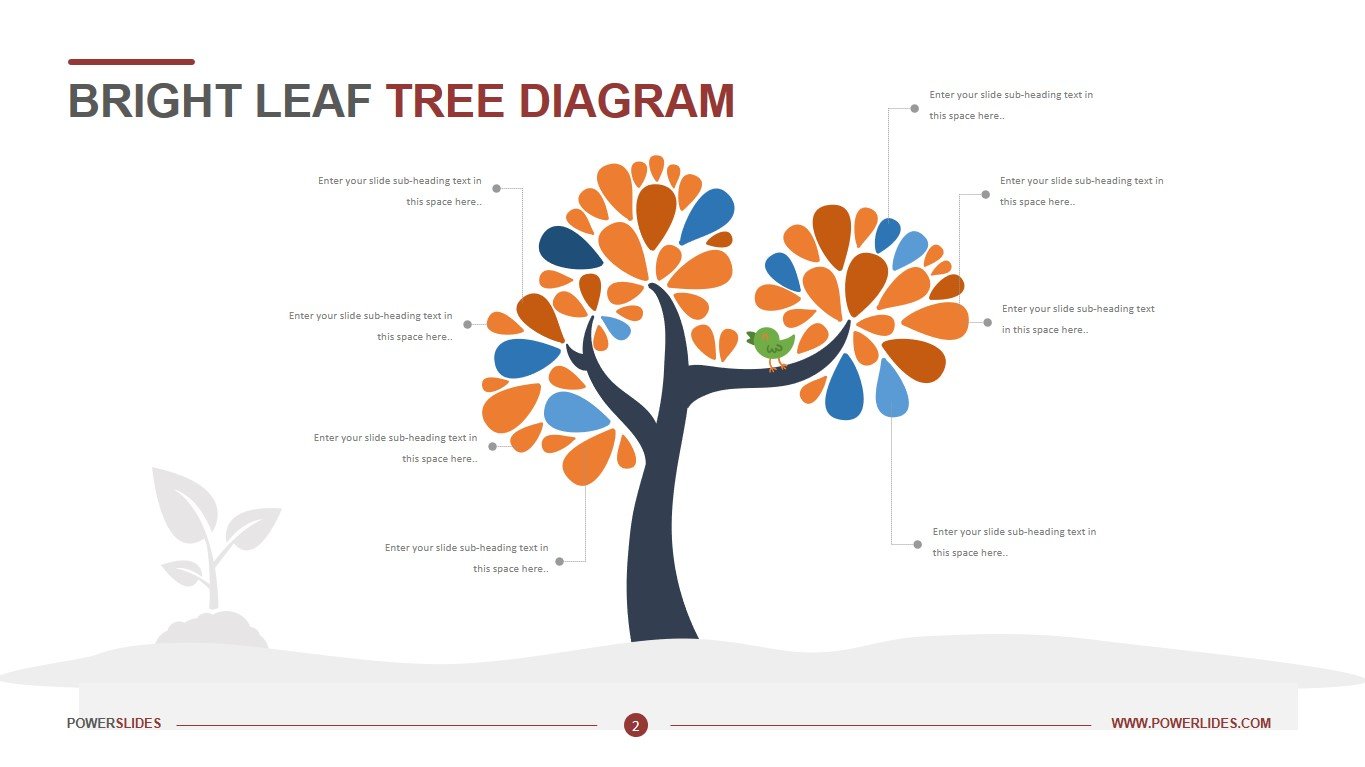
A Visual Decision tree is an easily editable and customizable template which uses a branching method to portray a decision and all its possible outcomes. Having the results predicted even before the decision is taken is very useful and this premium visual decision tree template aids to present that. Consisting of four creative slides, this template depicts the concept that when base of decision is strong, only then it would be fruitful. Also a decision rightly taken would result into profitable outcomes.
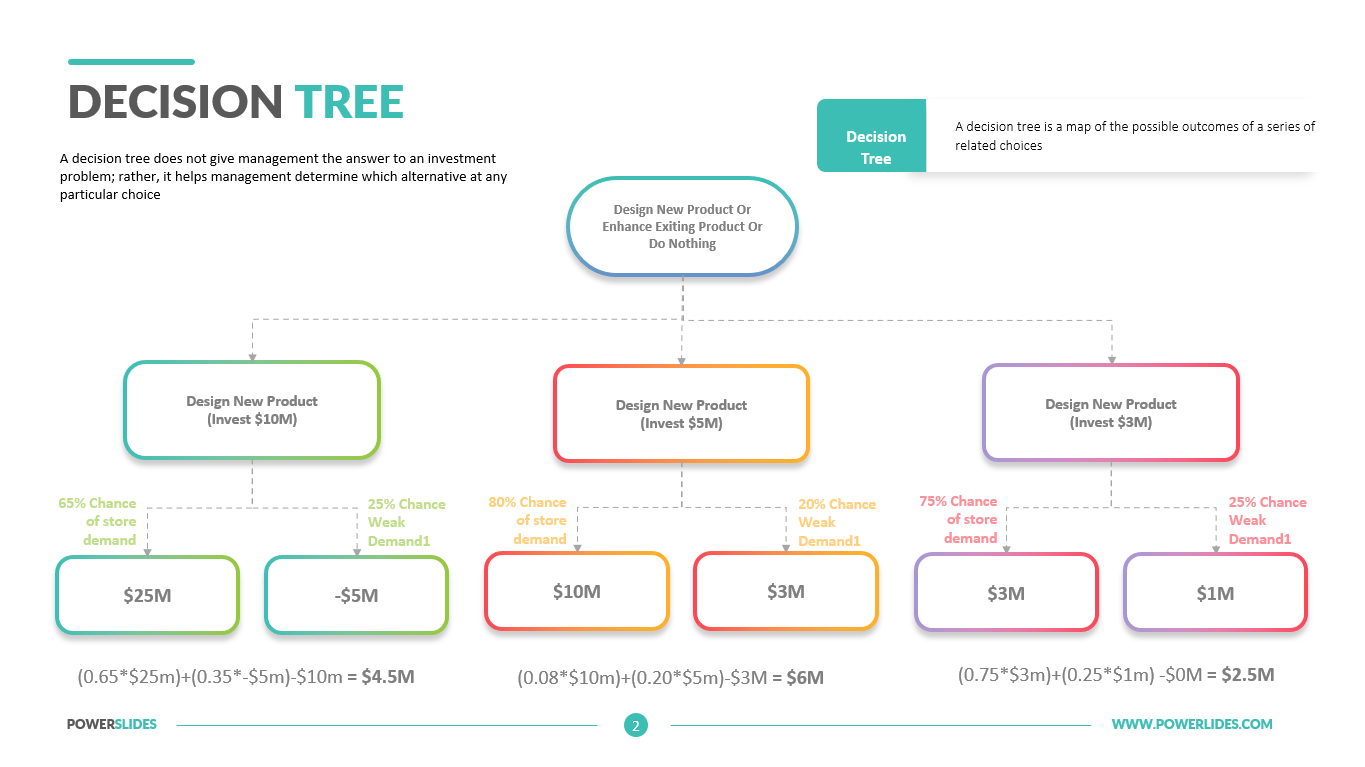
This basic template can be very fruitful for presenting the investment decisions with branches showing risk, returns, factors affecting the investment decision and the success rate. Moreover, a new product launch can be depicted via this attractive template. Success of the product can be shown with facts and figures from outer environment, showing the need of product and market benefits attached with it.
Our visual decision tree template is very useful when a new decision is under consideration and all the possible outcomes have to be taken into account. Using this template in presentations can help you get attention of the audience and have focused and fruit-bearing discussions before the decisions are finally taken. This simple and creative template plays the best role to present a decision and both positive and negative results associated with it.
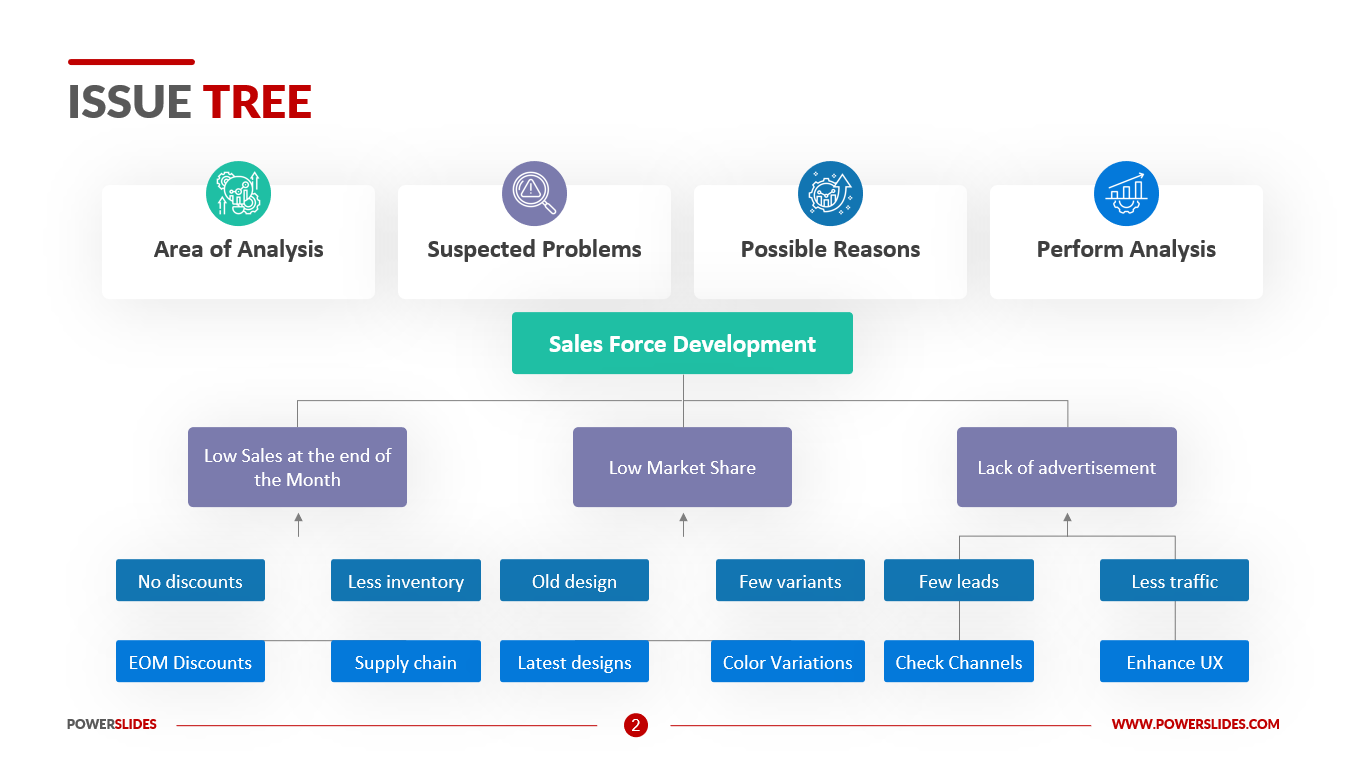
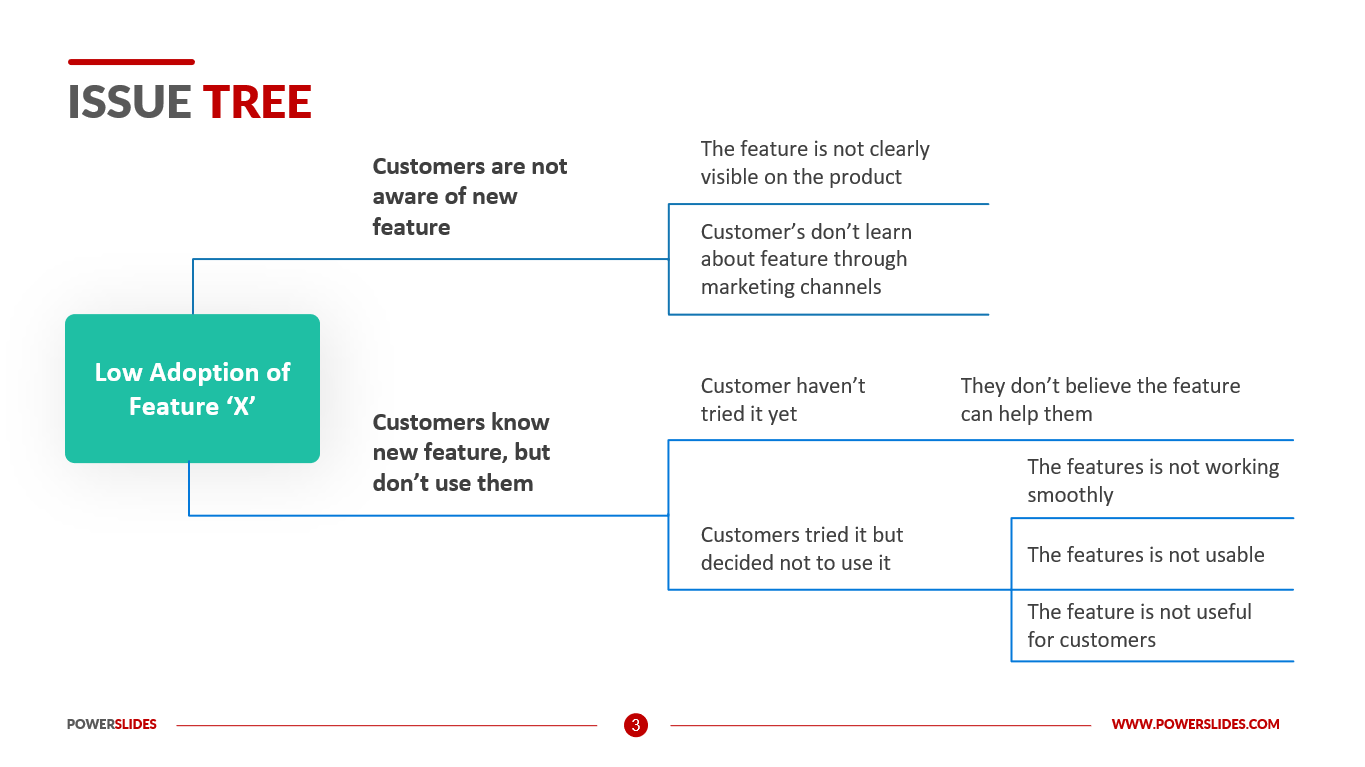
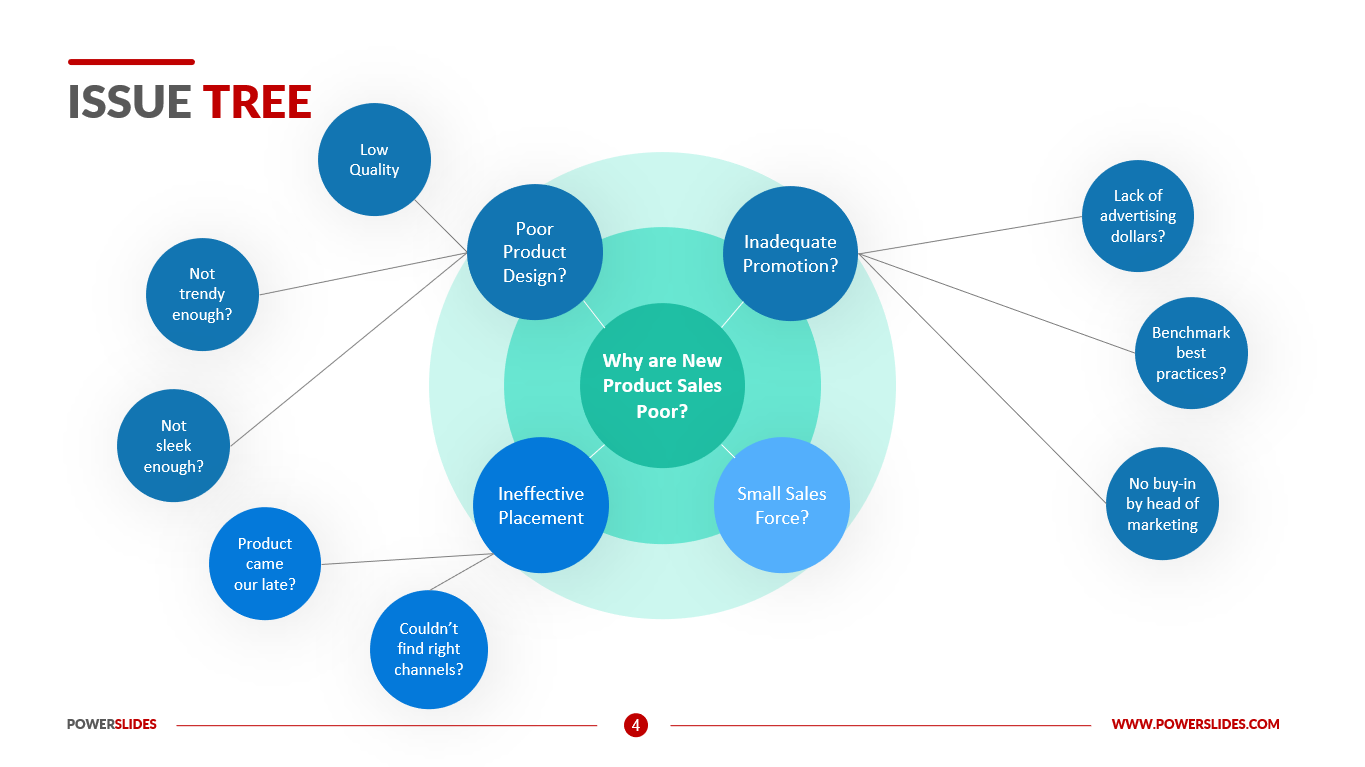
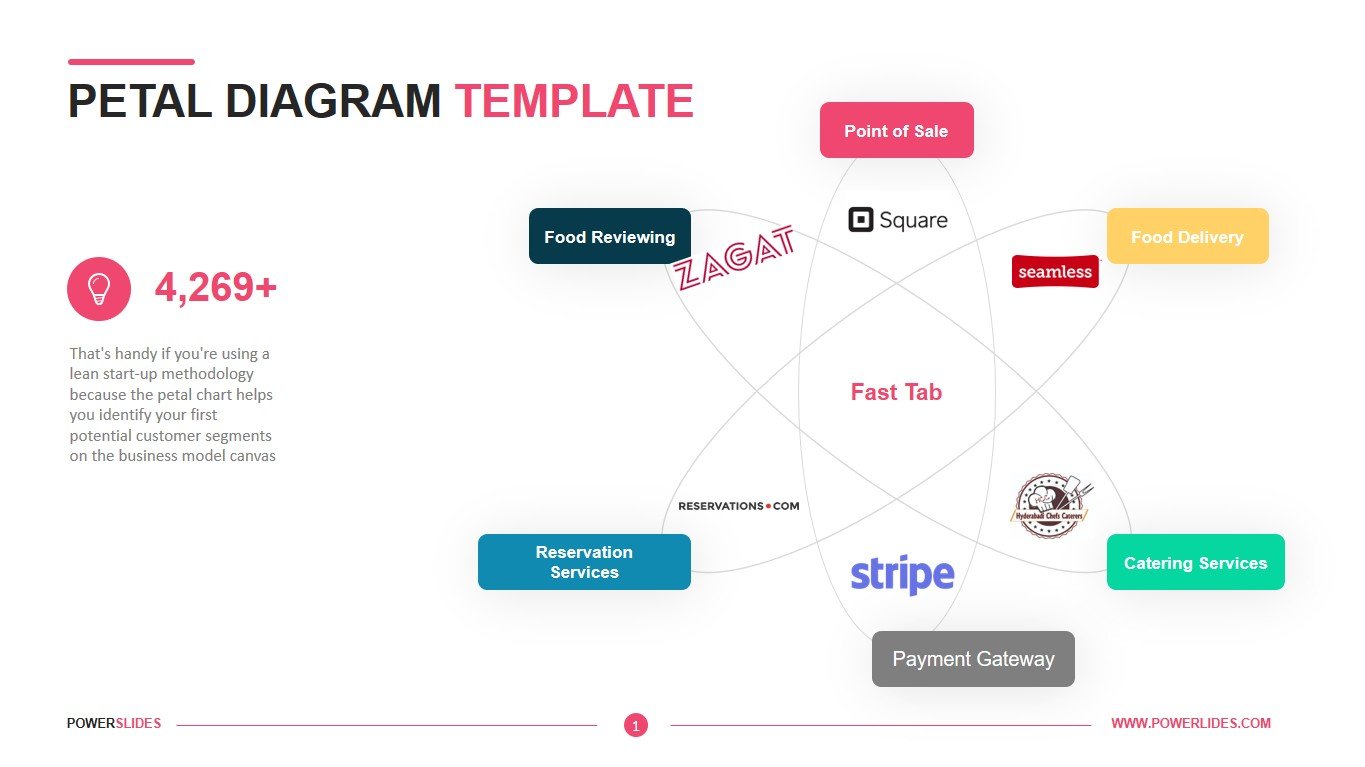
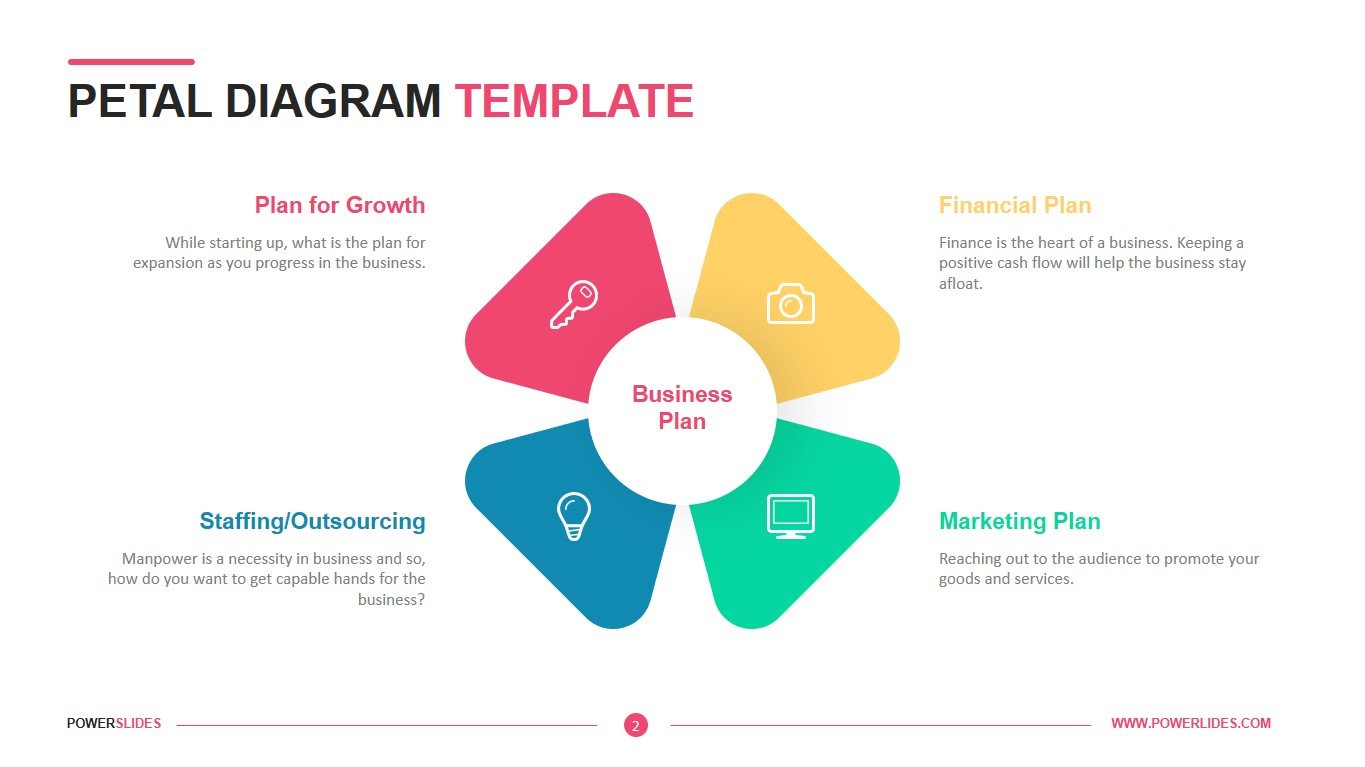
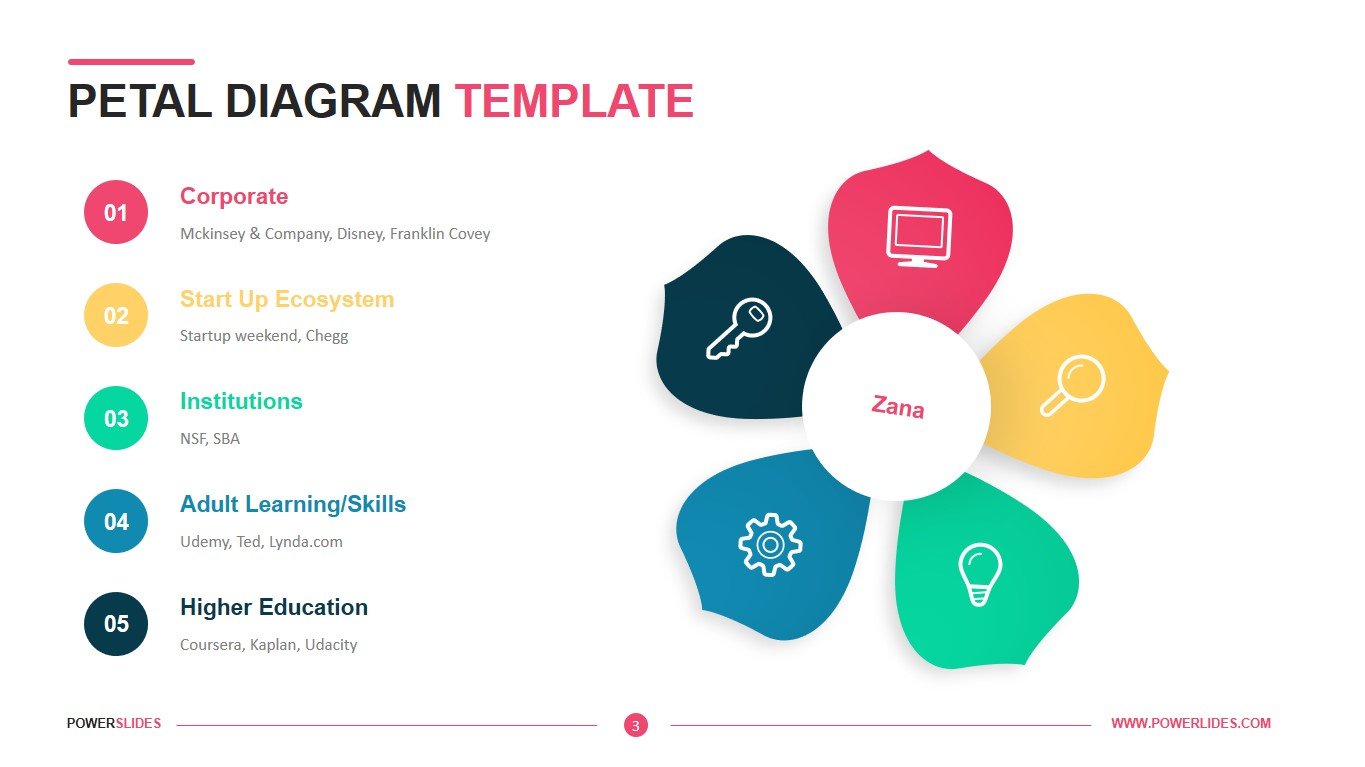
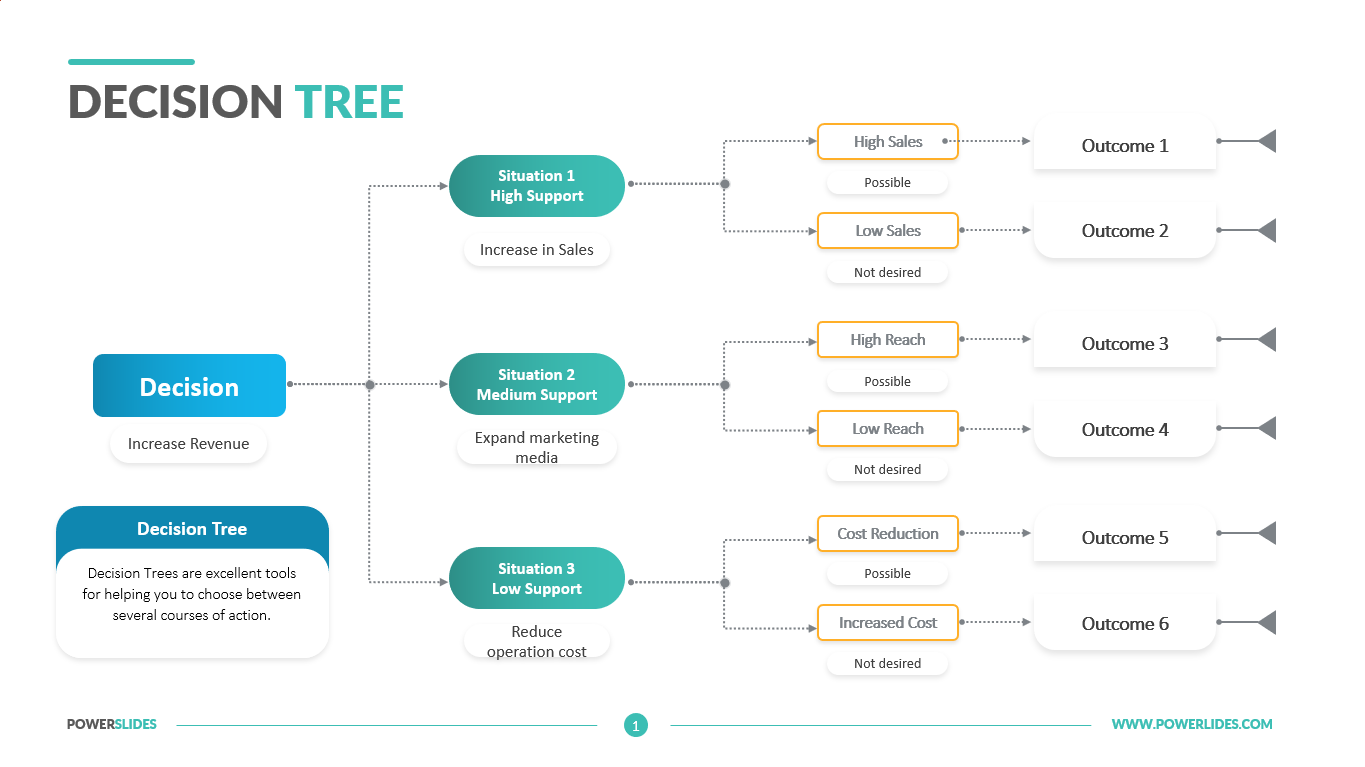
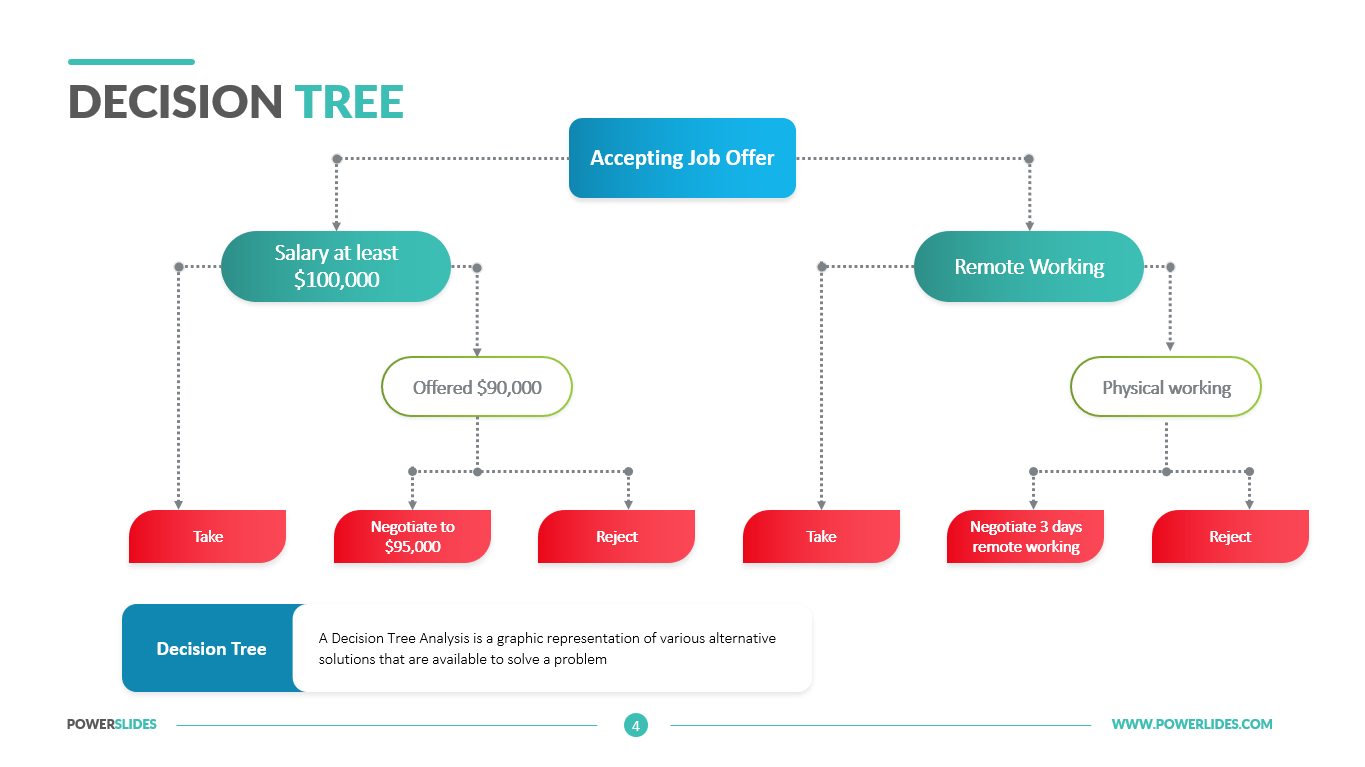
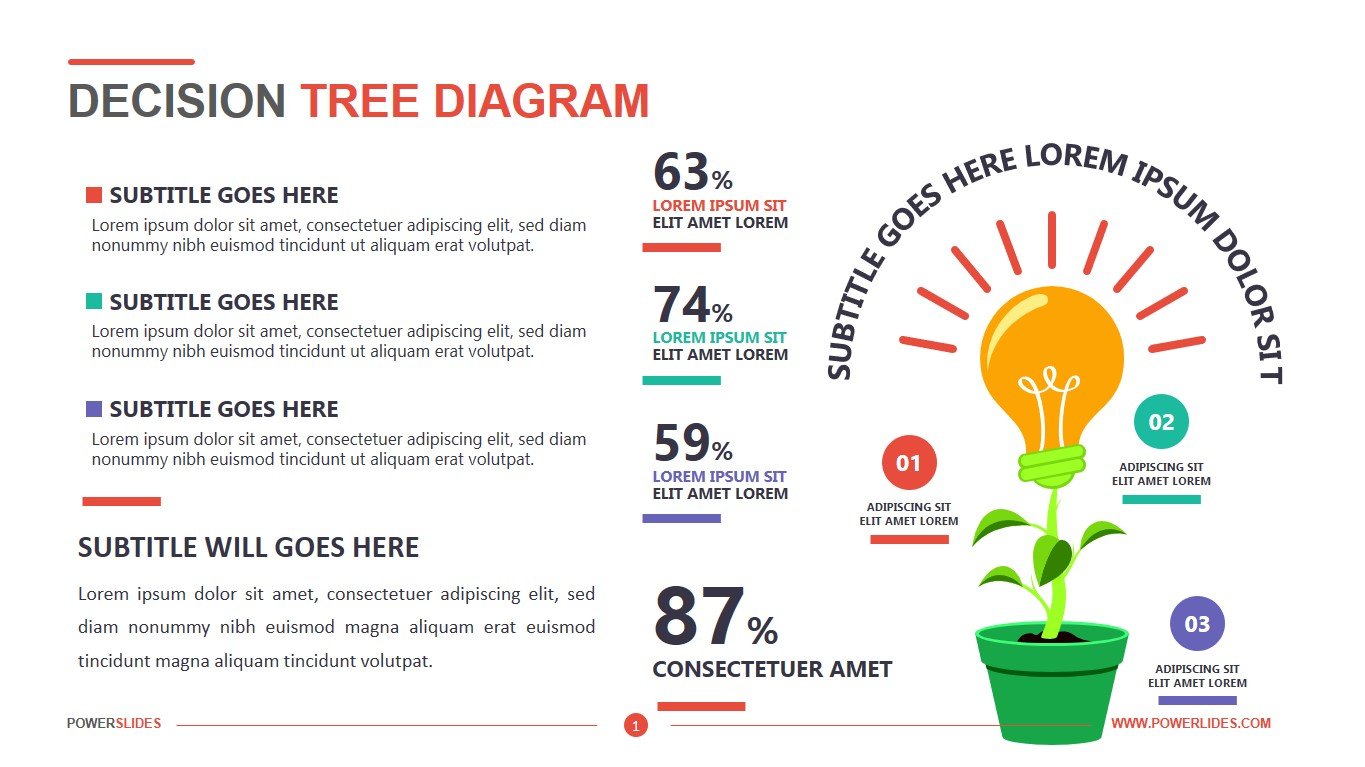
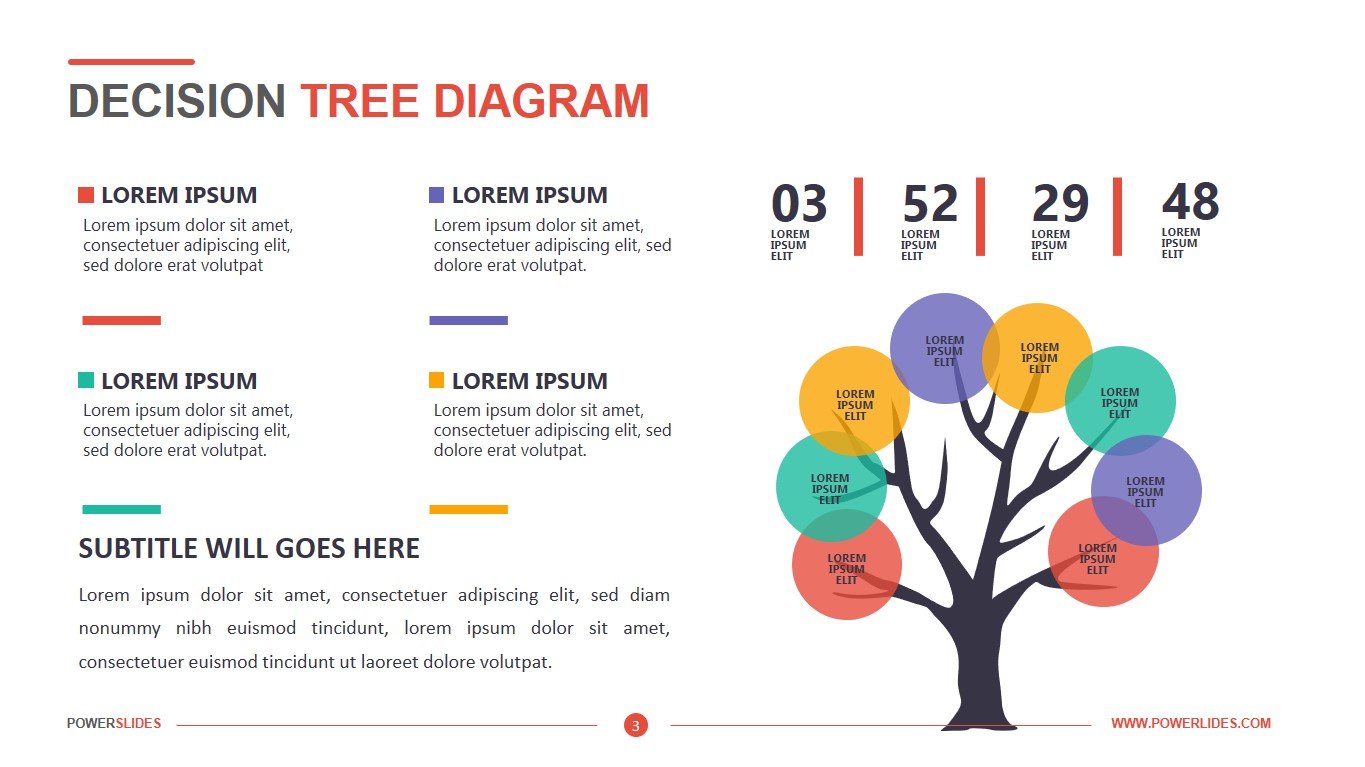
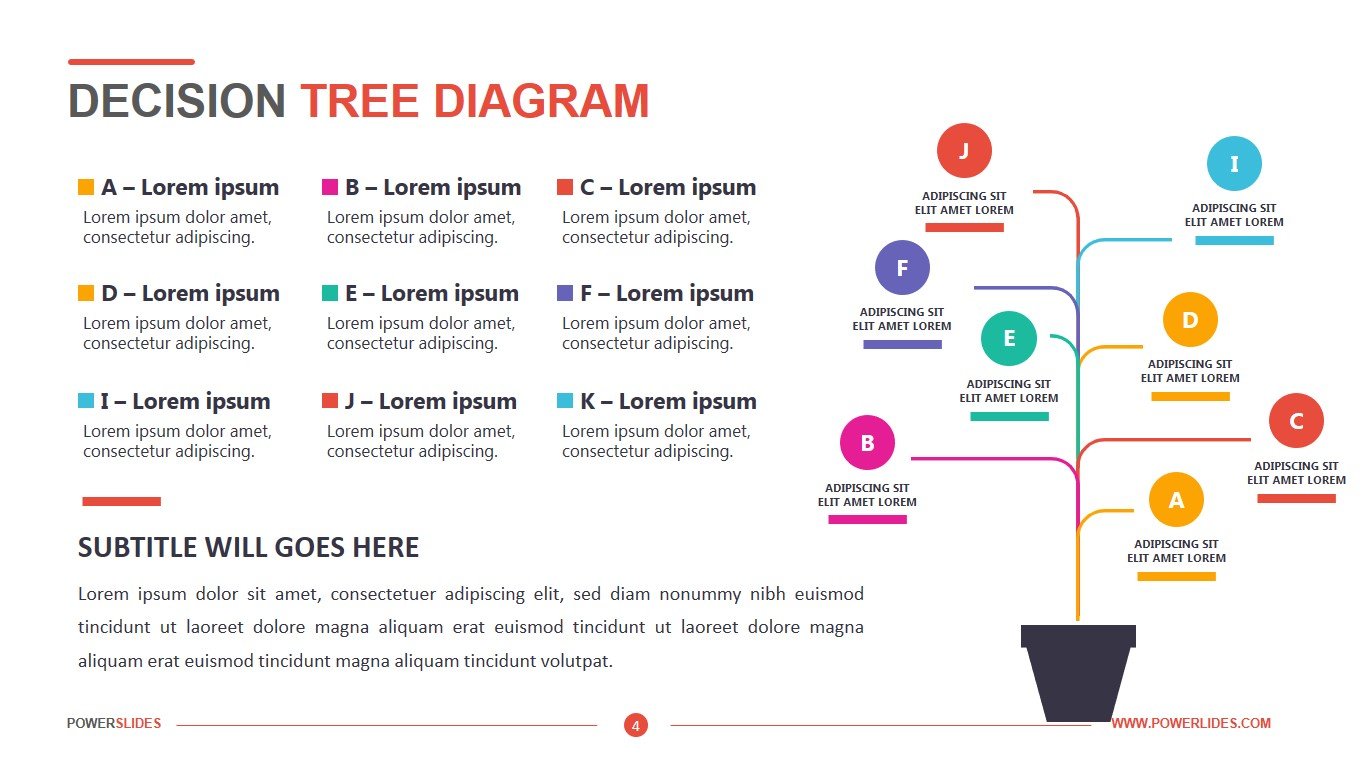
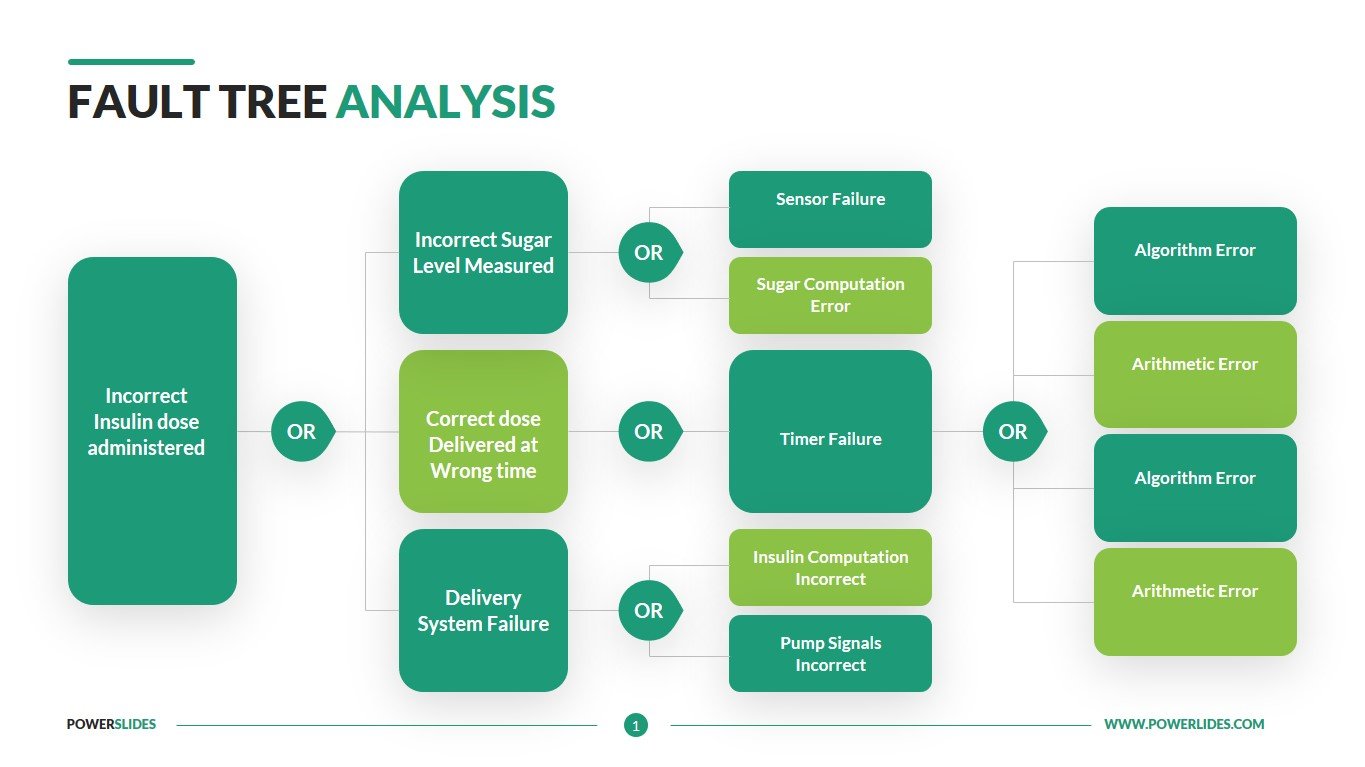
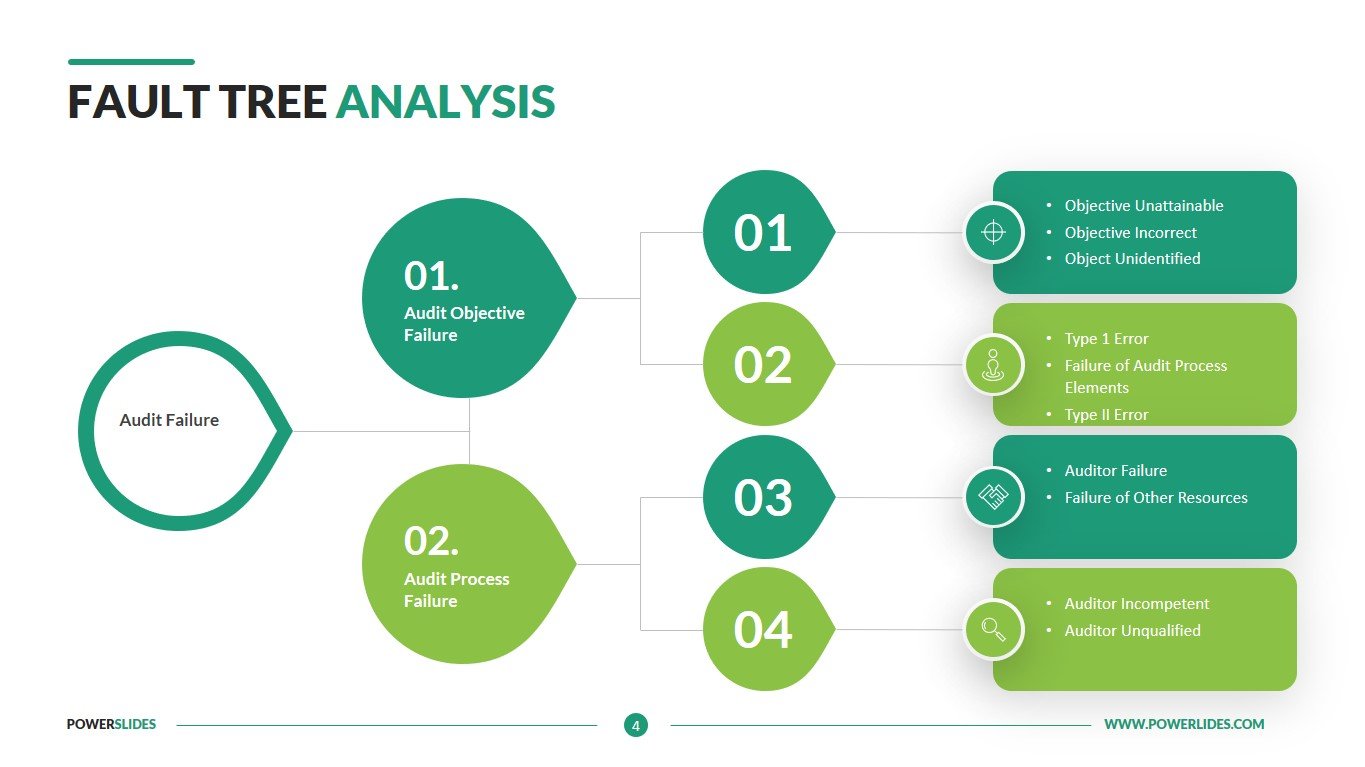
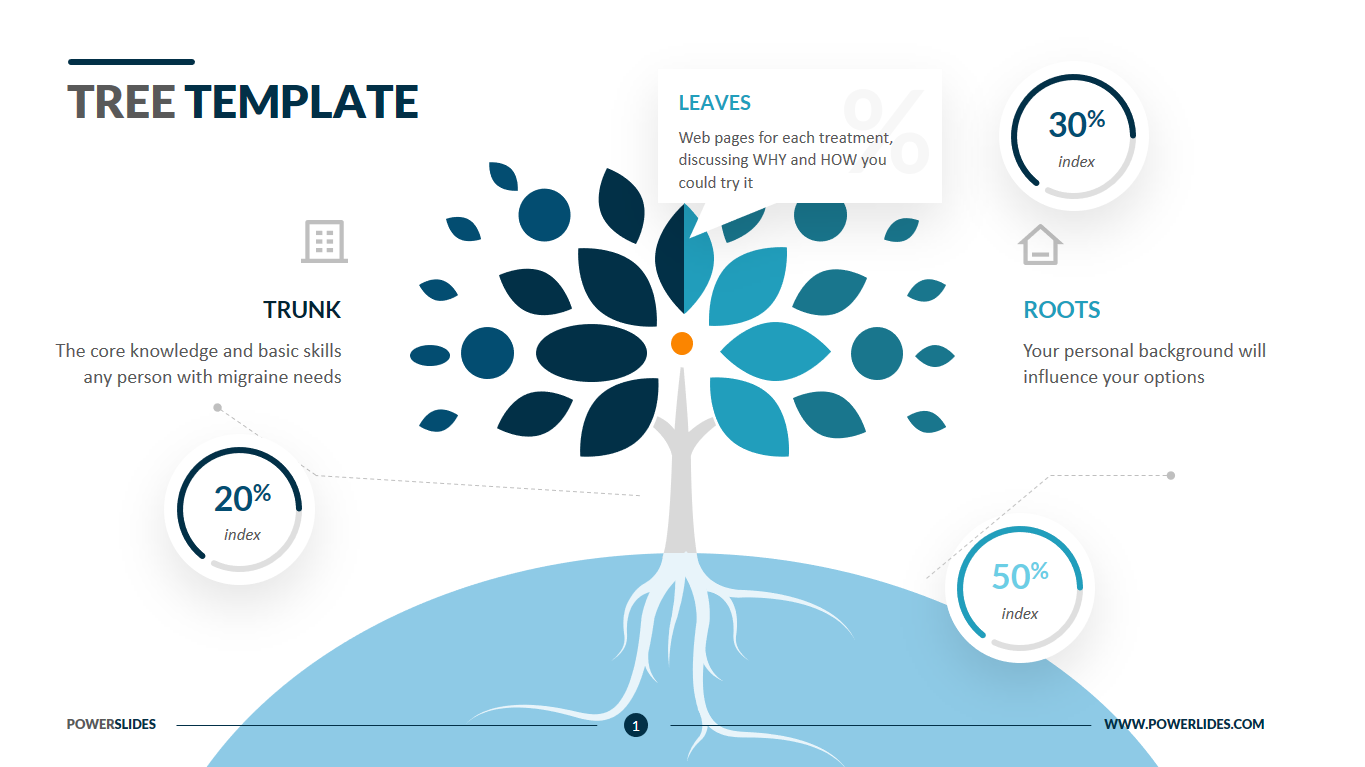
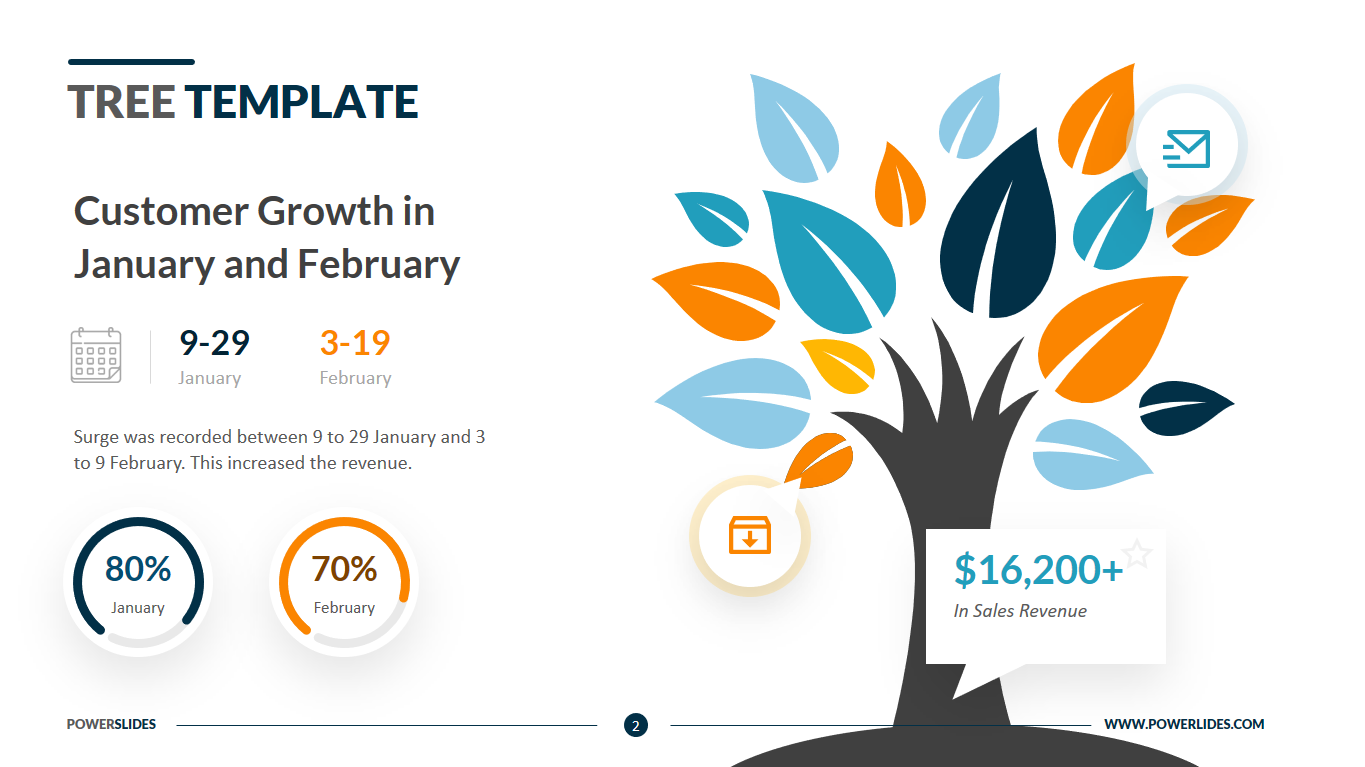
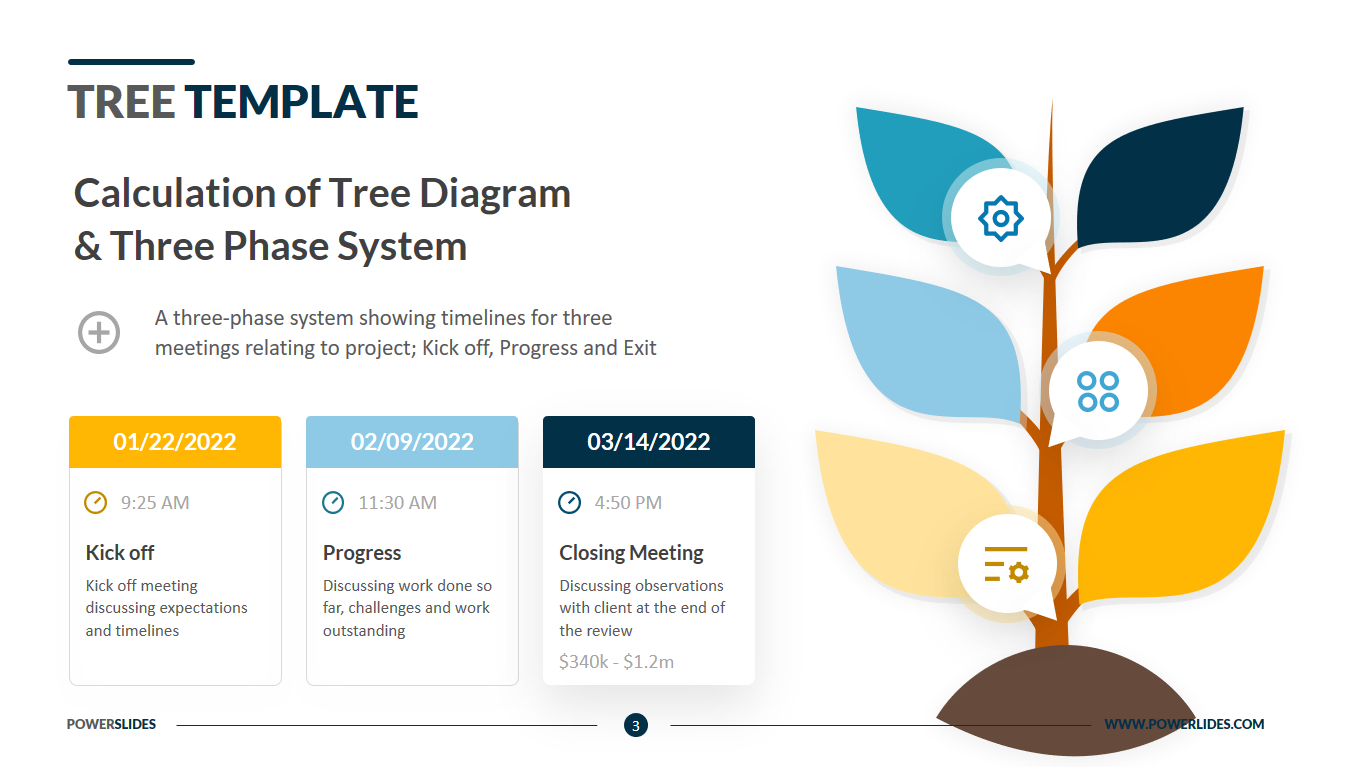
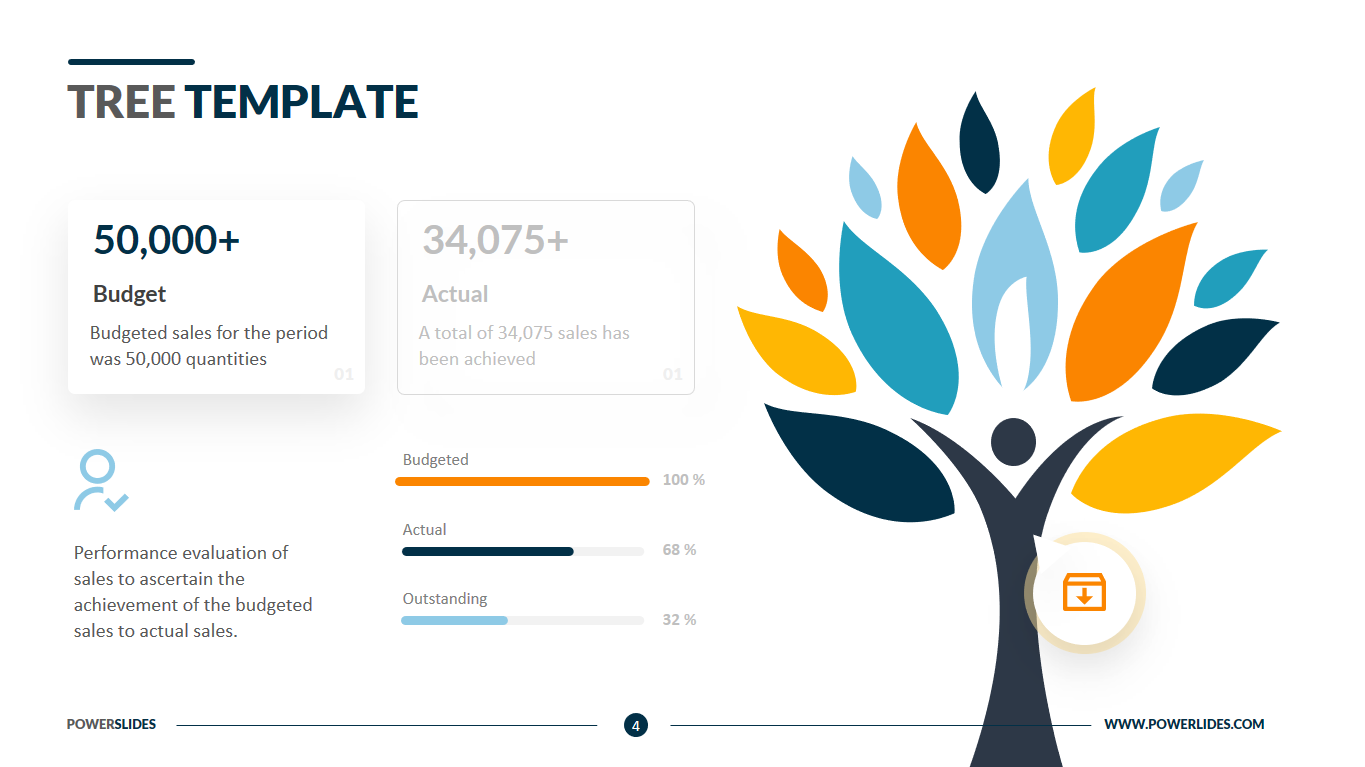
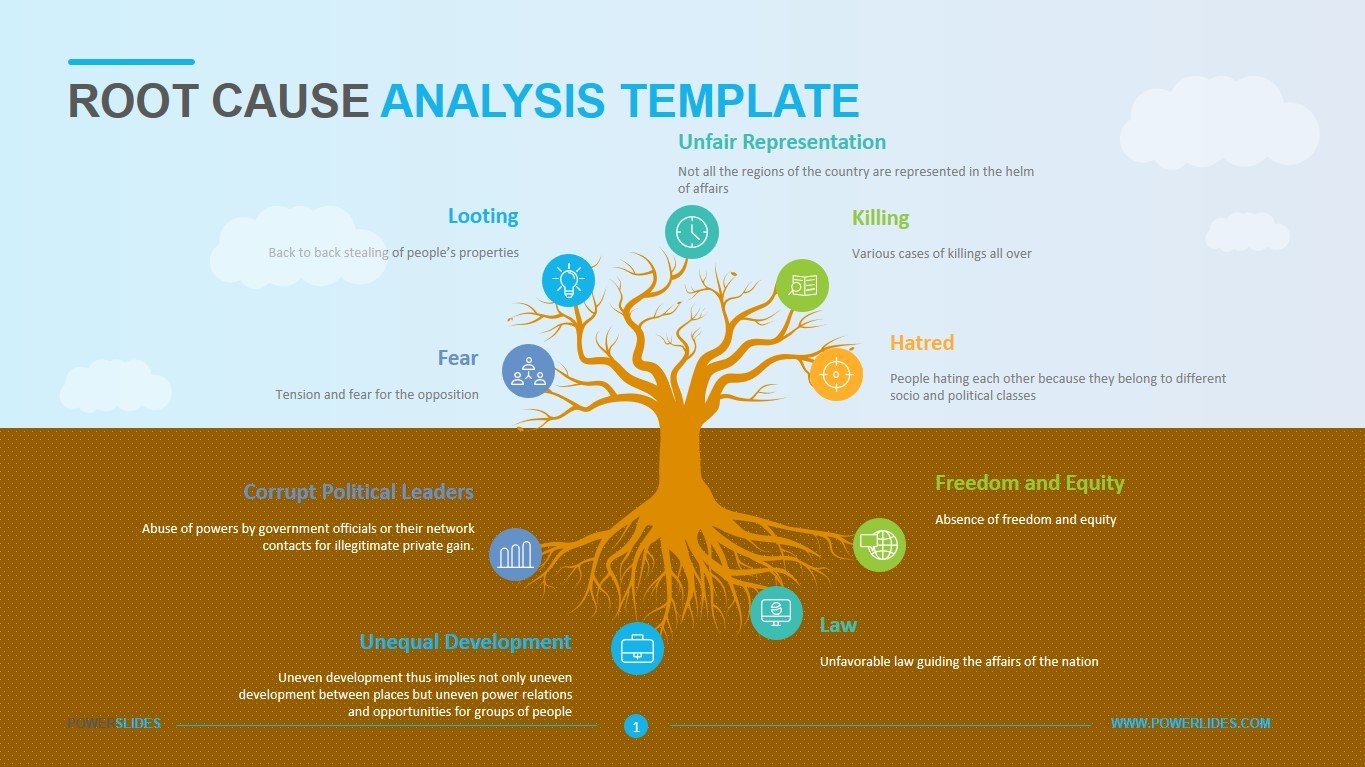
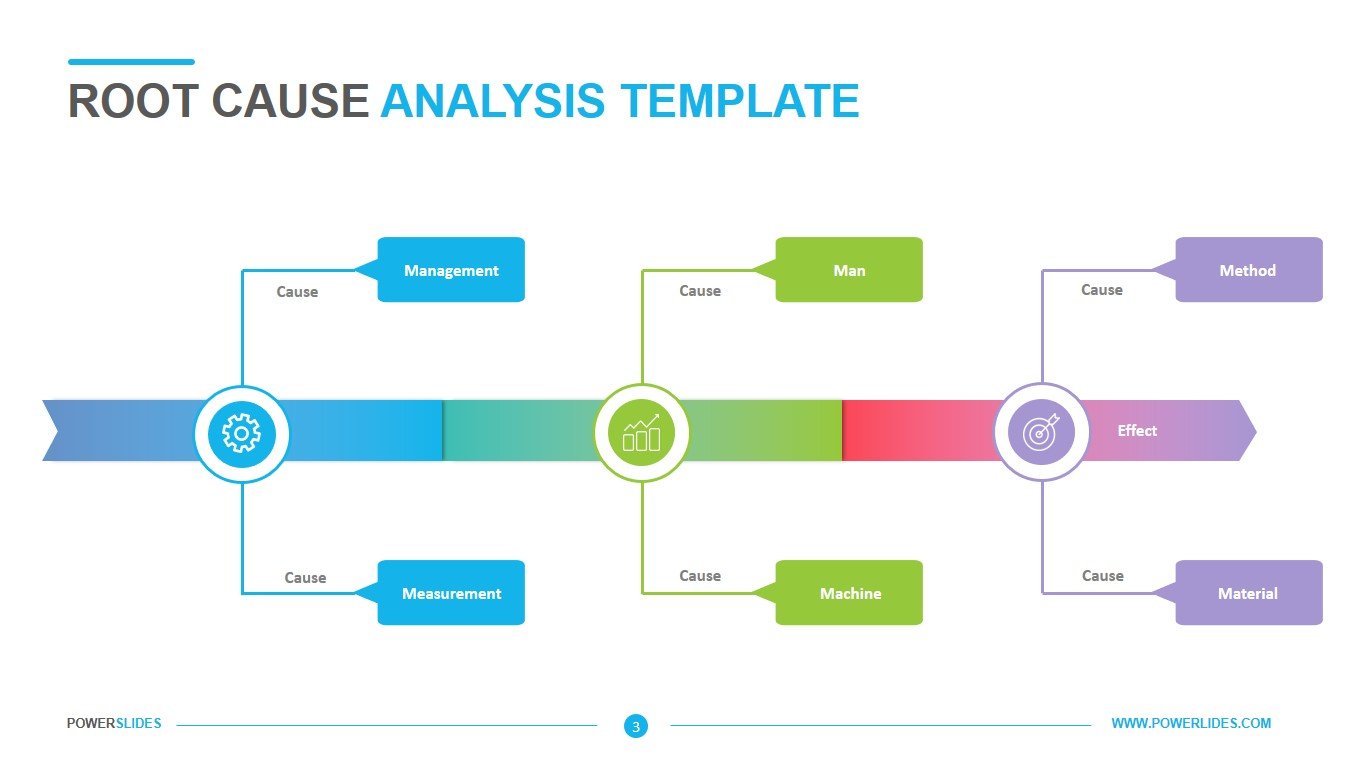
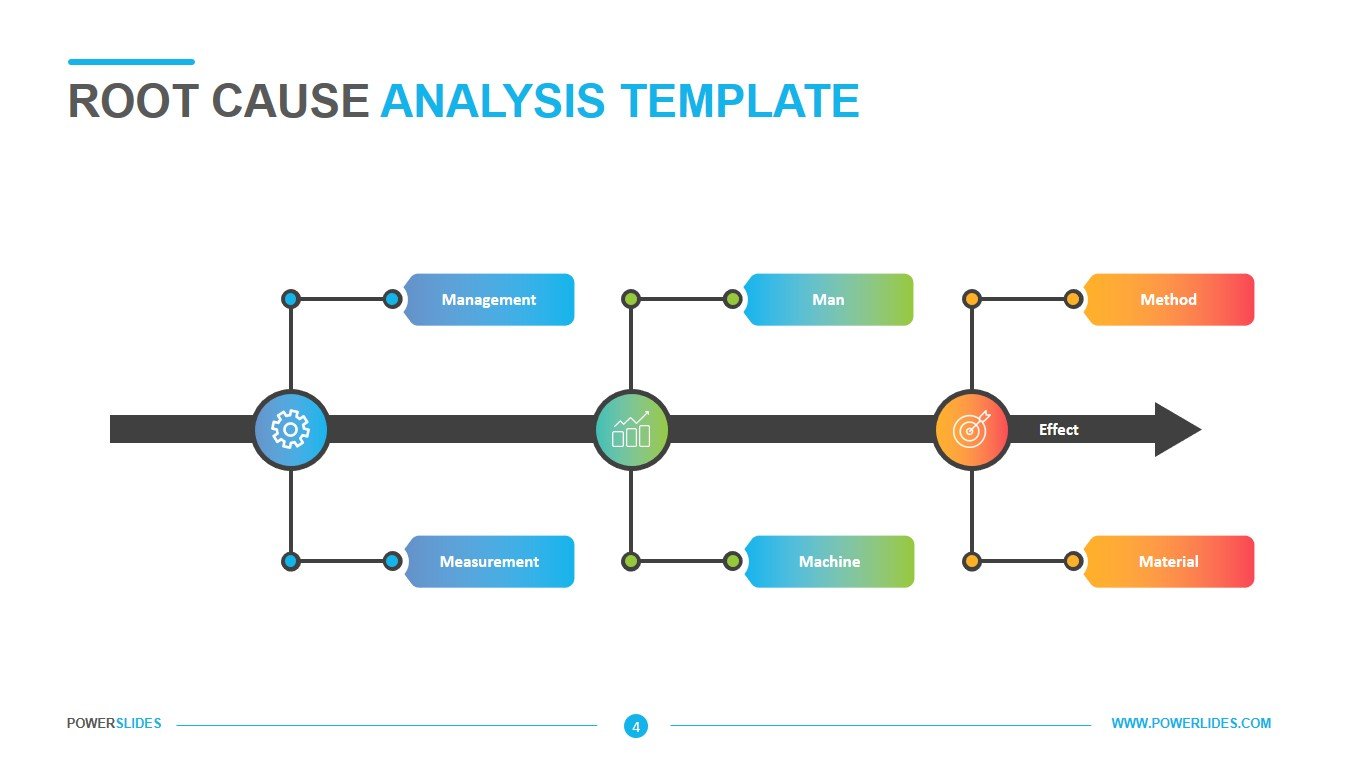
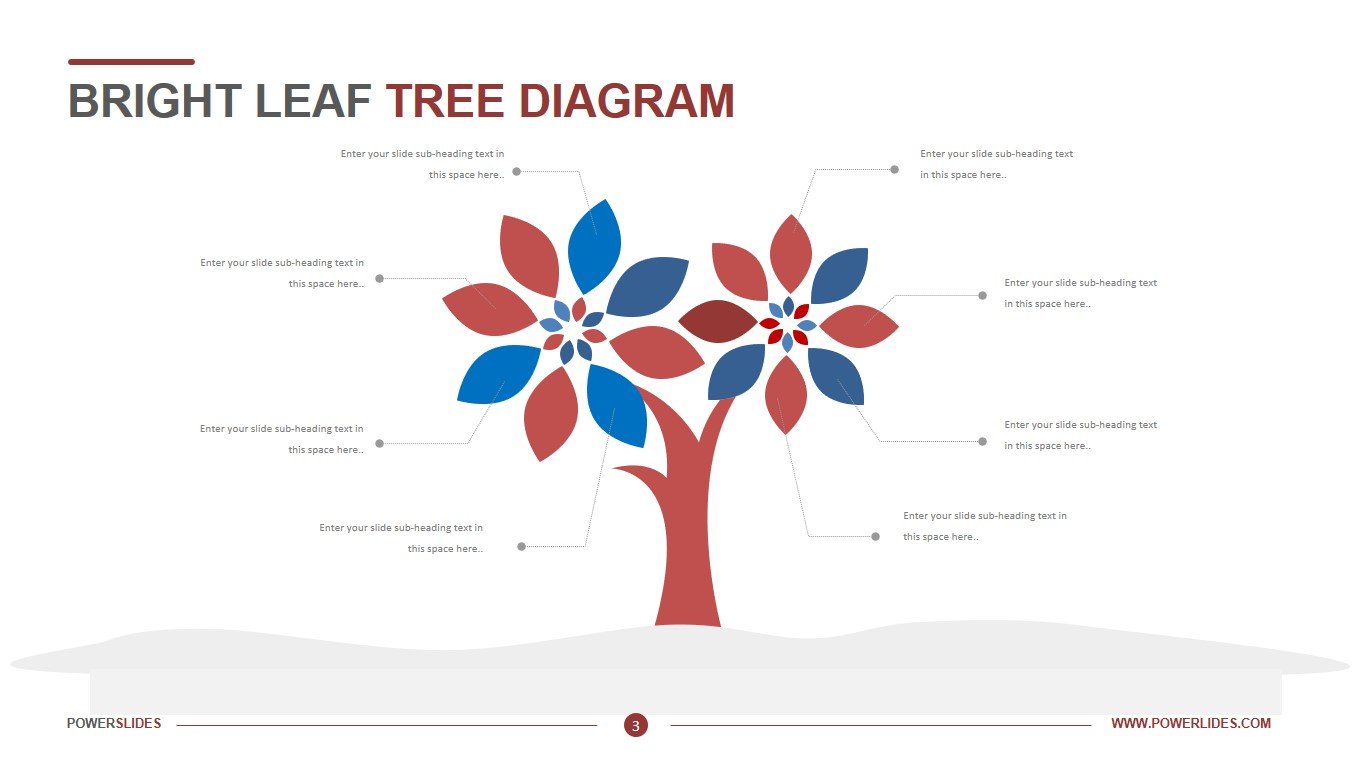
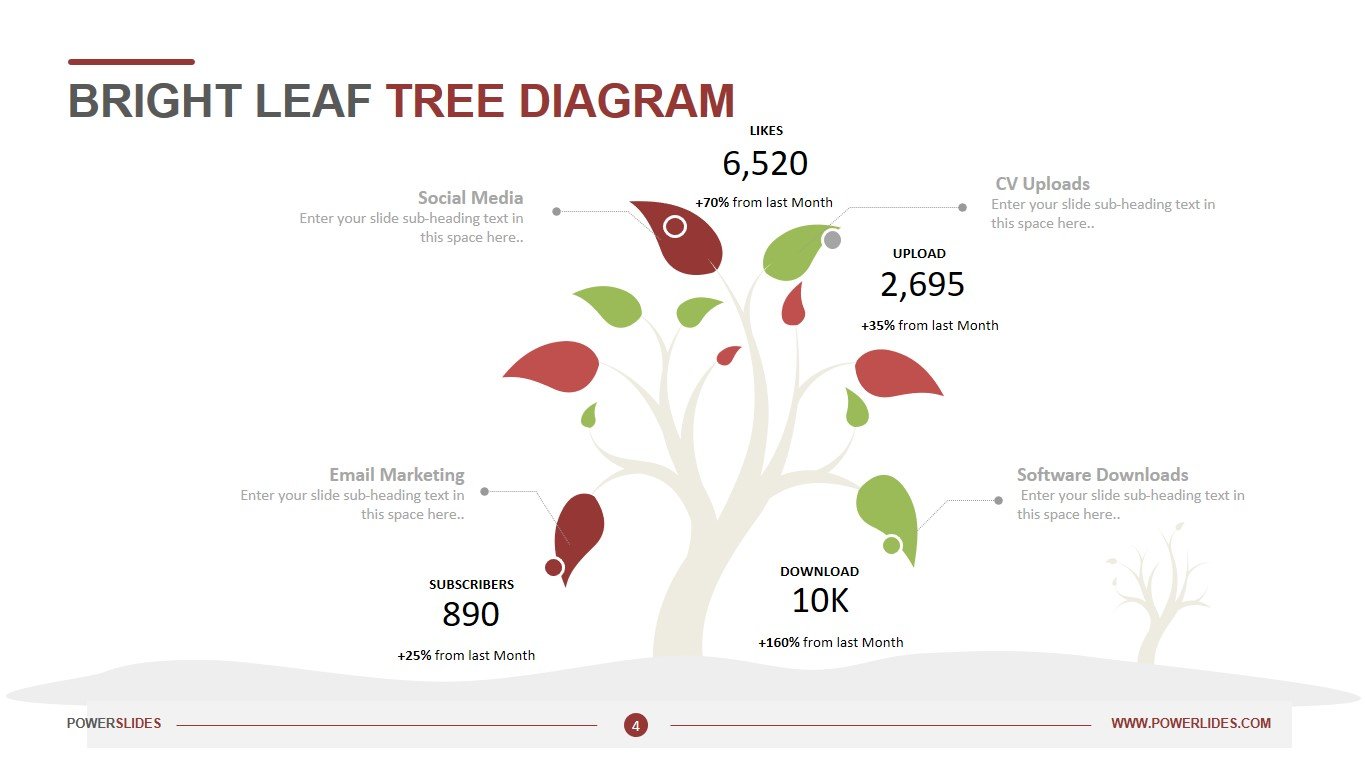
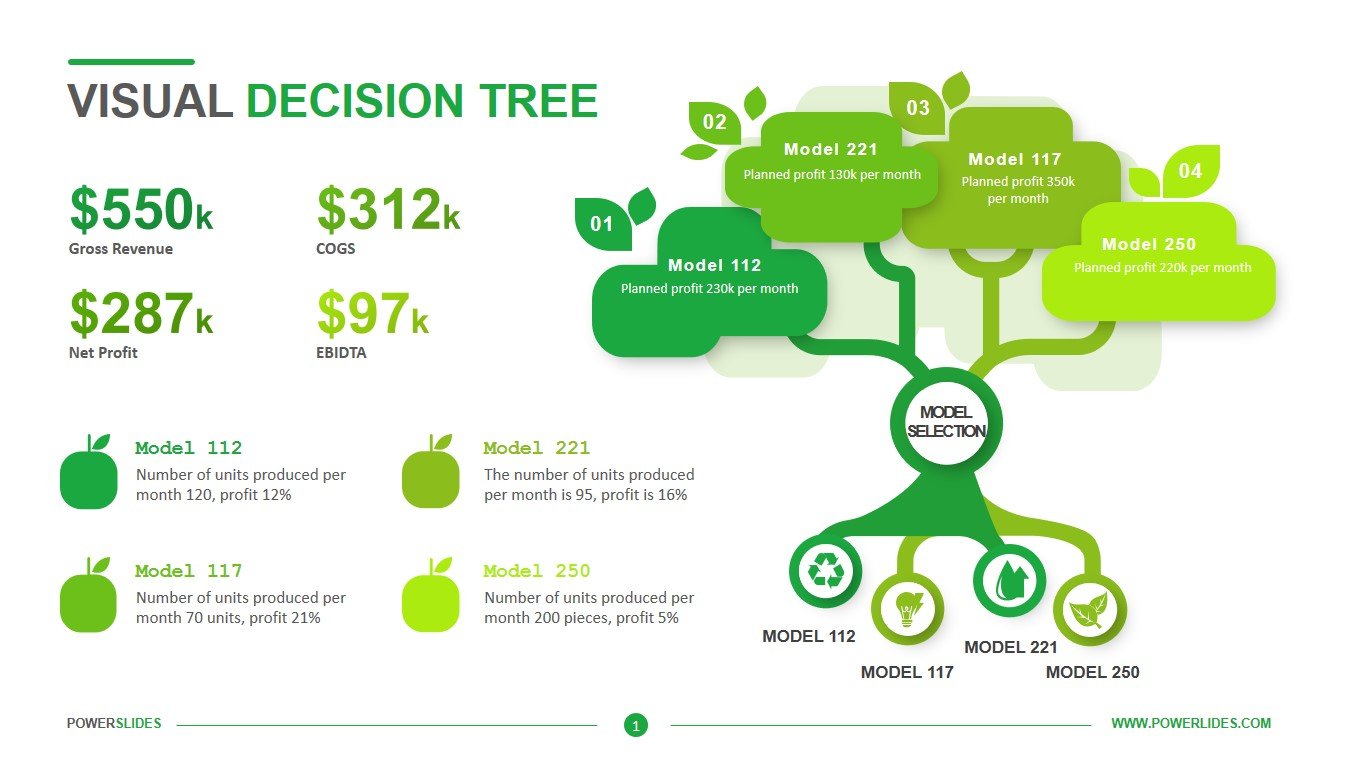
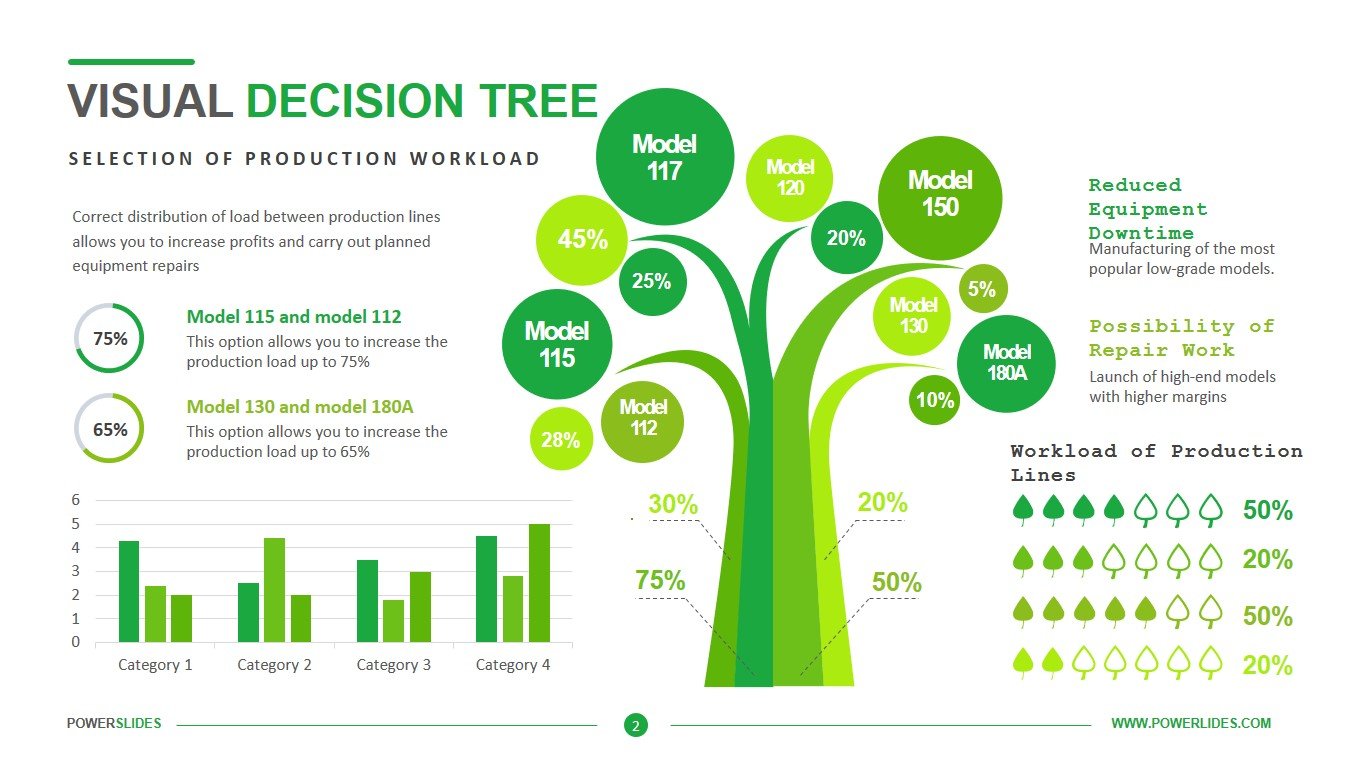
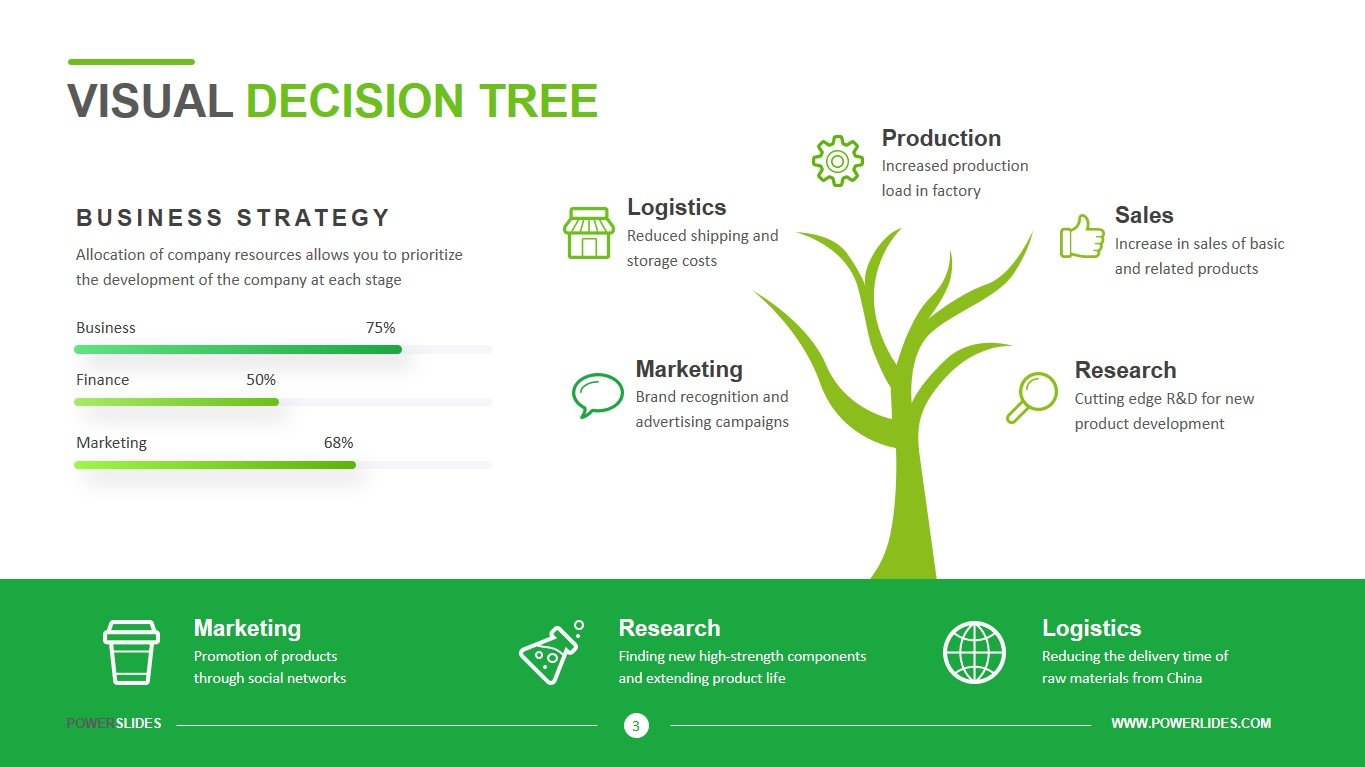
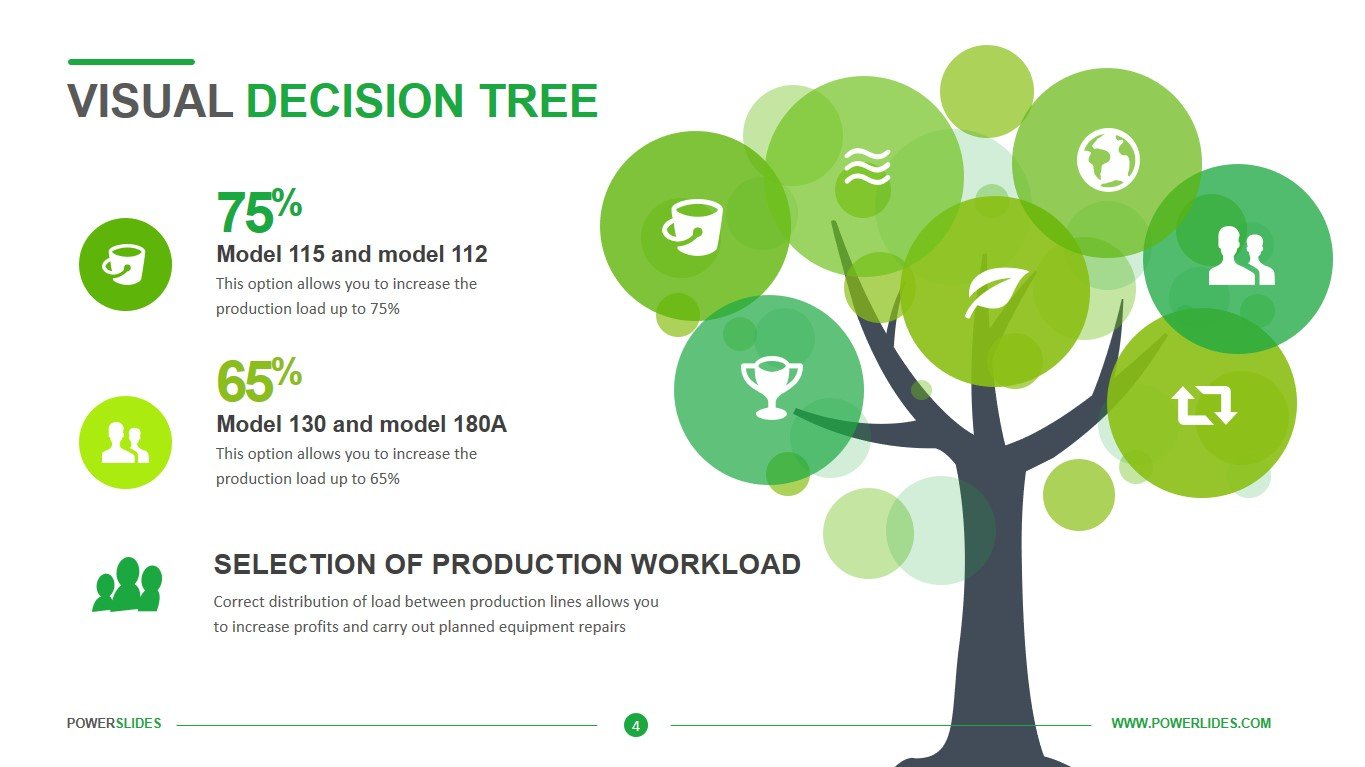
Let’s take a look at the possibilities for each slide in this template. The first slide gives you the opportunity to present your data in four possible directions. For example, you can show the possibility of selling products to different regions of the country, each of which will have its own costs, timing of implementation and final profit. This slide will be useful for sales and development managers. The second slide additionally gives you the opportunity to use graphs and show the dynamics of change for different products. You can use it when planning the release of various types of products on various equipment. For example, you can present data on the co-production of goods A and B by comparing different combinations of them that will have different profit and quantity. The next slide is made in a more minimalistic style, but also has all the necessary tools and infographics. This slide can be used when planning the supply of products from different suppliers. For example, you can show the purchase cost, delivery times, payment terms and risks of underdelivery of each supplier. The last slide can be useful for software developers. You can show the operation of the program depending on various user actions. Also, the slide can be used when preparing a forecast for sales of a new product or when describing the consequences of the adoption by the state of various laws in the field of regulation of the domestic and foreign economy.
The Visual Decision Tree is made in soft colors and contains a large number of different tools – several types of charts, various infographics, a good arrangement of text blocks. If necessary, you can edit it according to your corporate requirements. This template will be useful primarily for investment companies that can present several options for investing in different financial instruments – stocks, bonds, startups, and more. This template will be a great addition to your business presentation collection.


