Tree Template
What do you think of this template?
 (5.00/ 5)
5 ratings

 4 Slides
 File size: 16:9
 Fonts: Lato Black, Calibri
 Supported version
PPT 2010, PPT 2013, PPT 2016
Supported version
PPT 2010, PPT 2013, PPT 2016

Product details
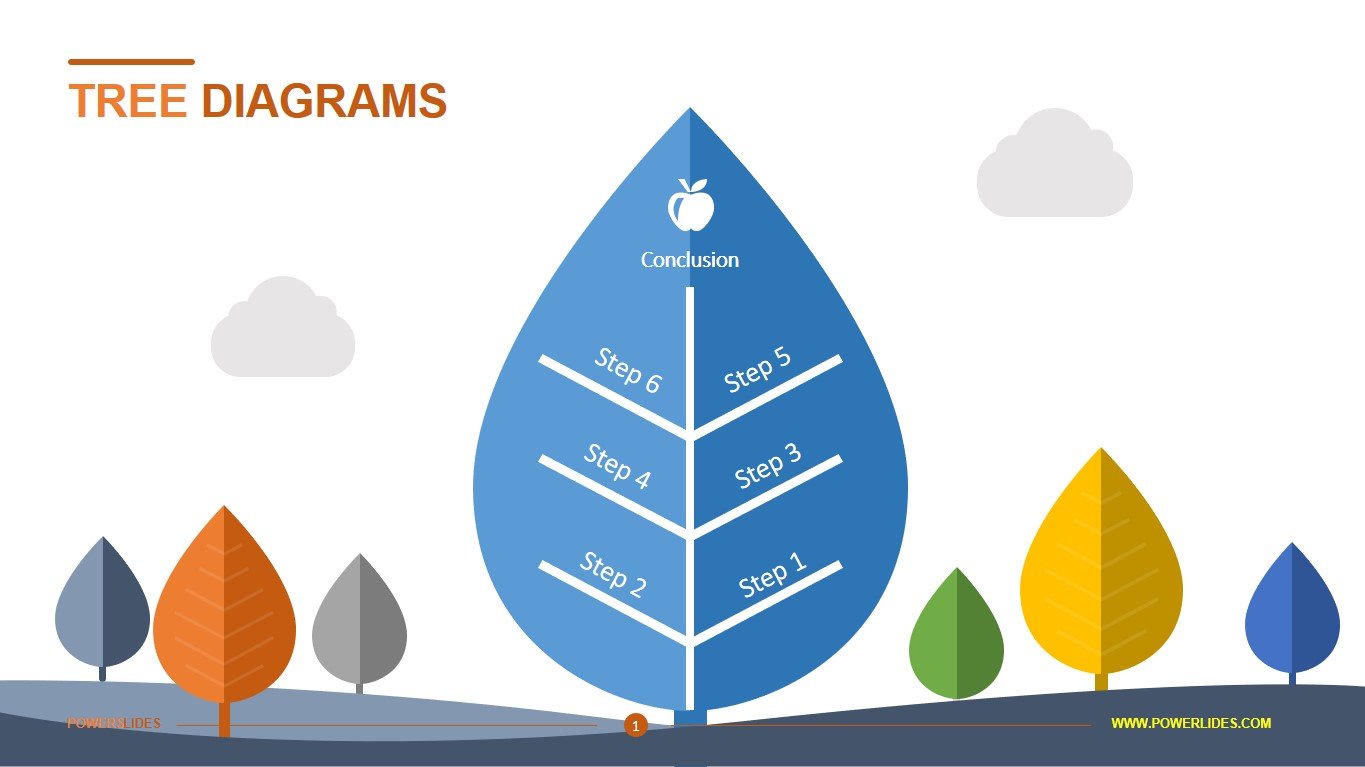
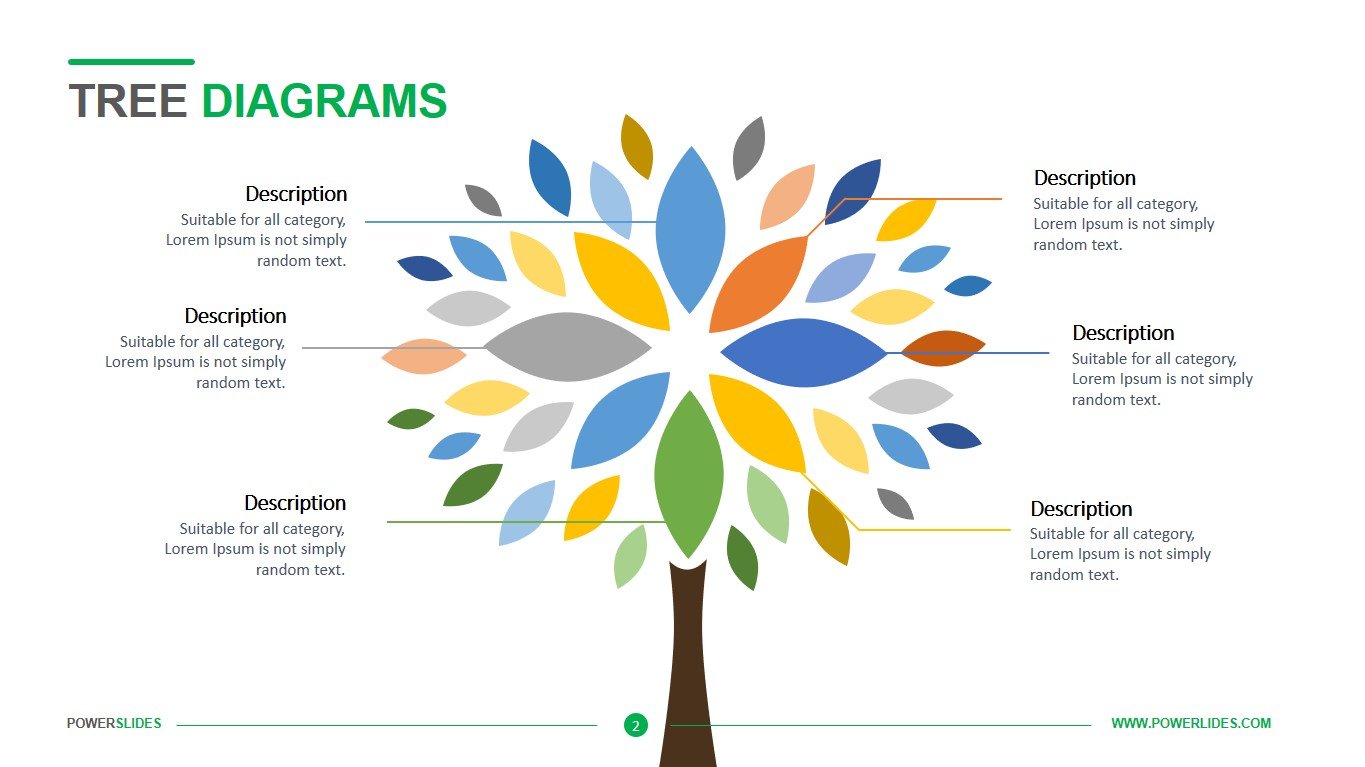
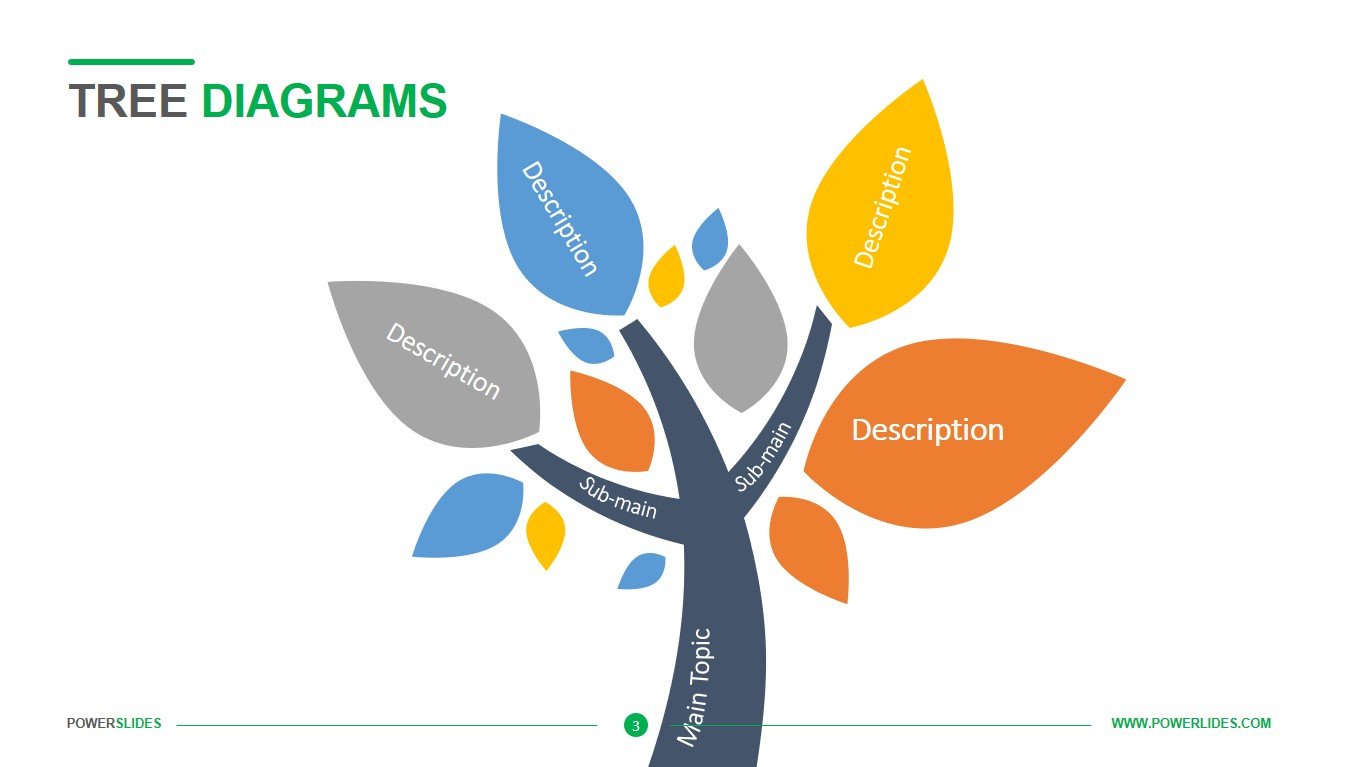
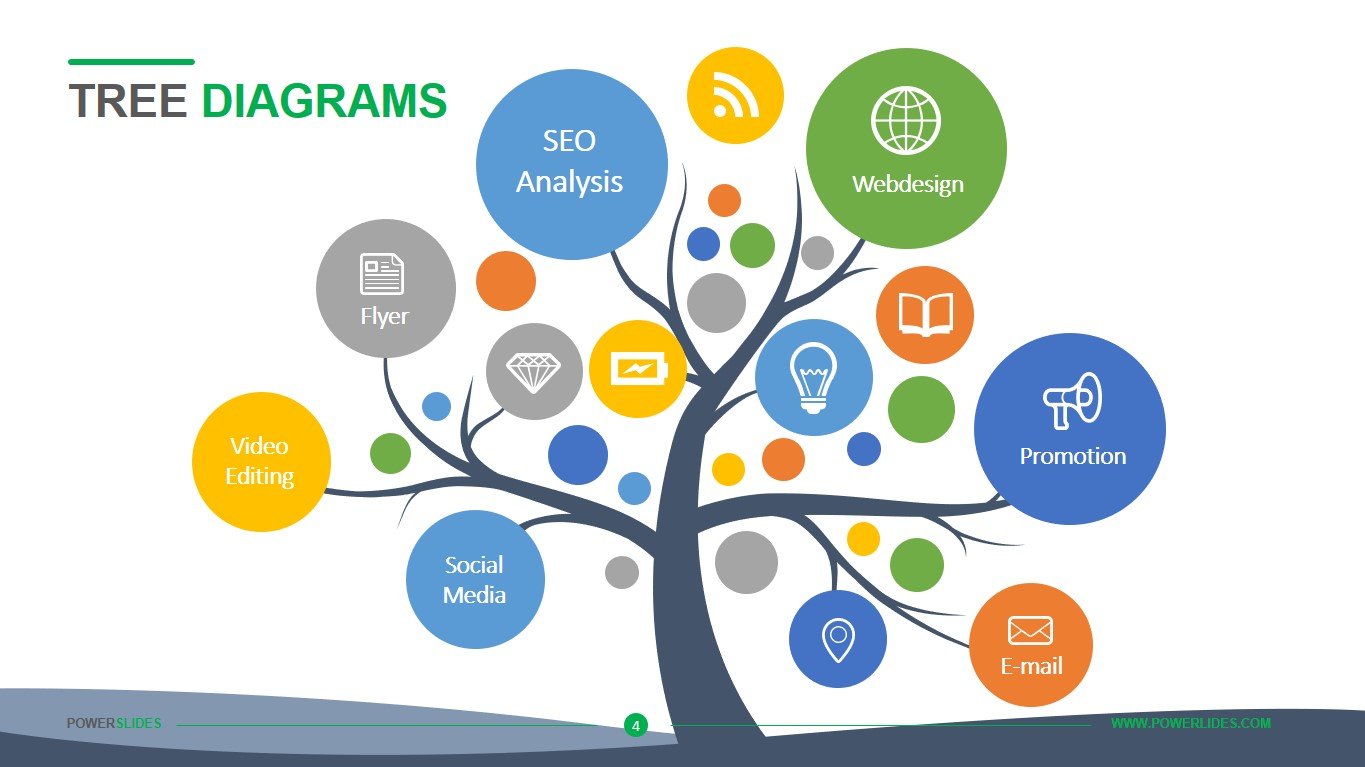
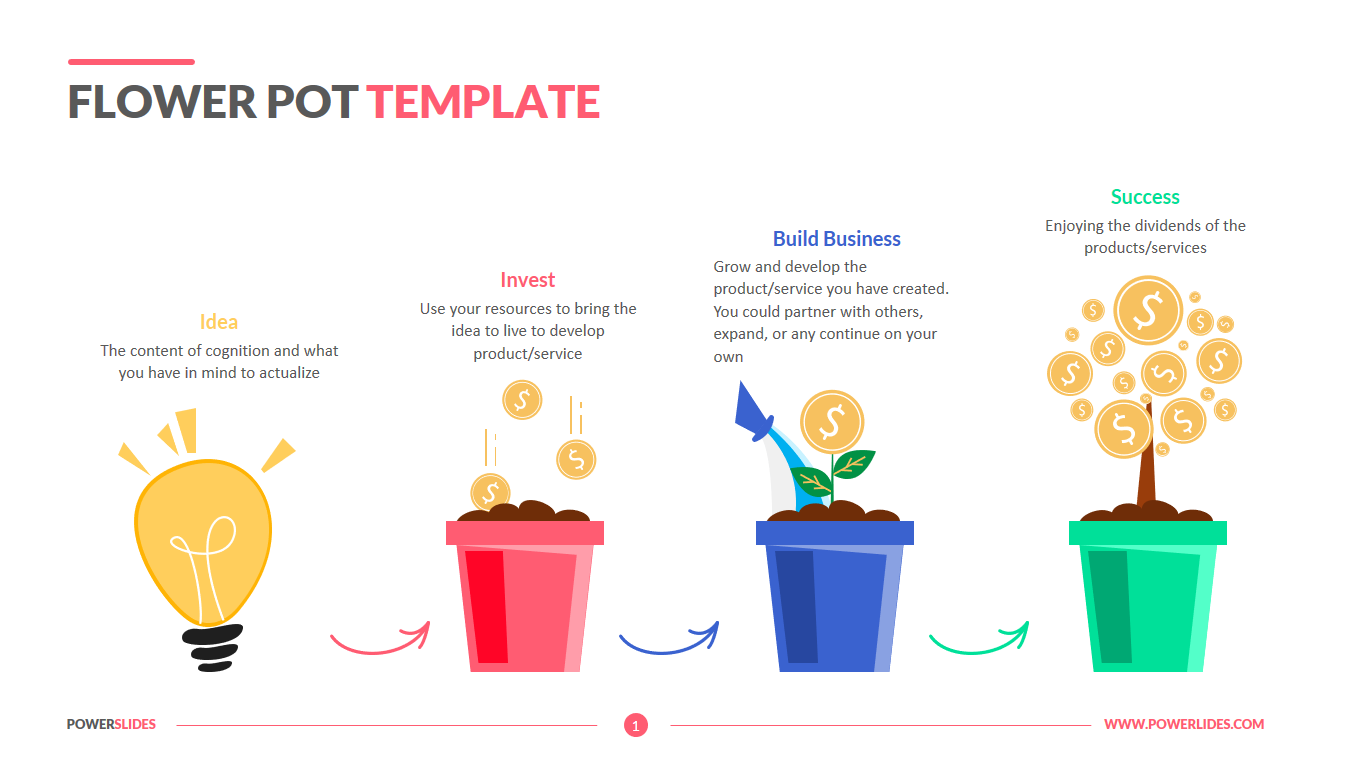
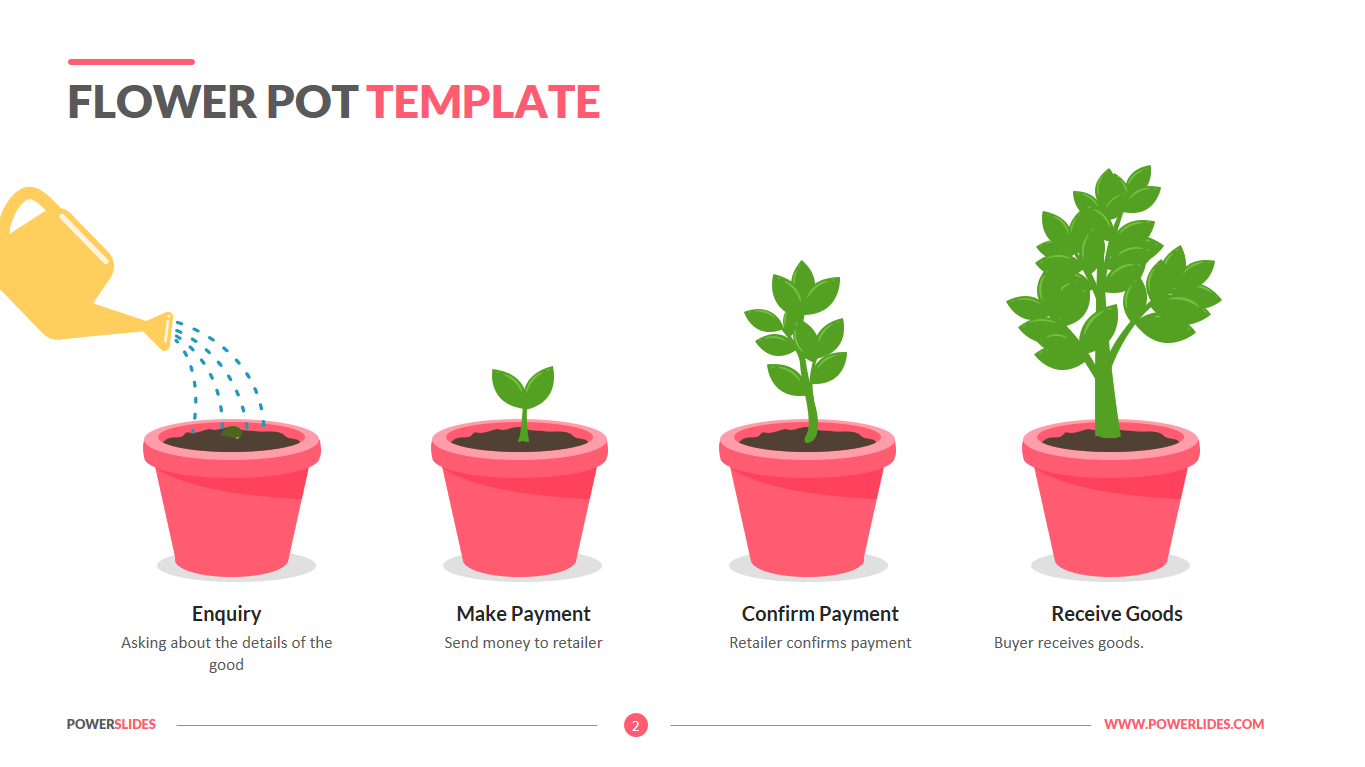
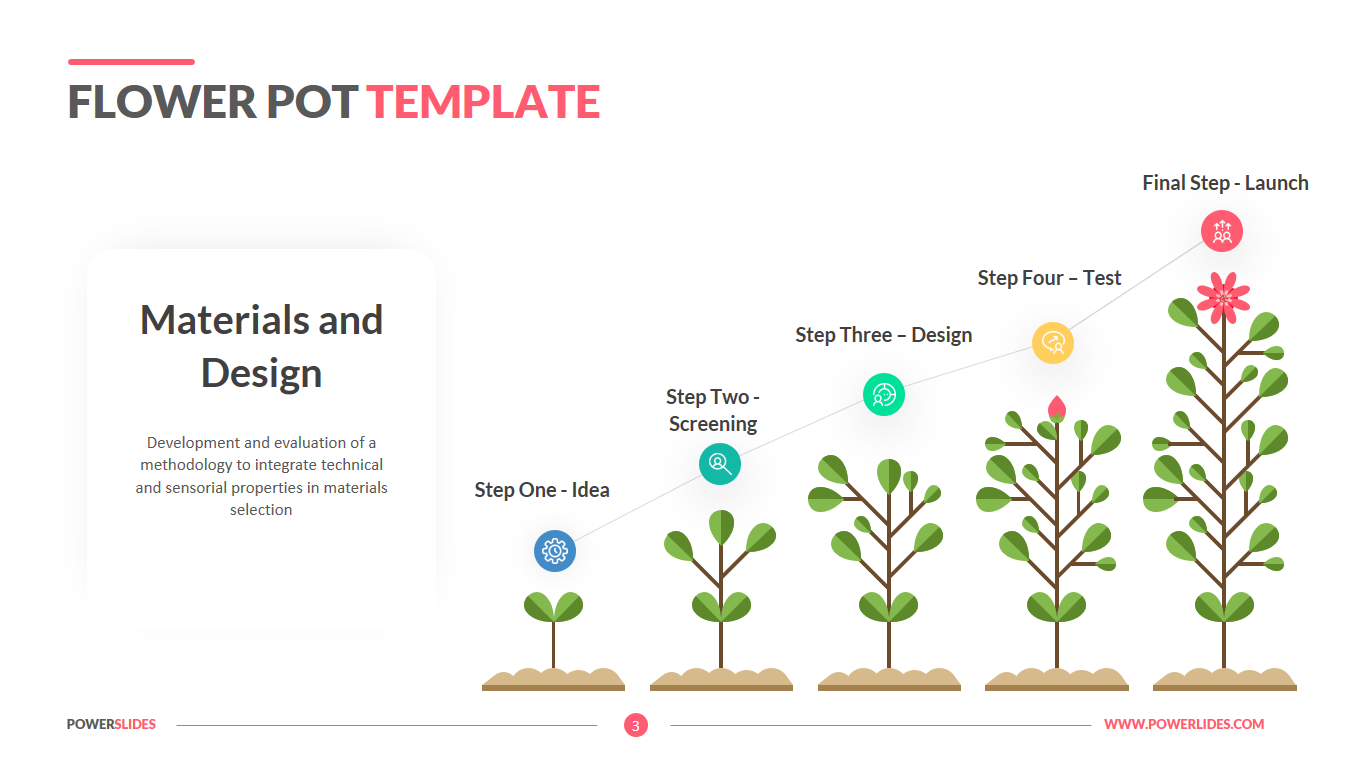
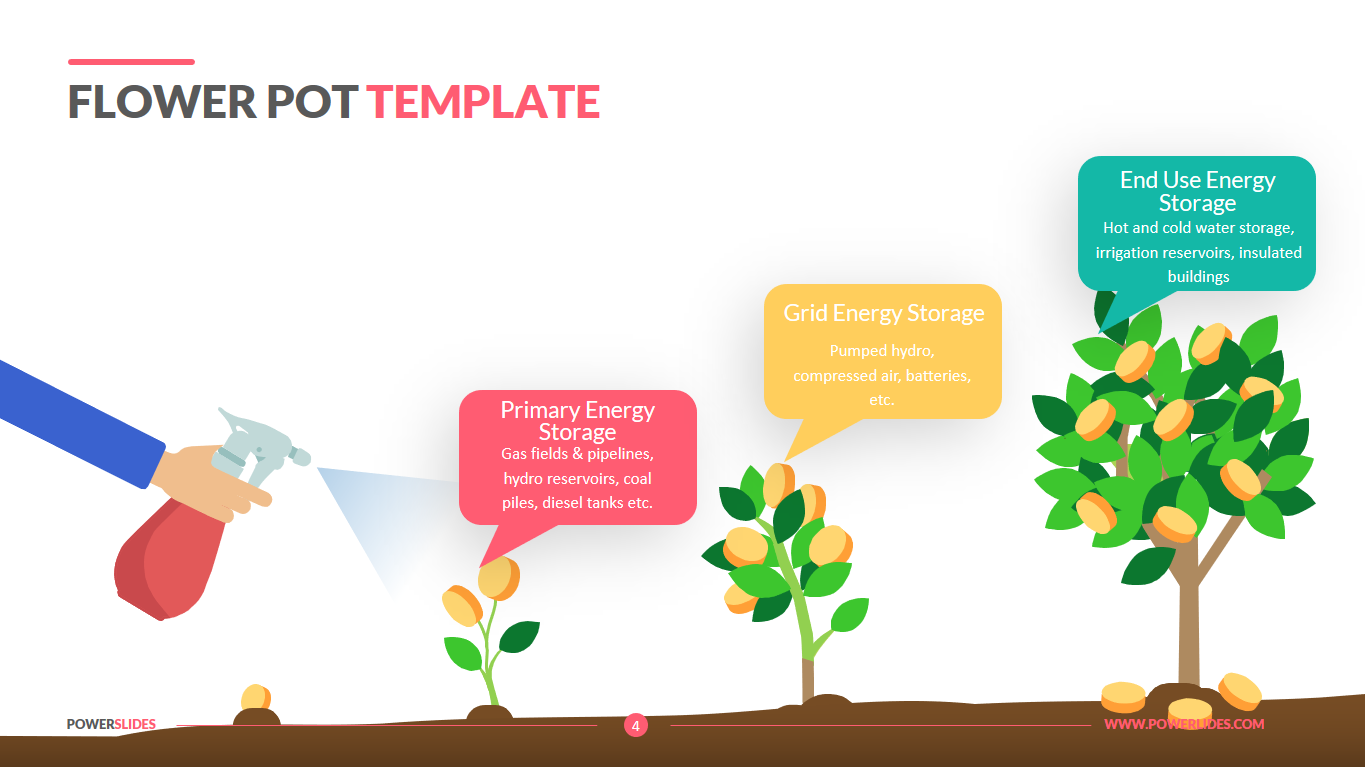
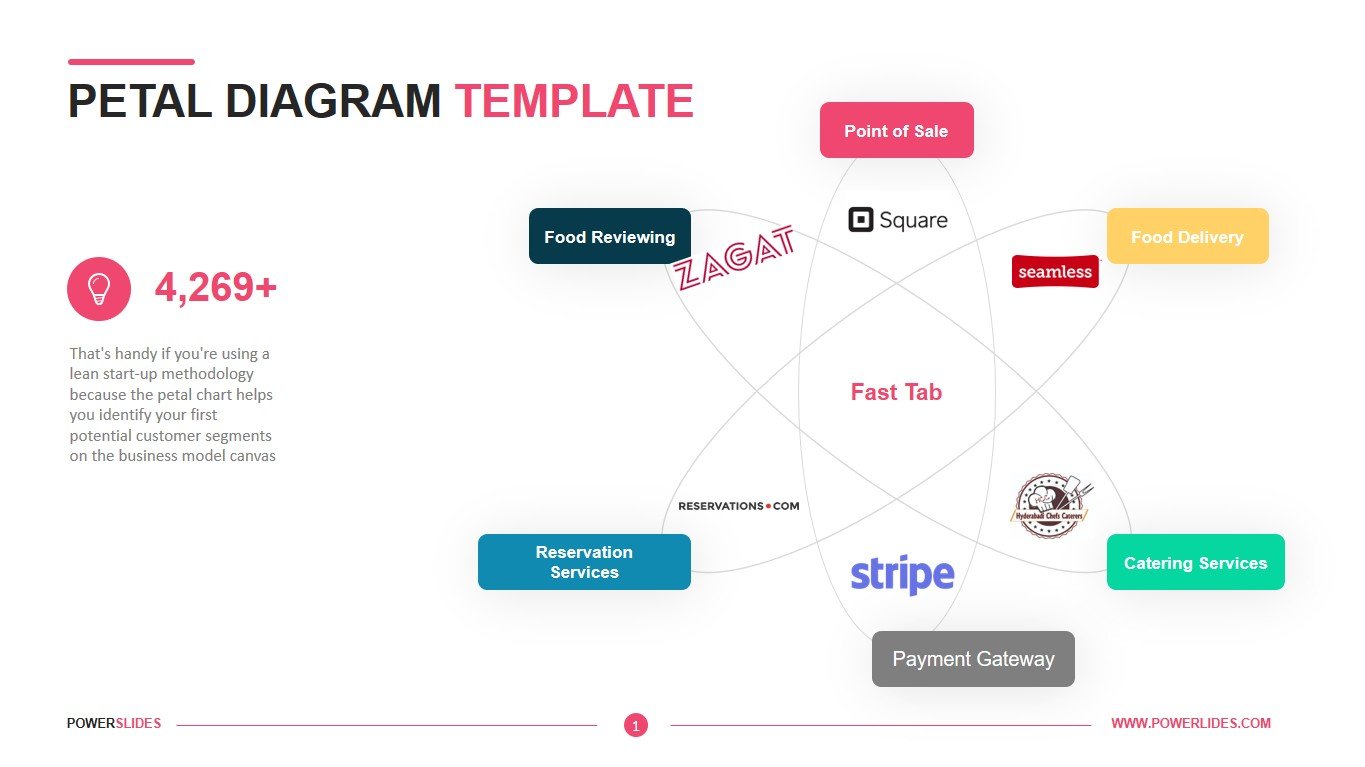
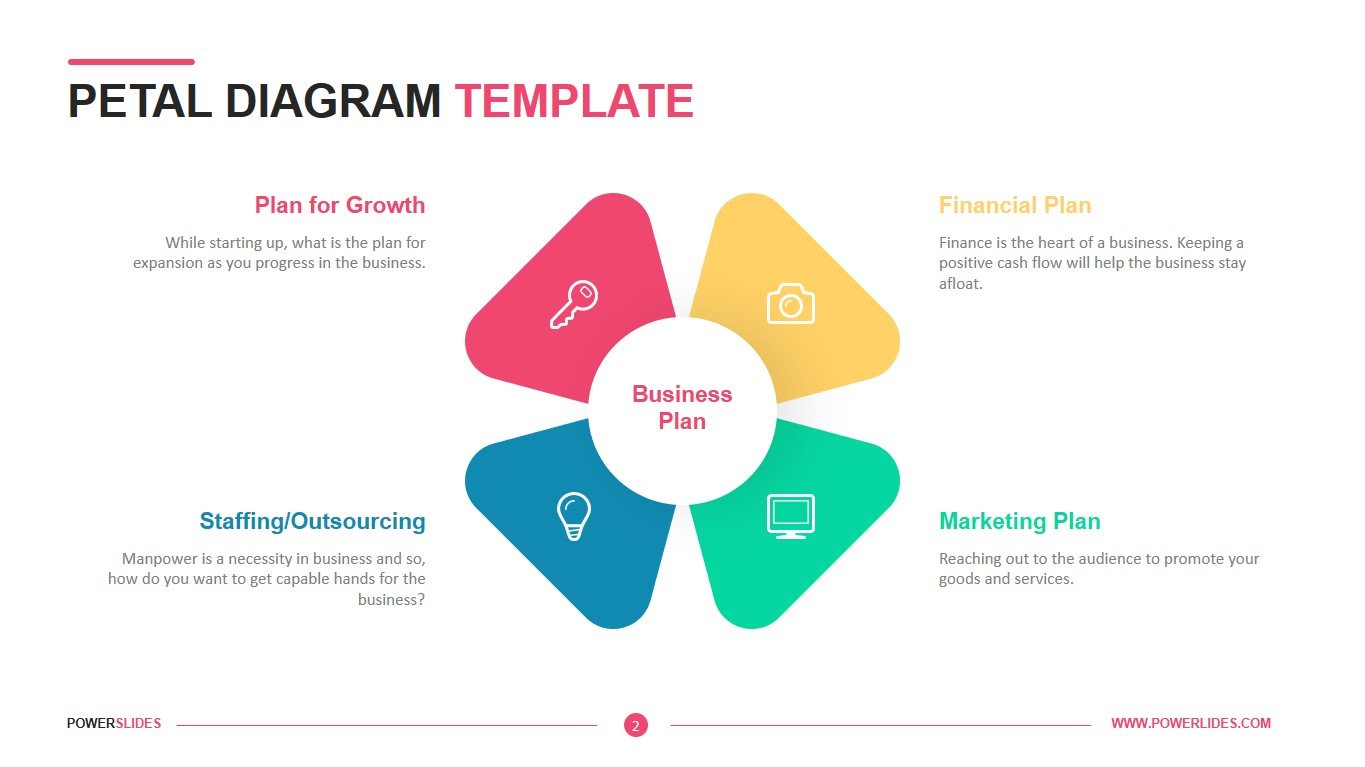
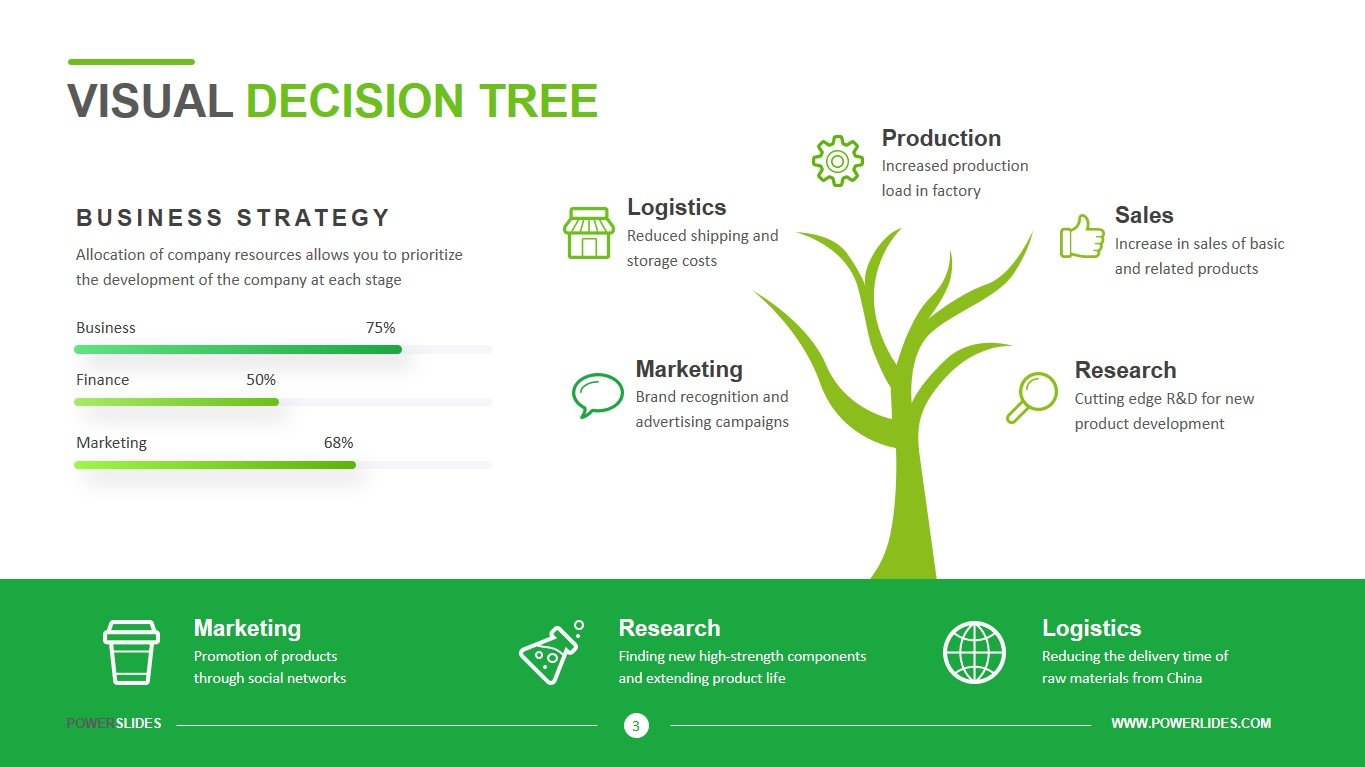
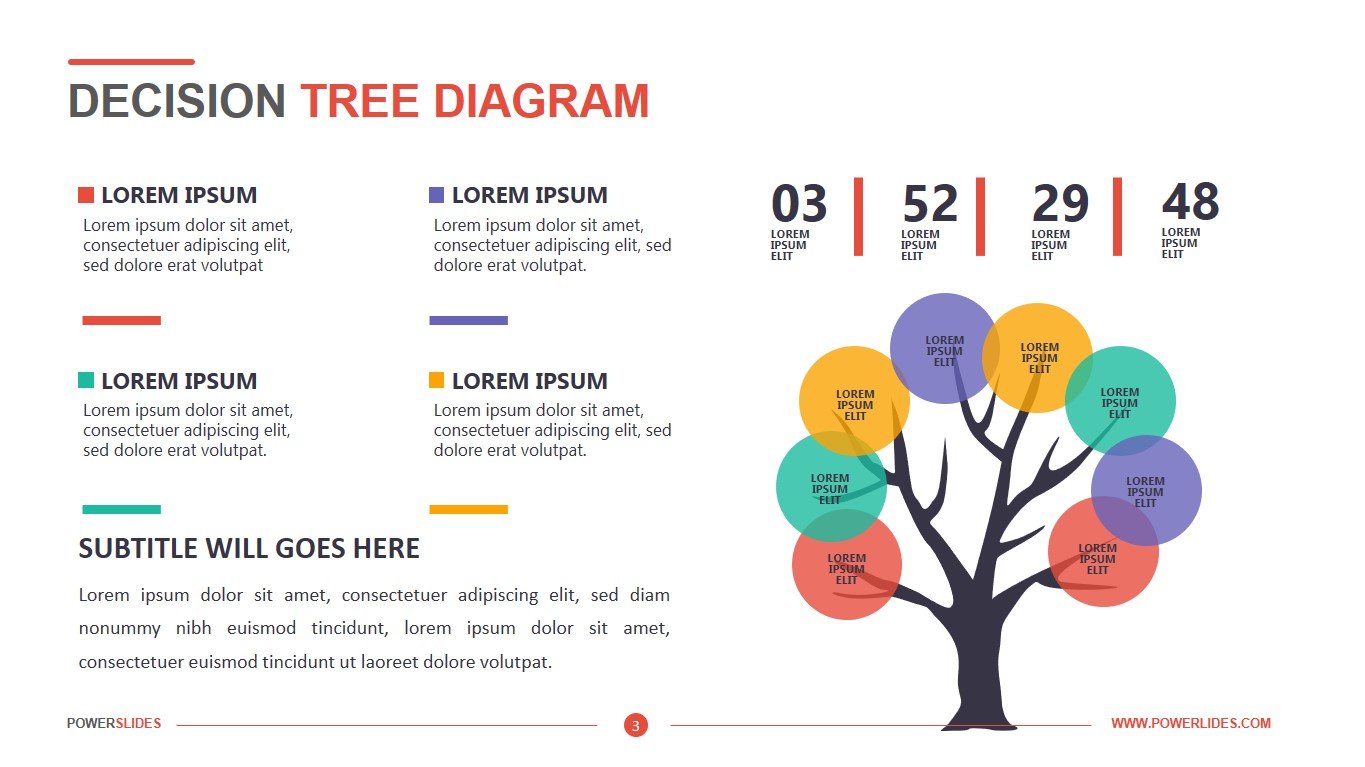
How to present your data beautifully and stylishly over several months? You can use a graph or stylish and bright tables. But many have already done this before you, and most likely the audience will not be interested in your report. How to be in this situation? Is there a solution? And if you represent the data in the form of a tree. You can use leaves of different colours and sizes to show the dynamics of your data. The size of the tree can reflect the duration of the analysis period. This presentation of data will make your presentation memorable, and you can achieve your presentation goal. Tree infographics can also be used to prepare information for potential investors in your project. The tree has always been associated with growth. Accordingly, your project will inspire confidence and confidence in the success of your event and, accordingly, the growth of investors’ profits. Also, tree infographics can be used as personal experience (tree roots), trunk (generally accepted opinion on the problem), leaves (alternative solutions). This method of analysis can be used in the field of programming, medicine when developing a non-standard strategy.
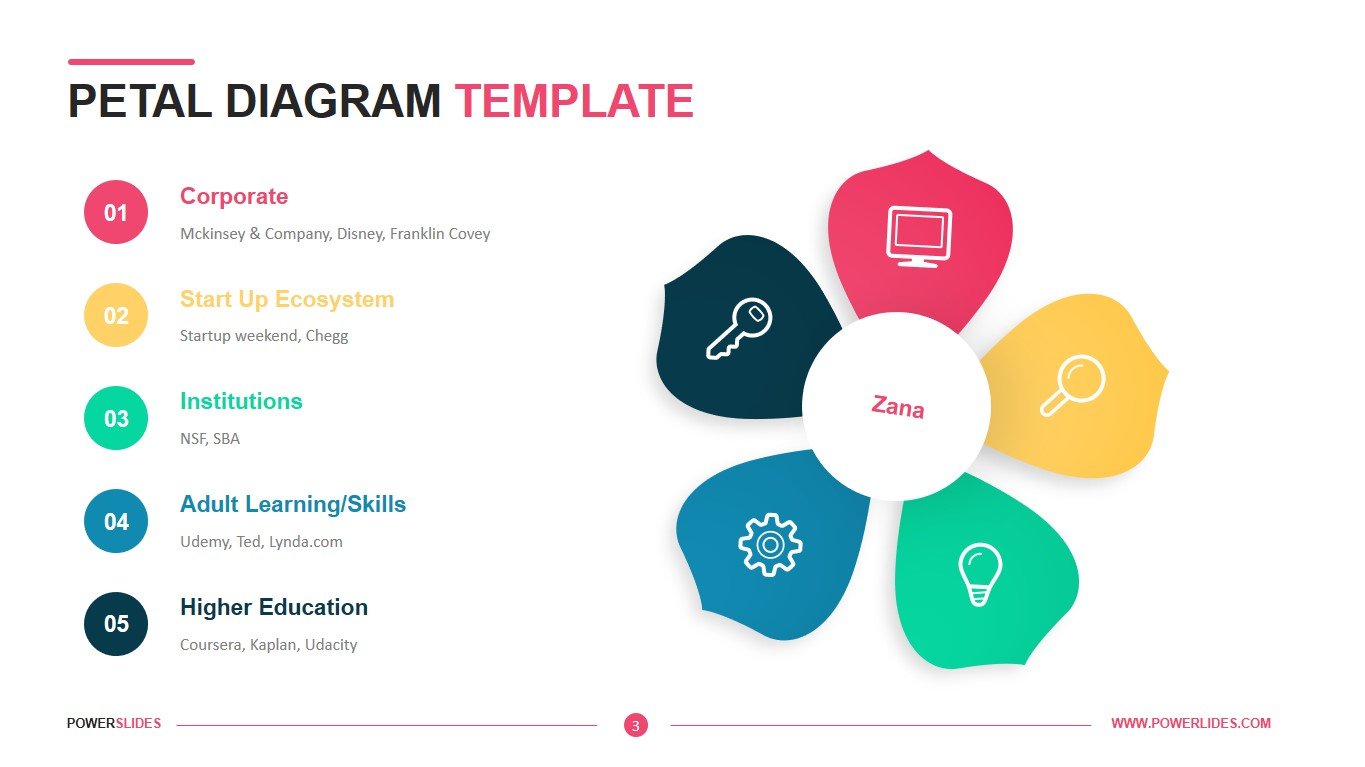
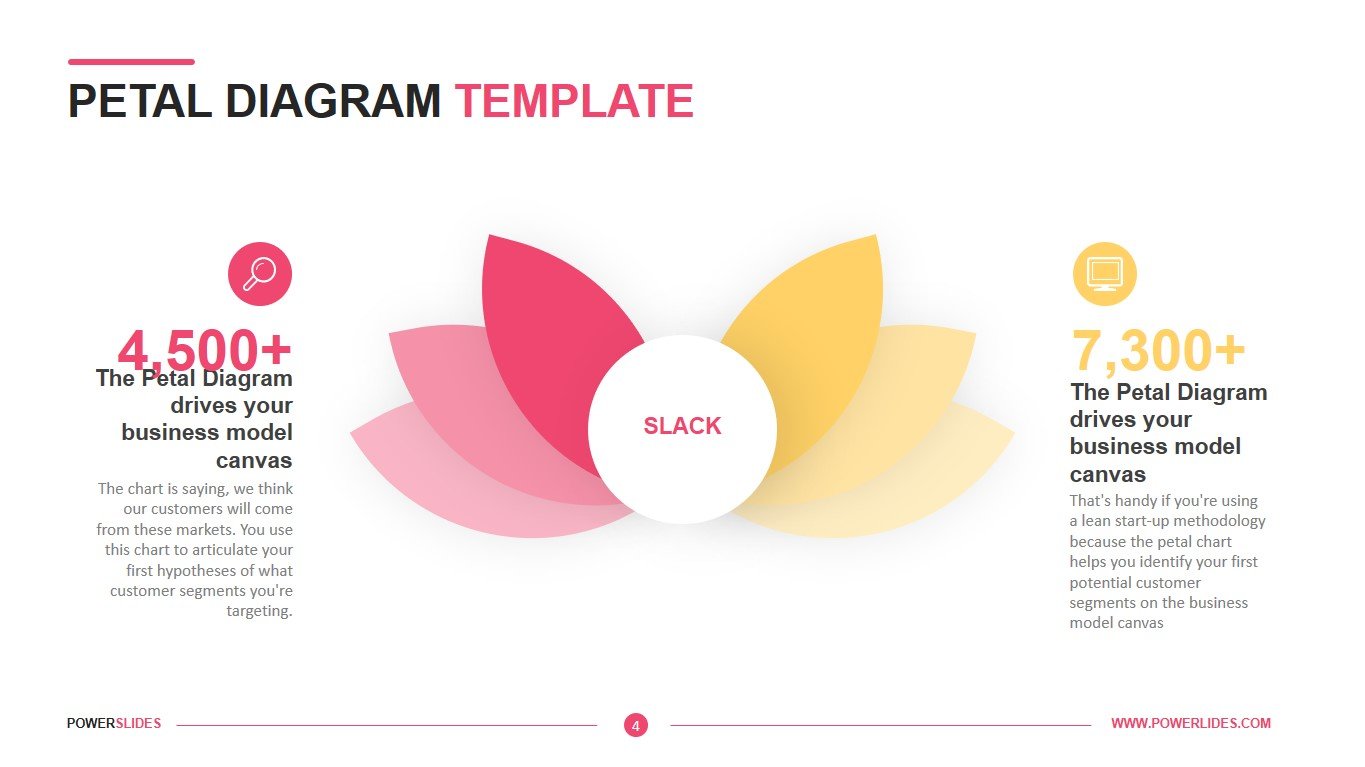
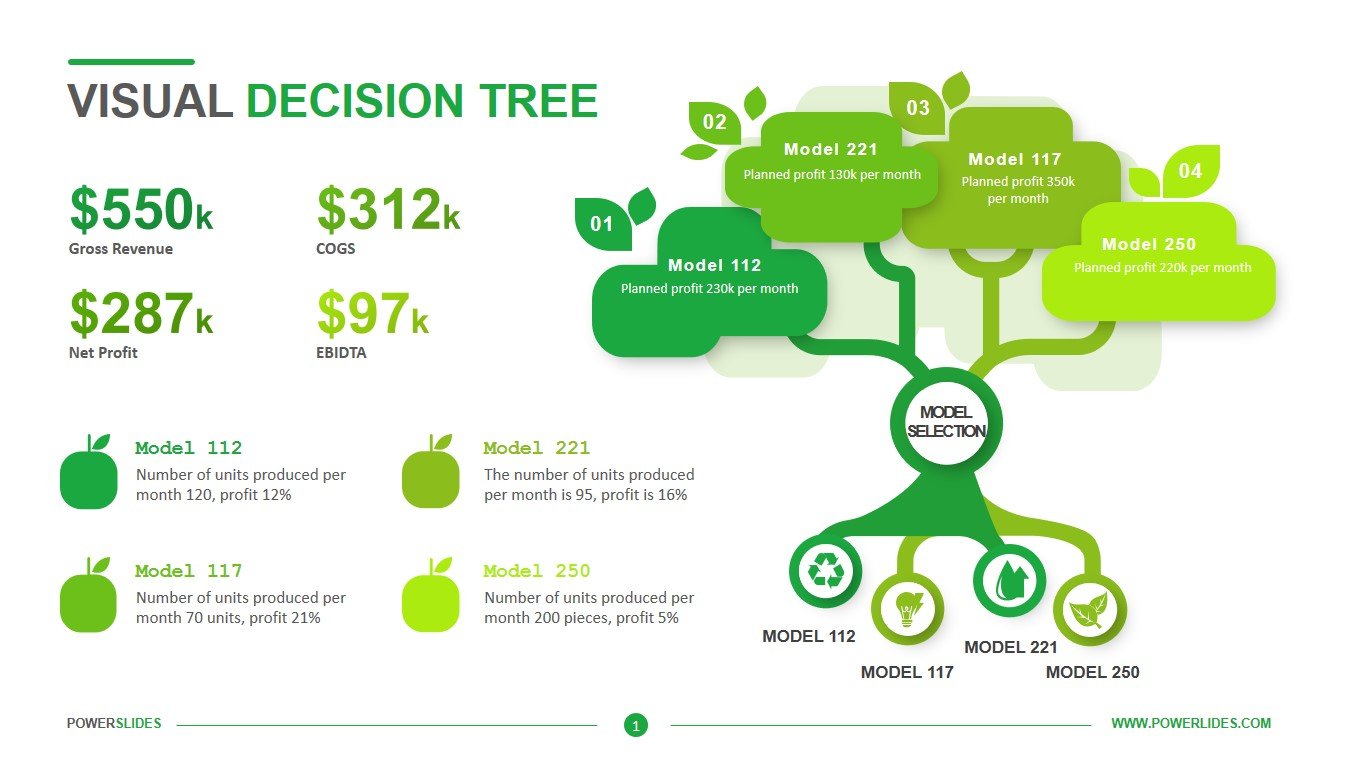
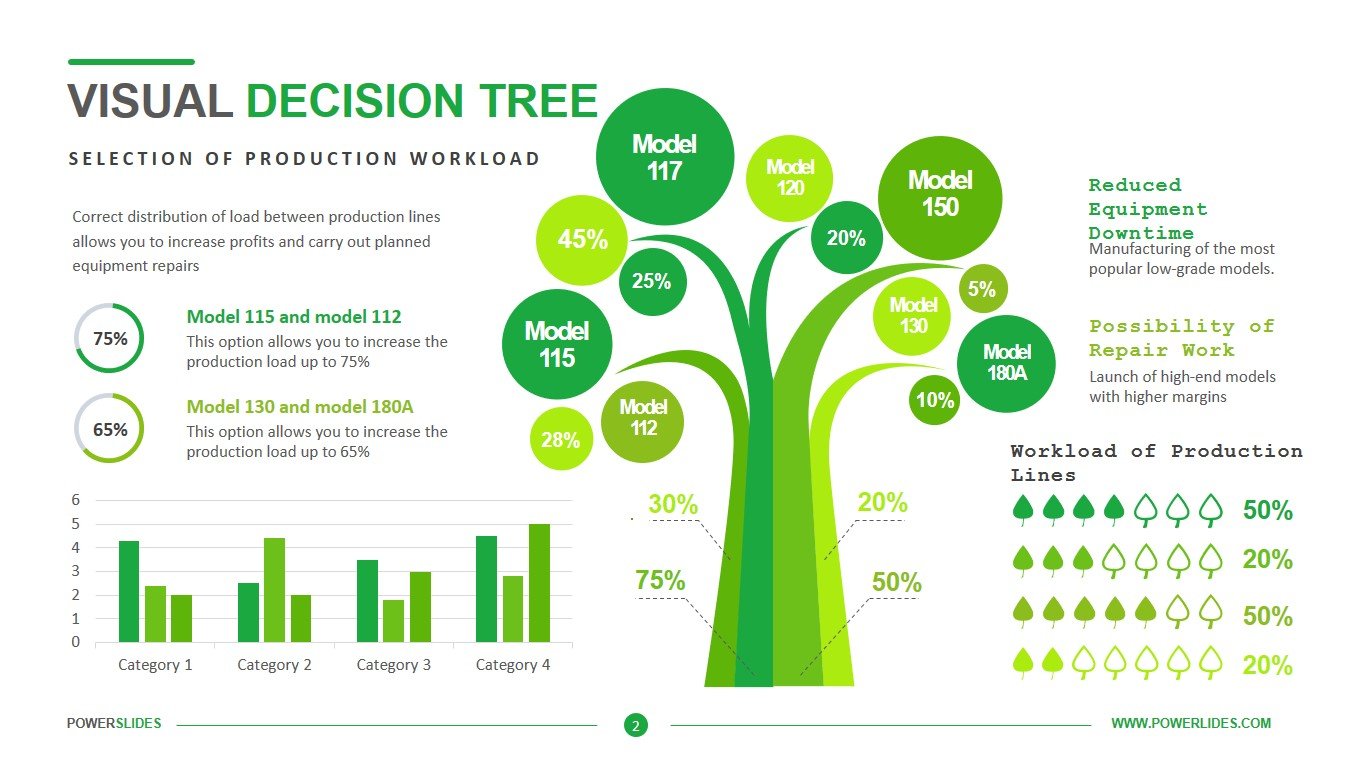
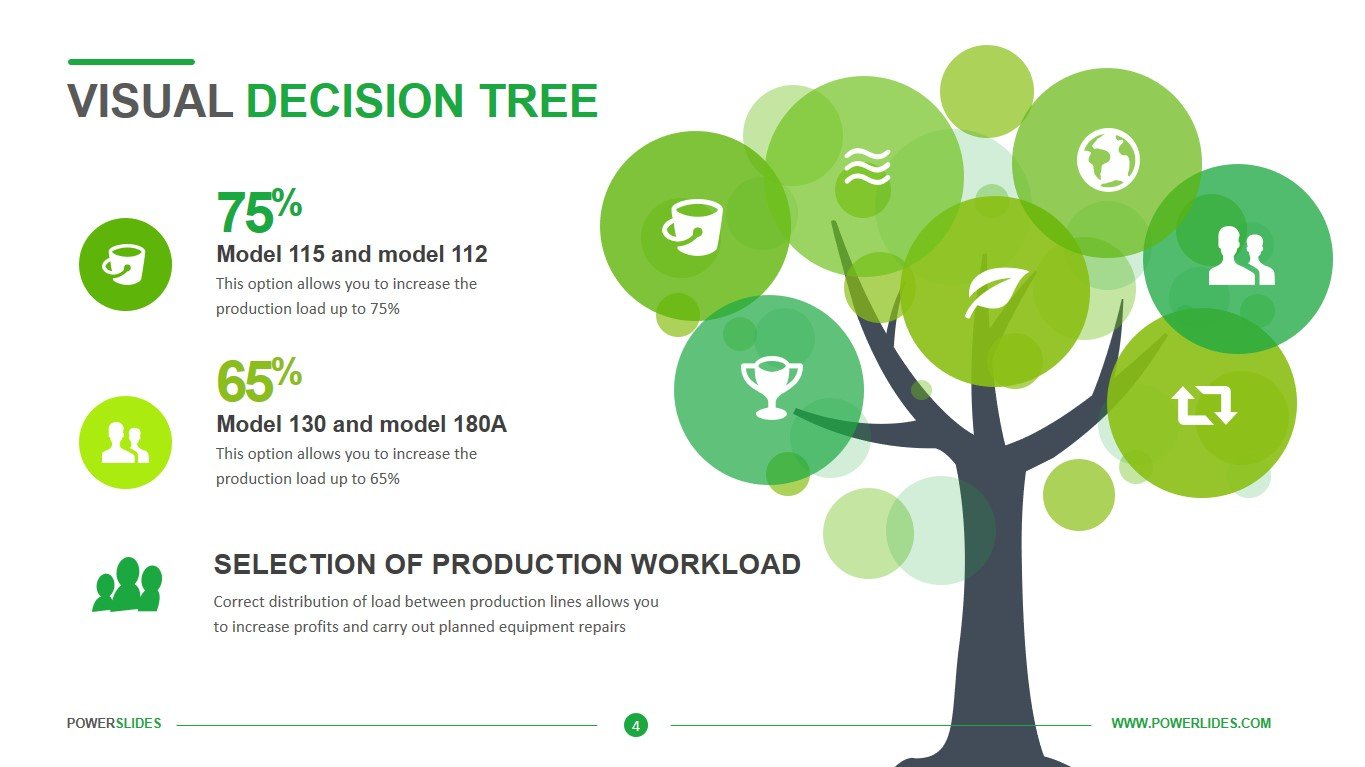
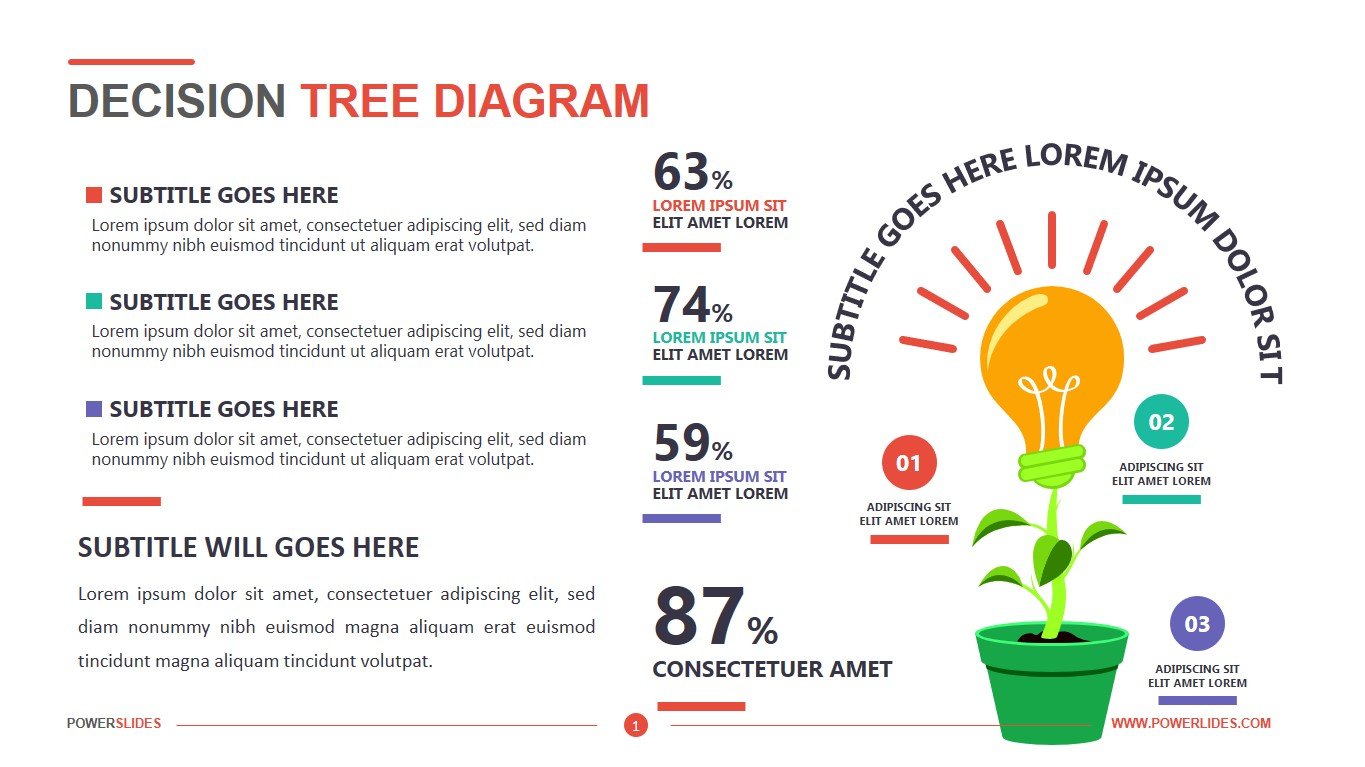
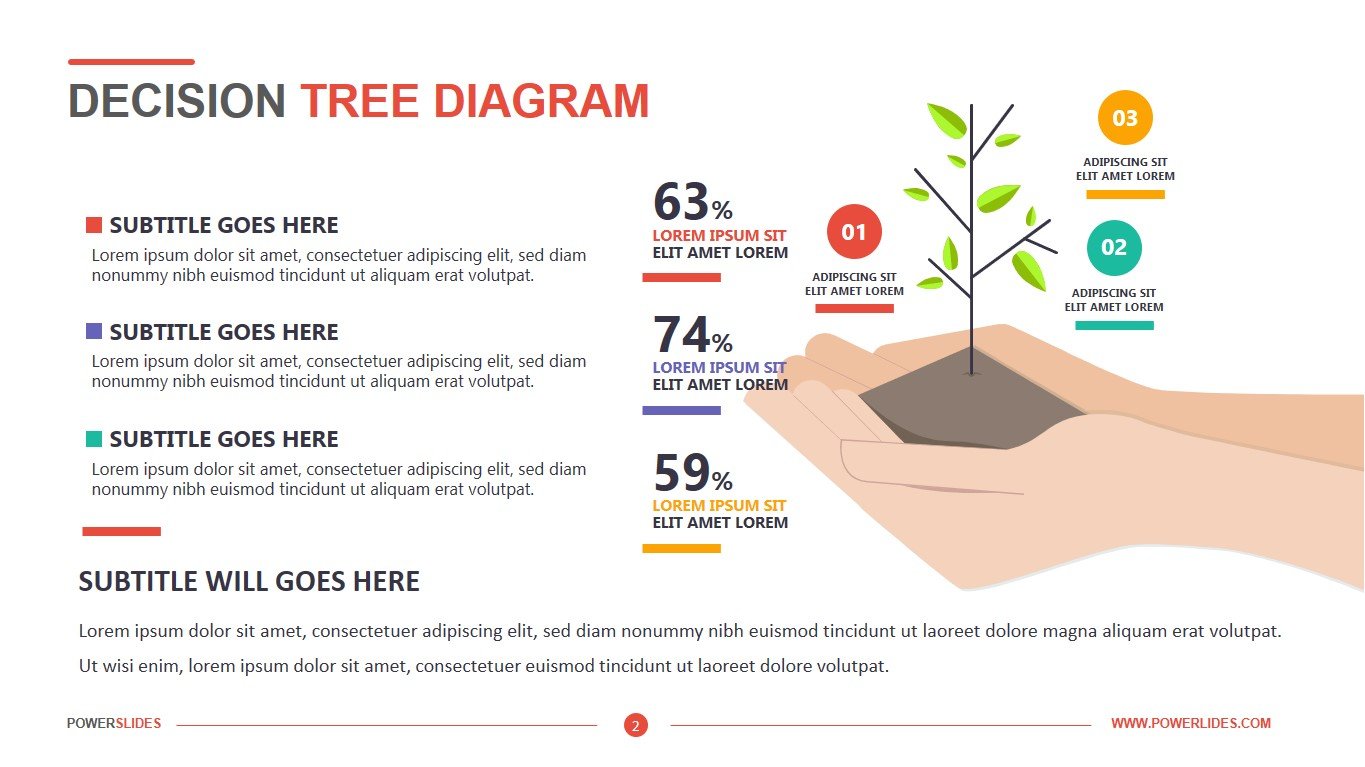
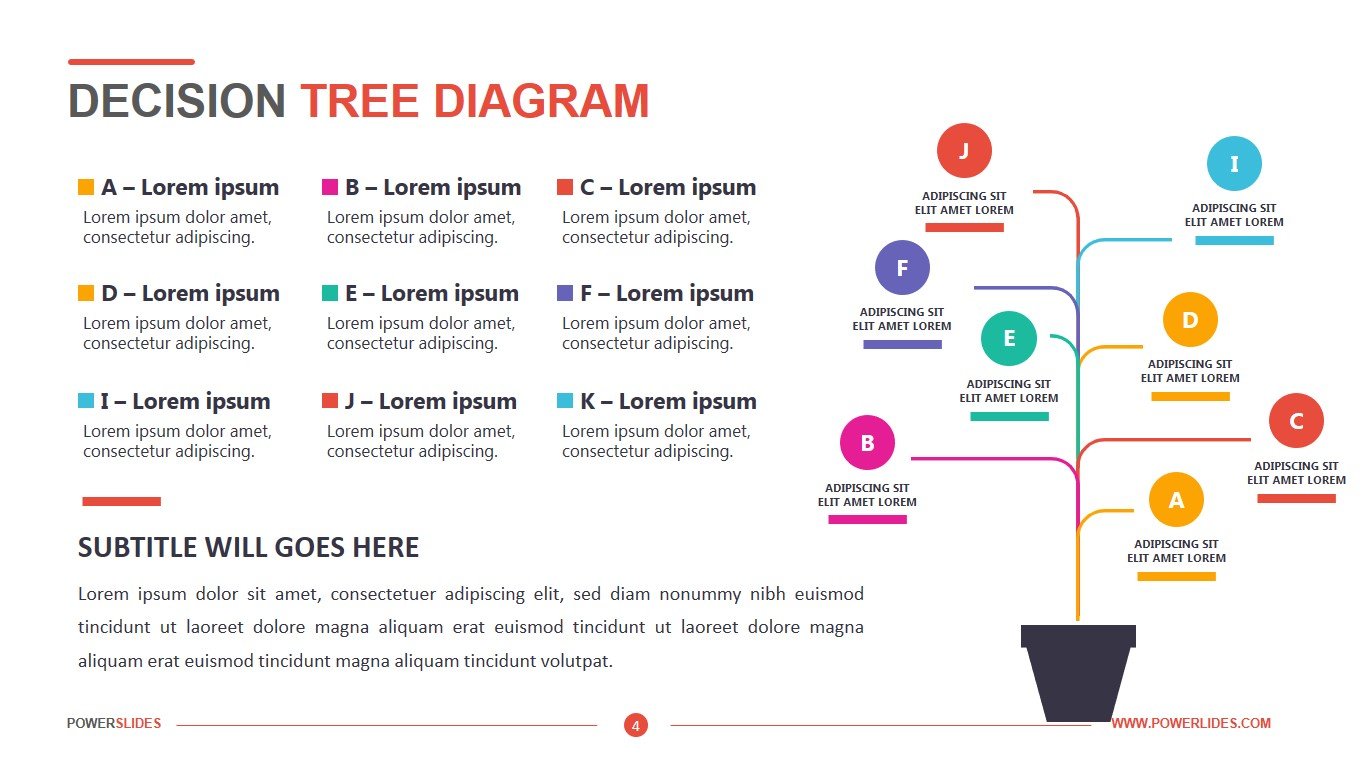
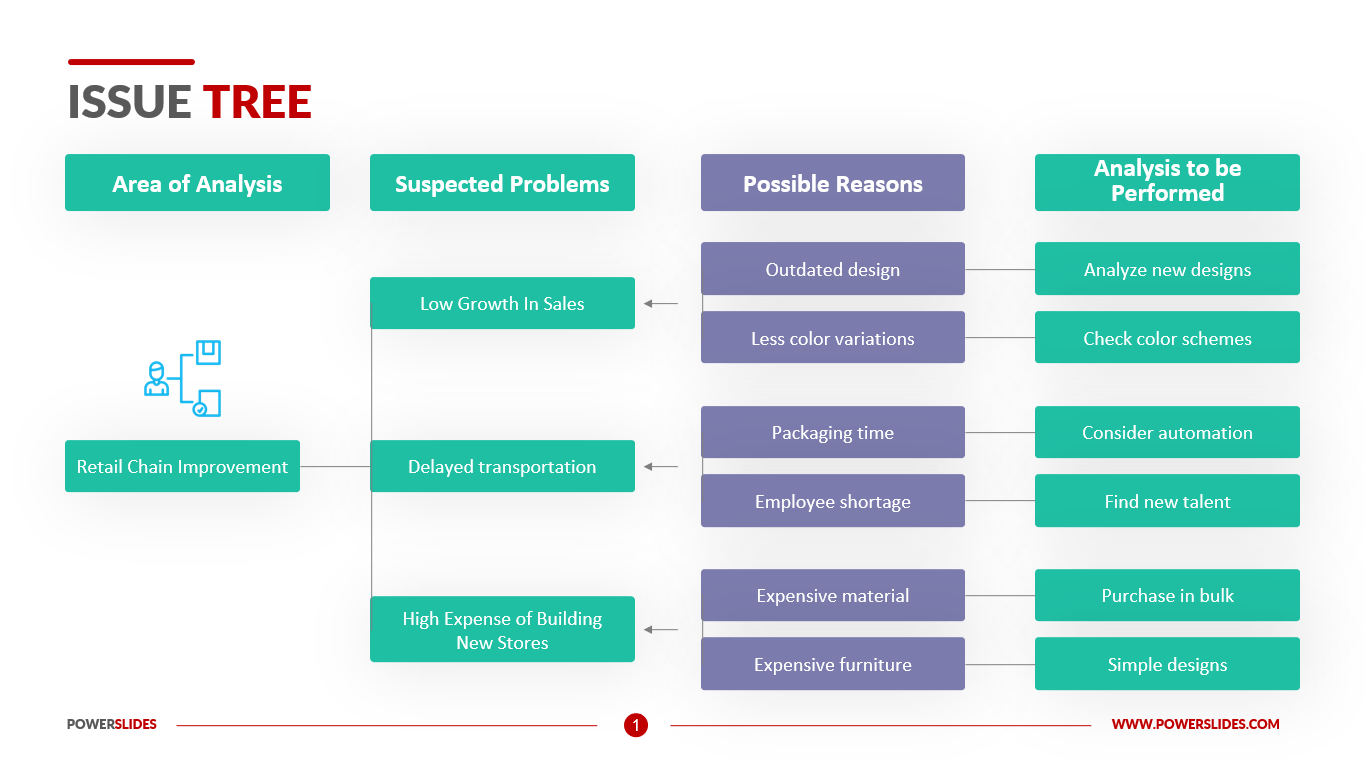
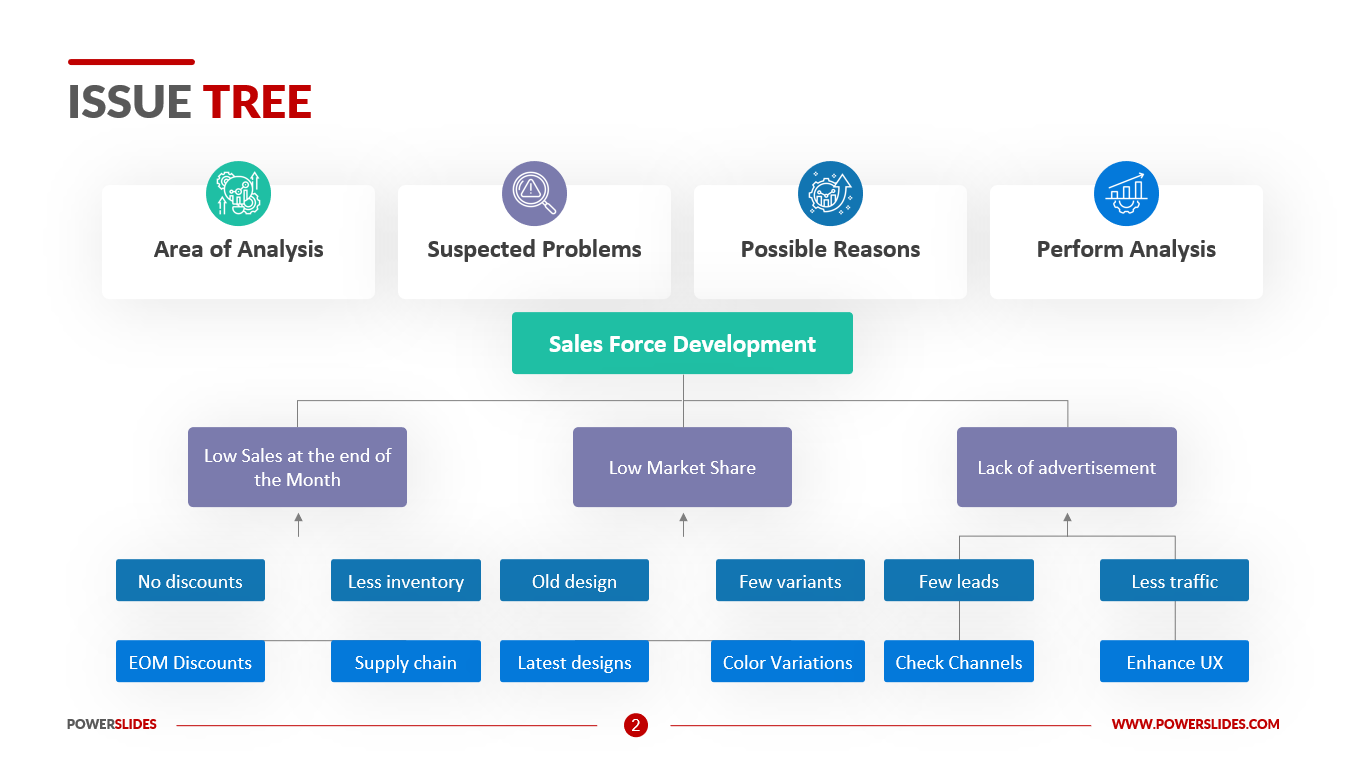
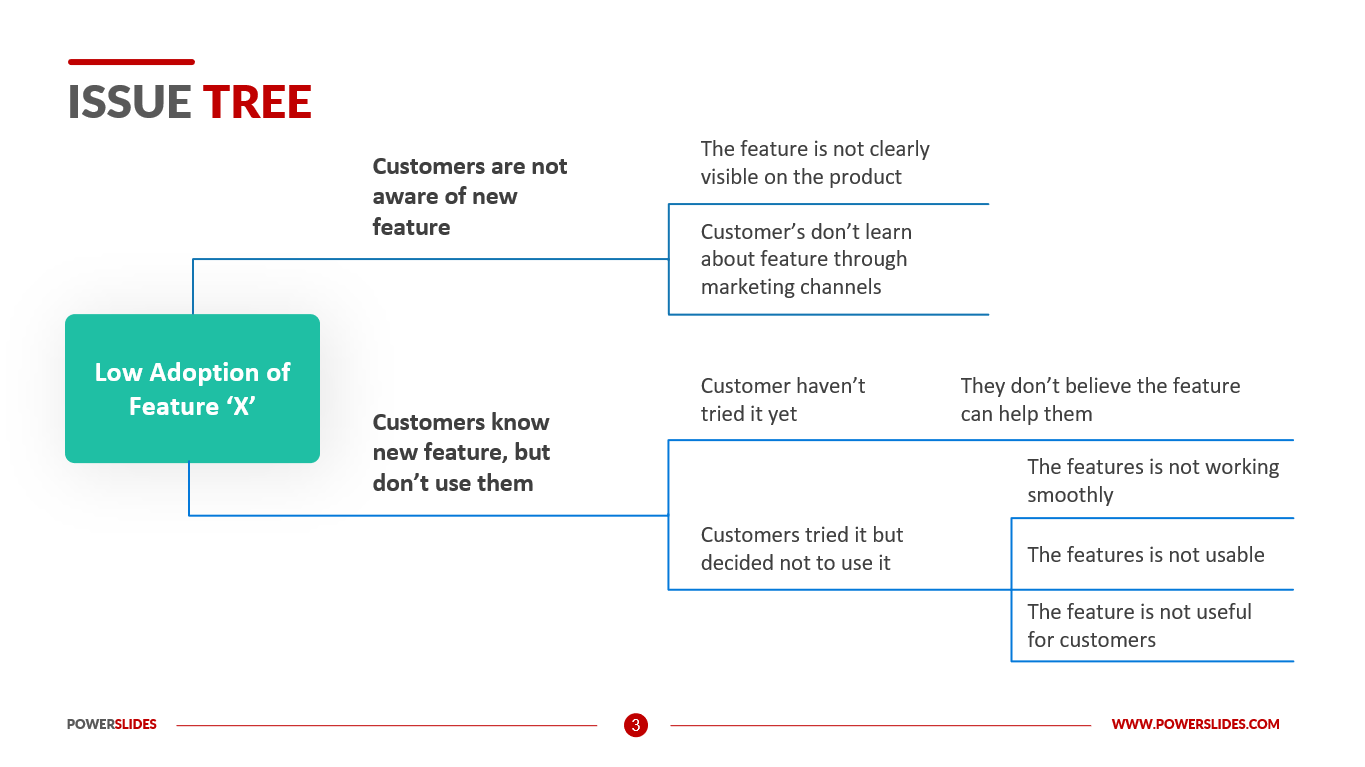
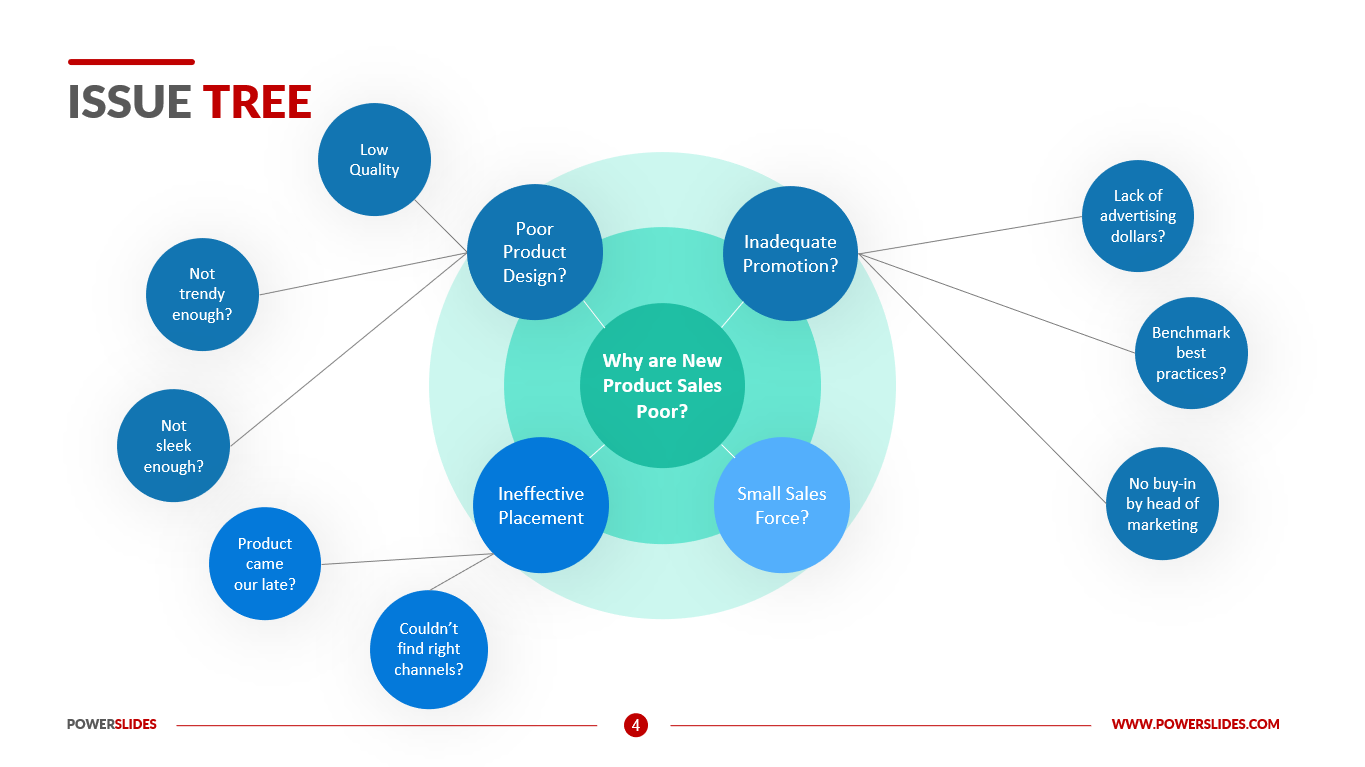
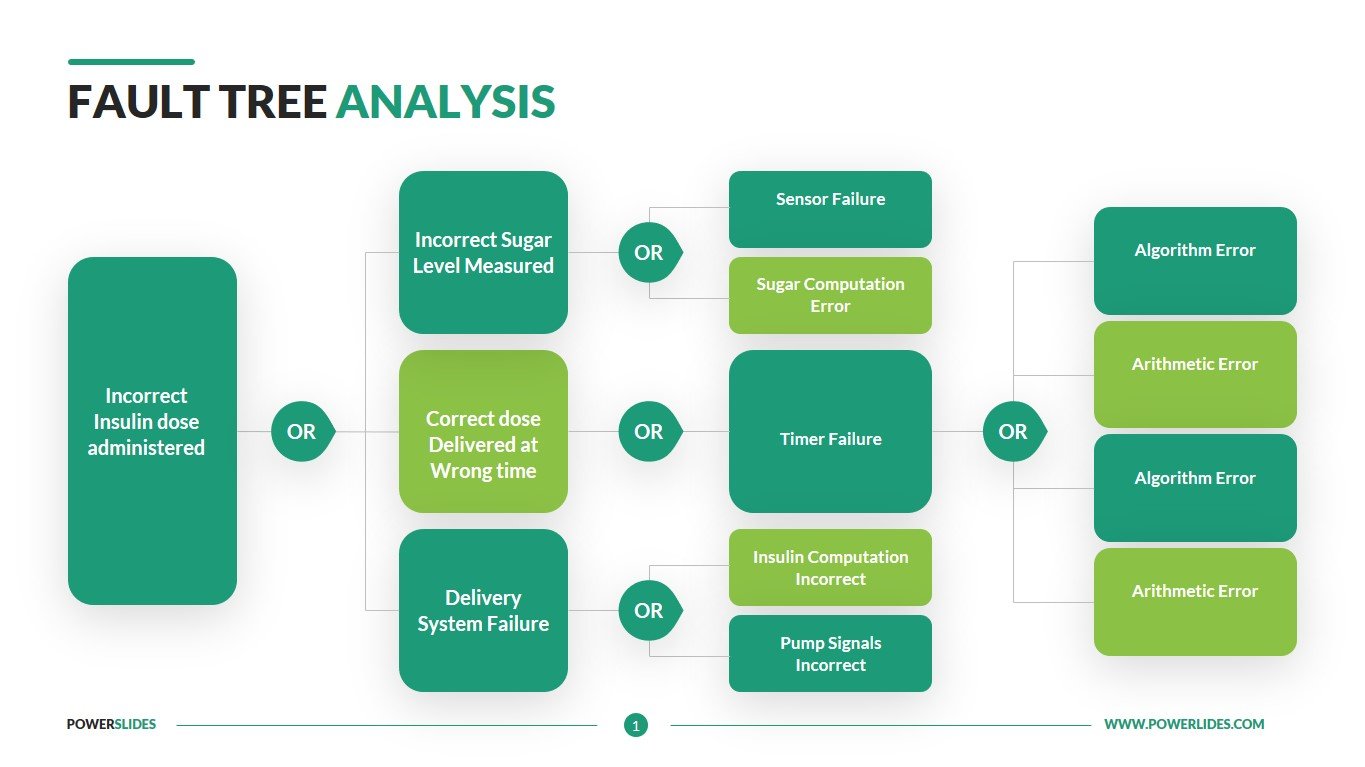
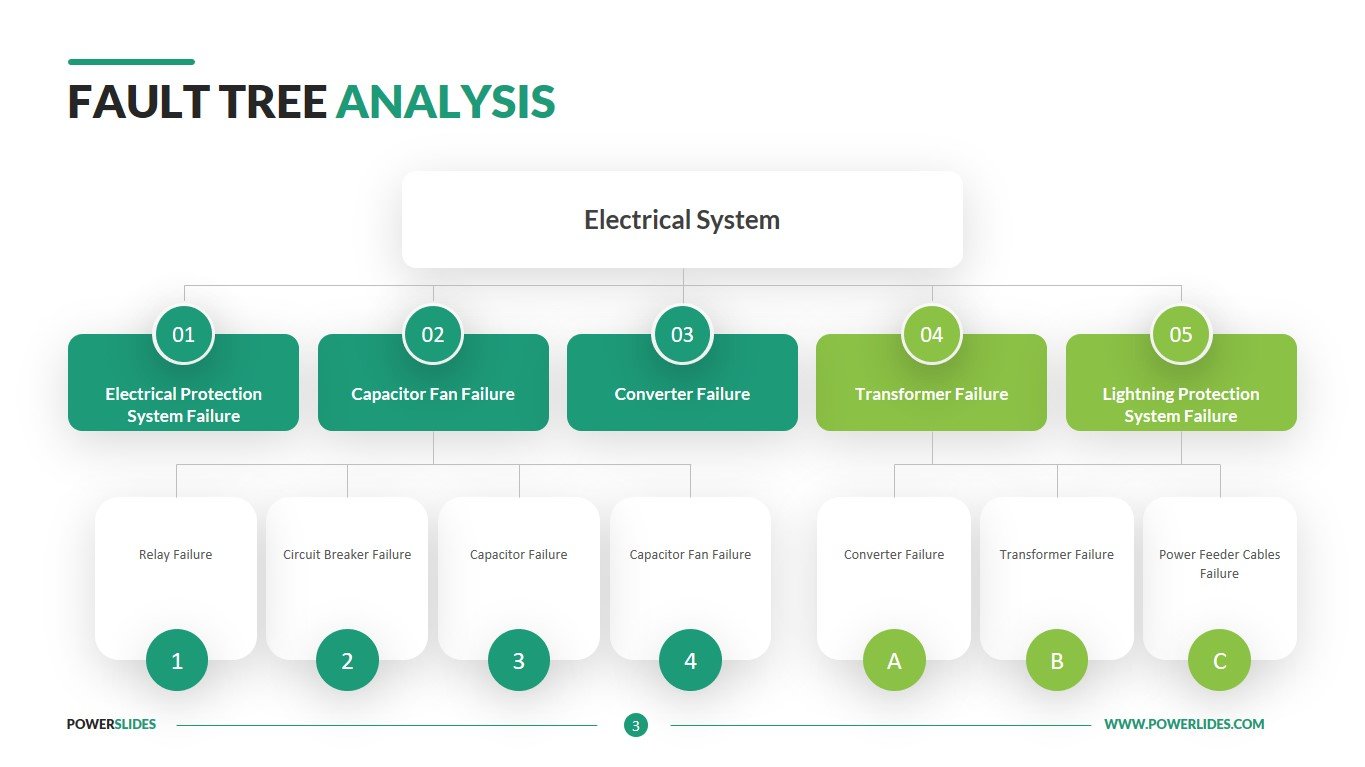
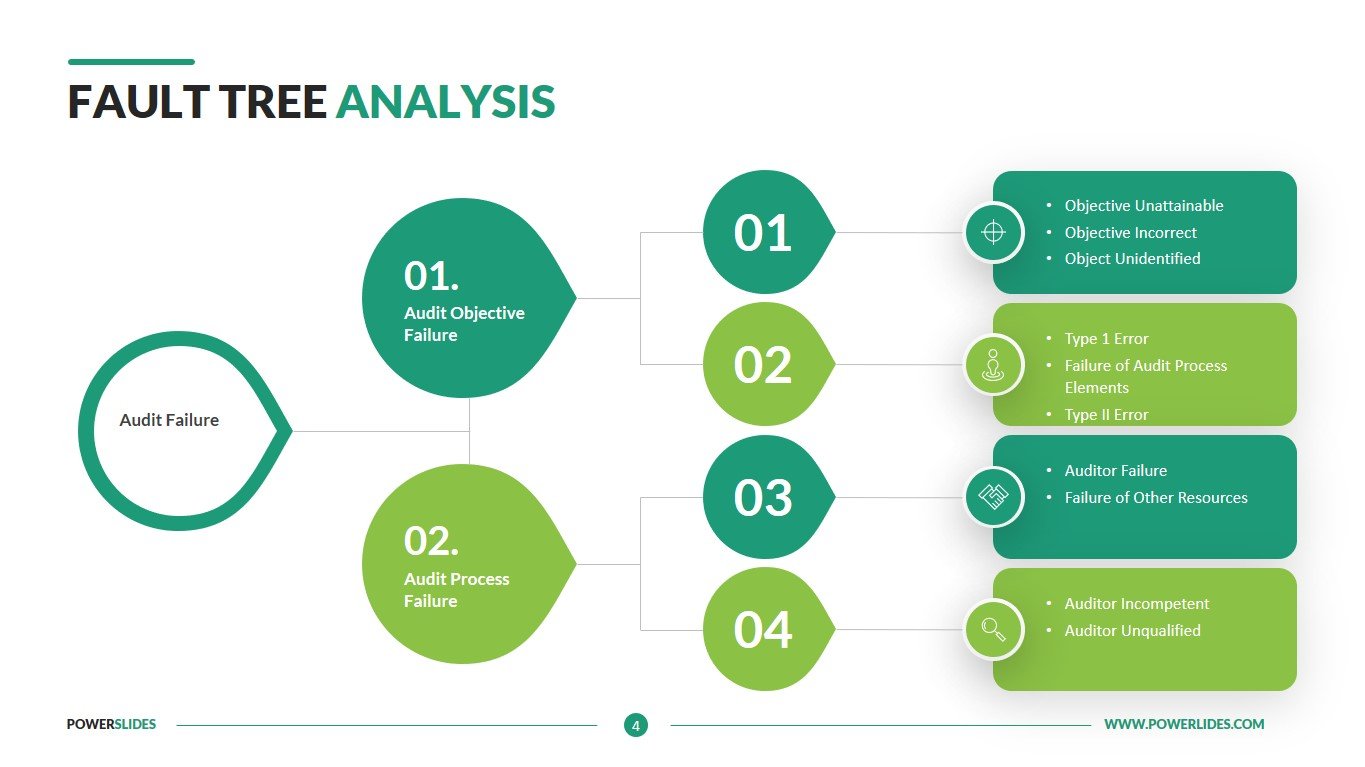
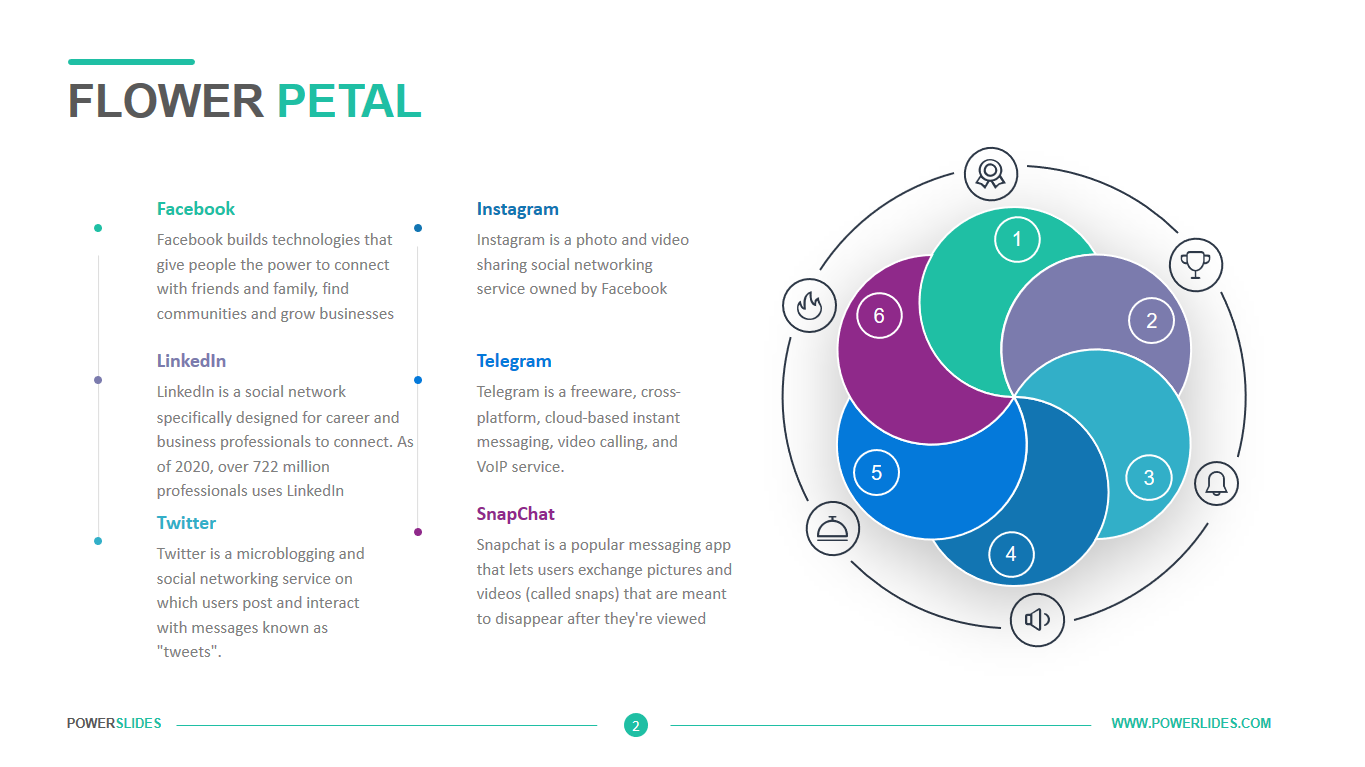
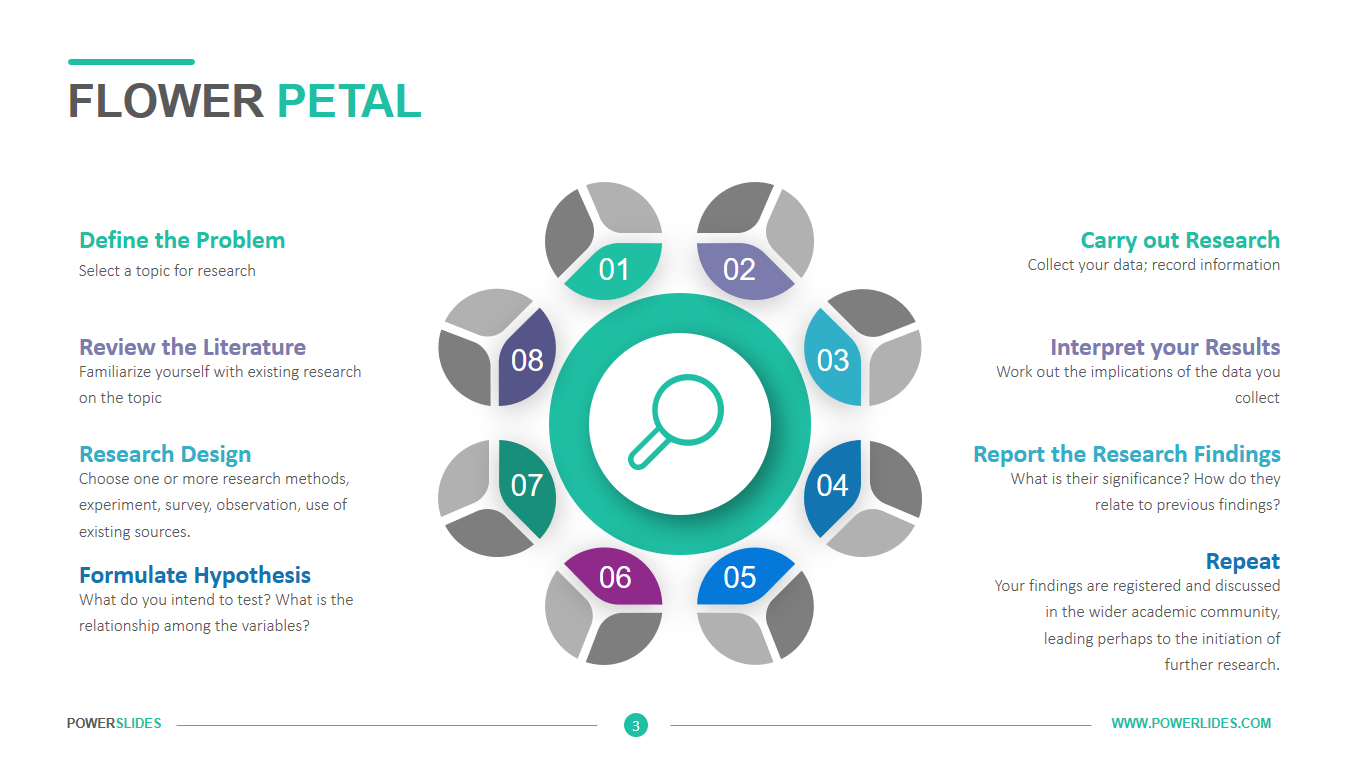
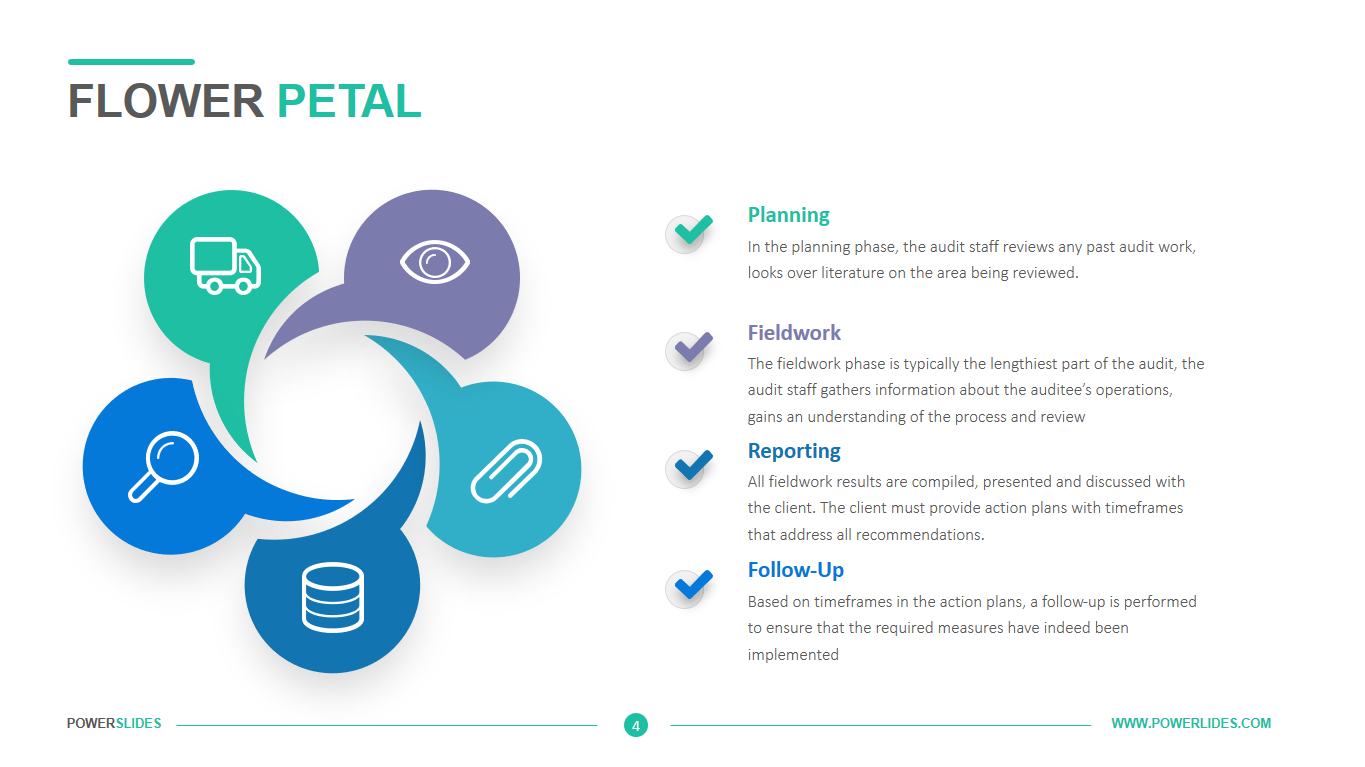
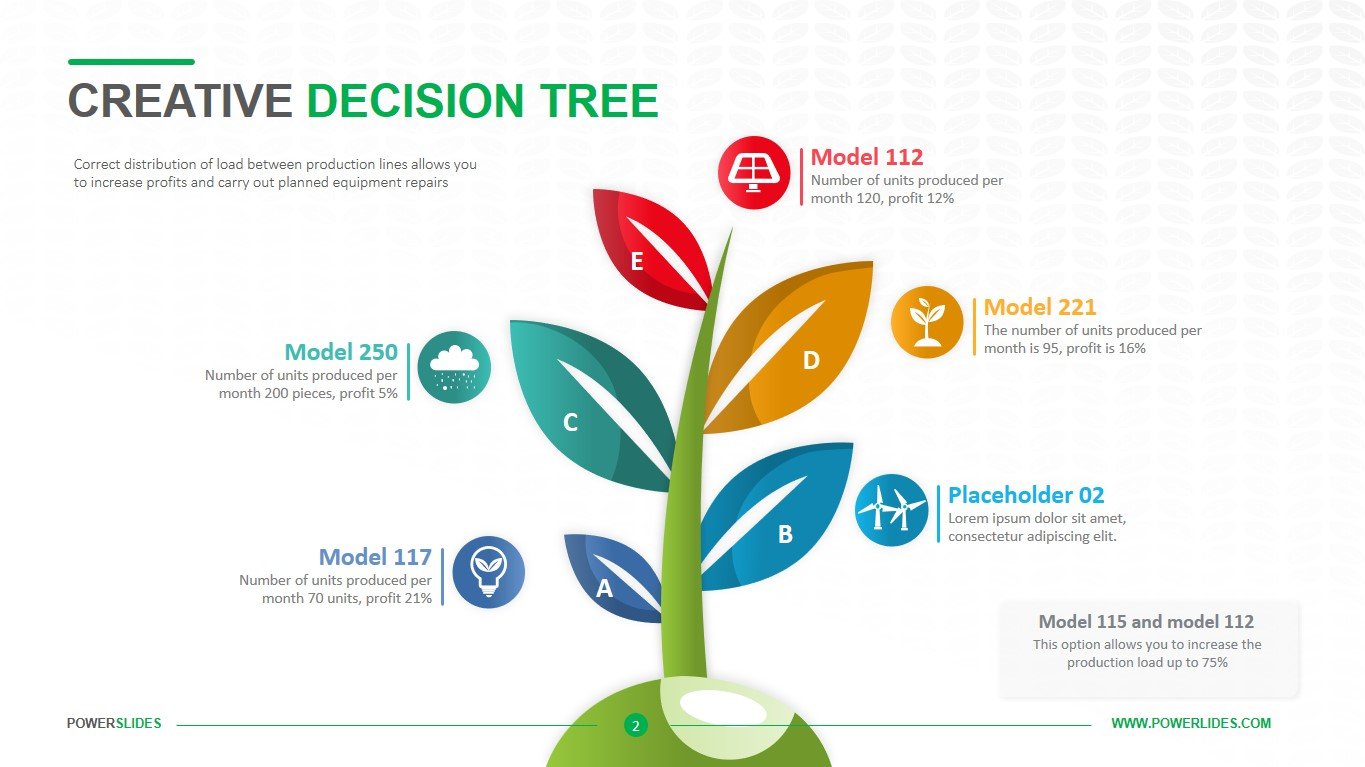
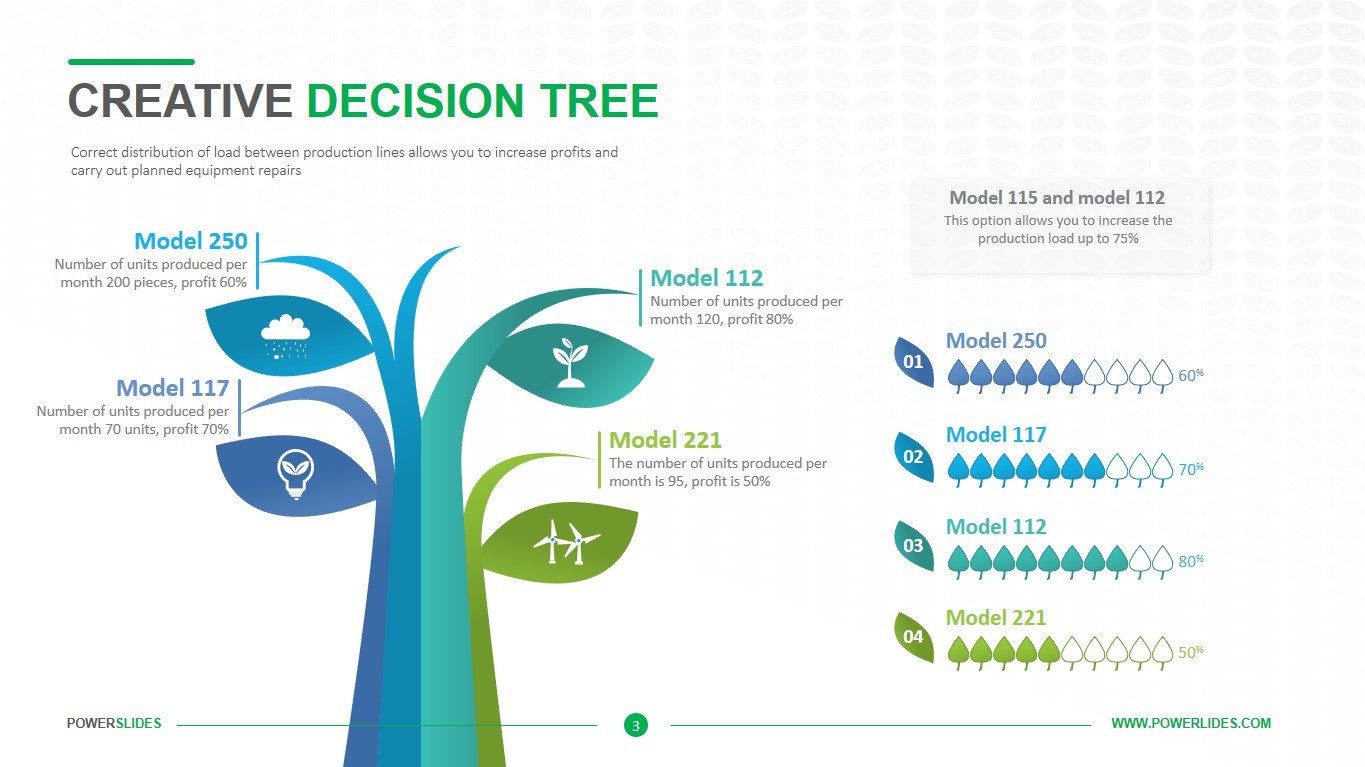
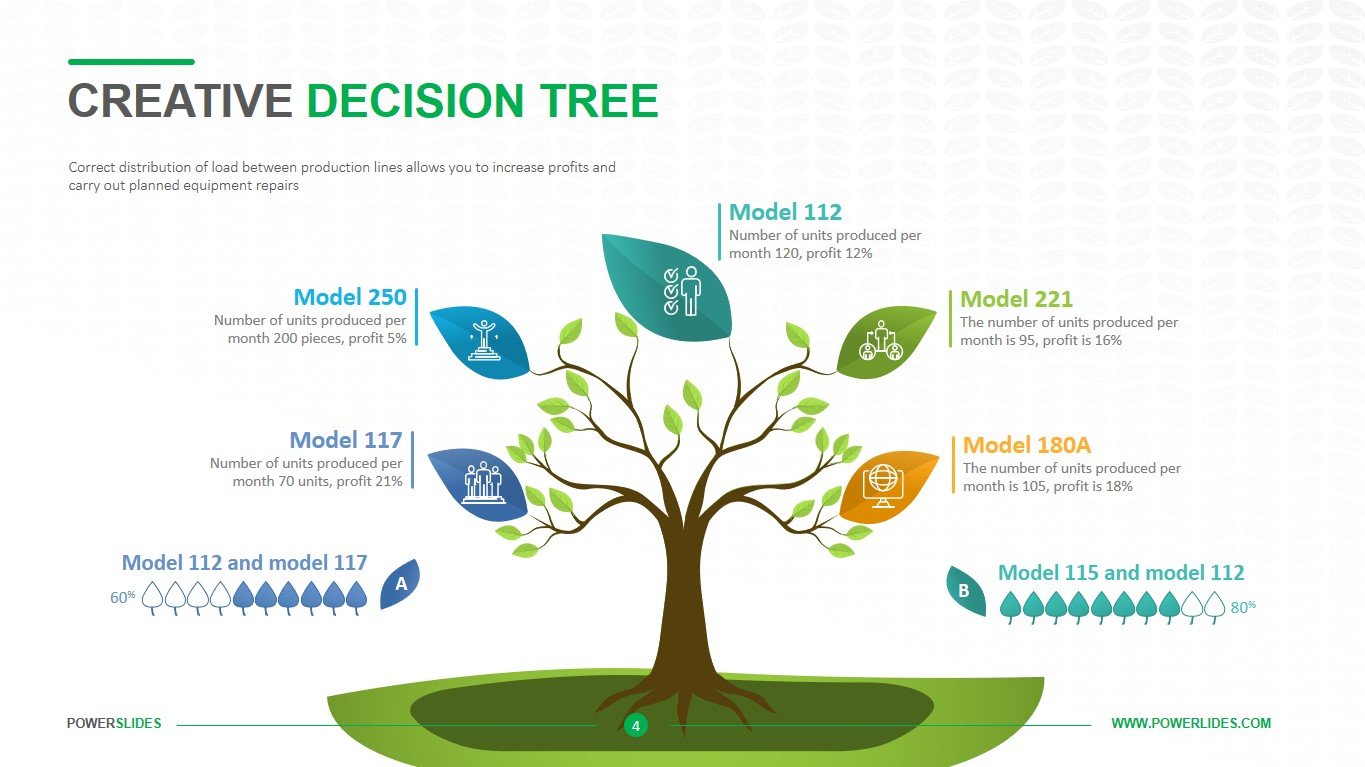
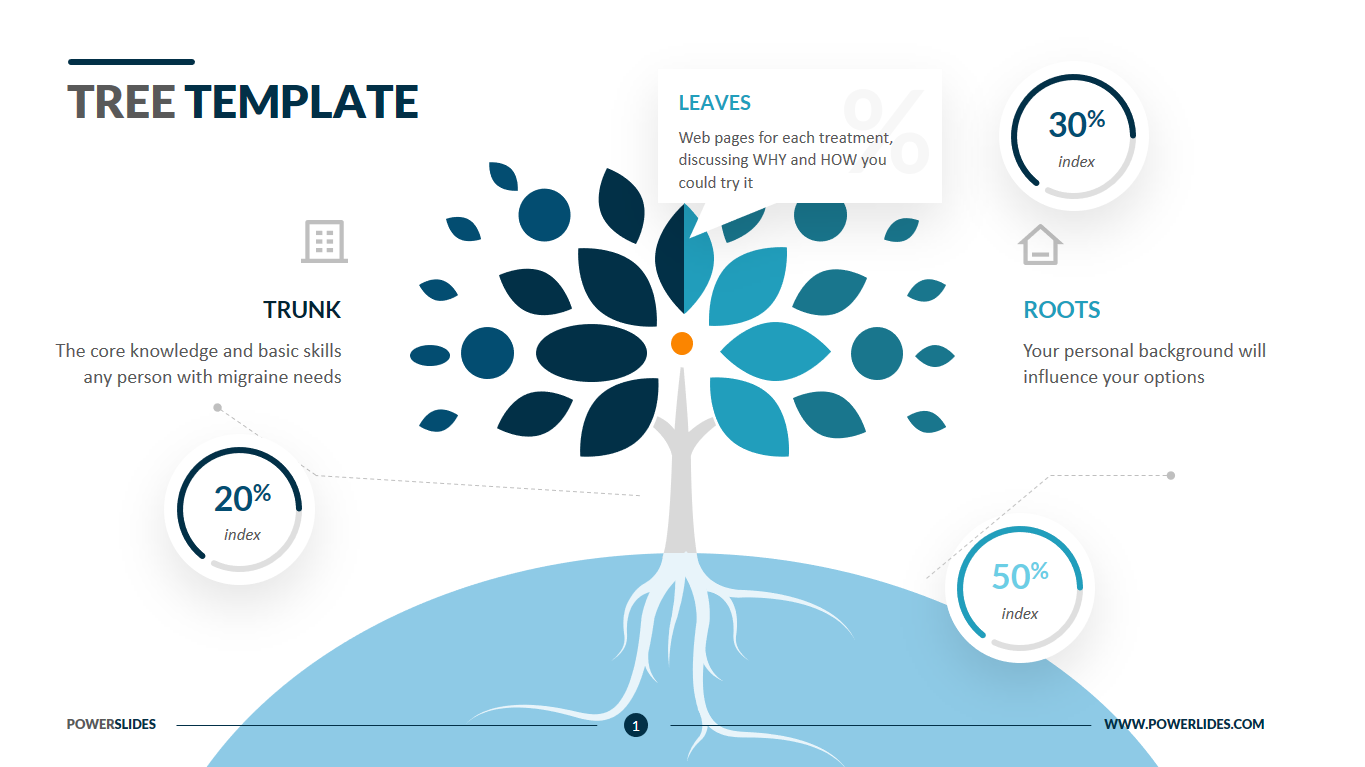
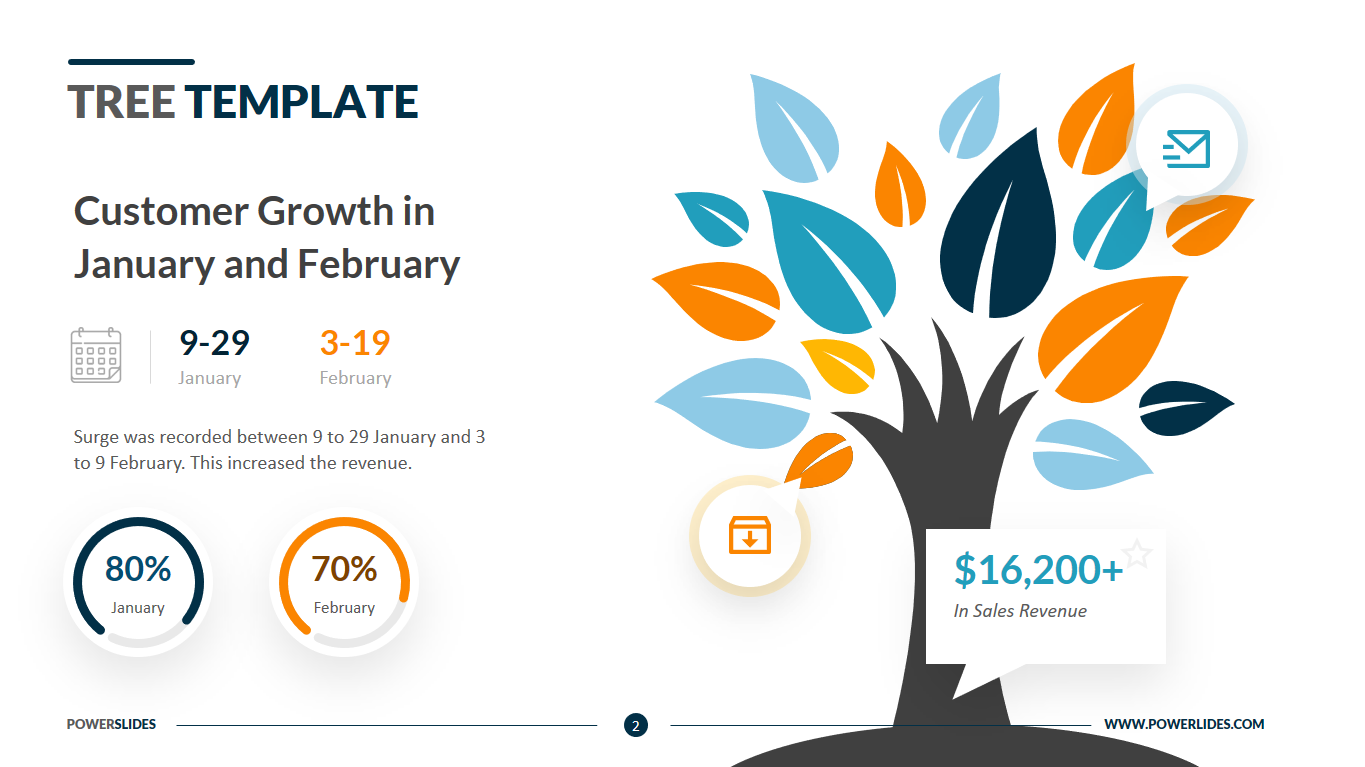
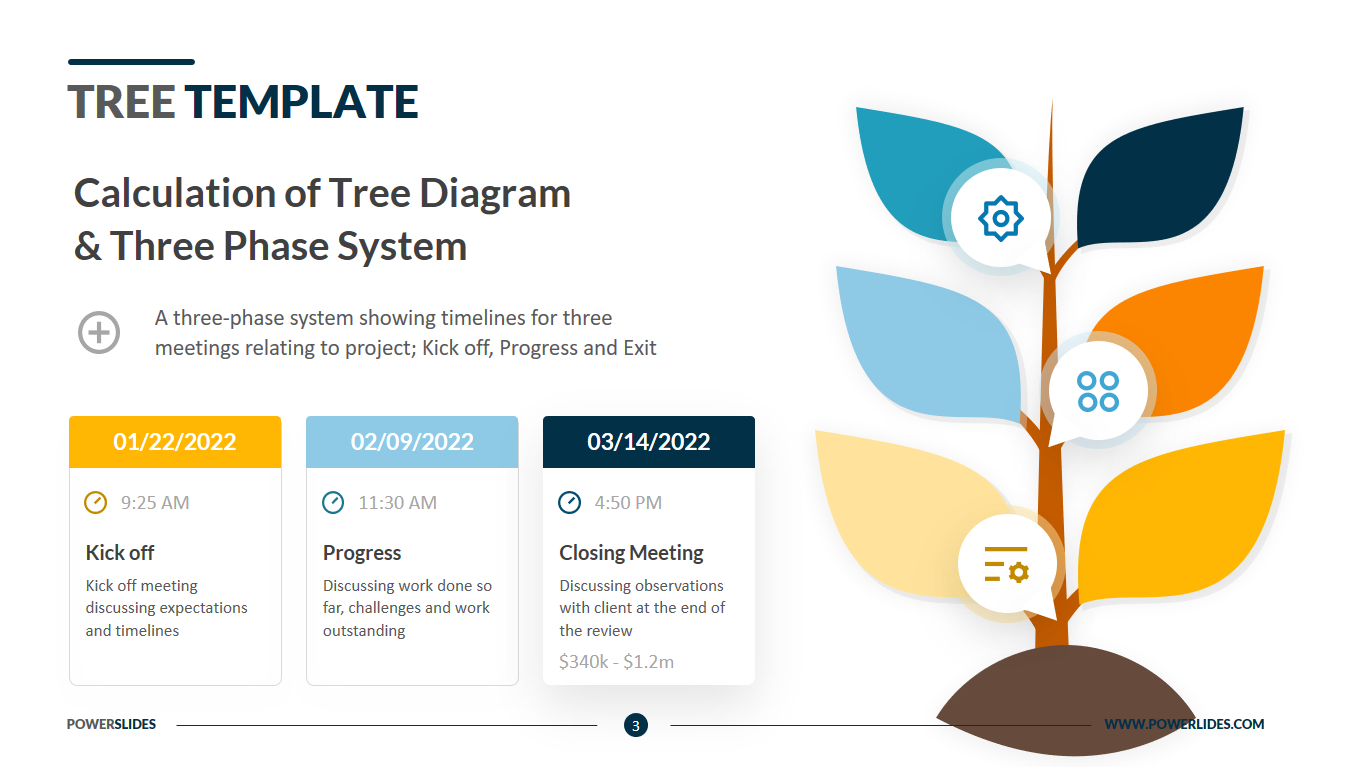
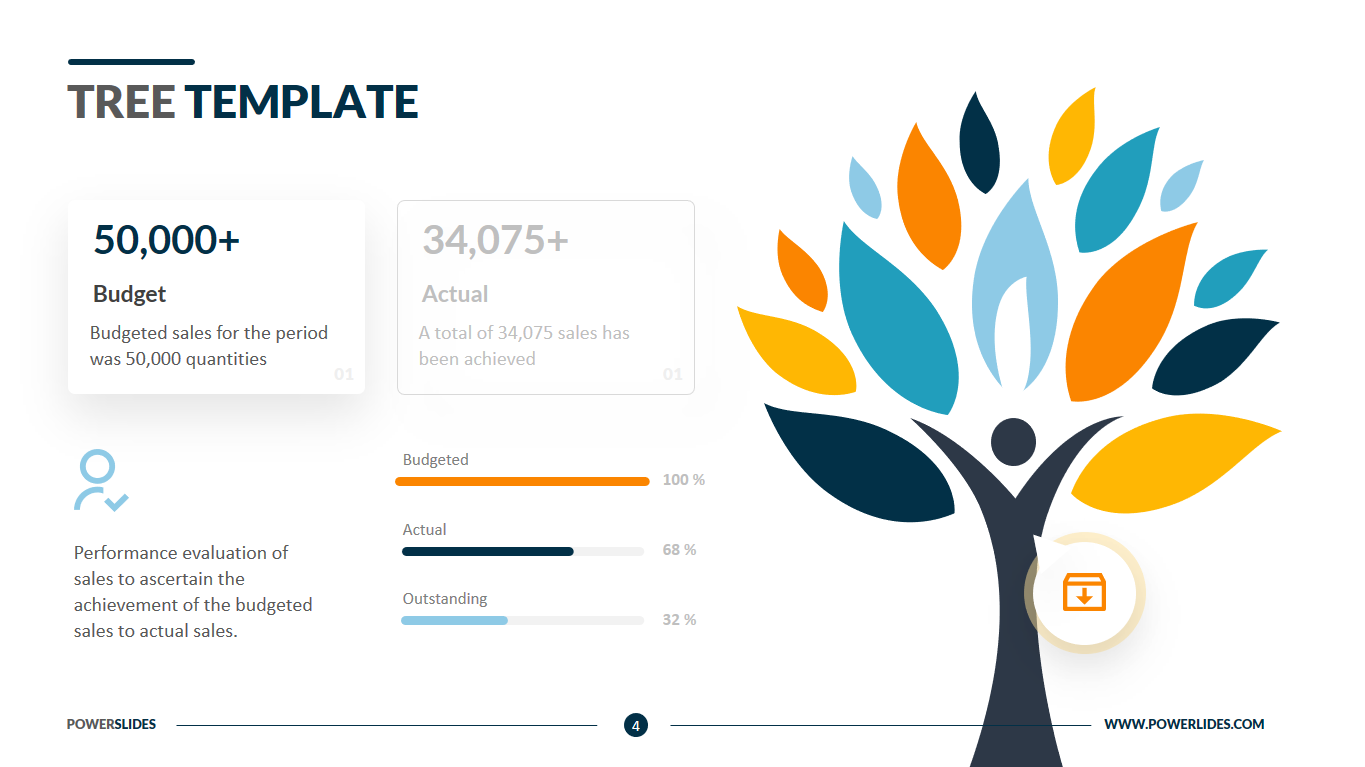
The Tree Template consists of four slides, each with a vibrant colour scheme. The first slide gives you the opportunity to present a decision-making model based on three components – tree roots, trunk, and leaves. Such a model can be used by specialists in non-traditional methods of treatment. The second slide can be used as an alternative to the conventional timeline. You can present your data on projected sales or project yield on payback. The next slide gives you the opportunity to display several sequential processes. For example, you can use this slide to prepare information on the necessary steps to sign a contract or obtain a license to build a residential property. The last slide can be useful for accountants and financiers in providing their cash flow statement. For example, you can specify the planned indicators of cash flows for the reporting period. Leaves of different colours will correspond to the funds already received and expected. This slide can also be used by social workers when preparing the results of various social surveys. For example, you can display different answers to questions using coloured leaves. Also, this slide can be used by public relations specialists when preparing preliminary data on electorate support for various candidates. Startups can use this template to prepare for their investor meeting. You can display the main stages of development of your project and determine the time to reach the break-even point. You can change the size, colour and position of the infographic to suit your corporate requirements. Tree Template will organically complement your old slides and will be a worthy addition to your collection of professional presentations.


