Bear vs Bull Market
What do you think of this template?

 (4.75/ 5)
19 ratings

 4 Slides
 File size: 16:9
 Fonts: Lato, Calibri
 Supported version
PPT 2010, PPT 2013, PPT 2016
Supported version
PPT 2010, PPT 2013, PPT 2016

Product details
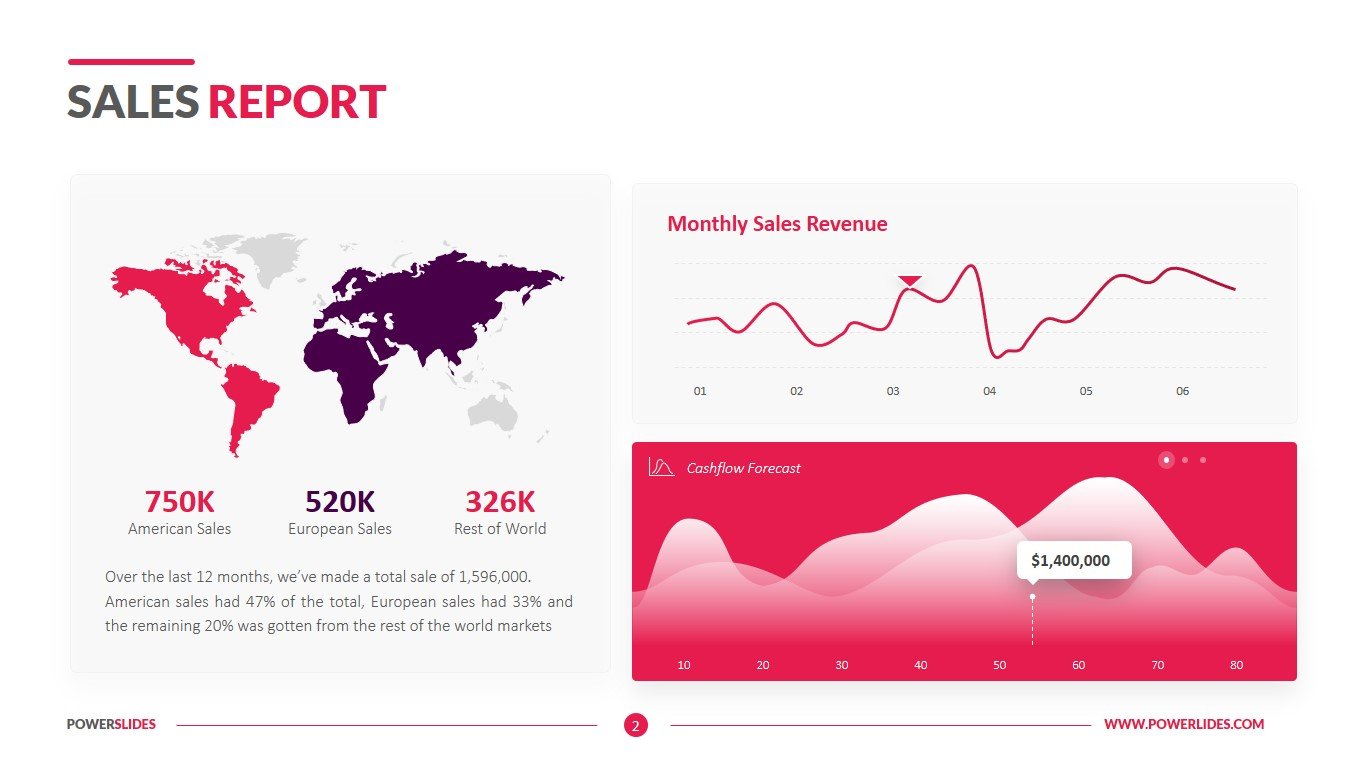
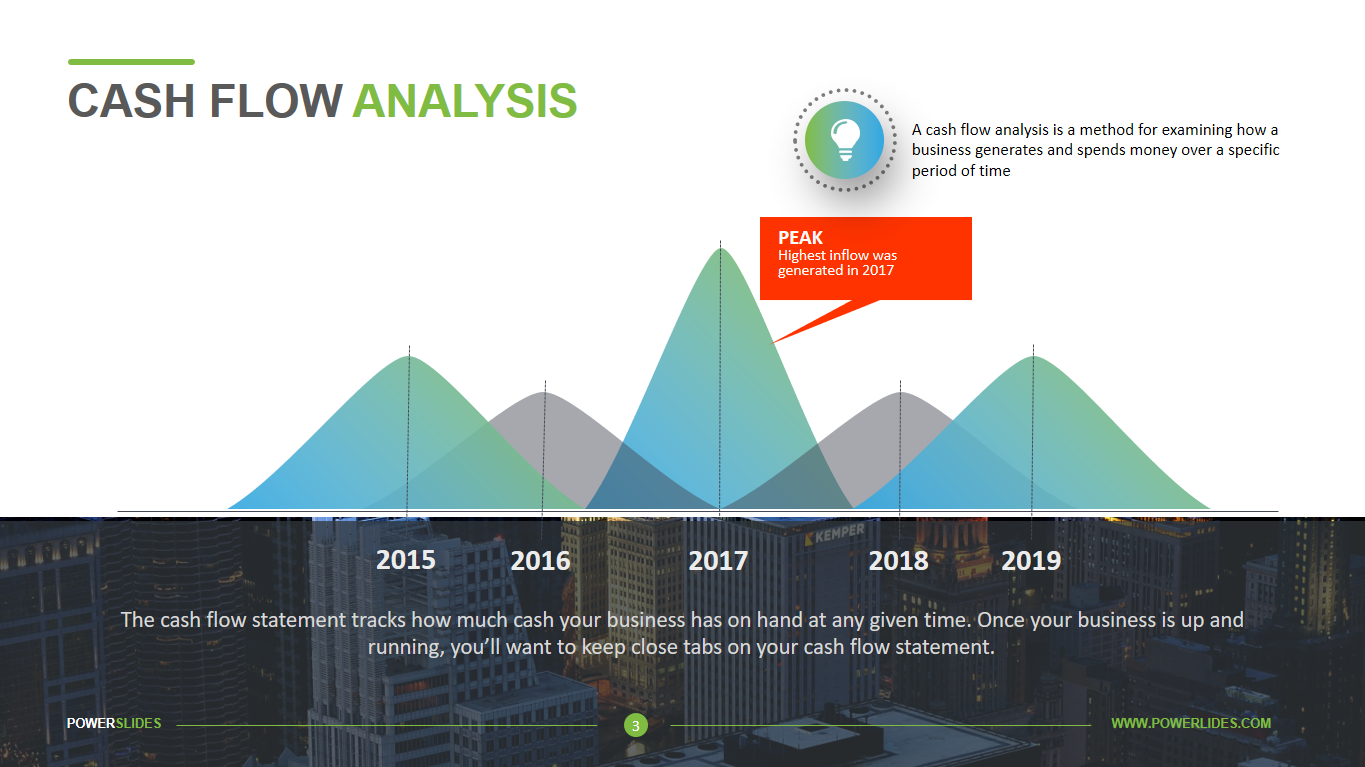
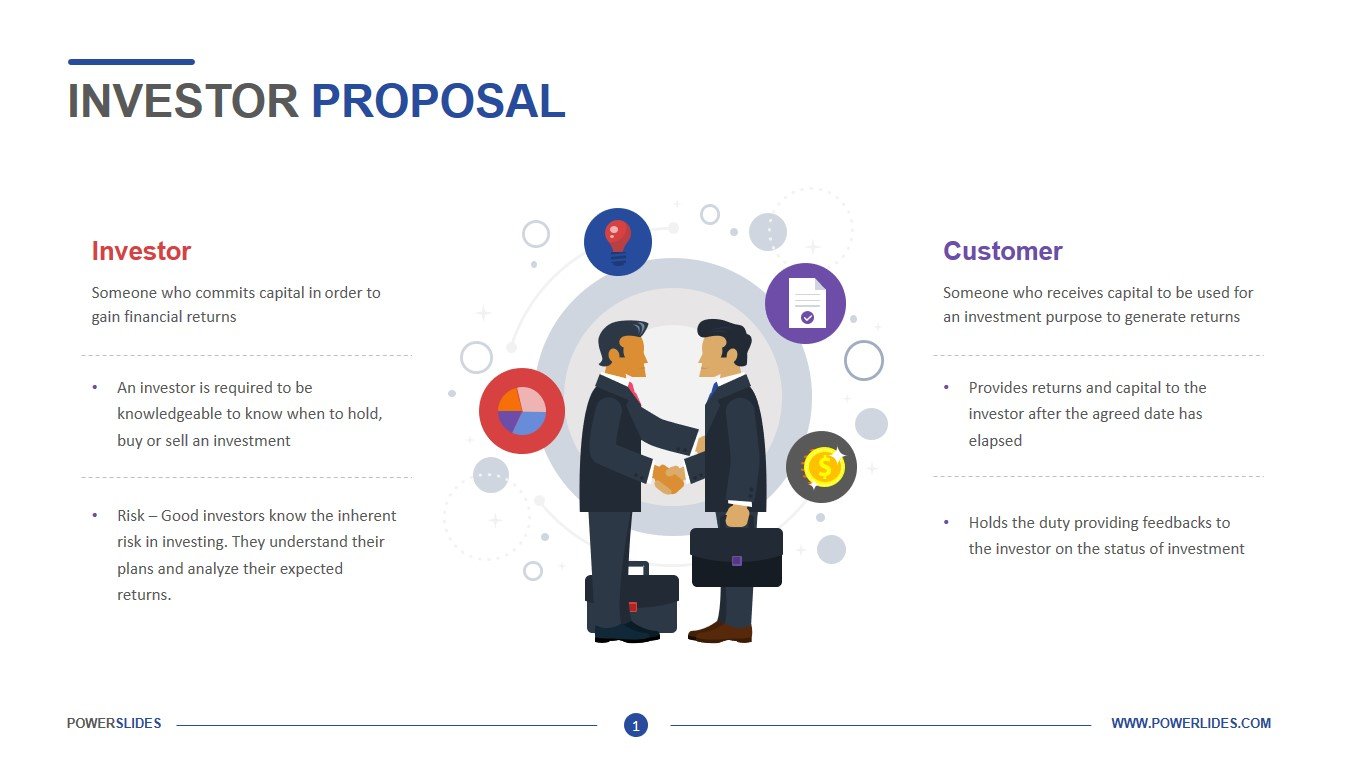
In the investing world, the terms “bull” and “bear” are frequently used to refer to market conditions. These terms describe how stock markets are doing in general—that is, whether they are appreciating or depreciating in value. And as an investor, the direction of the market is a major force that has a huge impact on your portfolio. So, it’s important to understand how each of these market conditions may impact your investments.
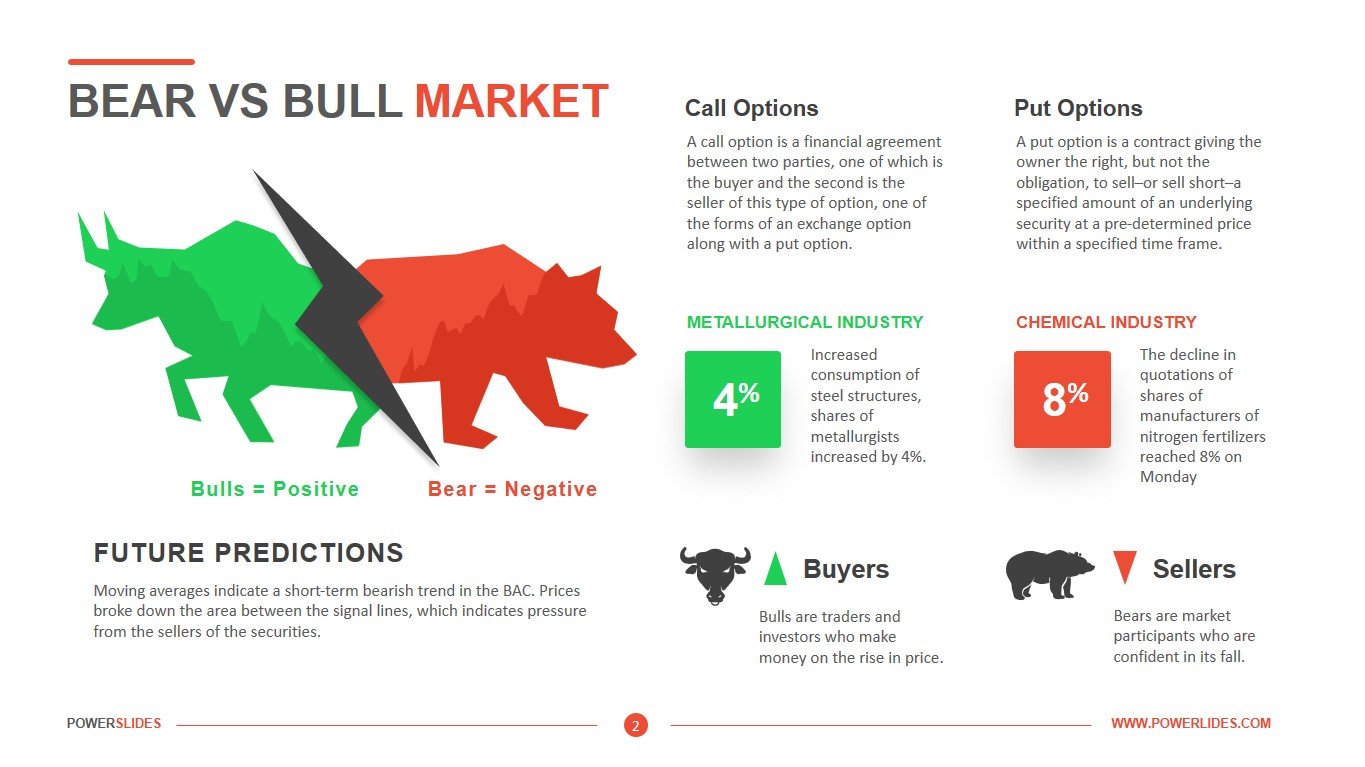
A bull market is a market that is on the rise and where the conditions of the economy are generally favorable. A bear market exists in an economy that is receding and where most stocks are declining in value. Because the financial markets are greatly influenced by investors’ attitudes, these terms also denote how investors feel about the market and the ensuing economic trends.
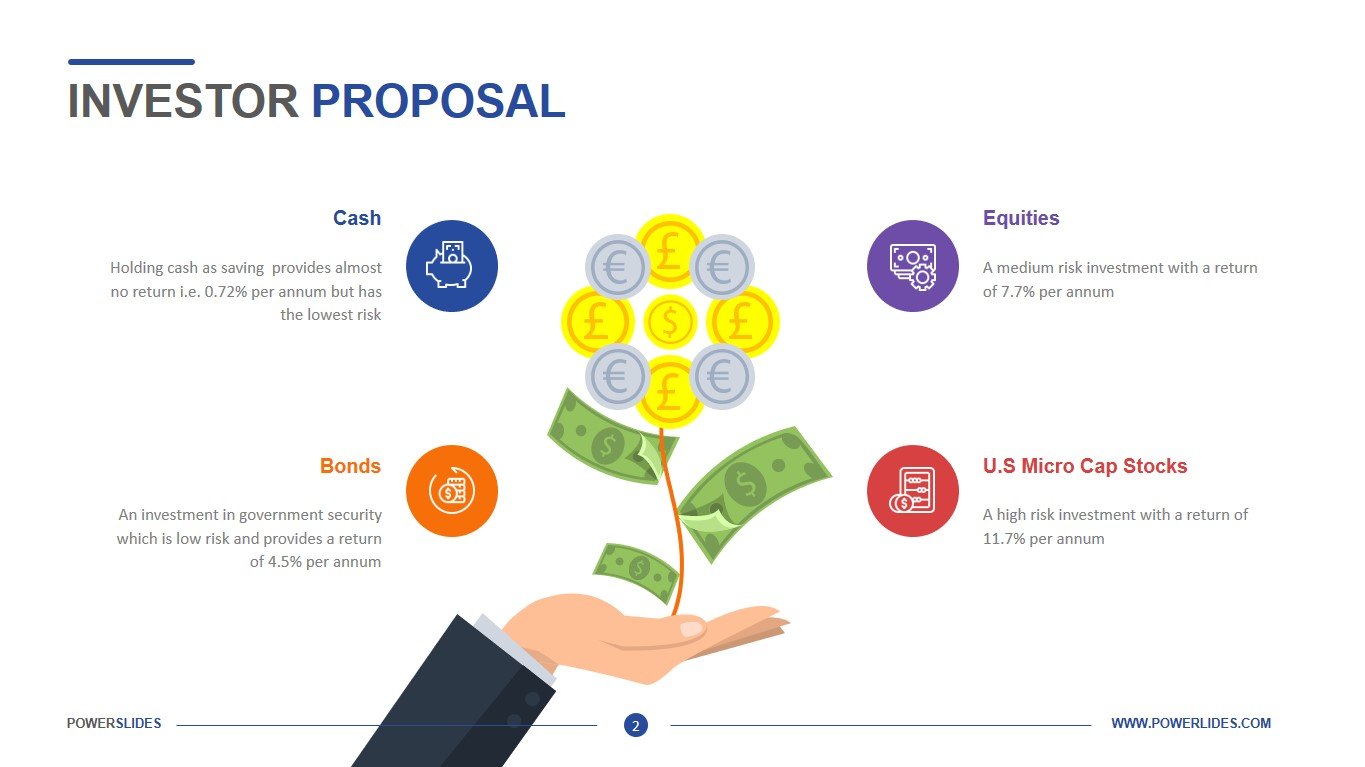
A bull market is typified by a sustained increase in prices. In the case of equity markets, a bull market denotes a rise in the prices of companies’ shares. In such times, investors often have faith that the uptrend will continue over the long term. In this scenario, the country’s economy is typically strong and employment levels are high.
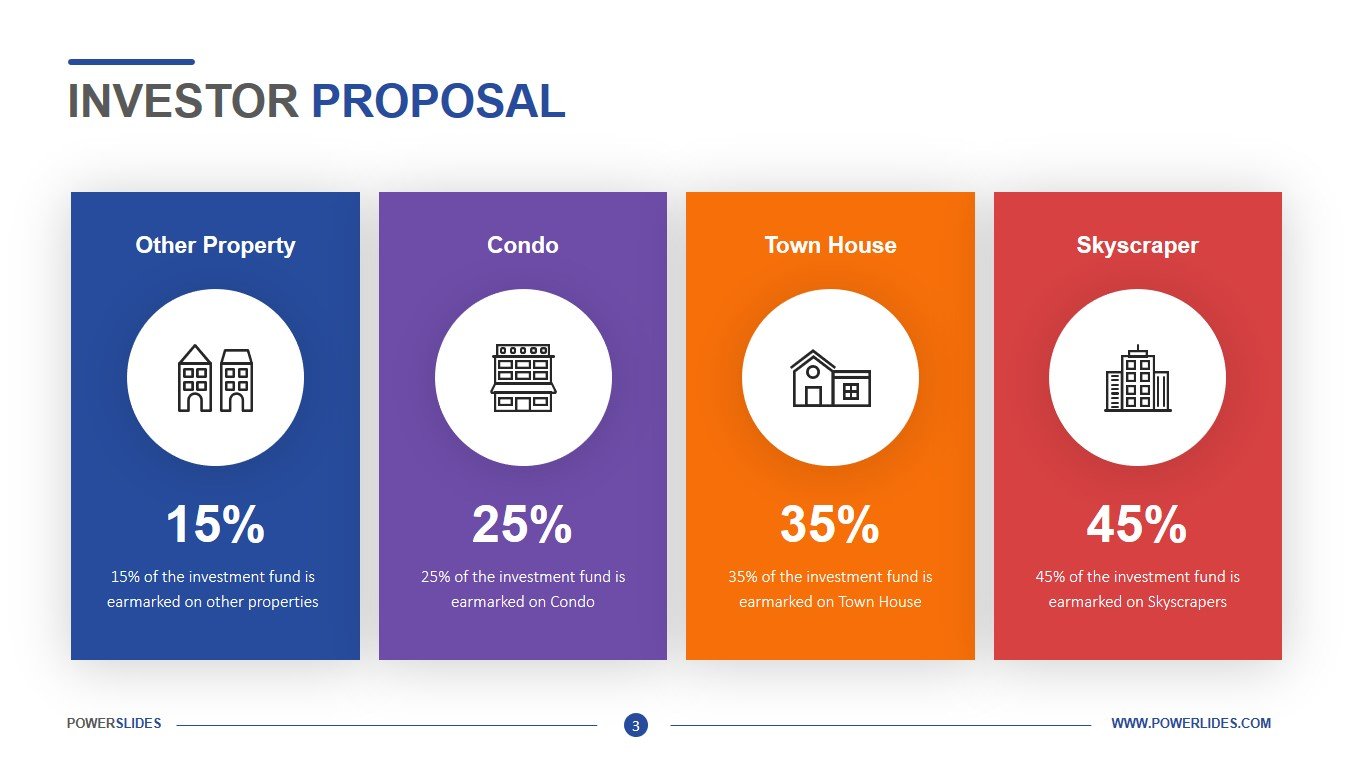
By contrast, a bear market is one that is in decline. A market is usually not considered a true “bear” market unless it has fallen 20% or more from recent highs. In a bear market, share prices are continuously dropping. During a bear market, the economy slows down and unemployment rises as companies begin laying off workers.
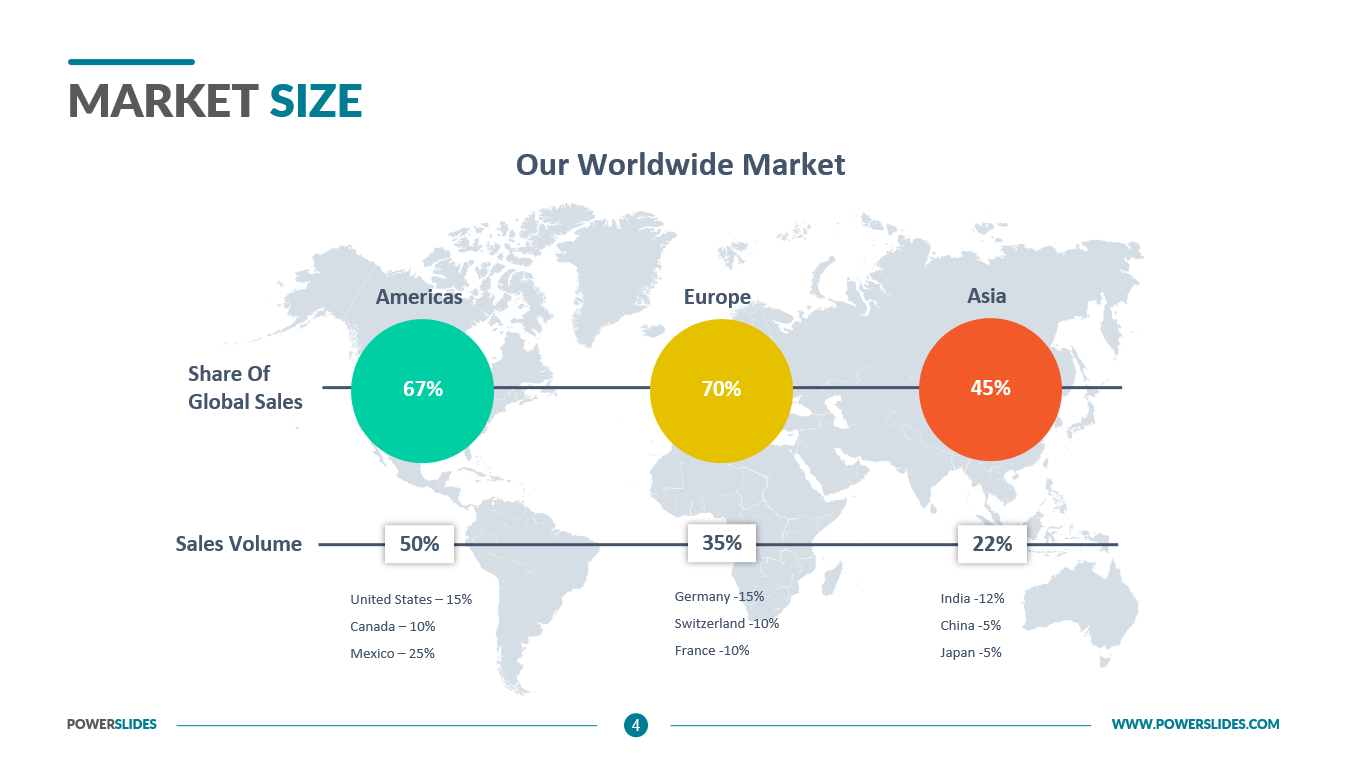
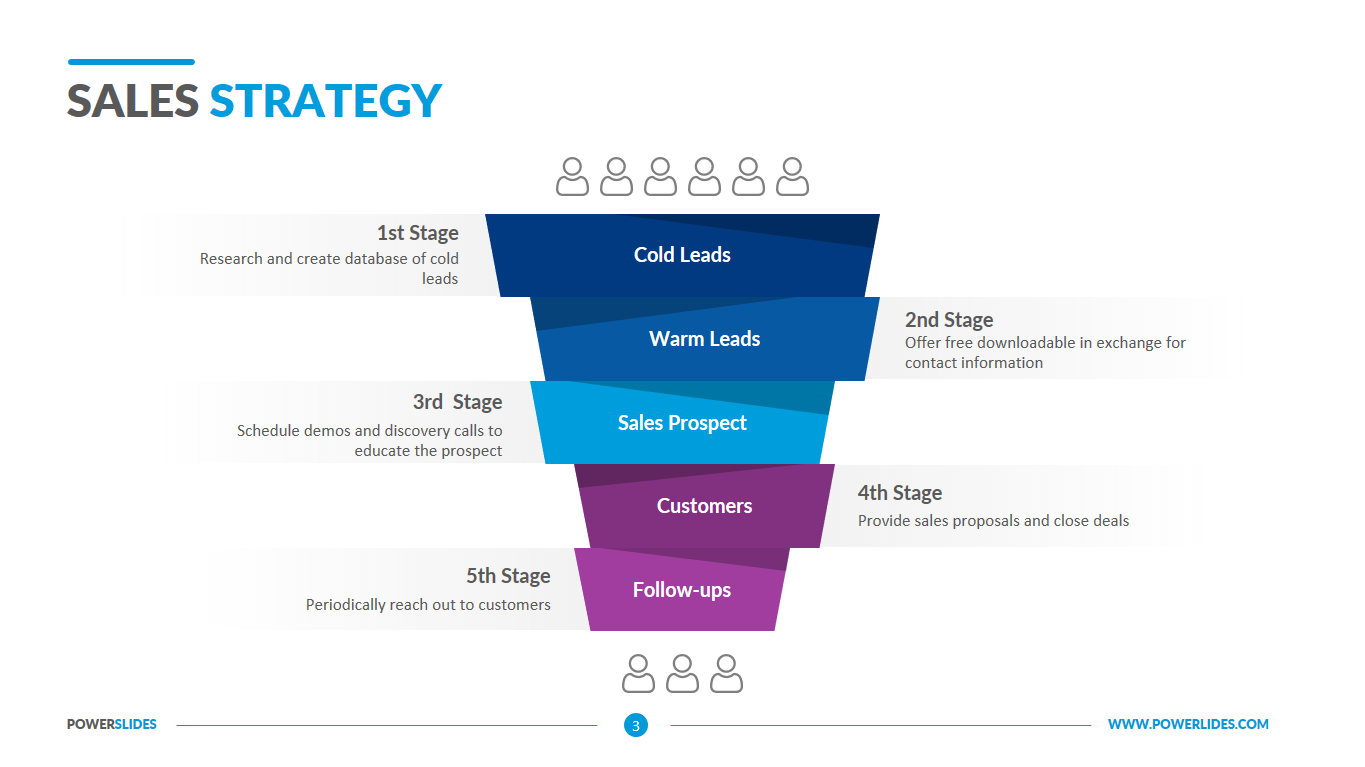
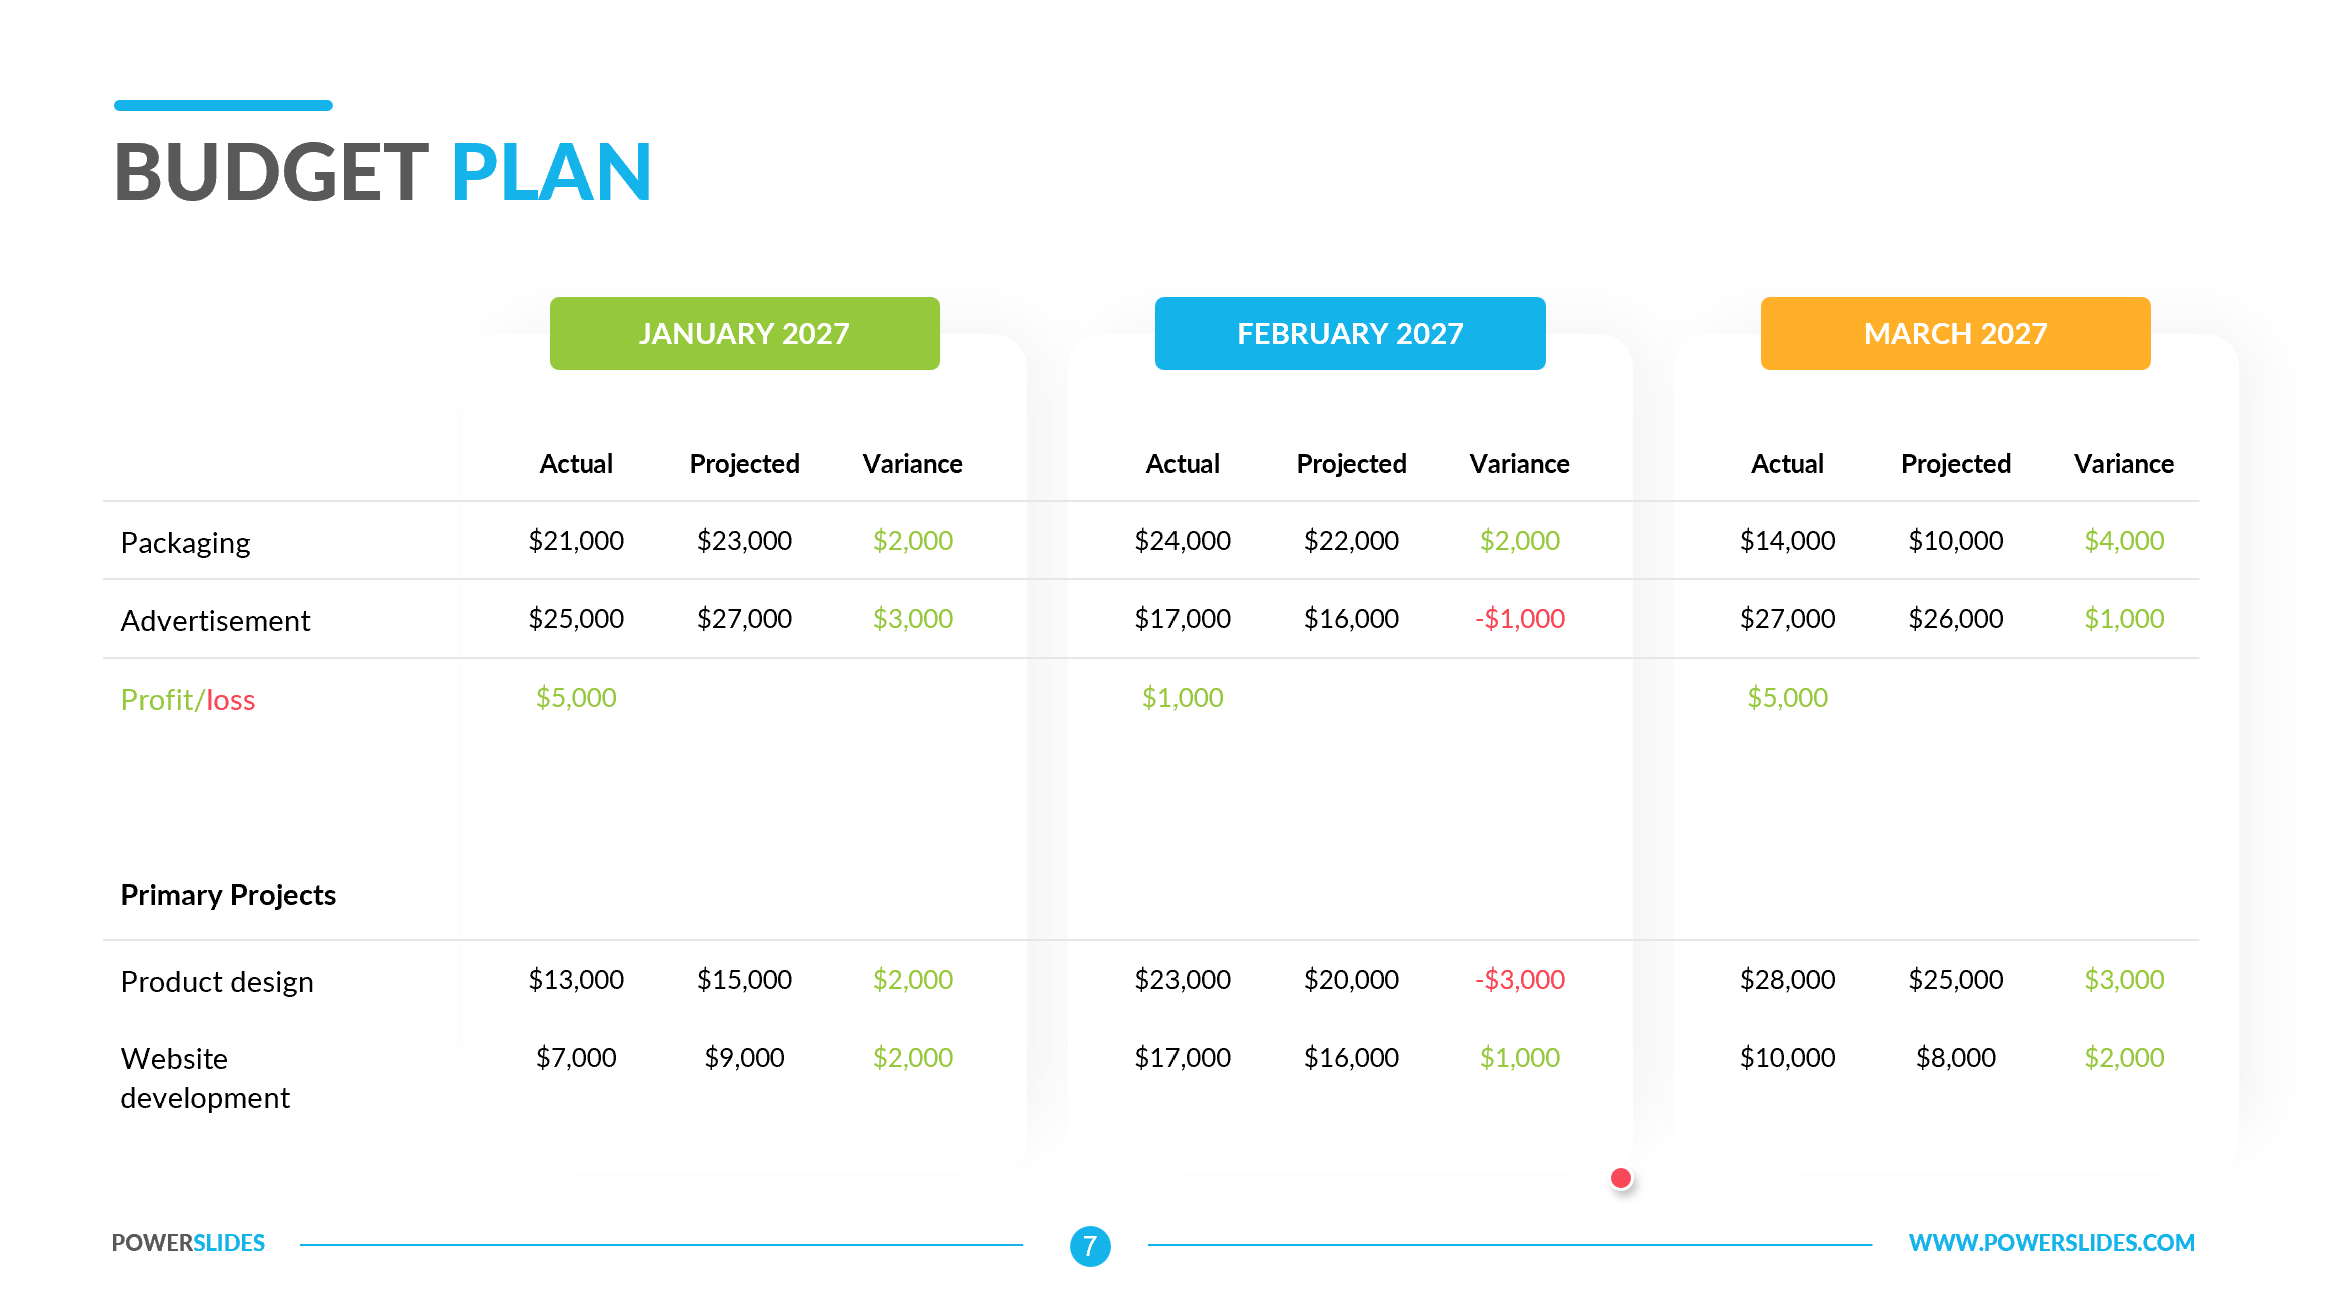
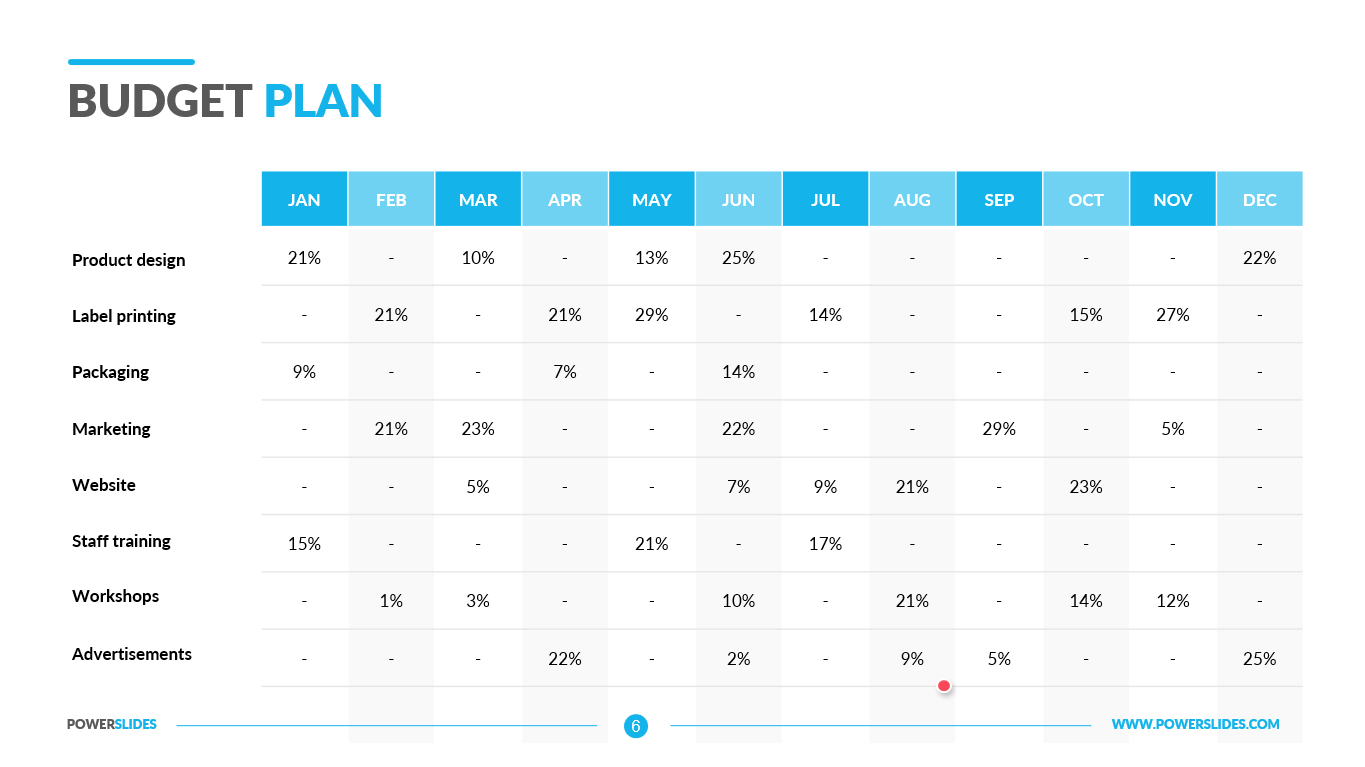
This bear vs bull market comparison template is the perfect fit for describing the rising and receding trend in a stock market or simple business. Whether the number of buyers or the number of sellers is increasing or vice versa, it’s the best way to predict market trends and the future needs of the consumer. For the very reason, this template consists of 4 slides with distinctive purposes. It is completely editable so to better suit you need.
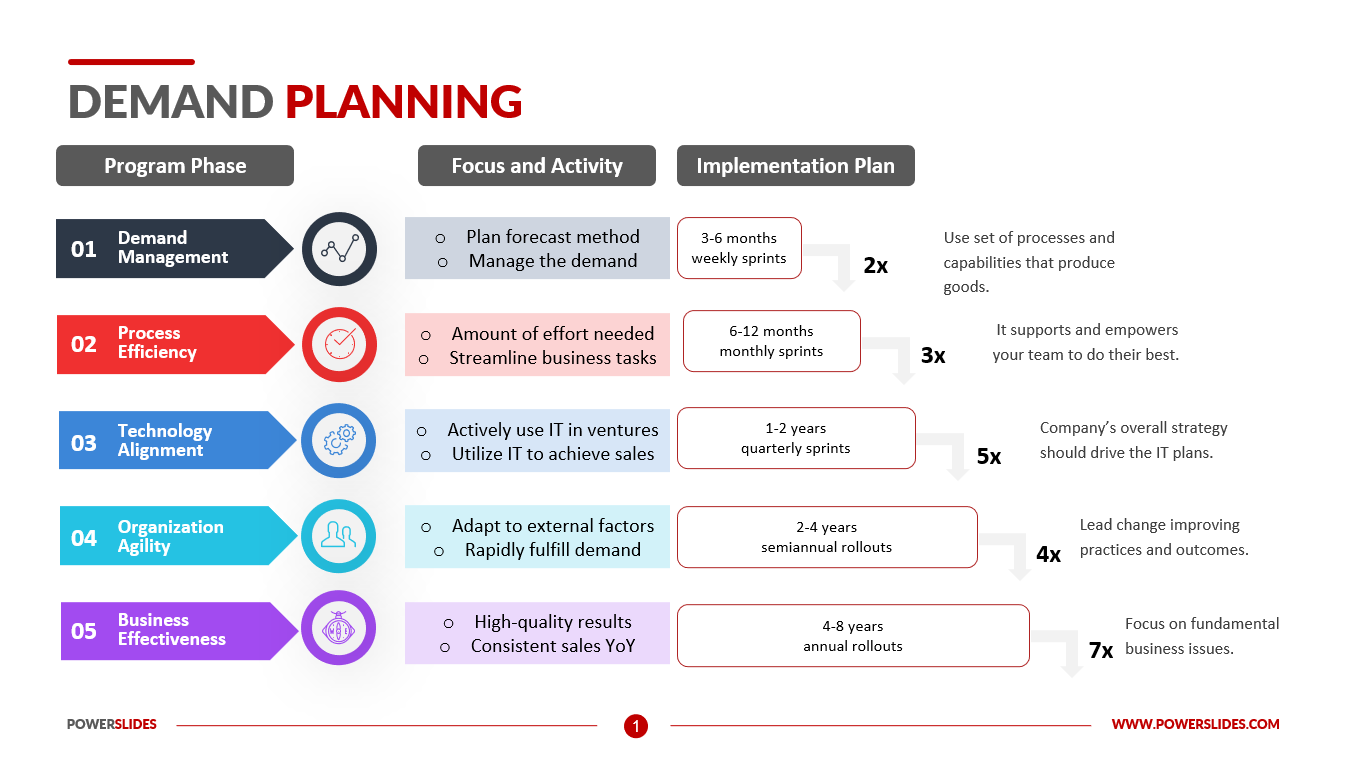
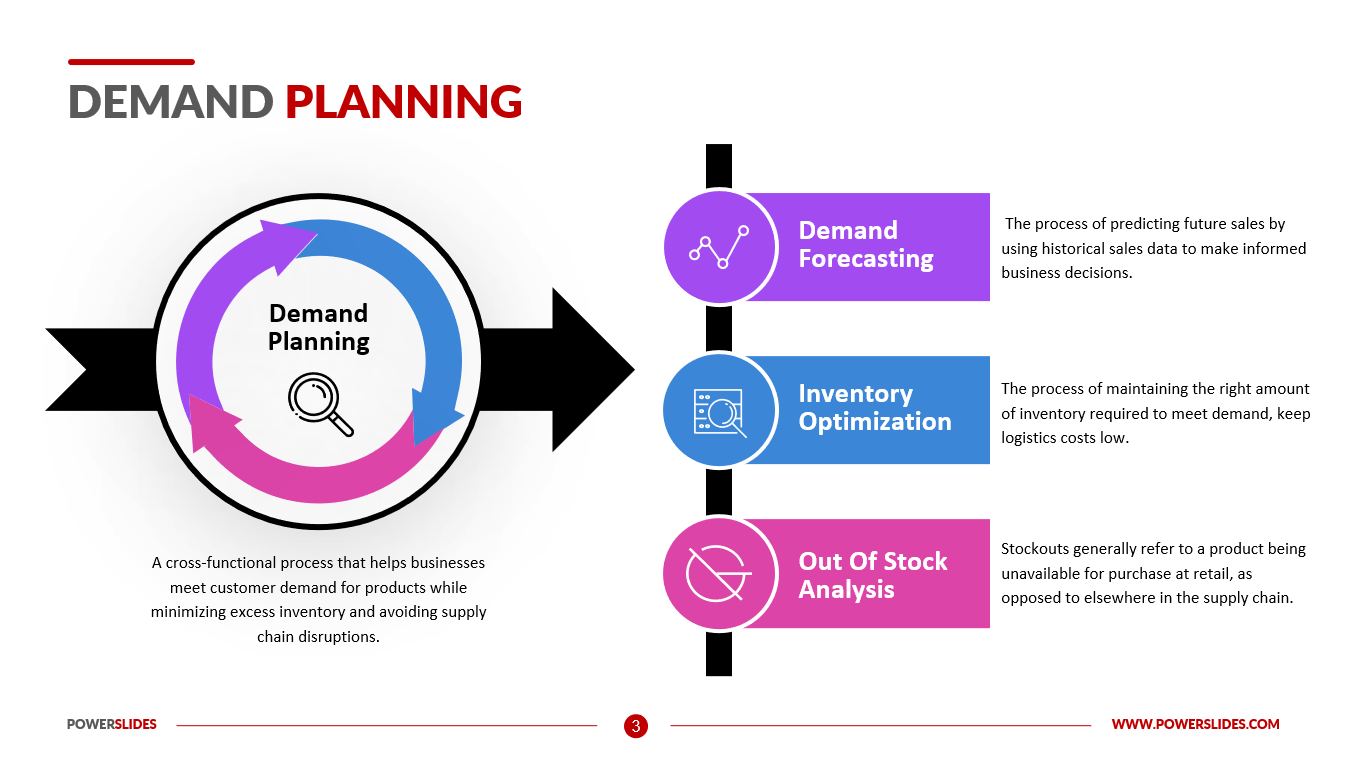
This template will be useful for specialists in stock operations when preparing an analysis of the current market situation. Also, this template can be used by university teachers and business coaches when preparing their courses on the stock exchange and investment risk. Also, this template will be useful for startup executives when preparing for their meeting with business investors and analyzing options for action when entering the stock exchange.
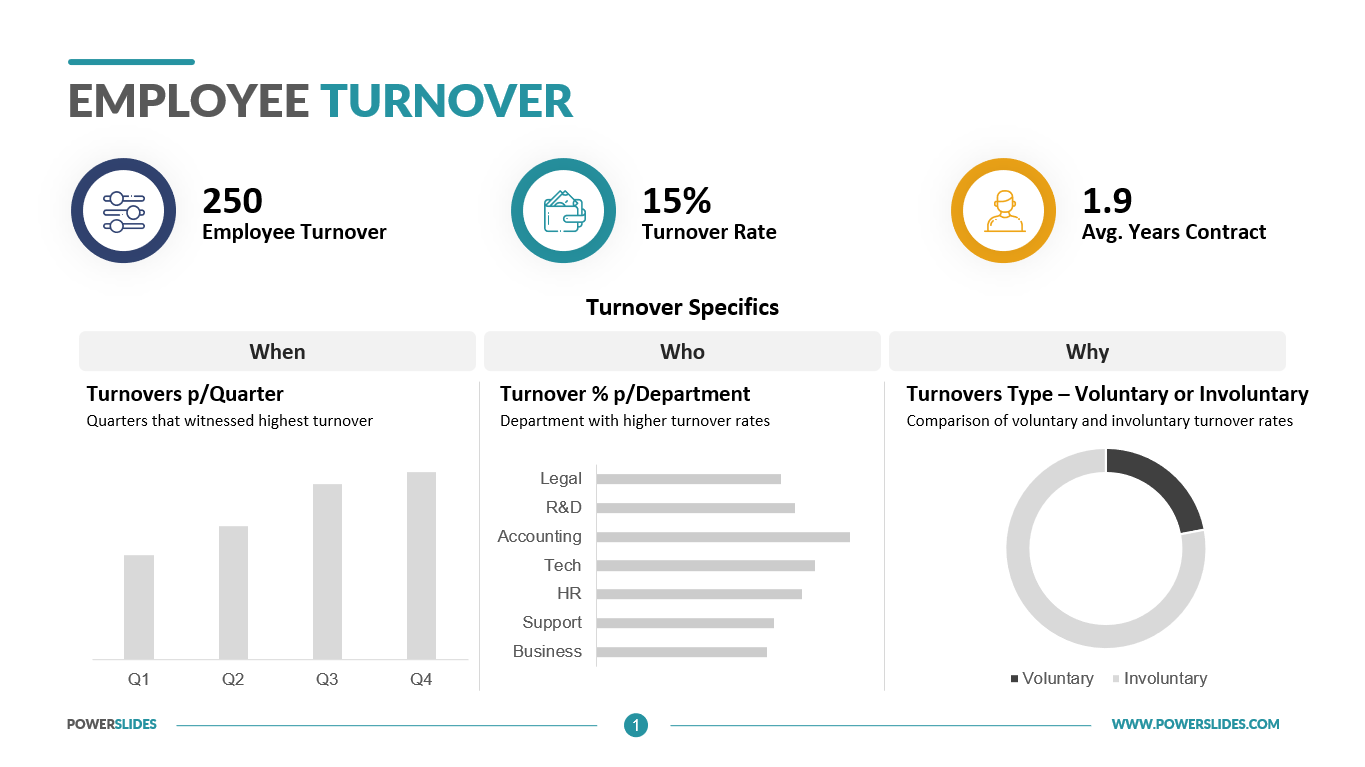
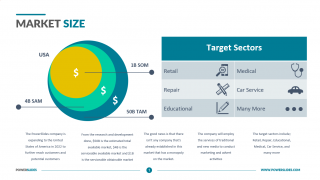
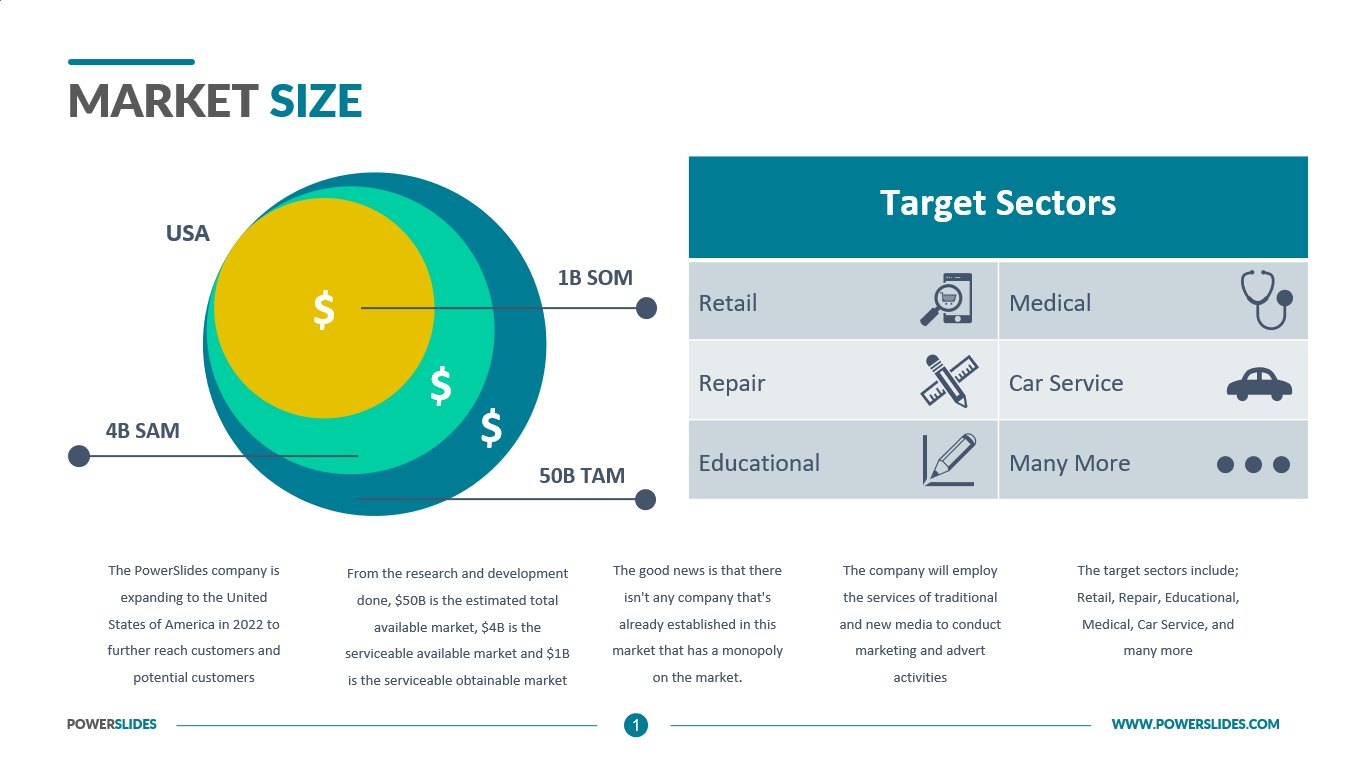
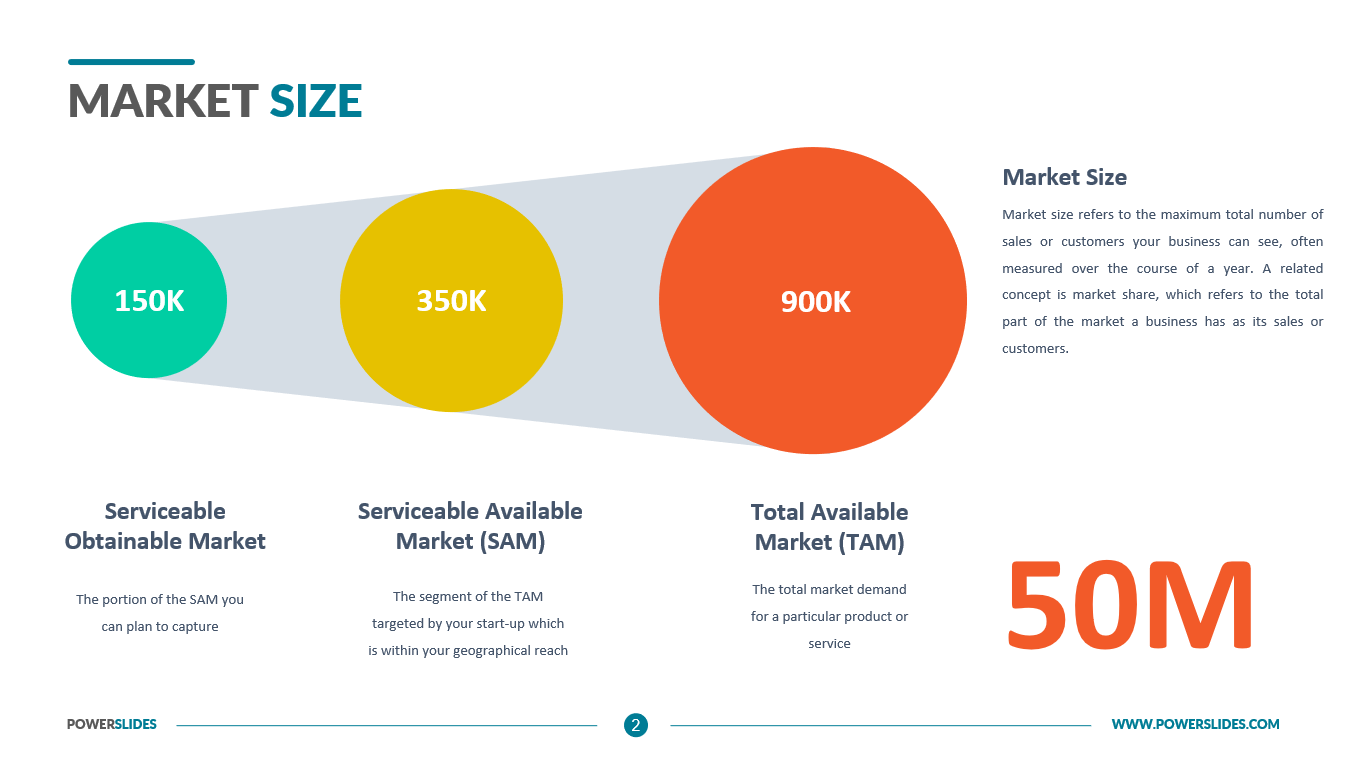
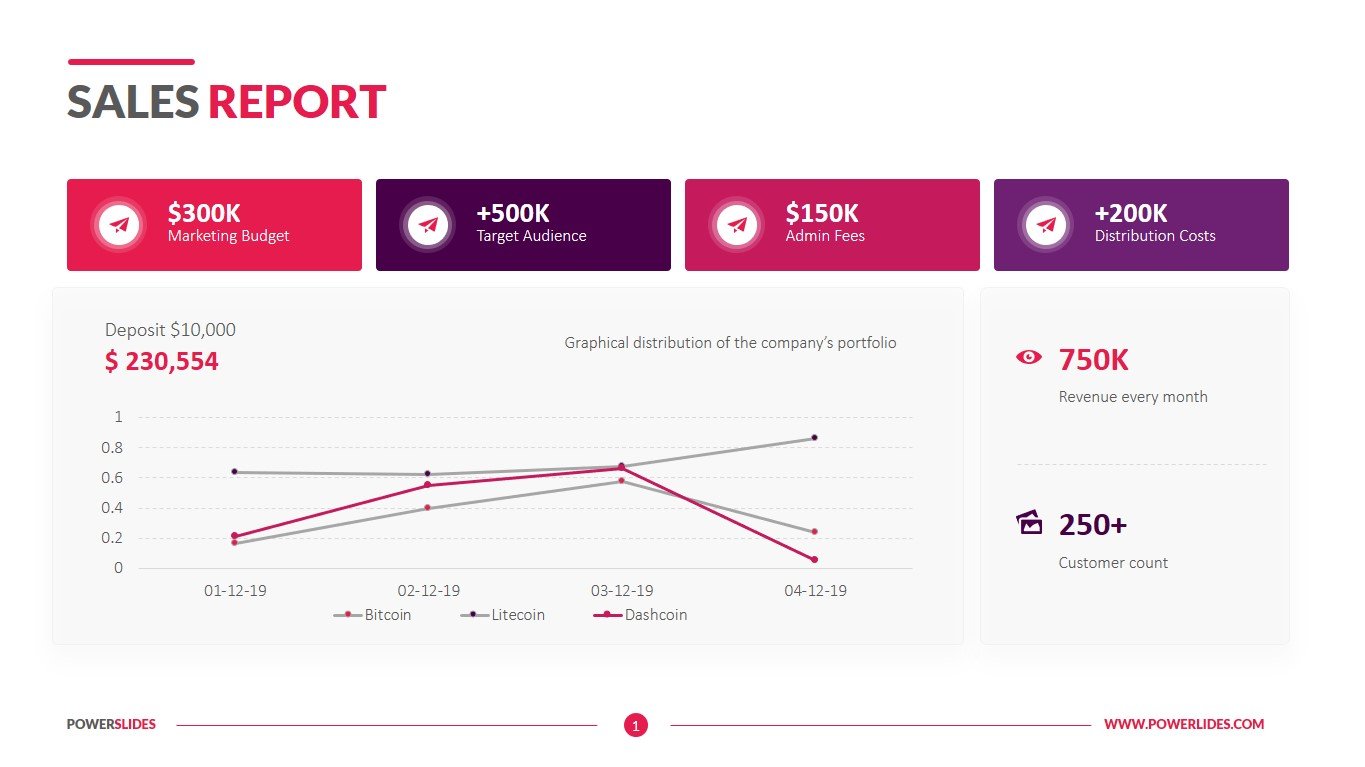
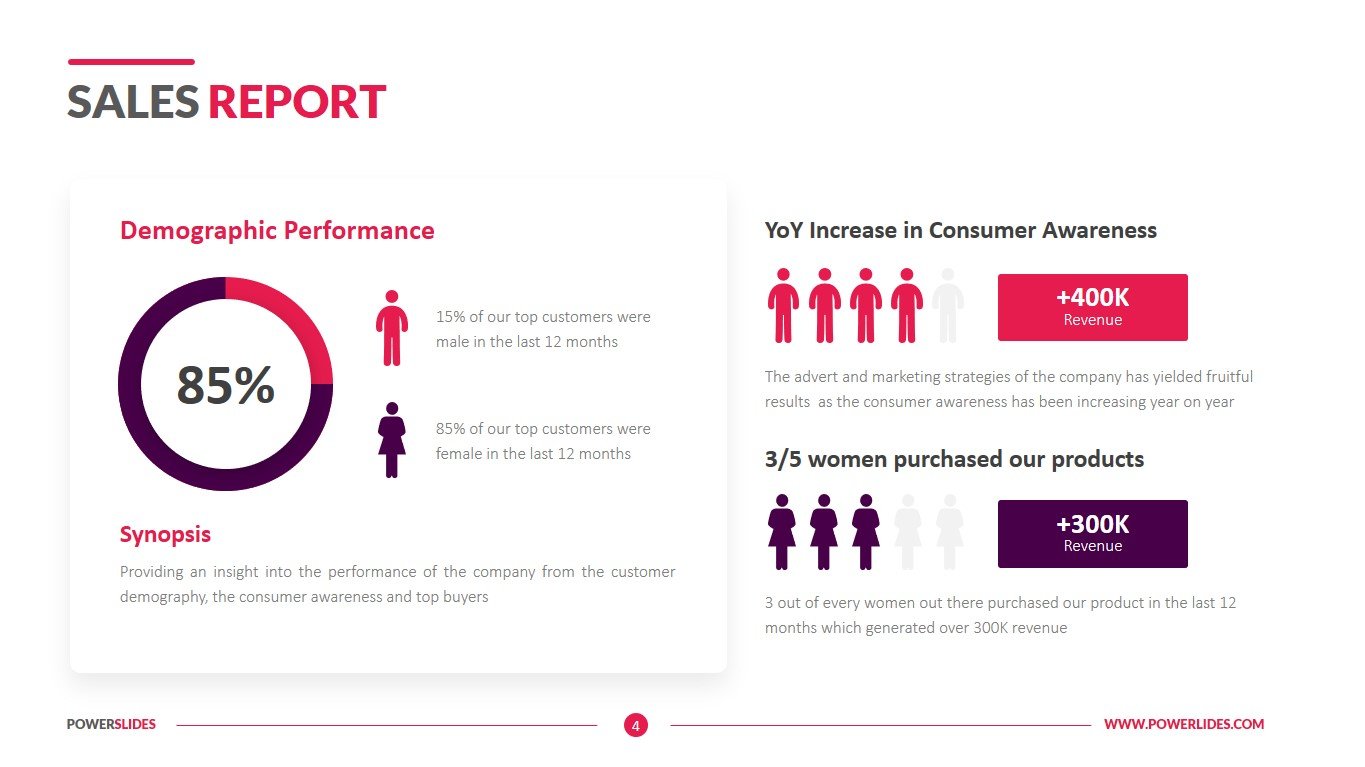
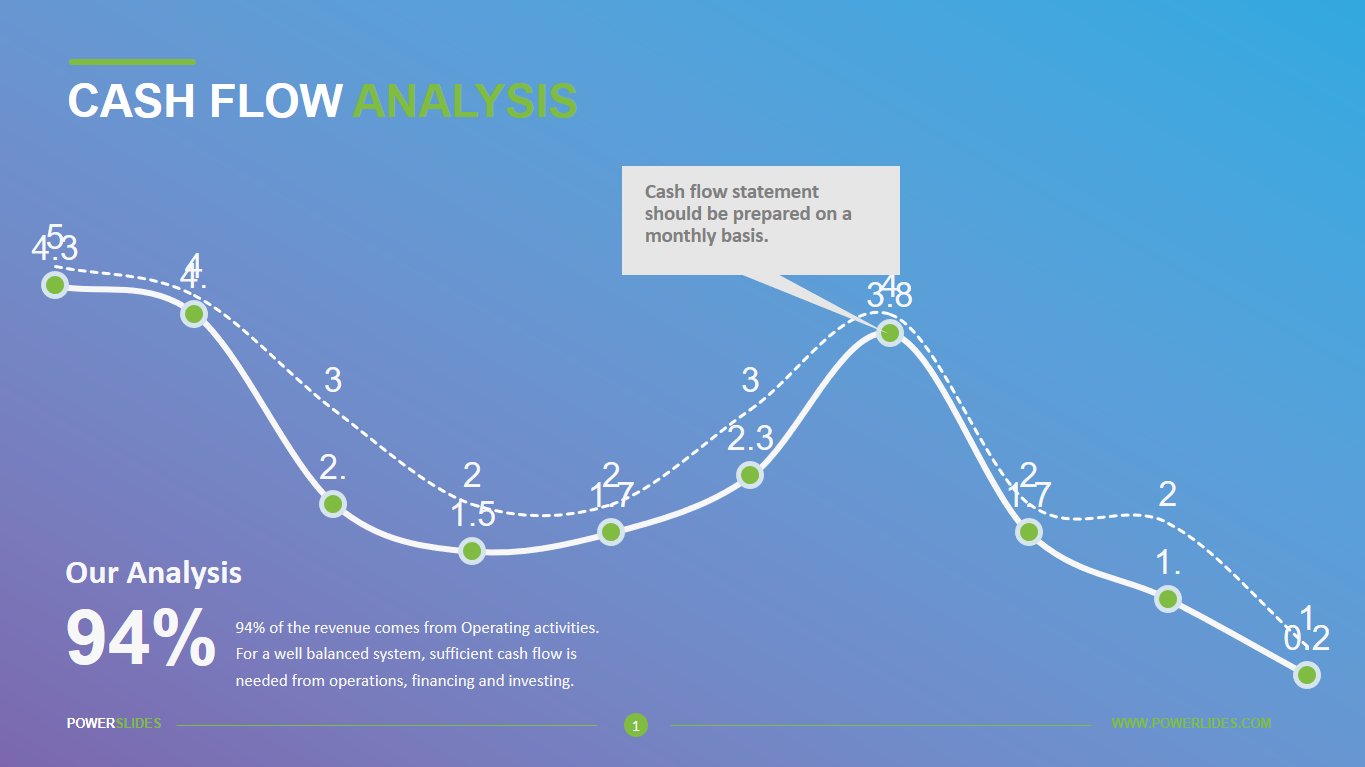
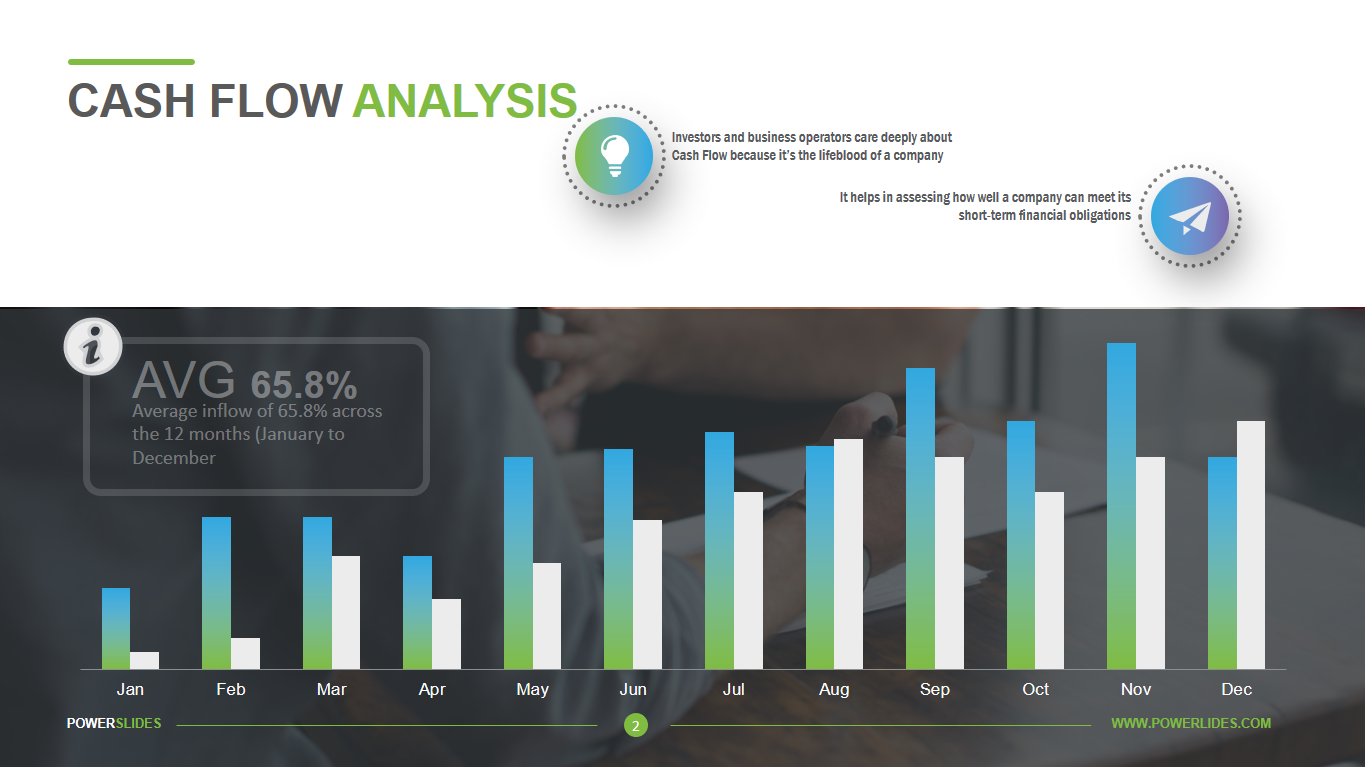
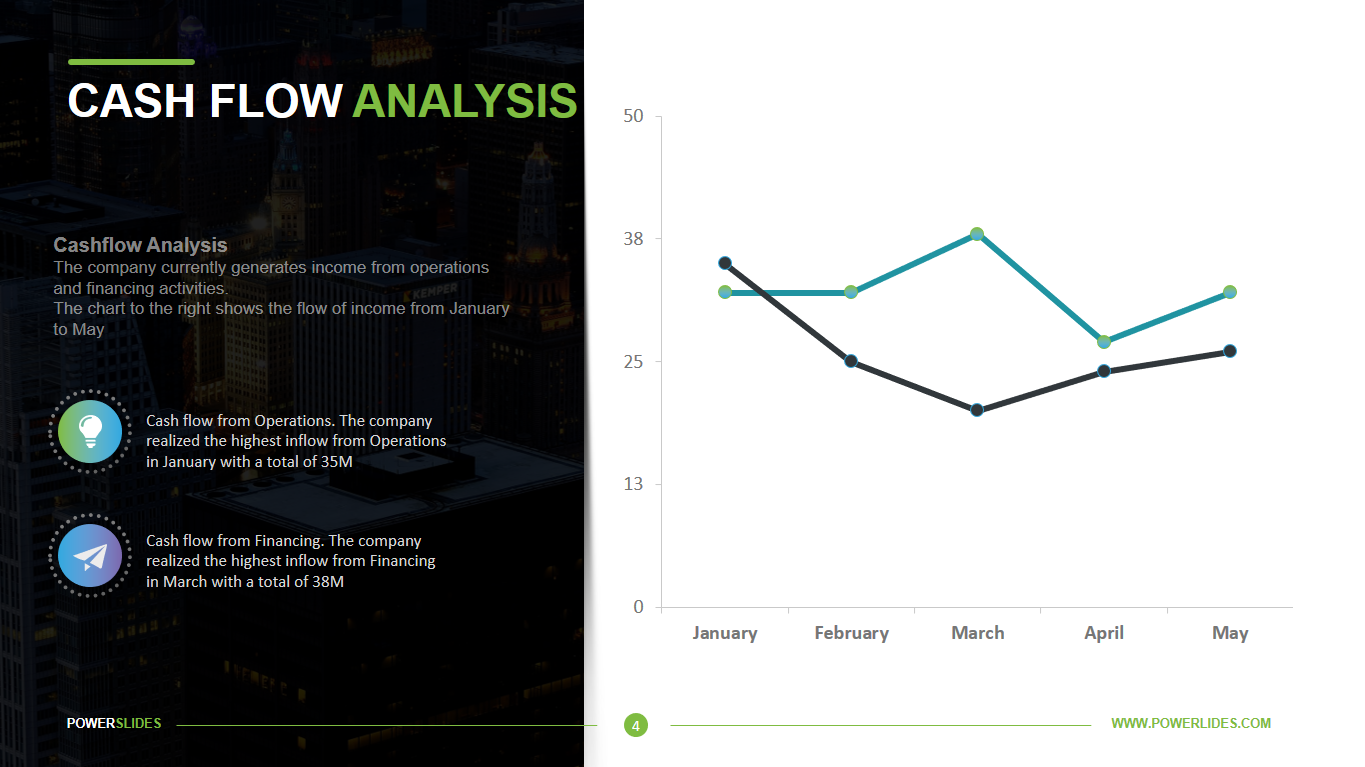
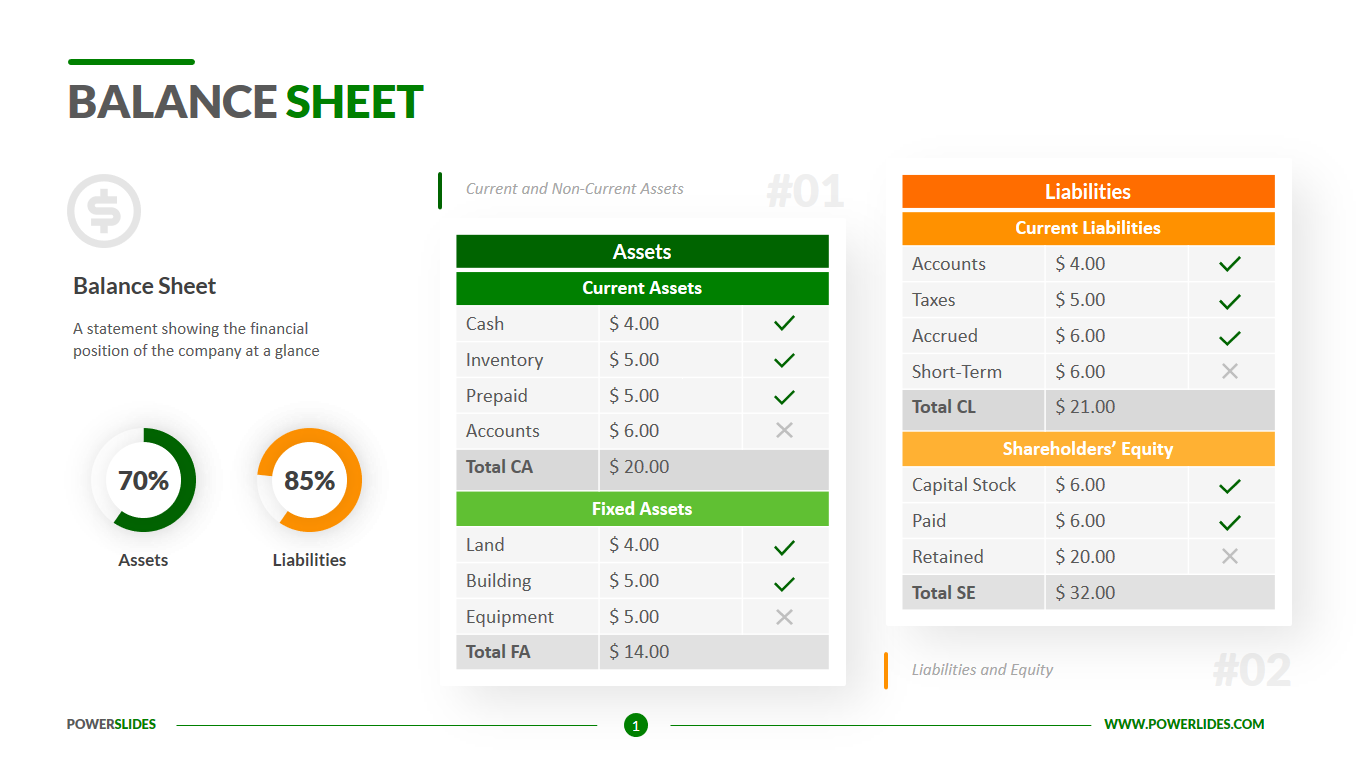
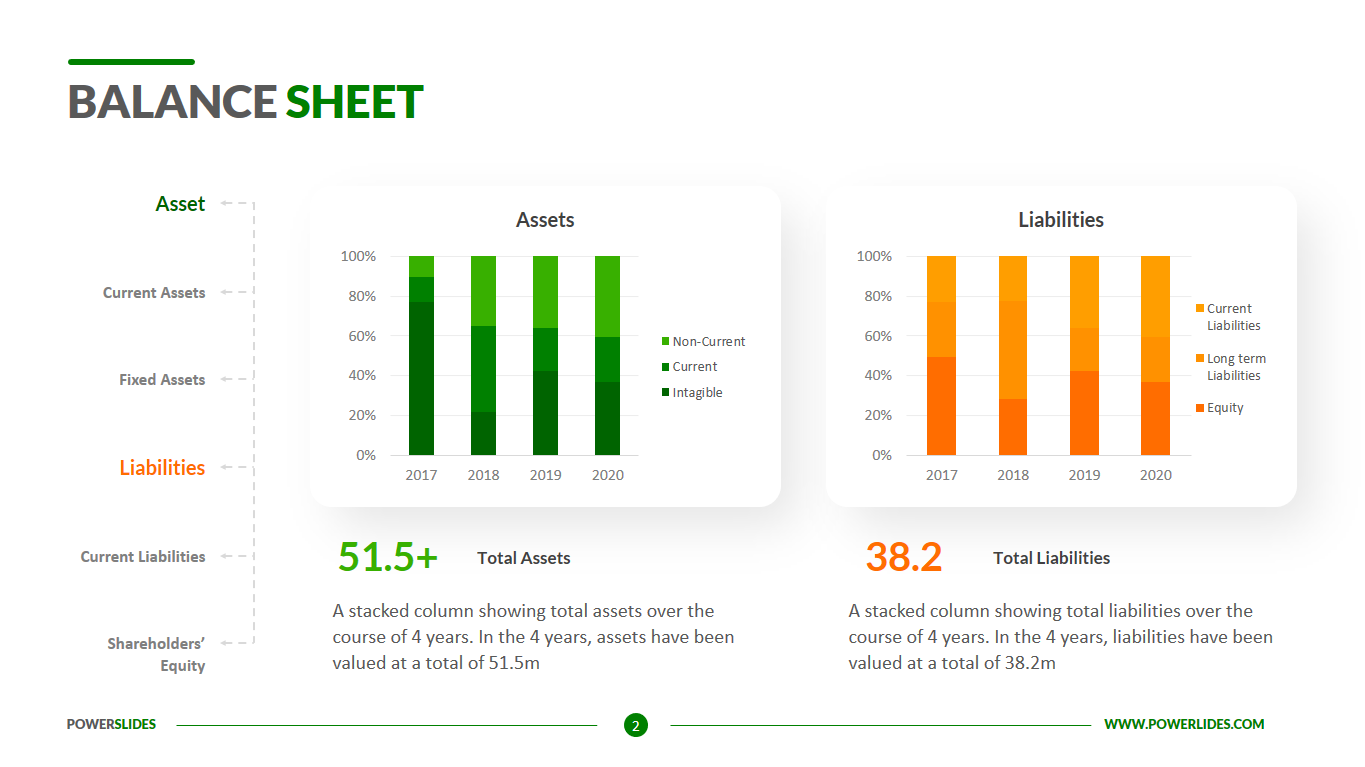
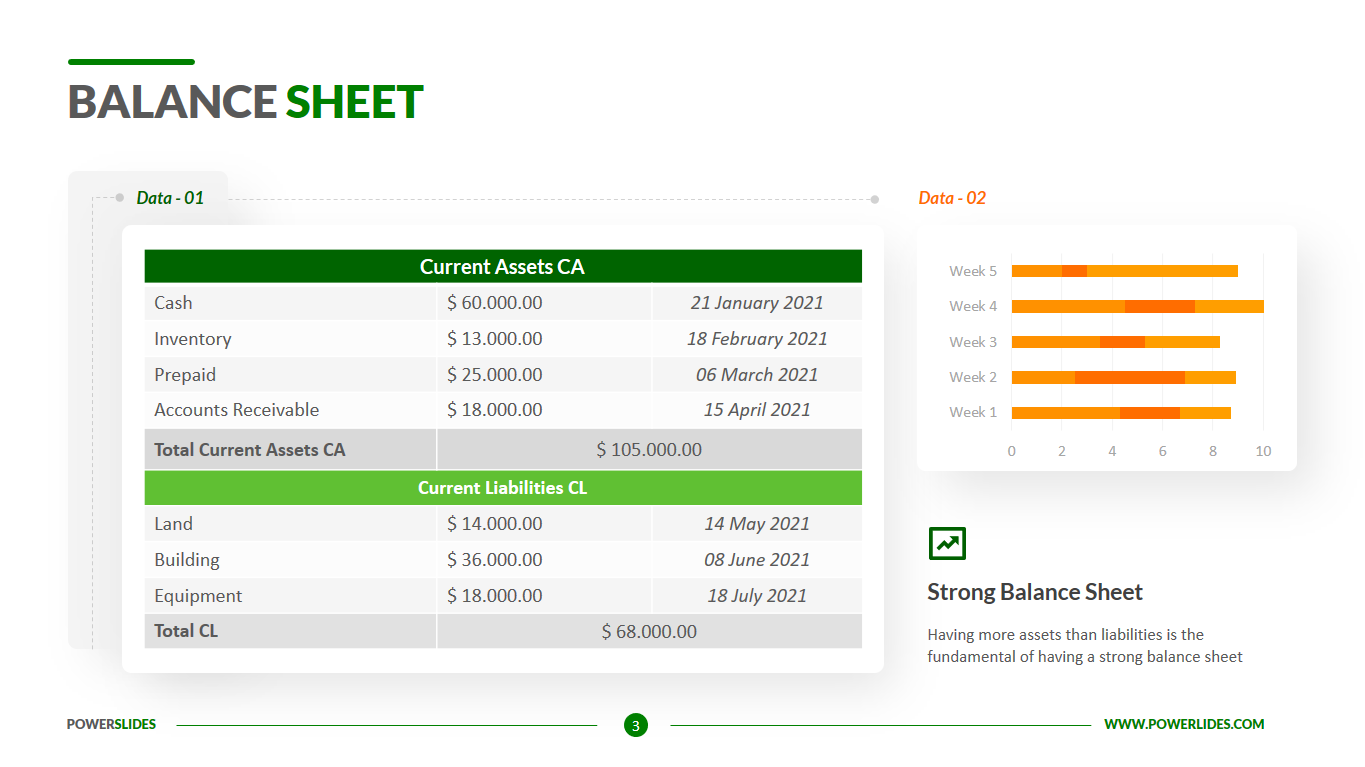
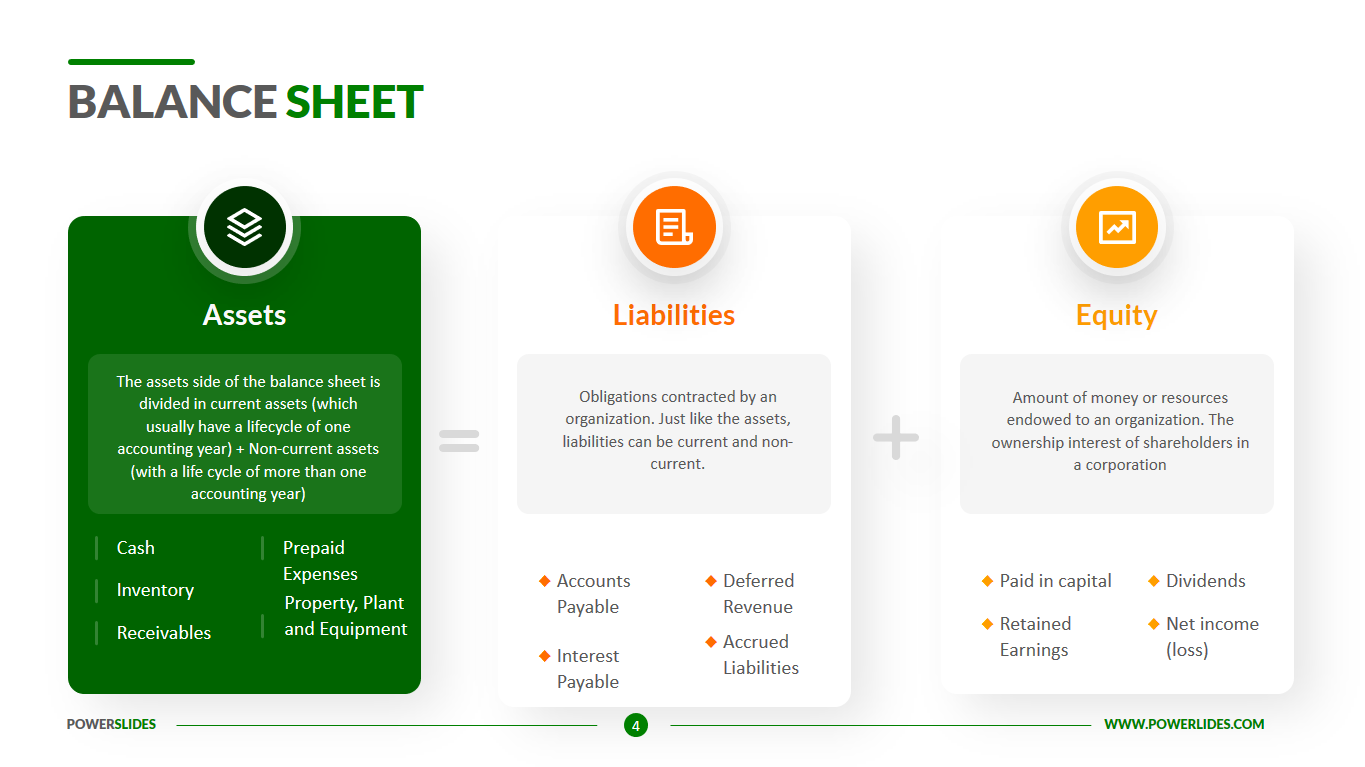
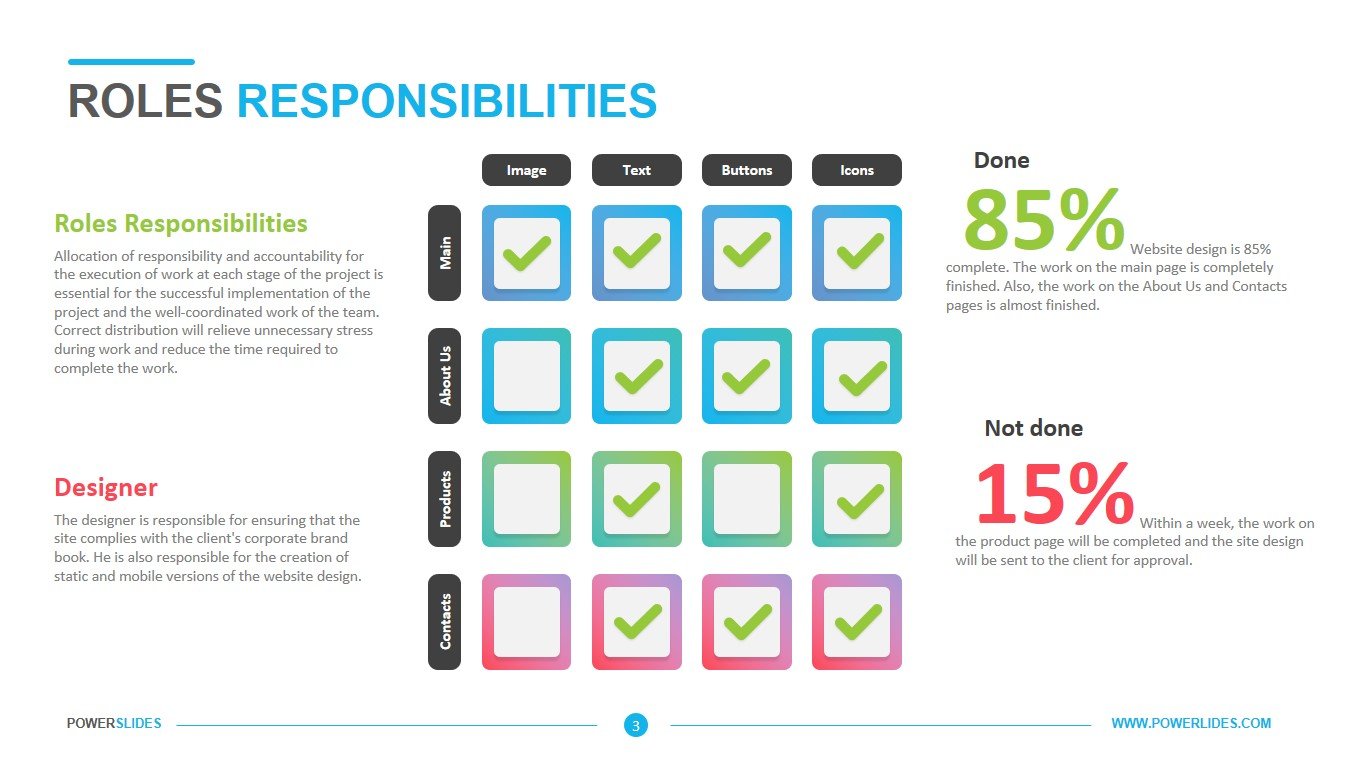
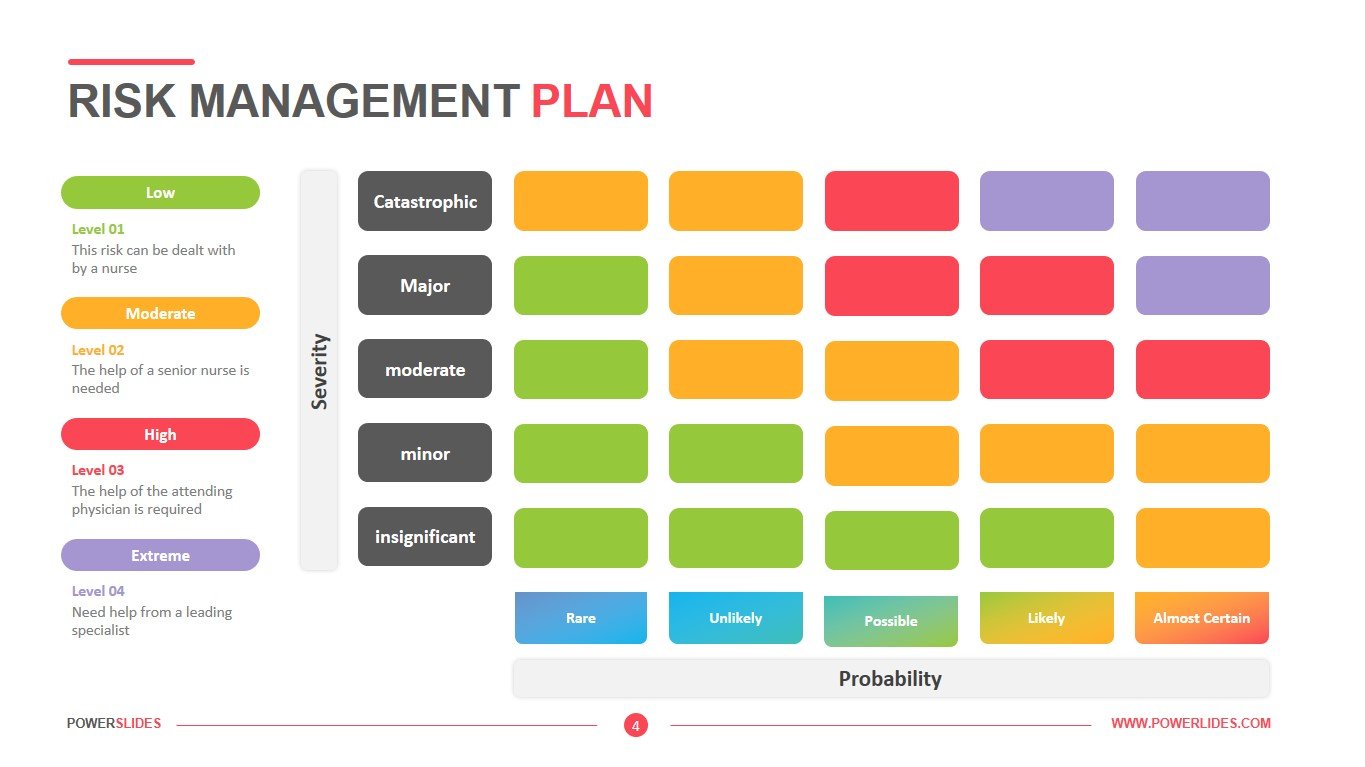
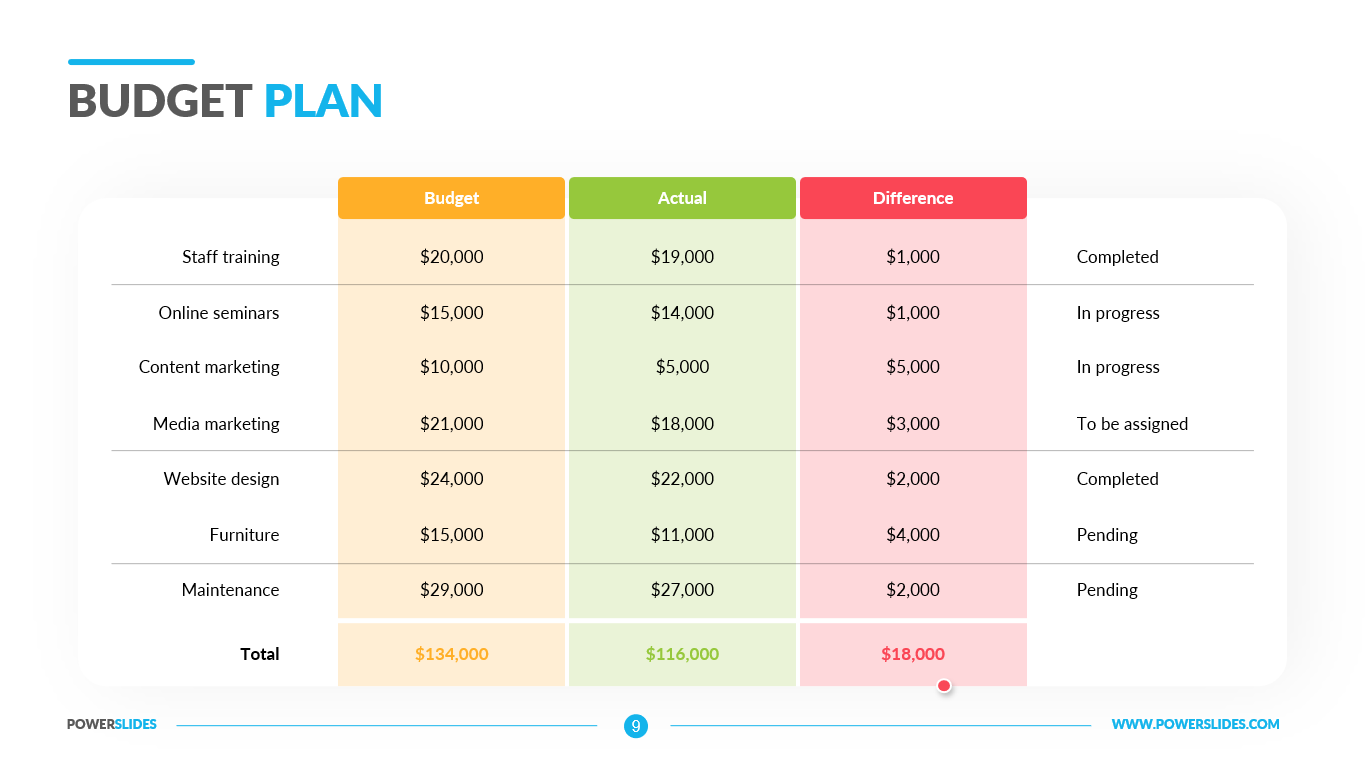
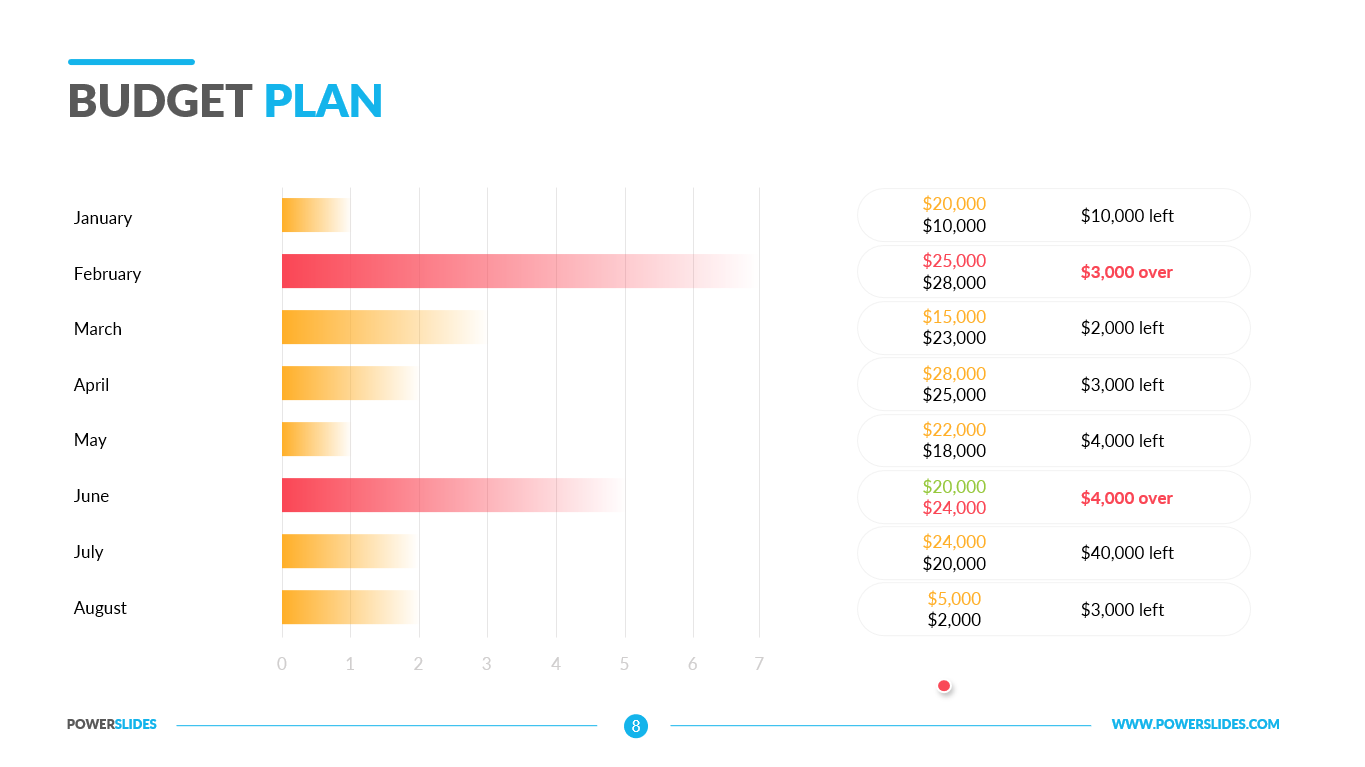
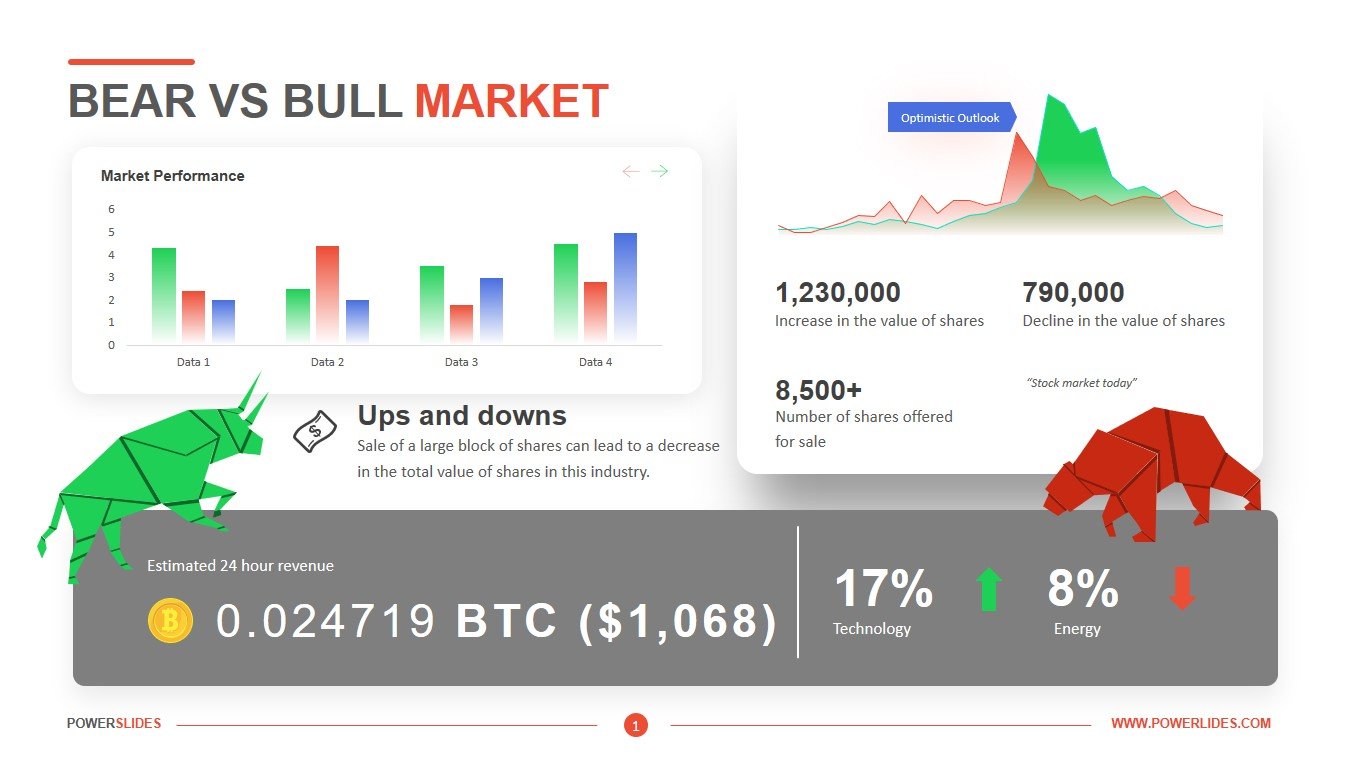
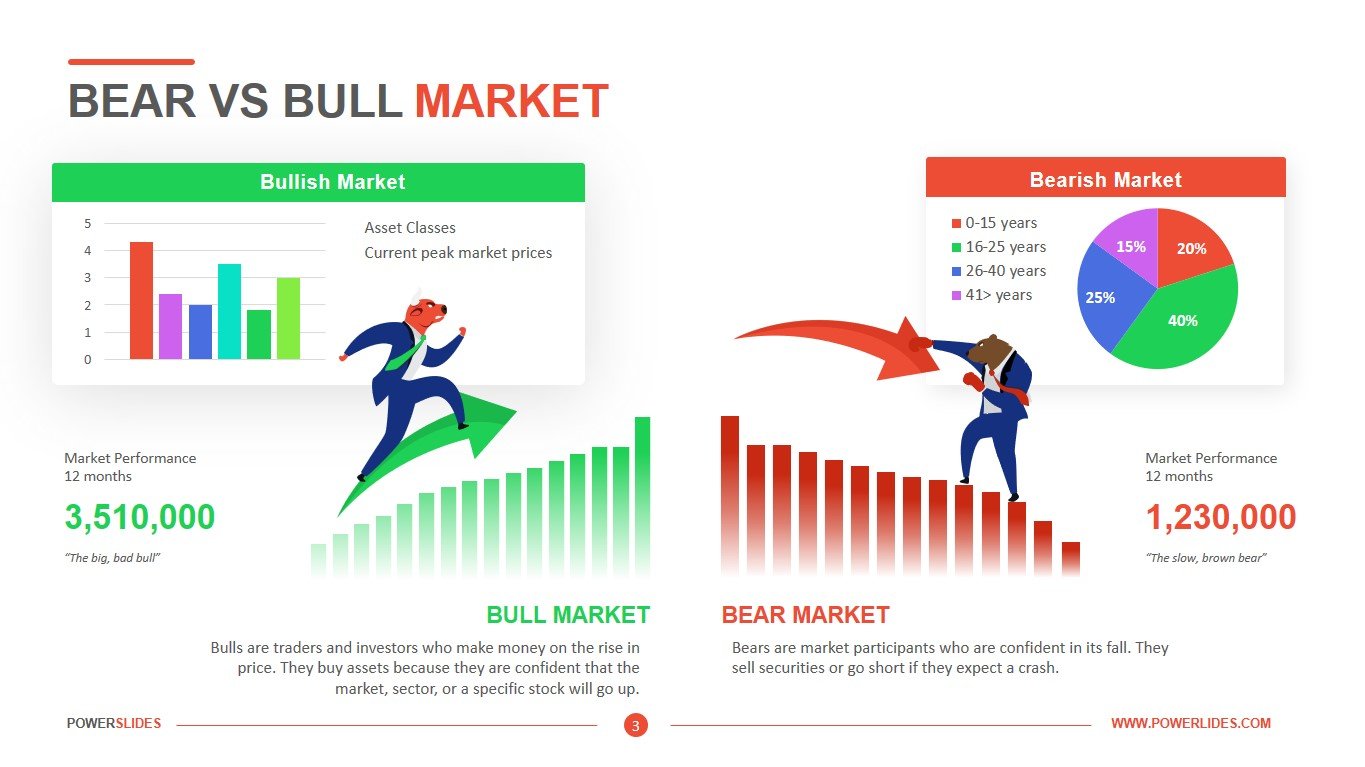
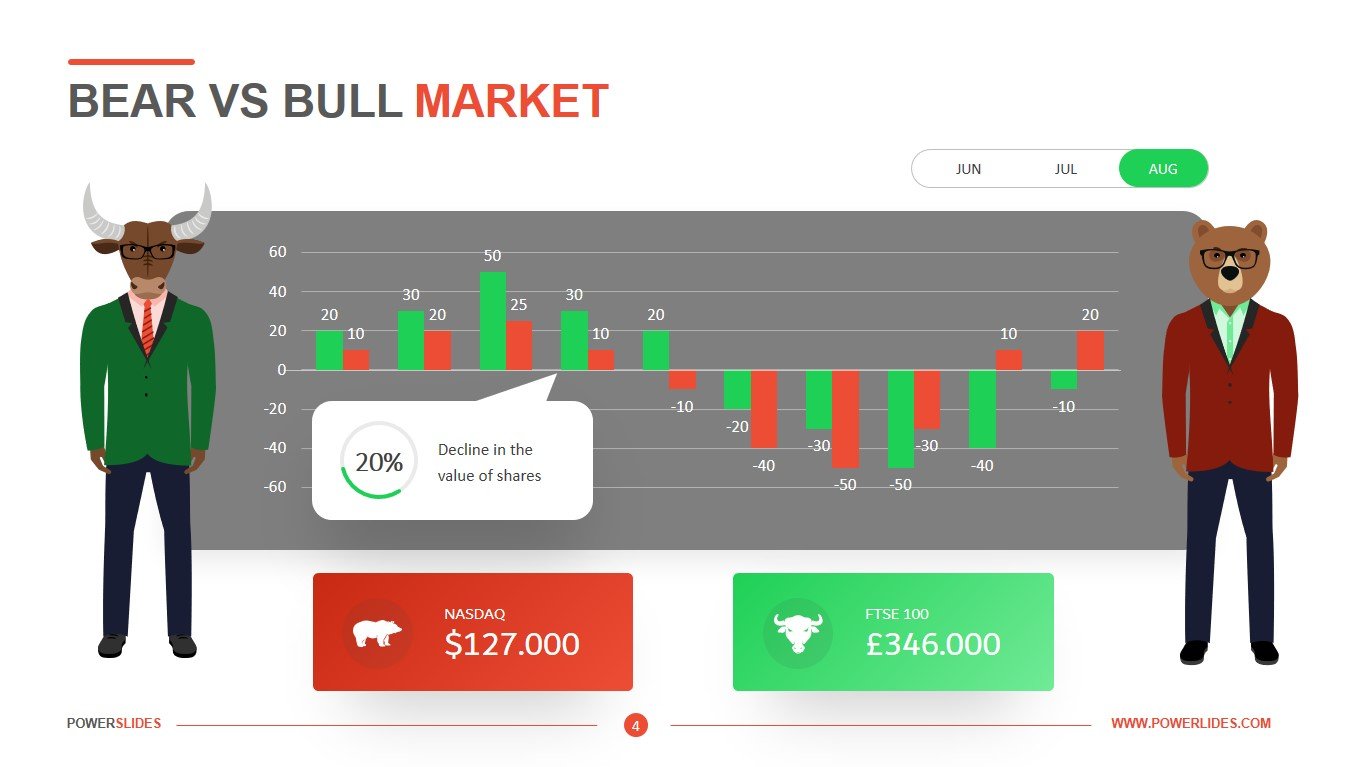
The first slide is a simple market evaluation. With graphical data sets and estimated 1-day revenue for a particular product for the estimation of demand and supply chain. The second slide is the future prediction of the market. With statistical data and dialogue boxes consisting of green and red colors for bull and bear market trends respectively, it is to forecast where the buyer would be on the rise in the near future or there would be a decline in the sellers. The third slide is a decade long comparison of the markets to determine whether an industry remains bearish or bullish in terms of its growth over the course of time. The fourth slide is of the same concept however with the monthly comparisons and data sets.


