Quarterly Report Template
What do you think of this template?

 (4.50/ 5)
9 ratings

 4 Slides
 File size: 16:9
 Fonts: Lato Black, Calibri
 Supported version
PPT 2010, PPT 2013, PPT 2016
Supported version
PPT 2010, PPT 2013, PPT 2016

Product details
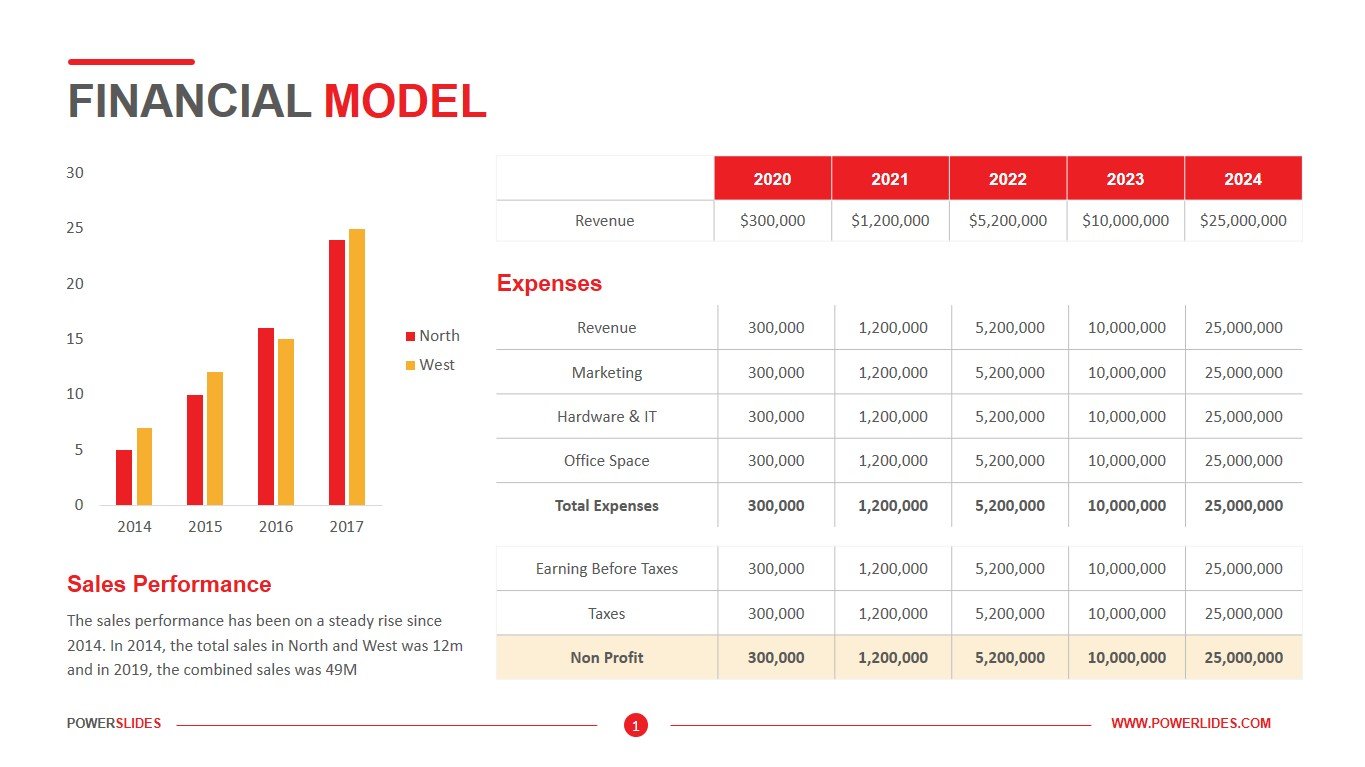
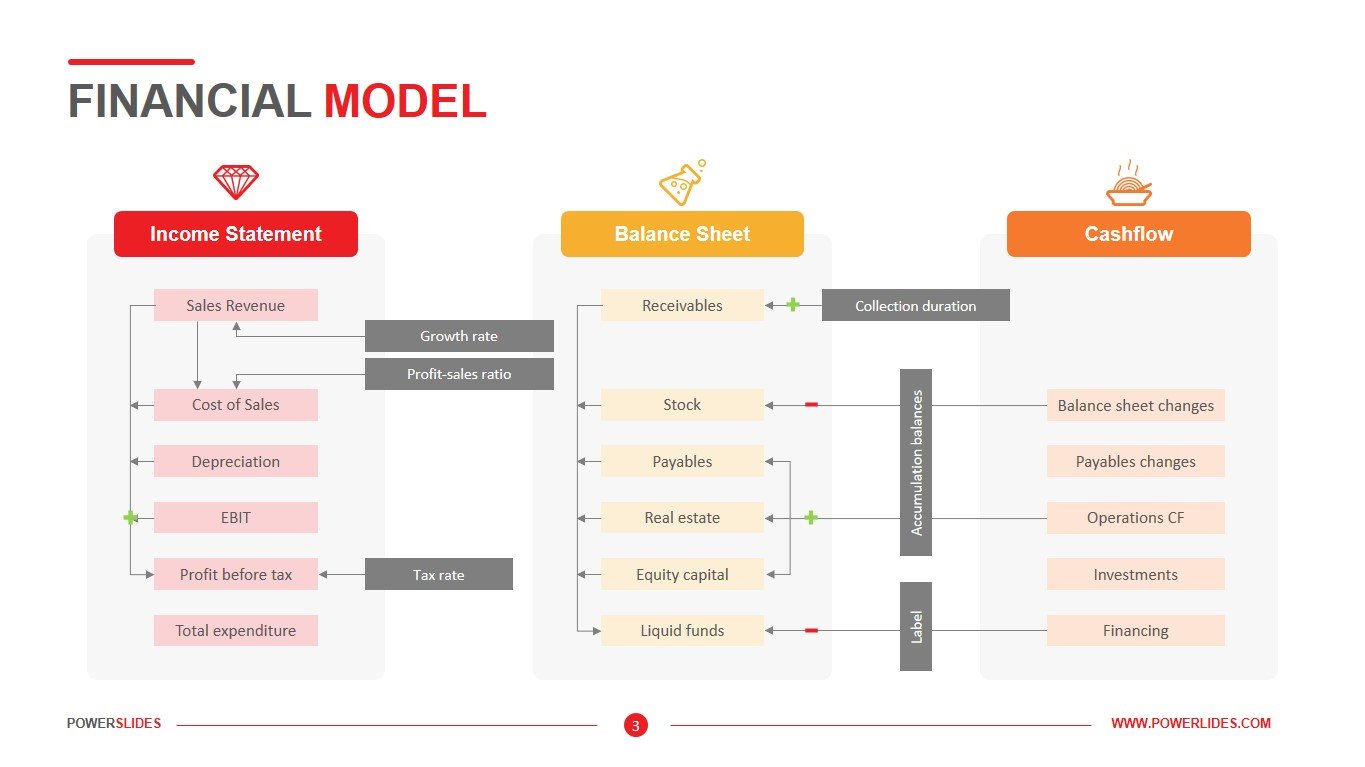
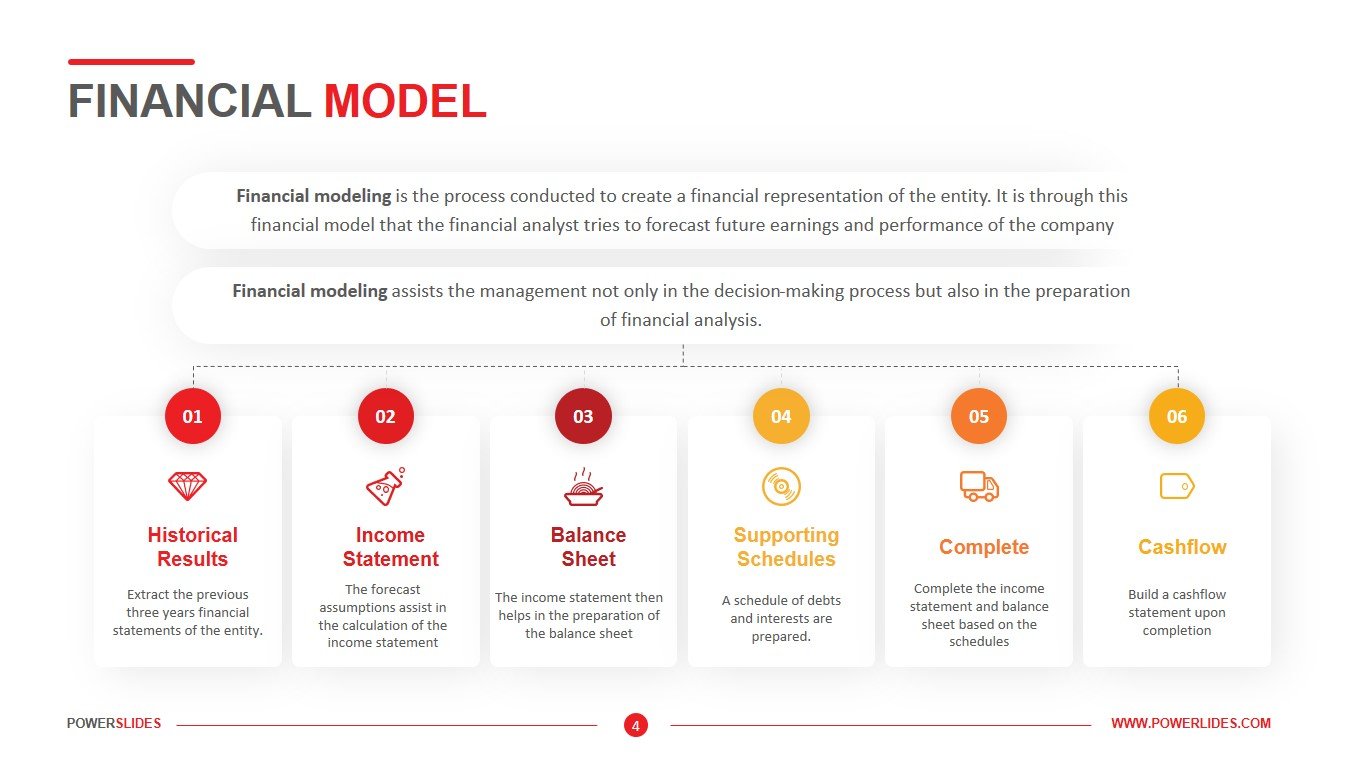
A quarterly report is a summary or collection of unaudited financial statements, such as balance sheets, income statements, and cash flow statements, issued by companies every quarter (three months). In addition to reporting quarterly figures, these statements may also provide year-to-date and comparative results. Most companies have an accounting period that ends with the calendar year: Dec. 31 and quarters that end on March 31, June 30, September 30, and December 31. Quarterly reports are typically filed within a few weeks of a quarter’s end. Quarterly reports include key accounting and financial data for a company, including gross revenue, net profit, operational expenses, and cash flow. Quarterly reports are usually accompanied by presentations from a company’s management where key performance indicator data are presented to investors and analysts. Management of firms often provides guidance for future financial results, as well. Analysts following companies often publish estimates of key metrics for future reporting periods. Financial publications average these estimates to arrive at street consensus estimates. Companies that exceed these estimates are said to have beaten expectations. Companies whose performances are in-line with estimates are said to have met expectations. Companies whose results are below estimates are said to have missed expectations. A quarterly report typically includes an executive summary, goals and objectives, highlights, and new and ongoing challenges. In terms of challenges, the quarterly report may include strategies planned or employed to overcome them. If relevant, the quarterly report may discuss previous quarterly reports’ data and provide a comparison between them and the current report. Preparing a quarterly report takes time and may require extended research. Gathering financial and performance data from various sources will generally ensure that the quarterly report is as comprehensive as possible. Graphs and spreadsheets provide a visual representation of the data provided. Quarterly reports help investors and analysts gauge the health of a company by providing insight into a firm’s performance.
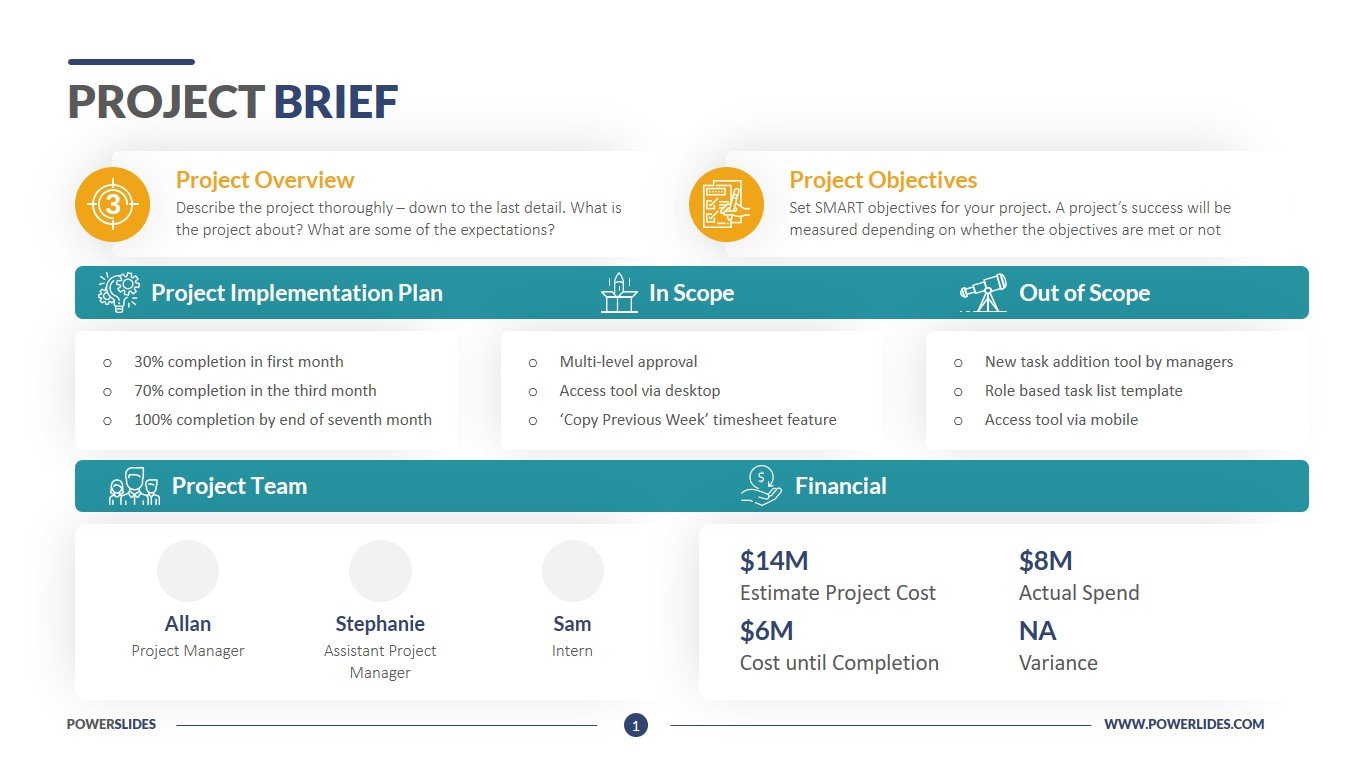
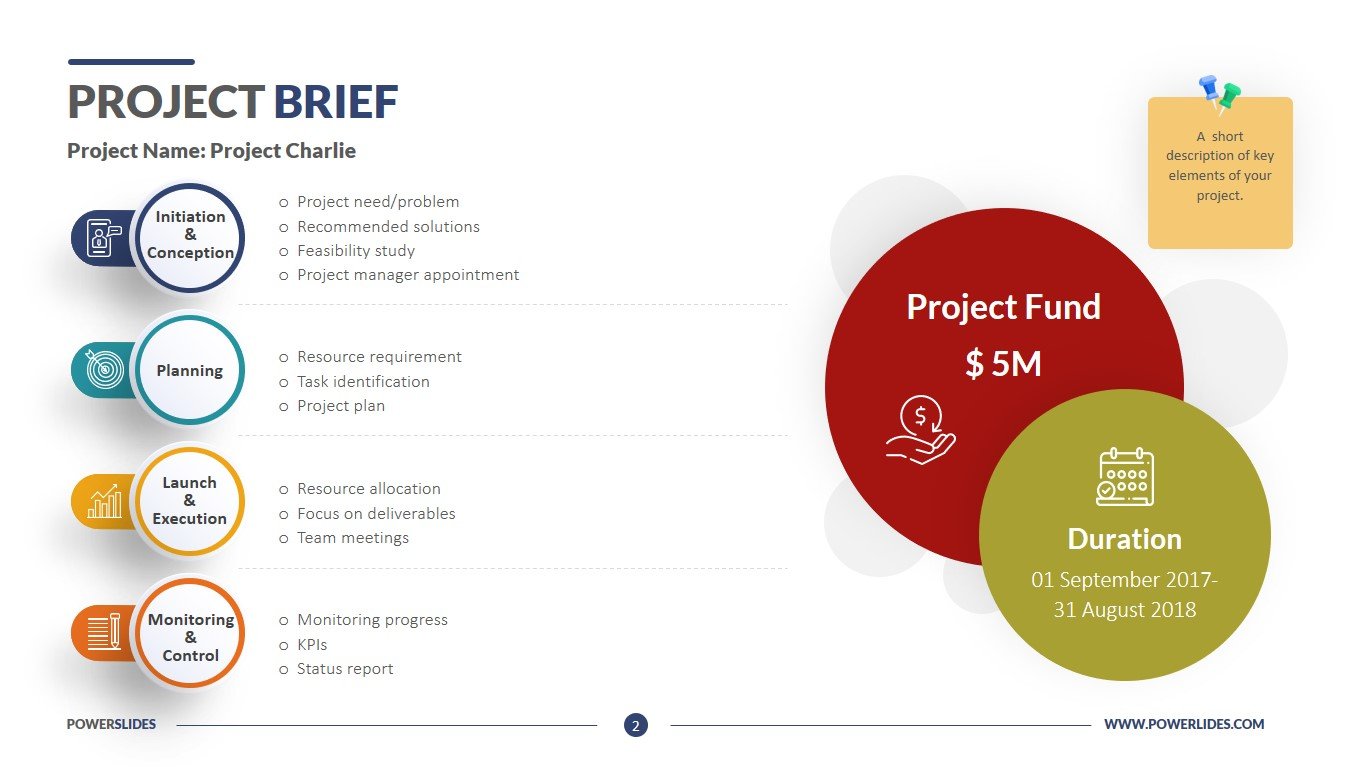
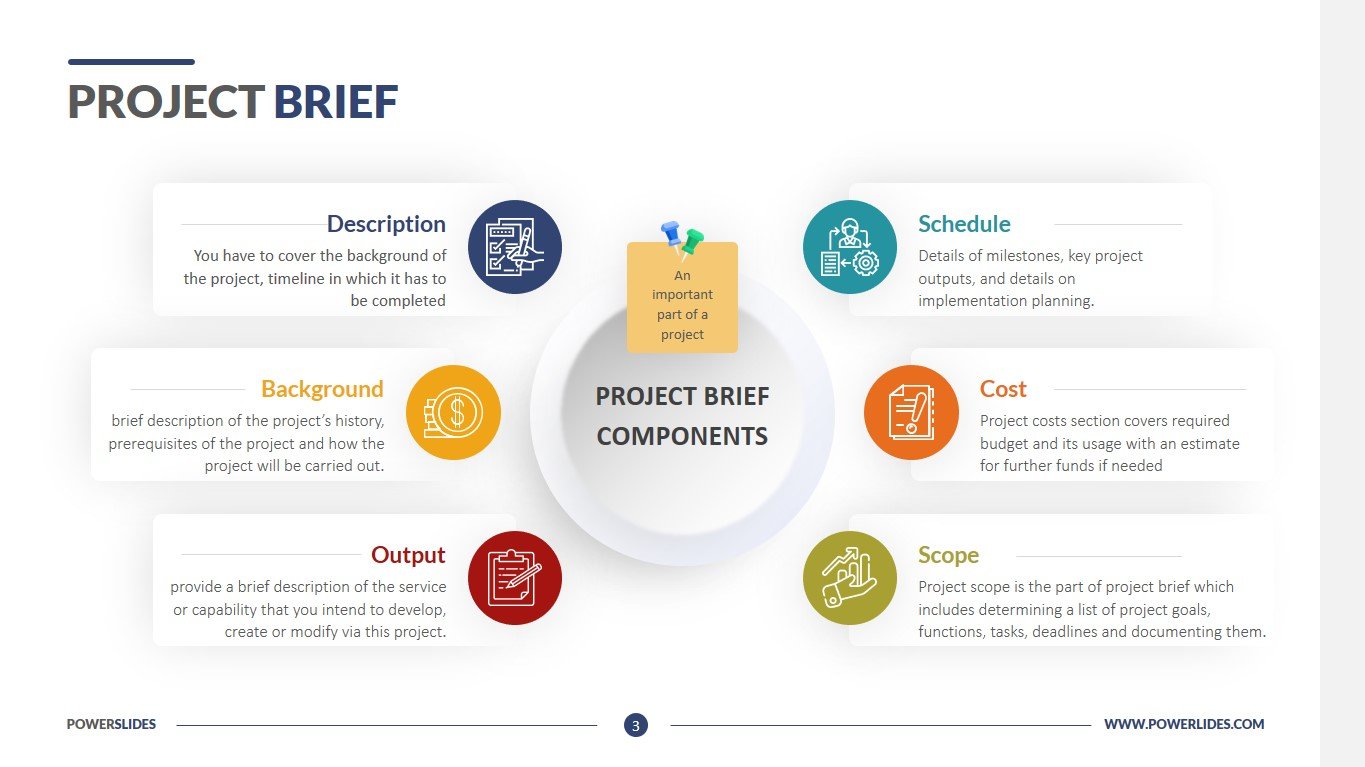
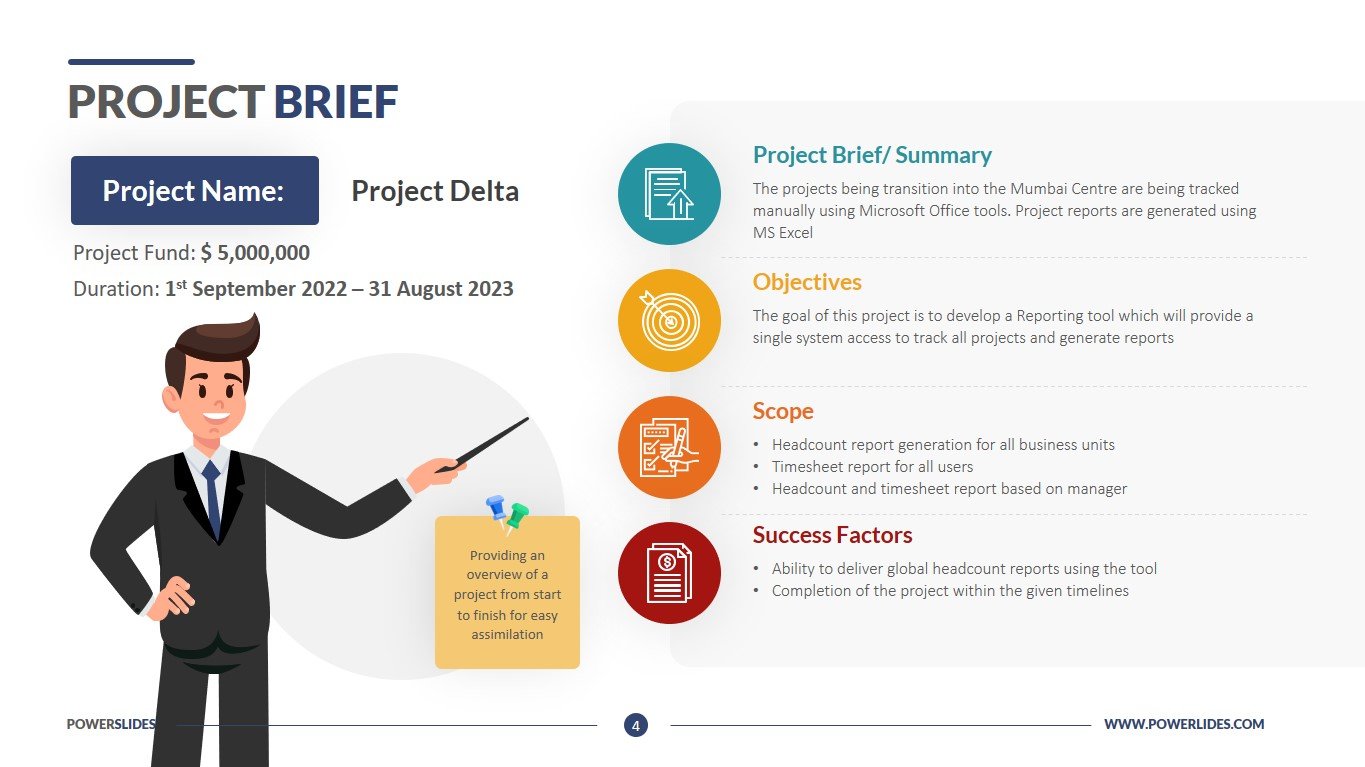
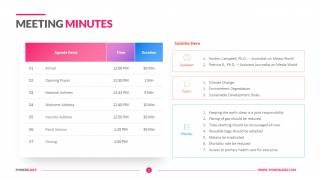
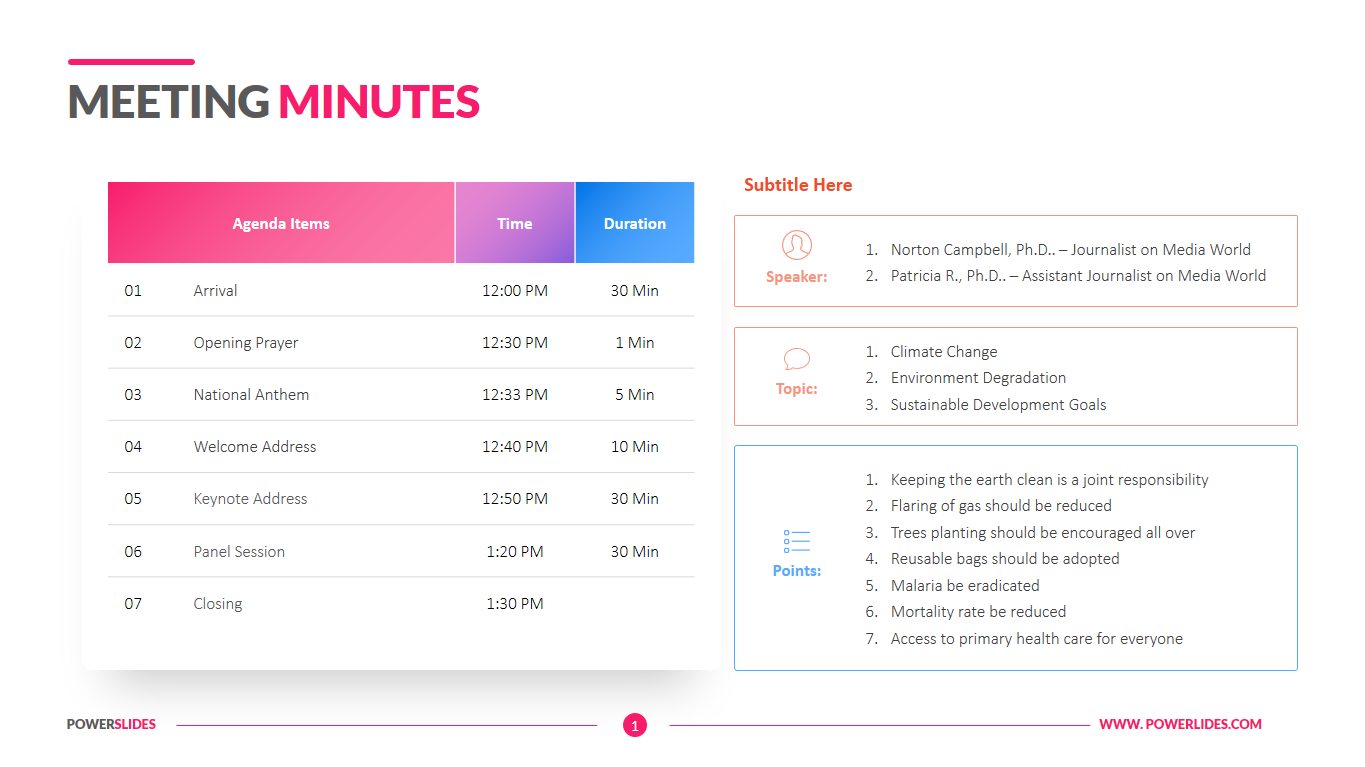
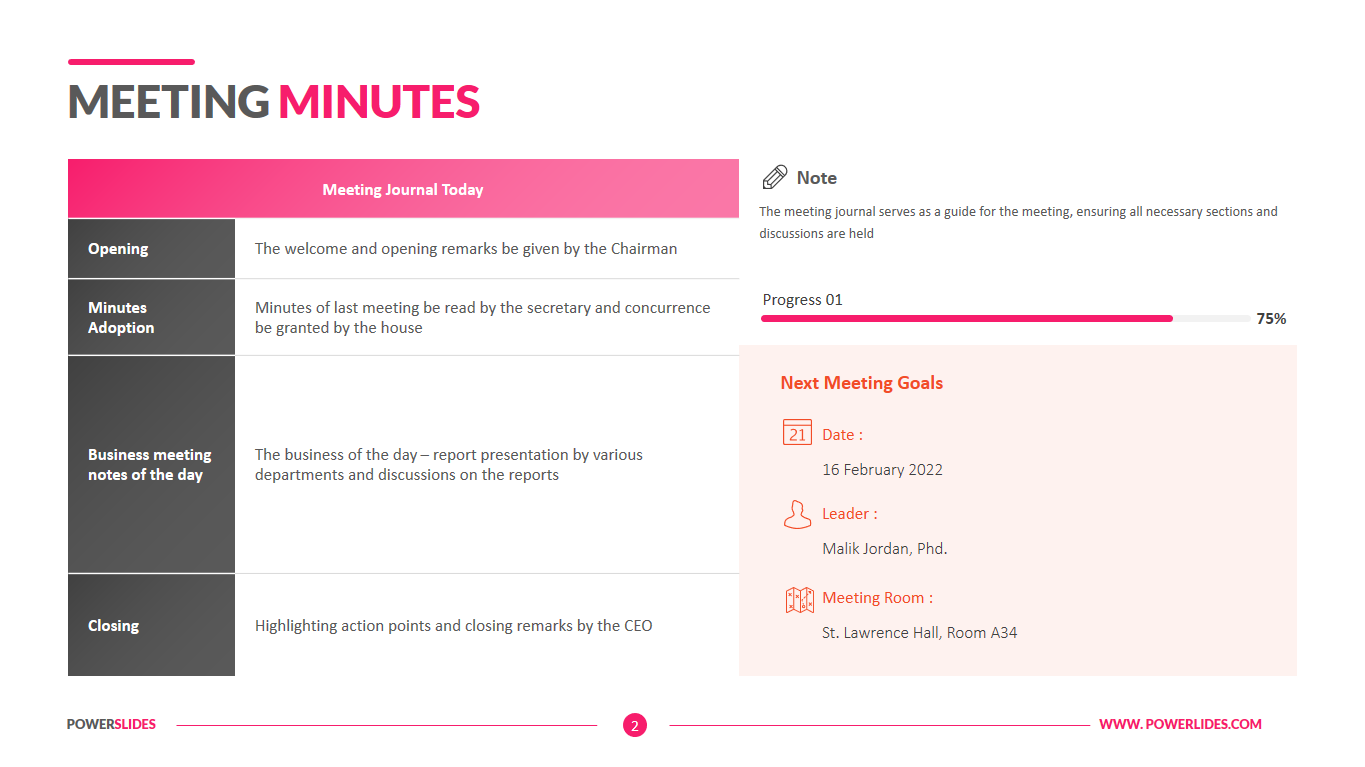
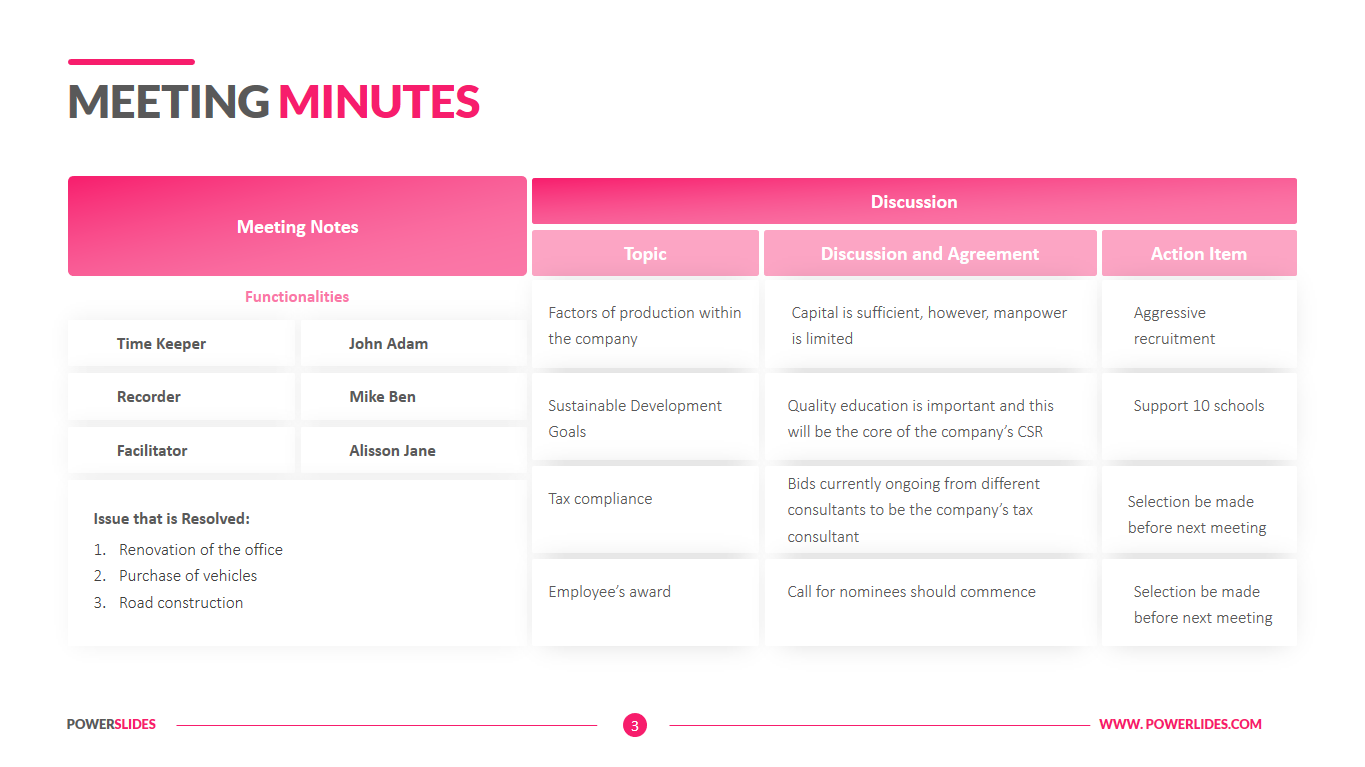
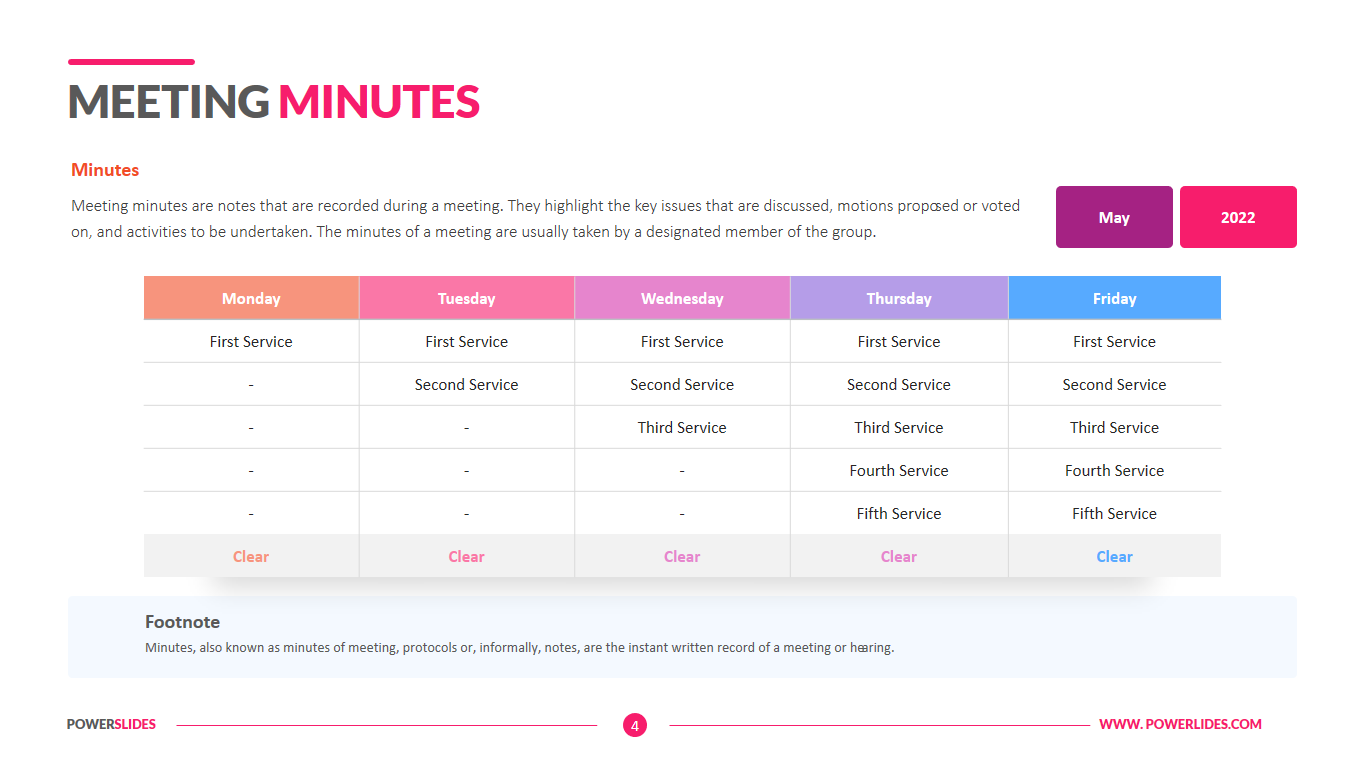
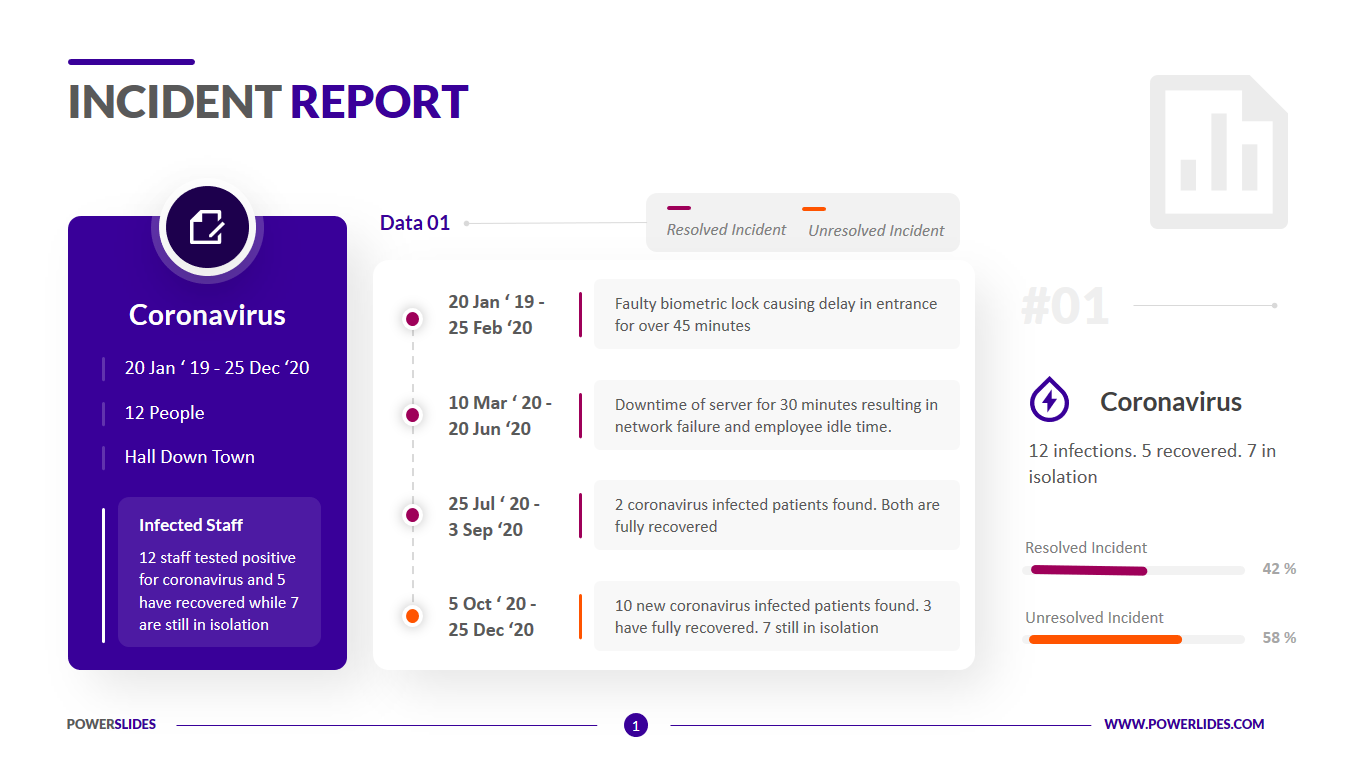
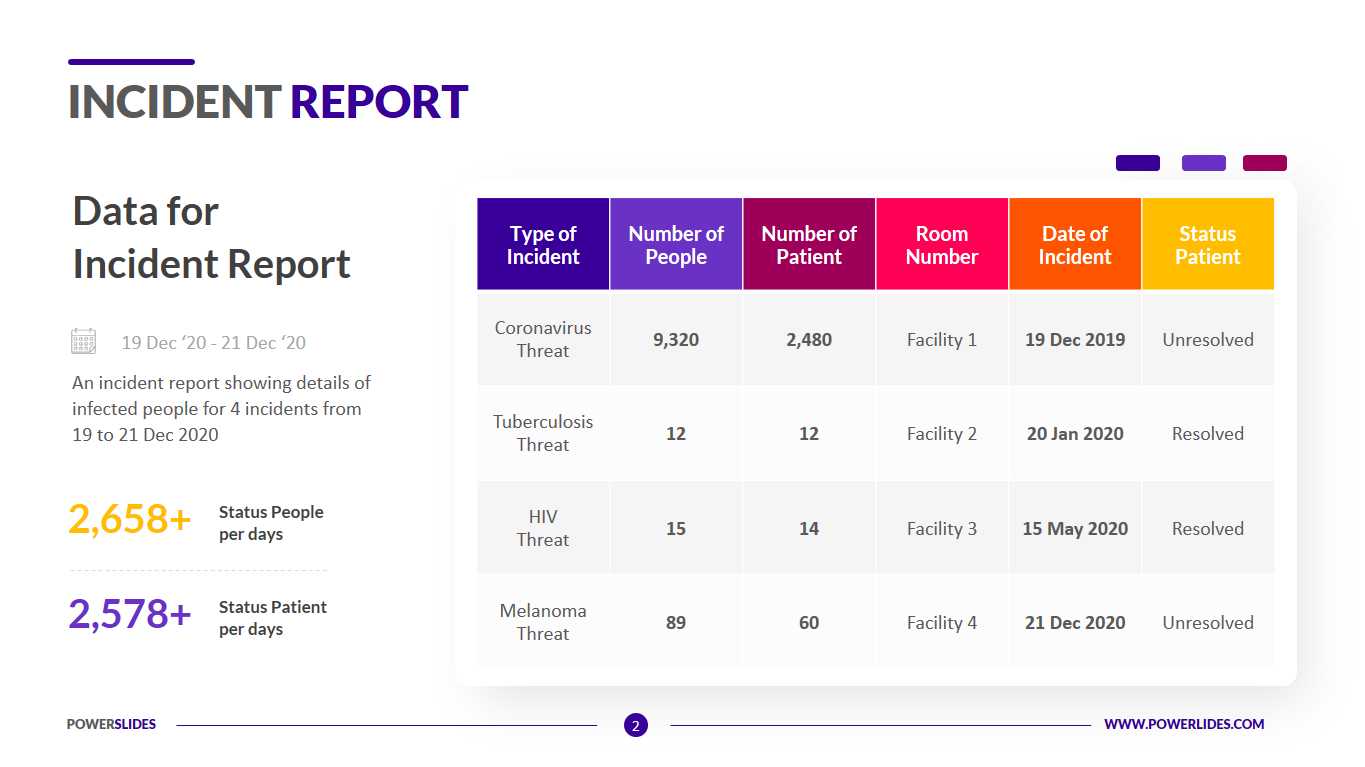
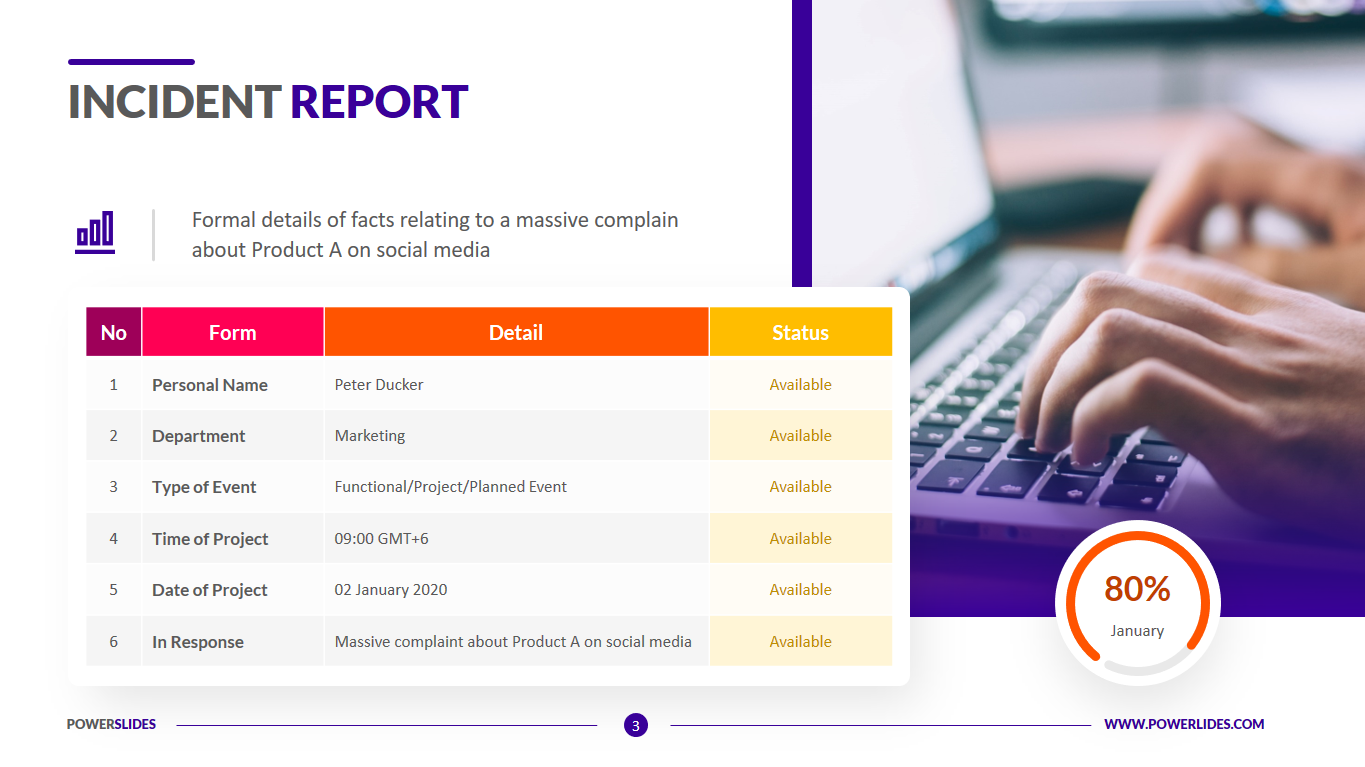
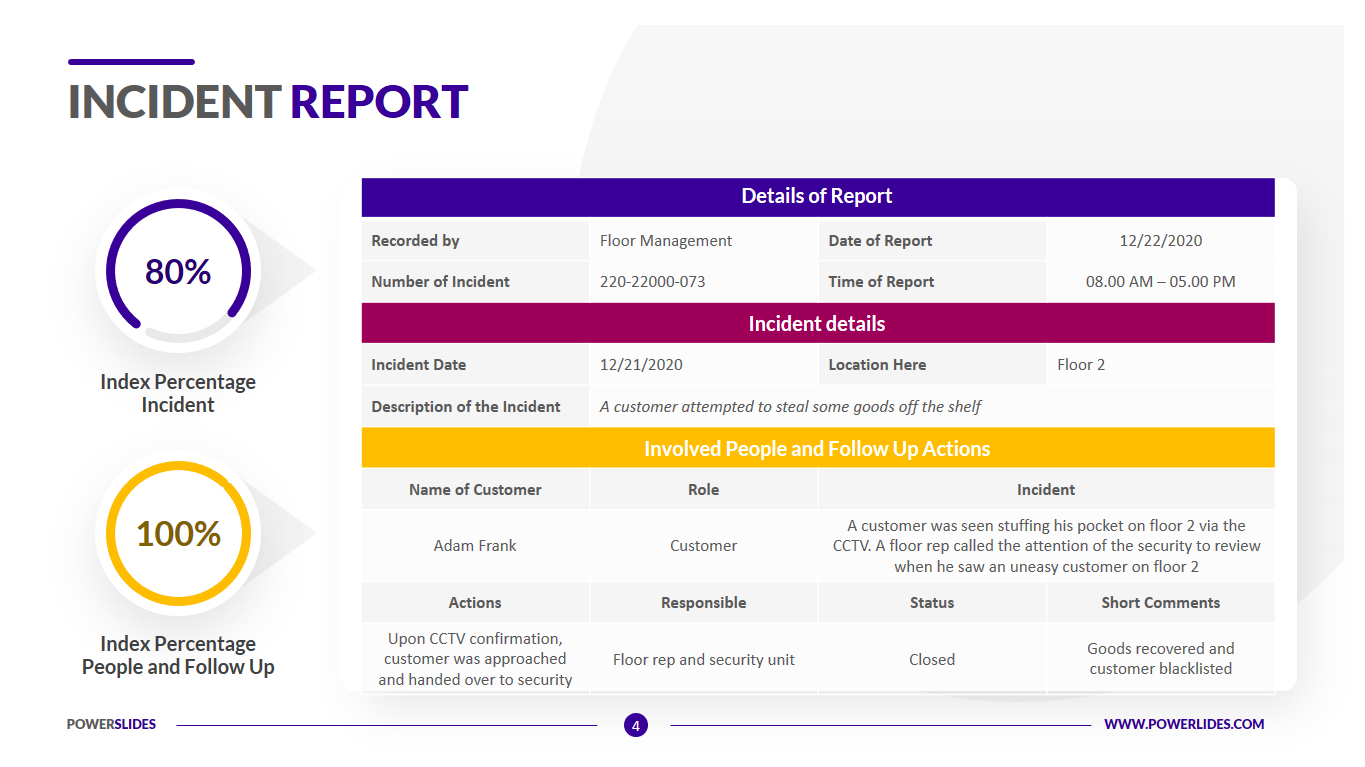
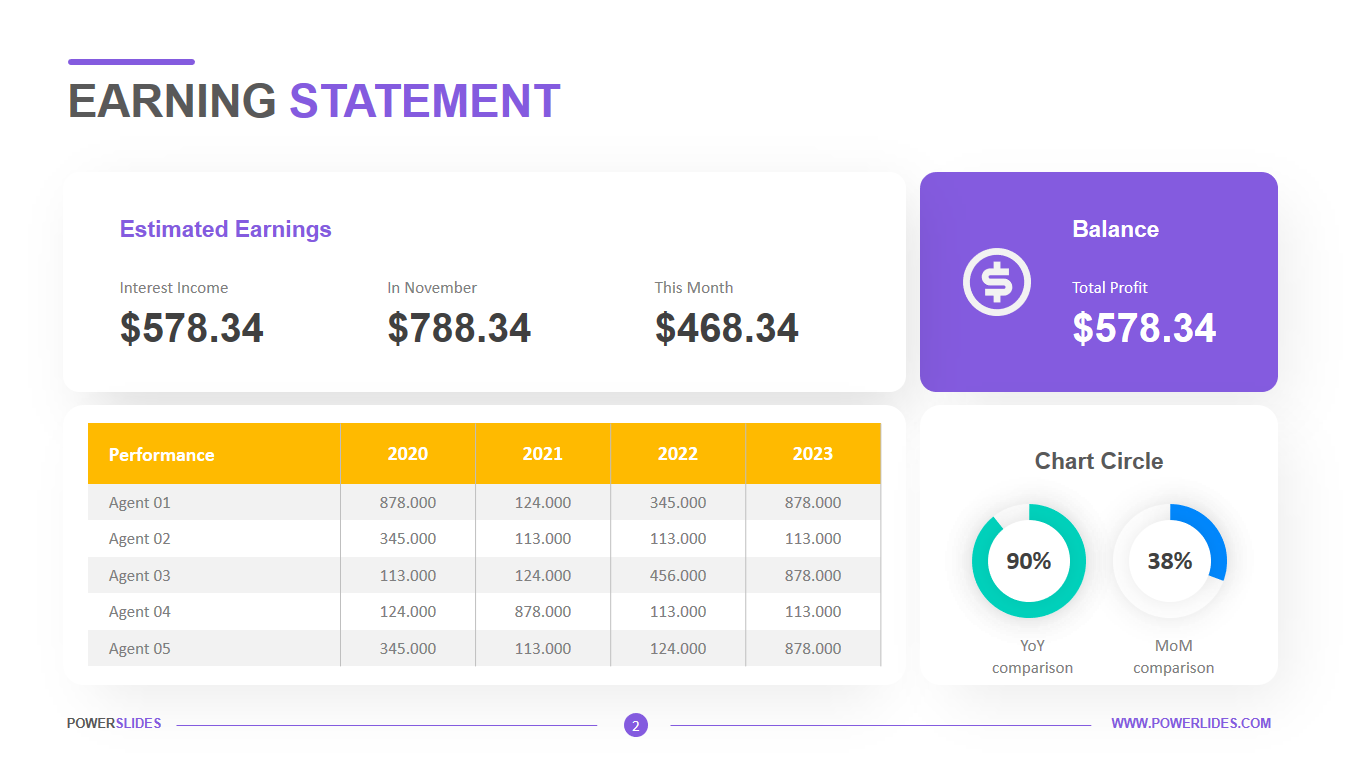
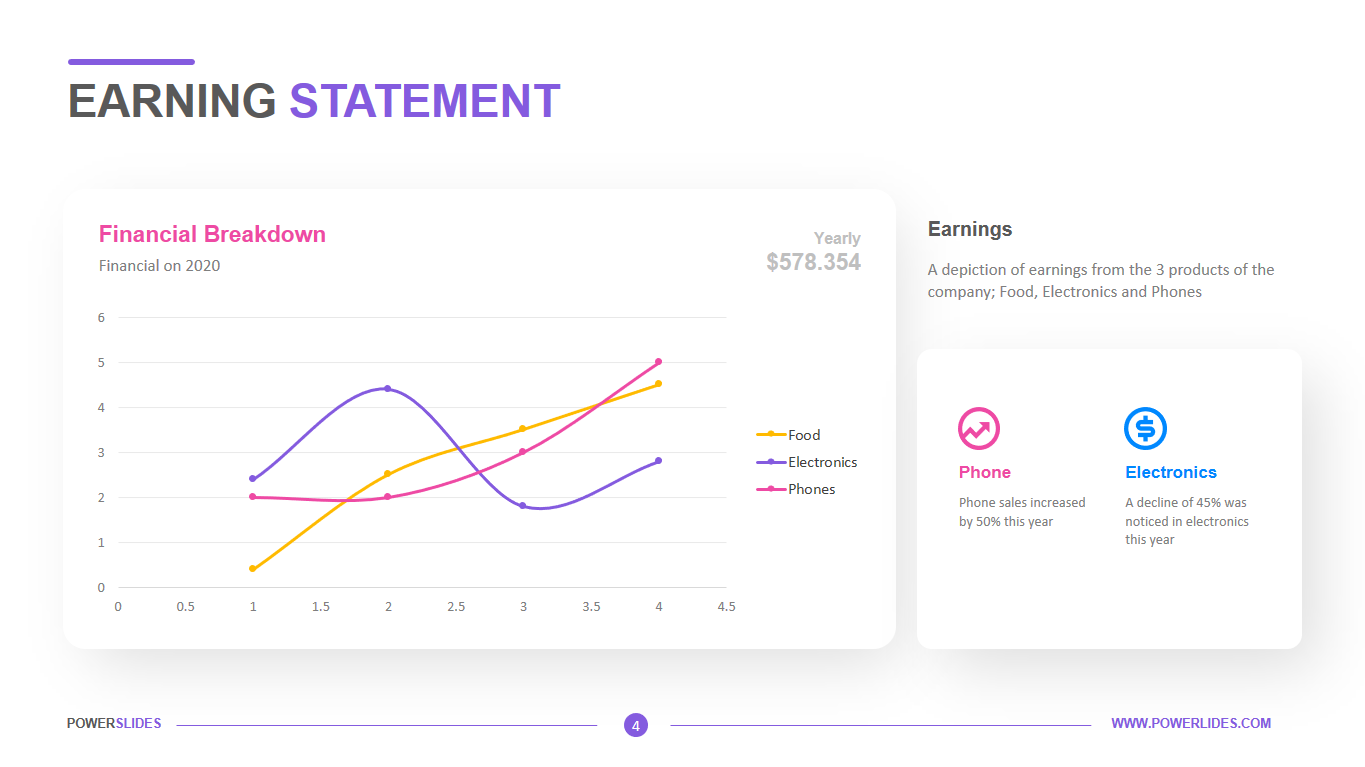
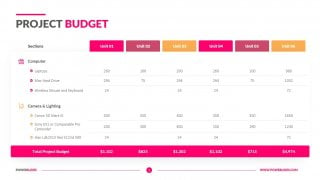
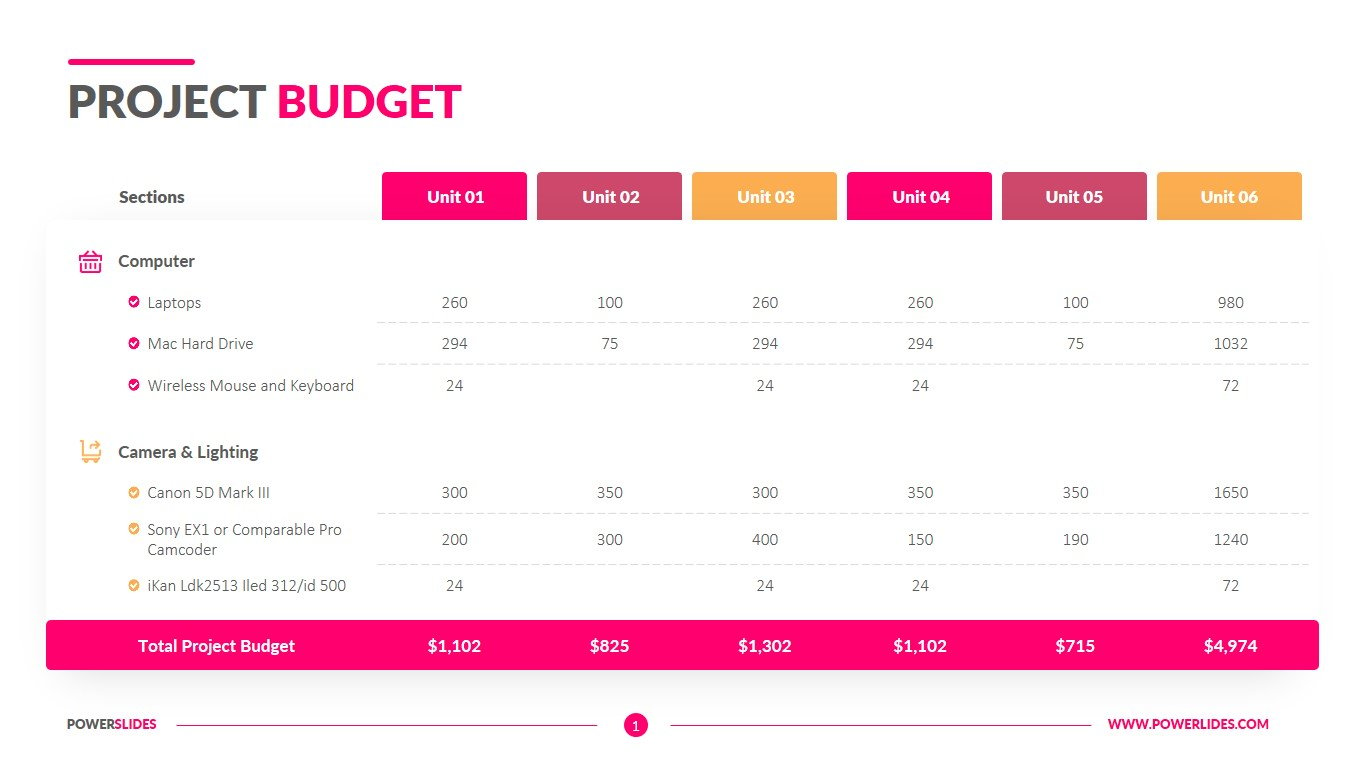
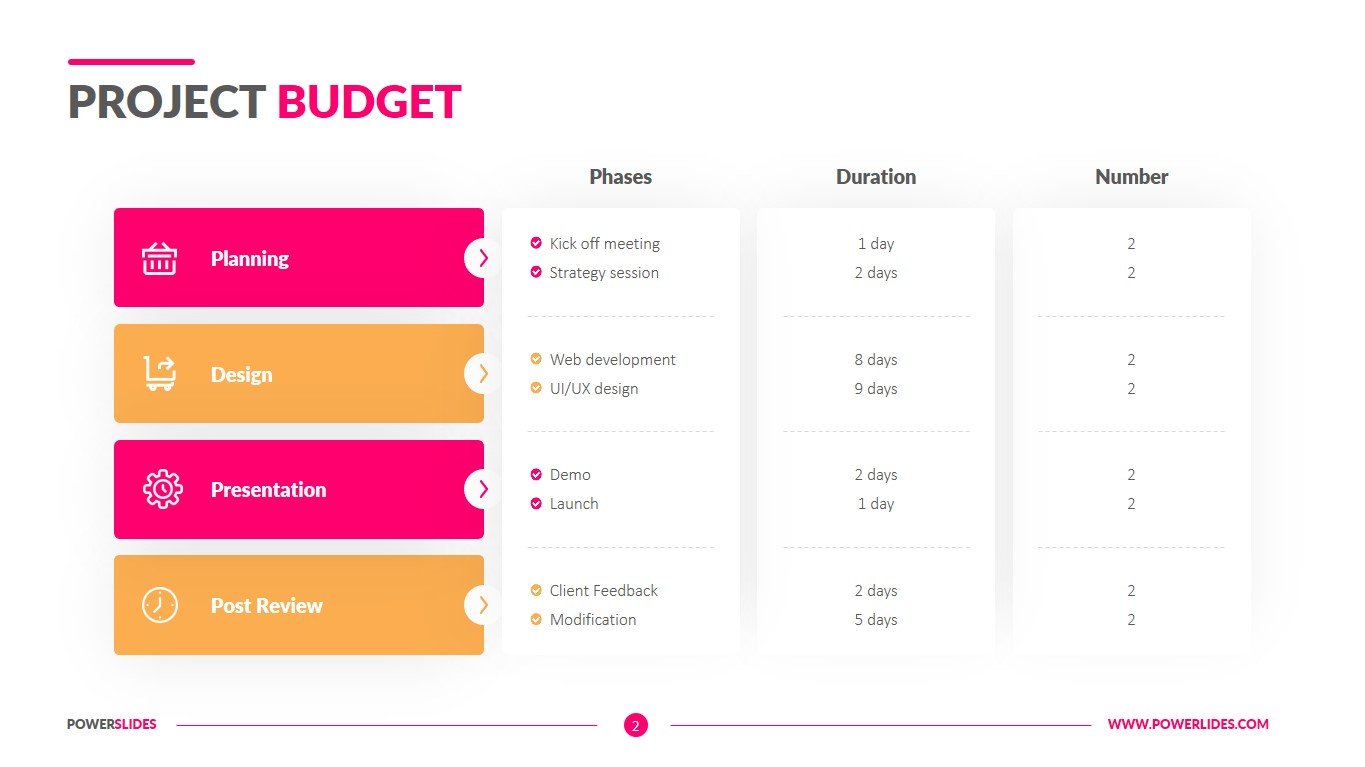
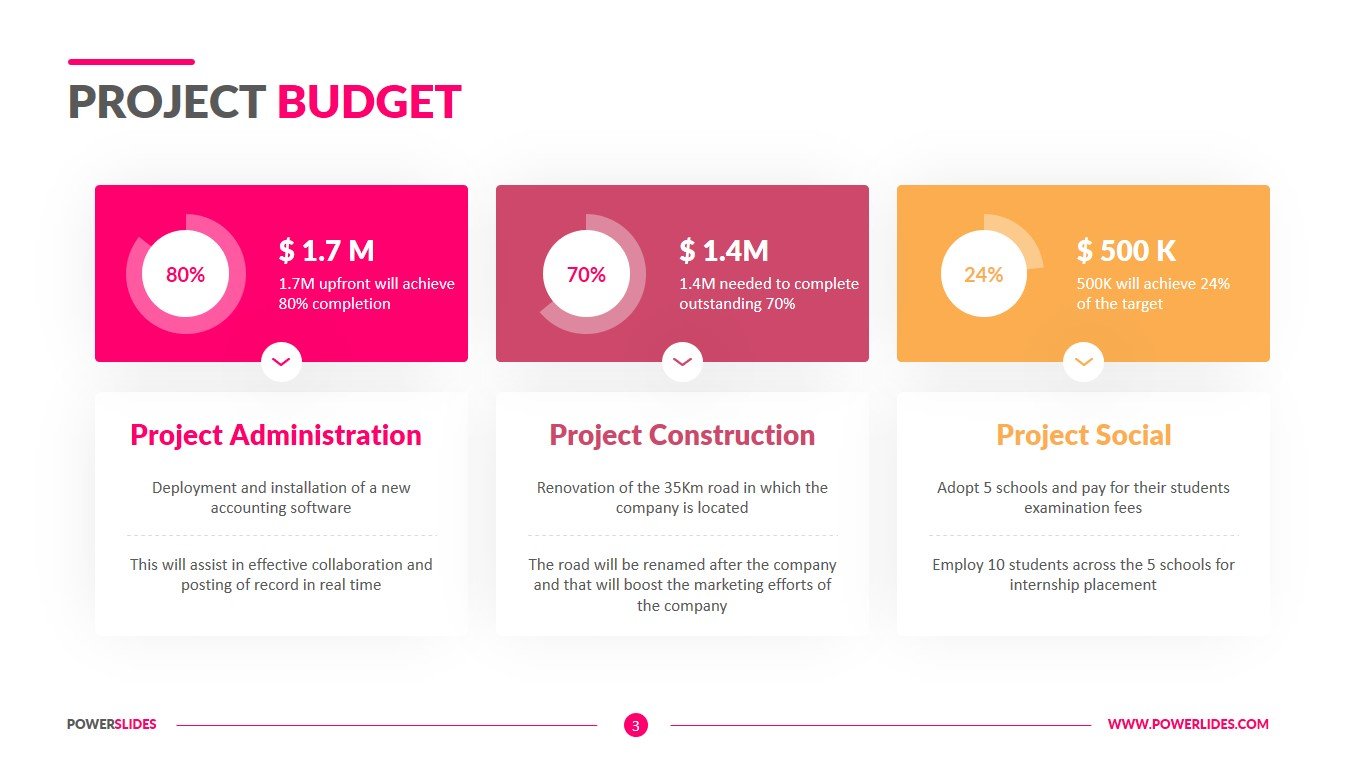
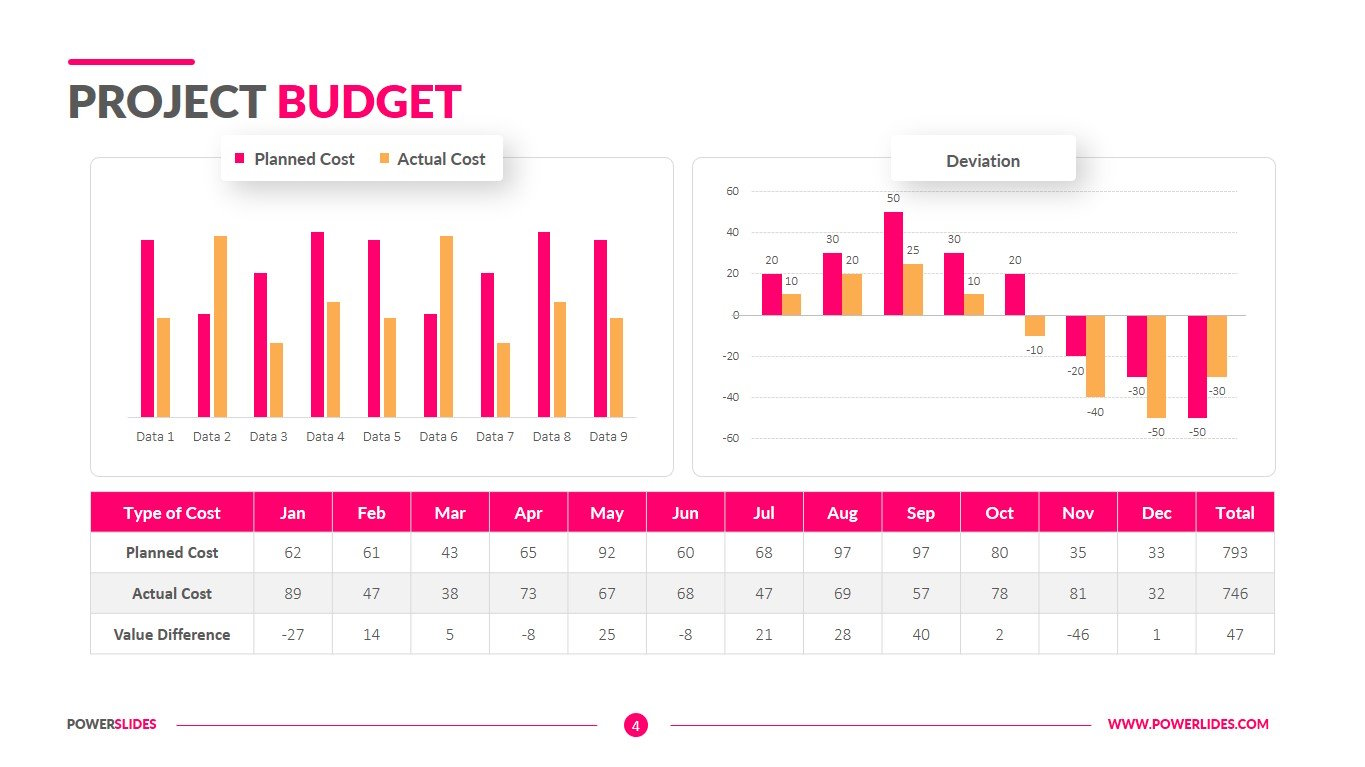
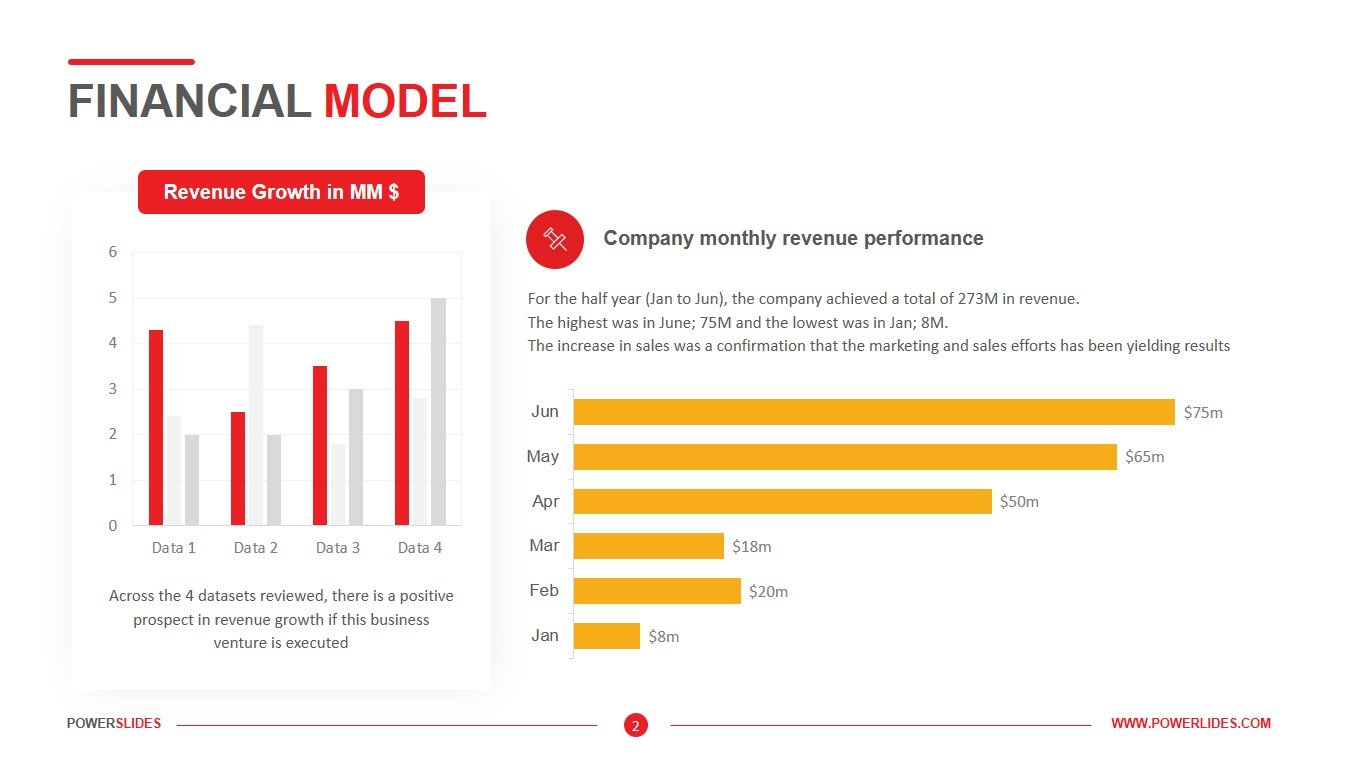
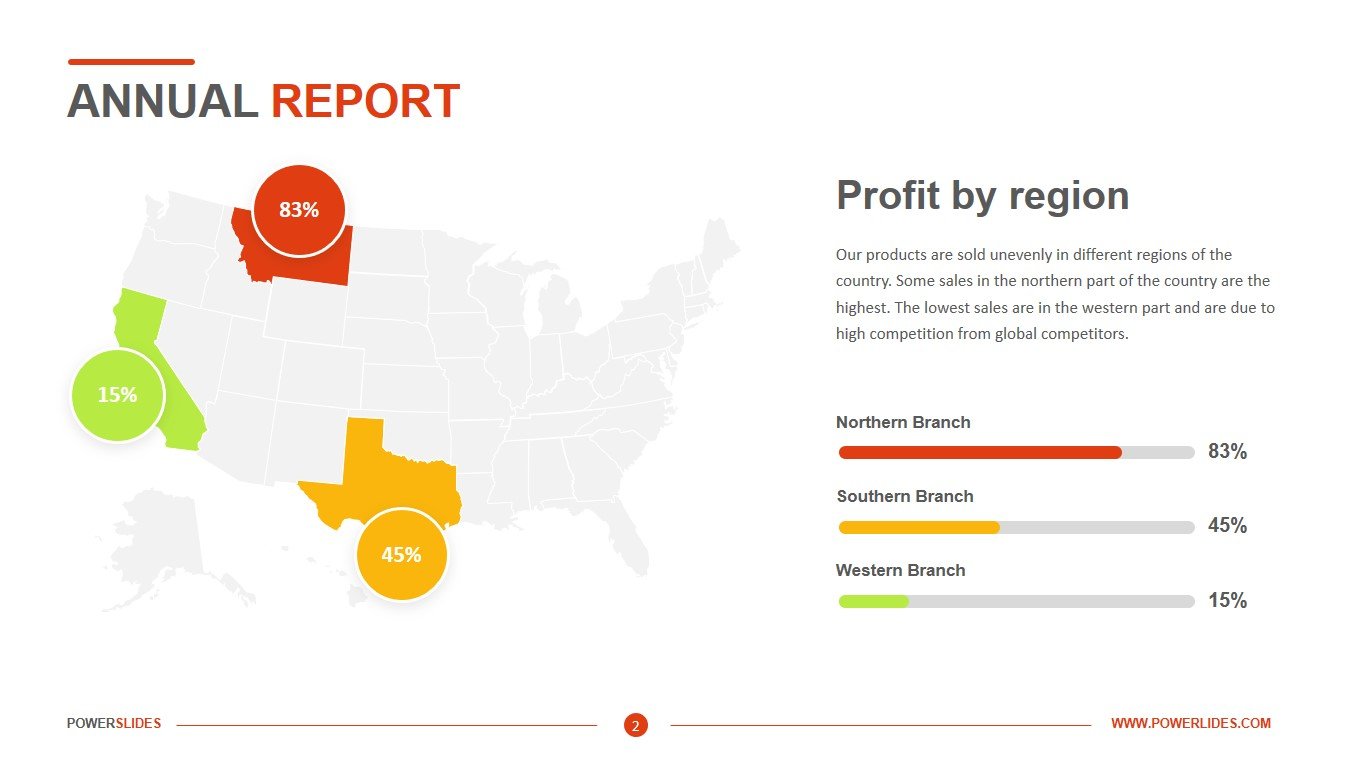
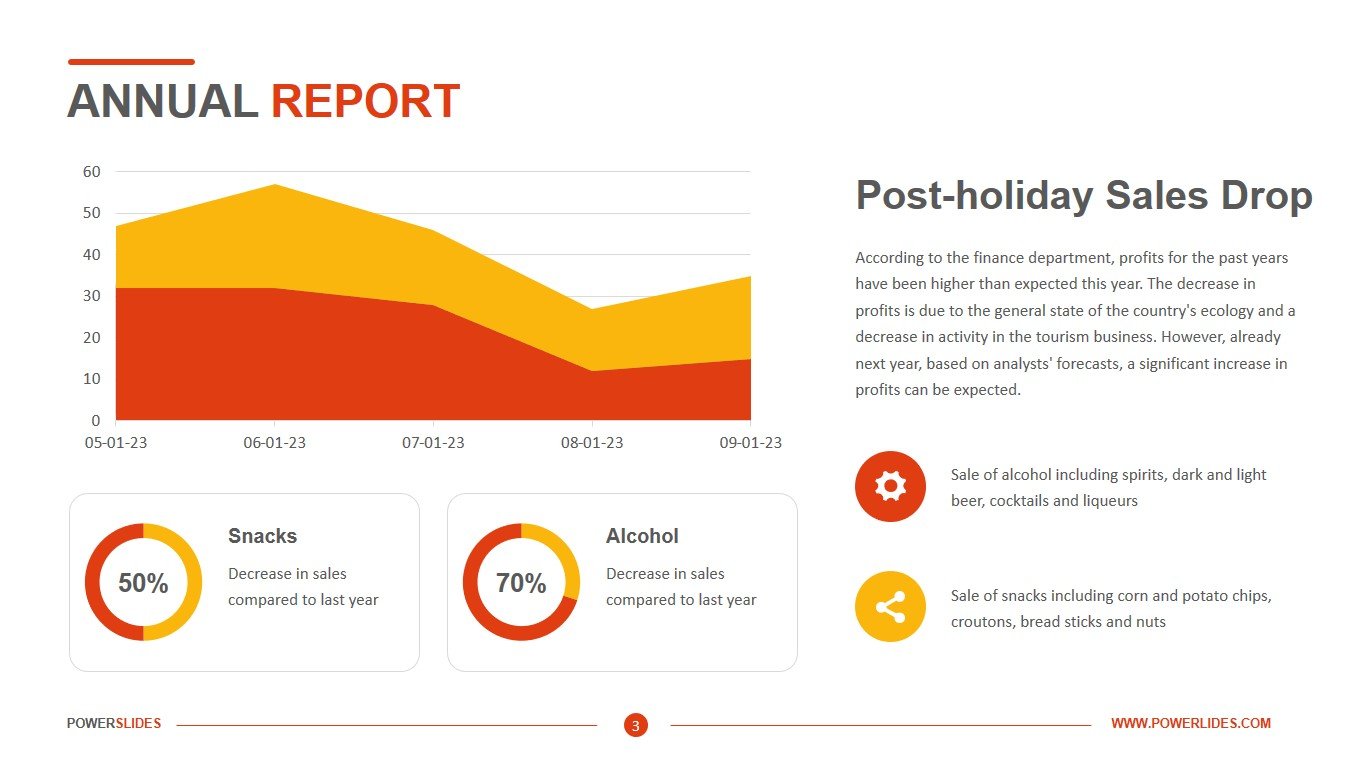
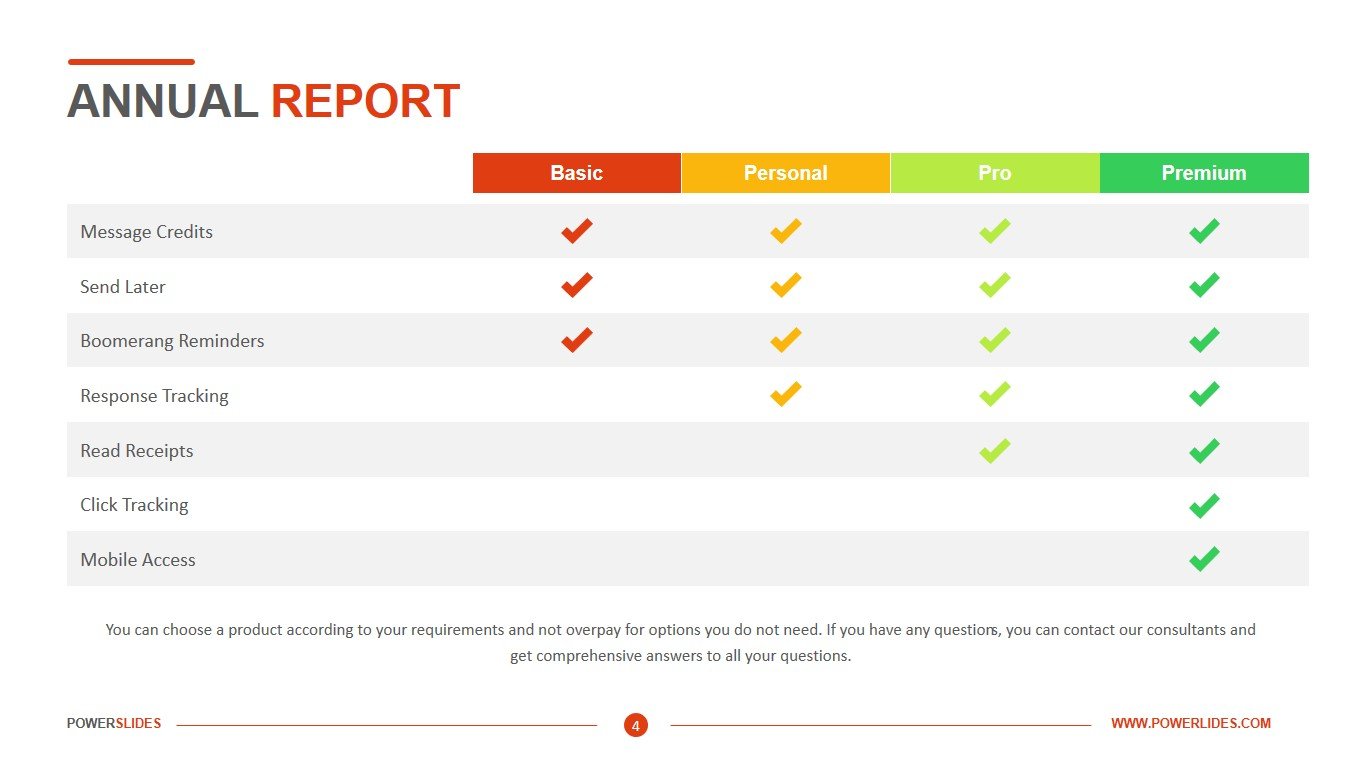
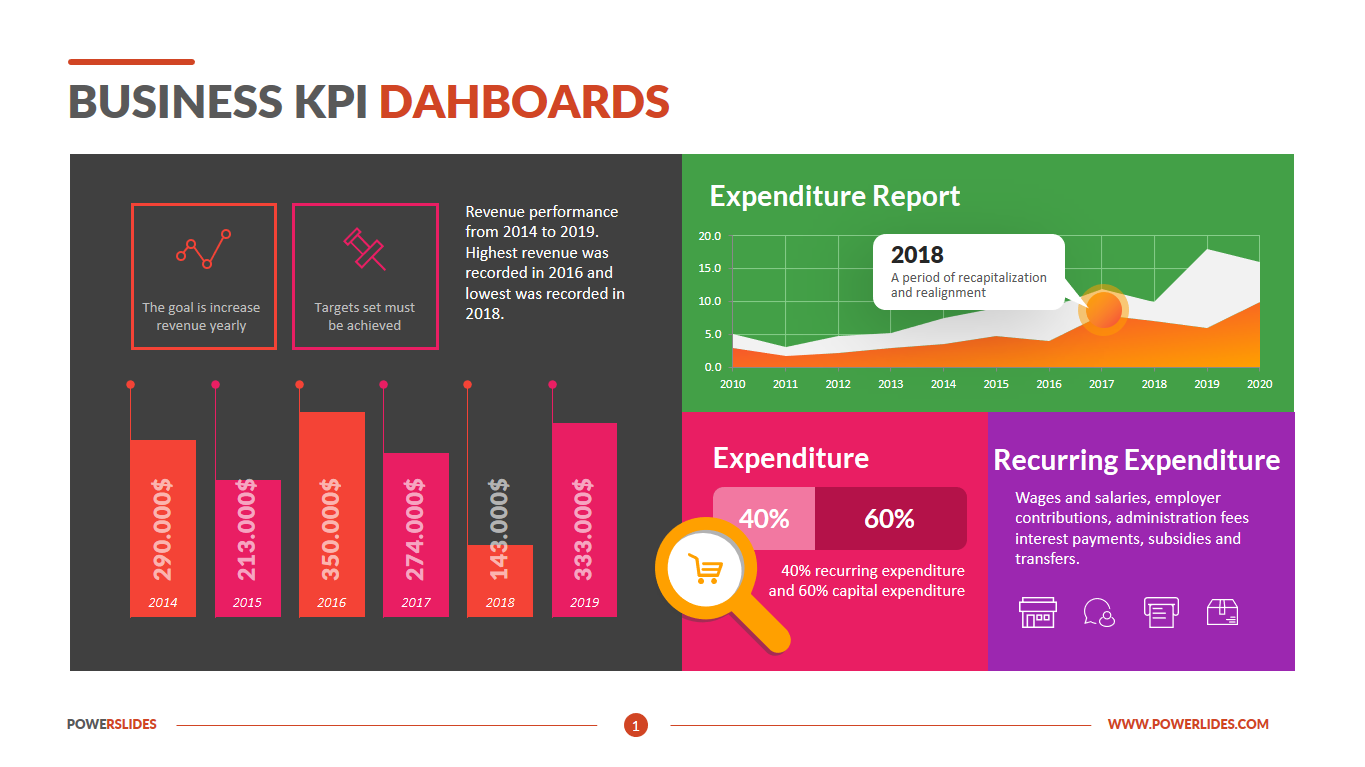
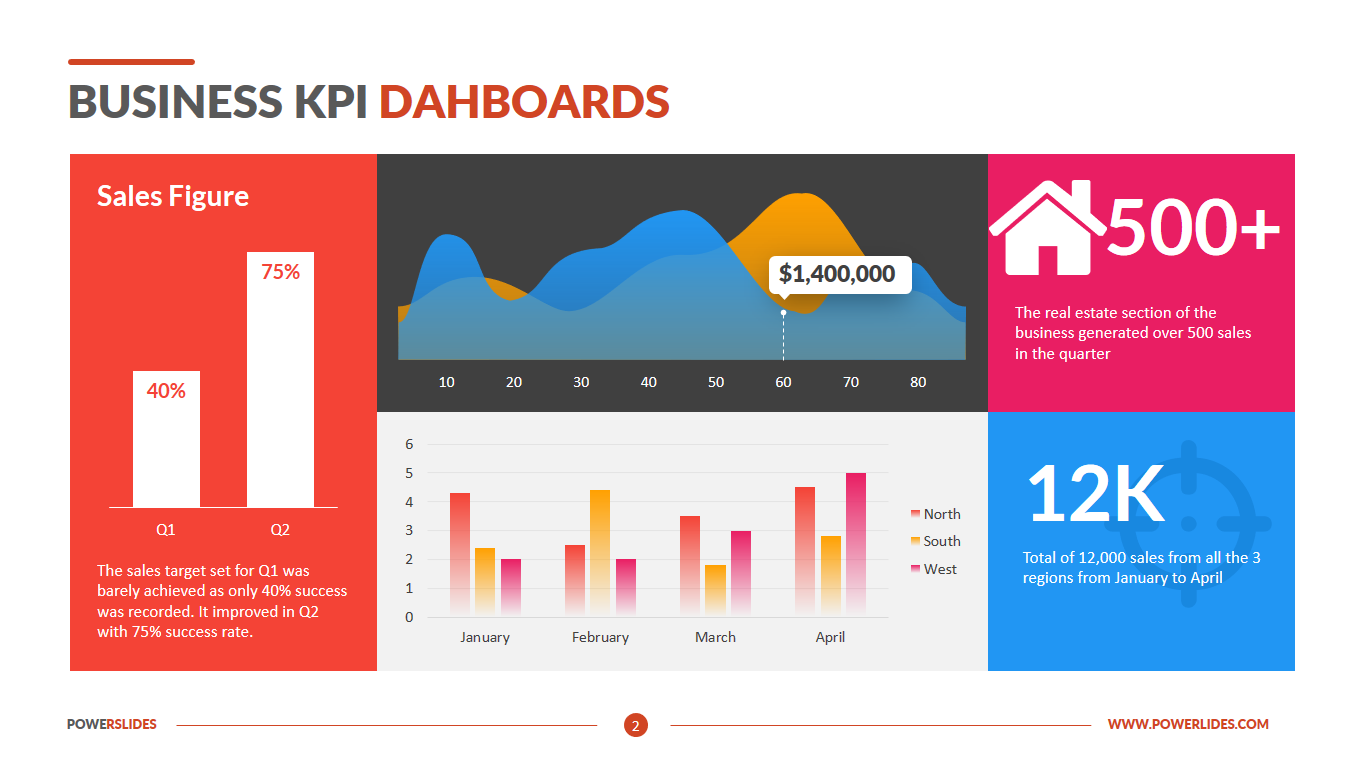
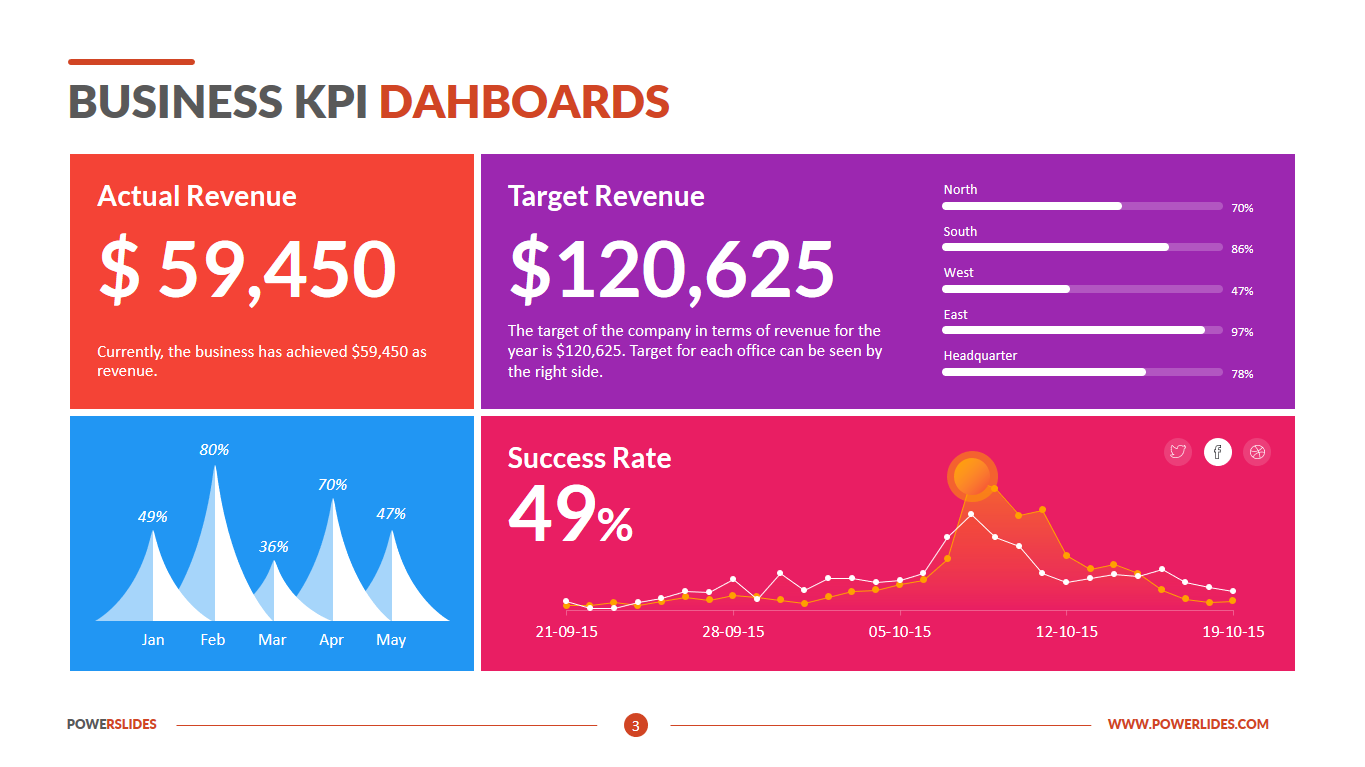
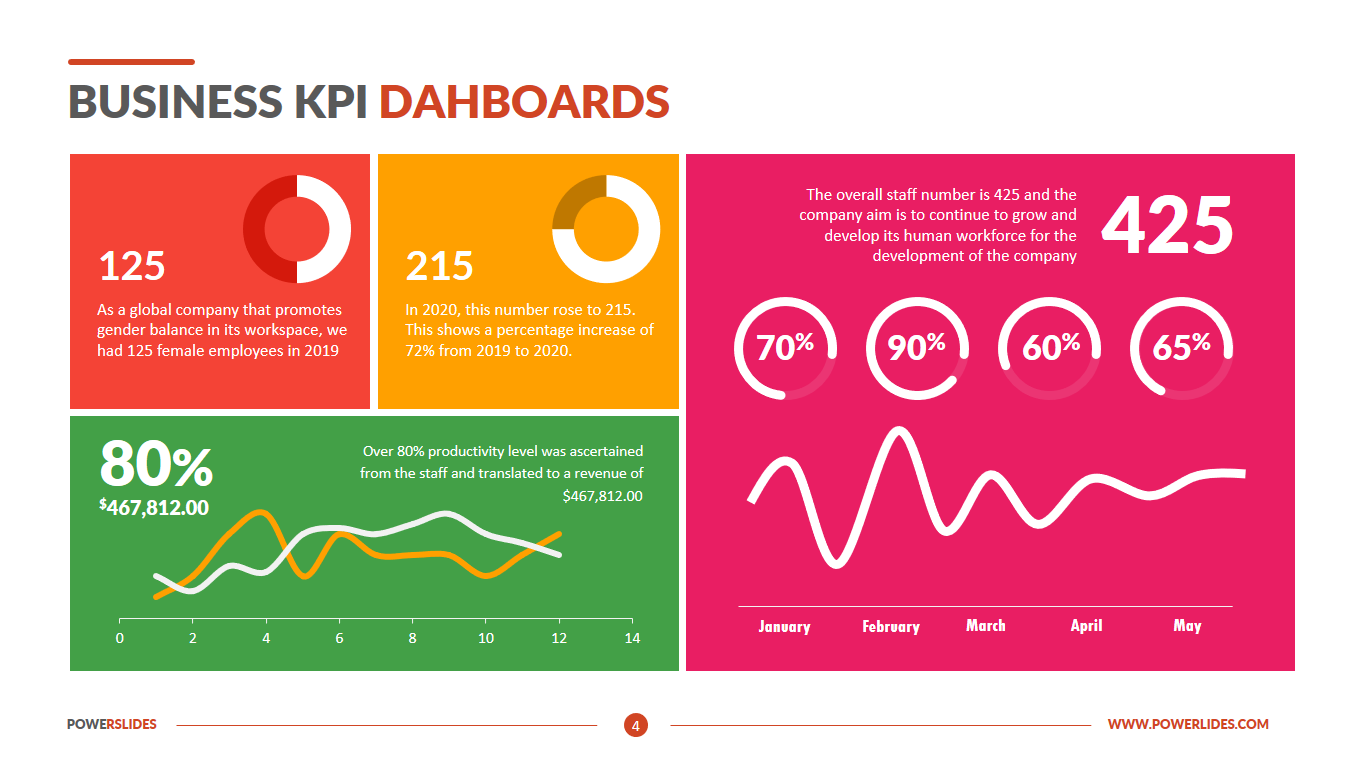
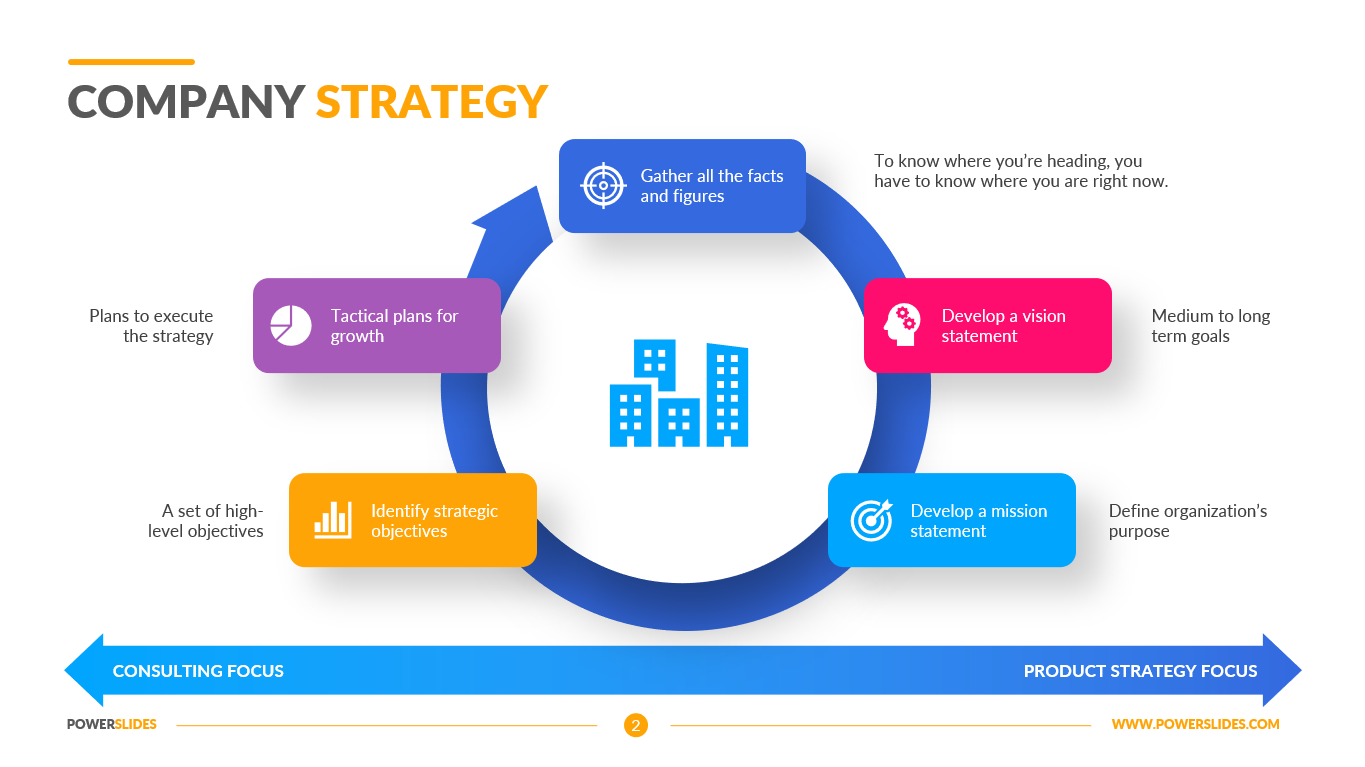
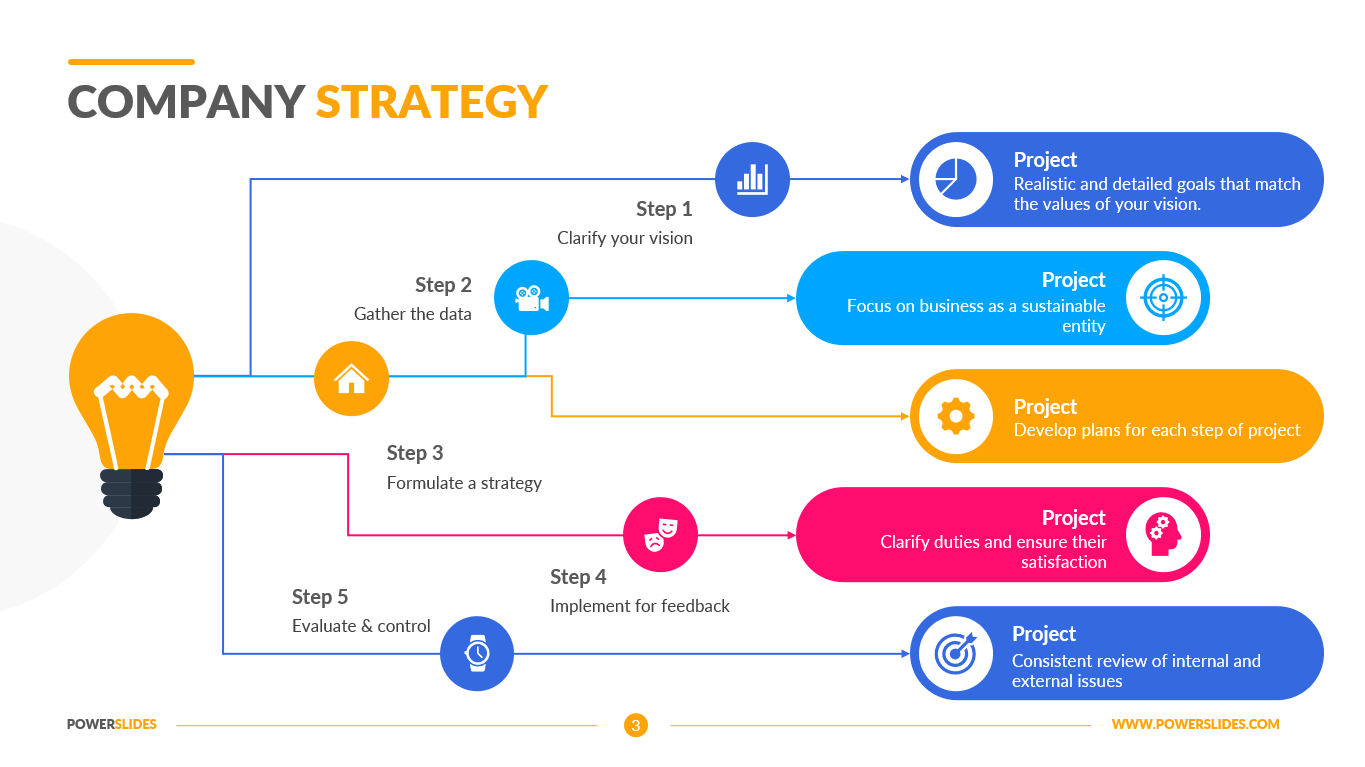
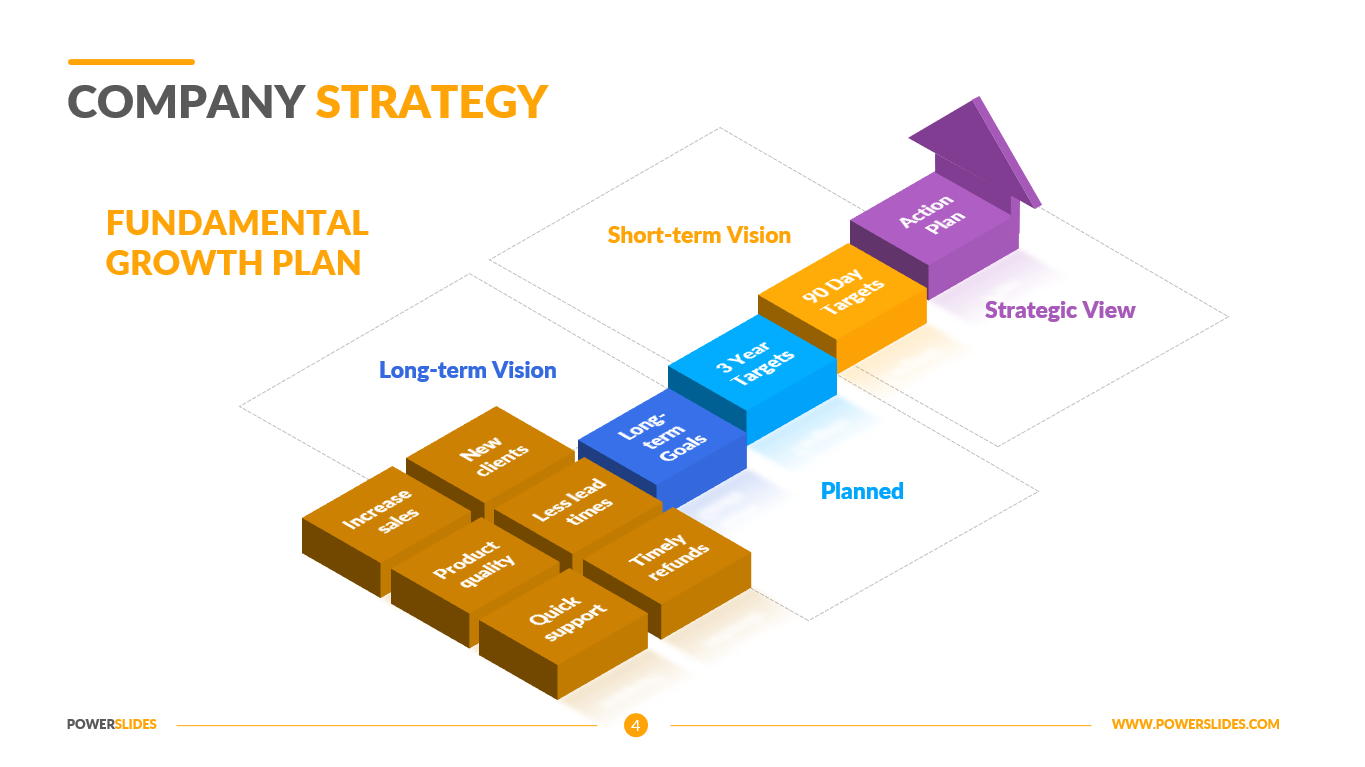
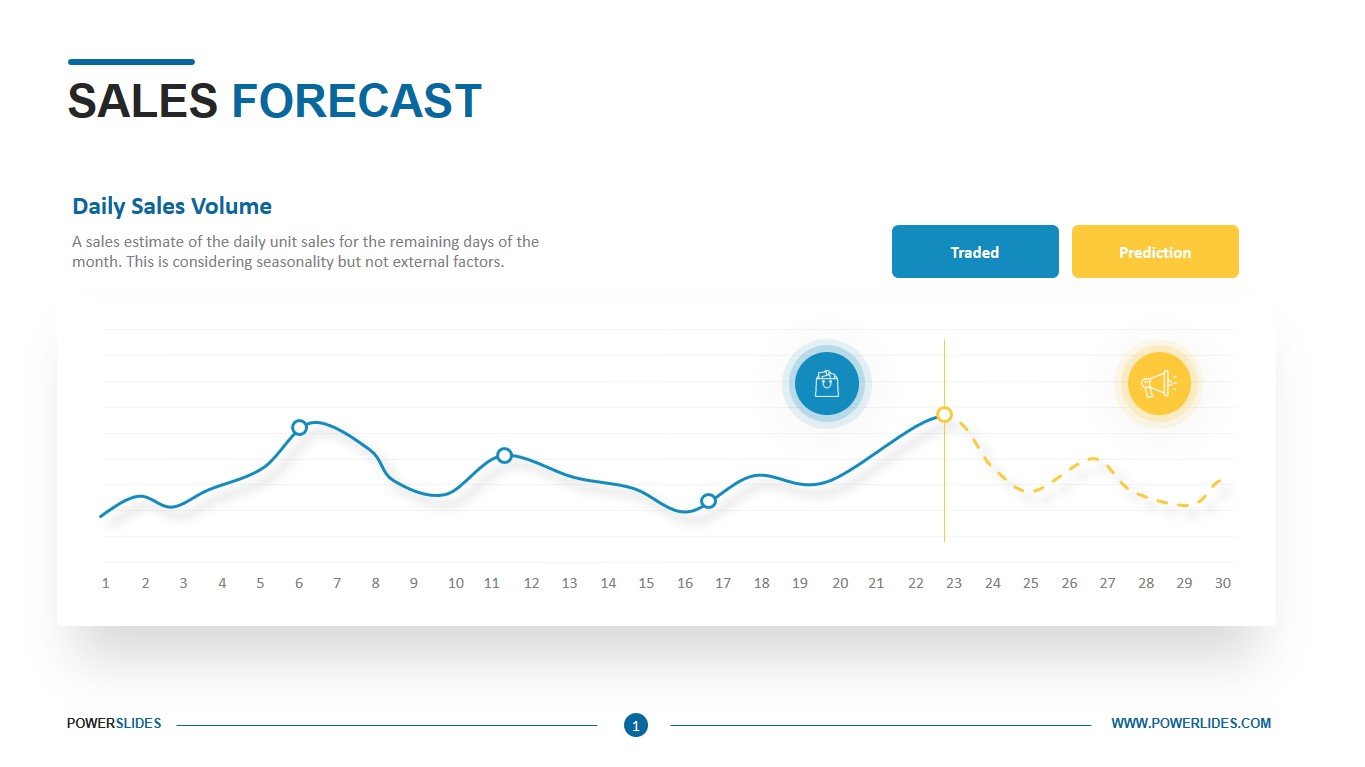
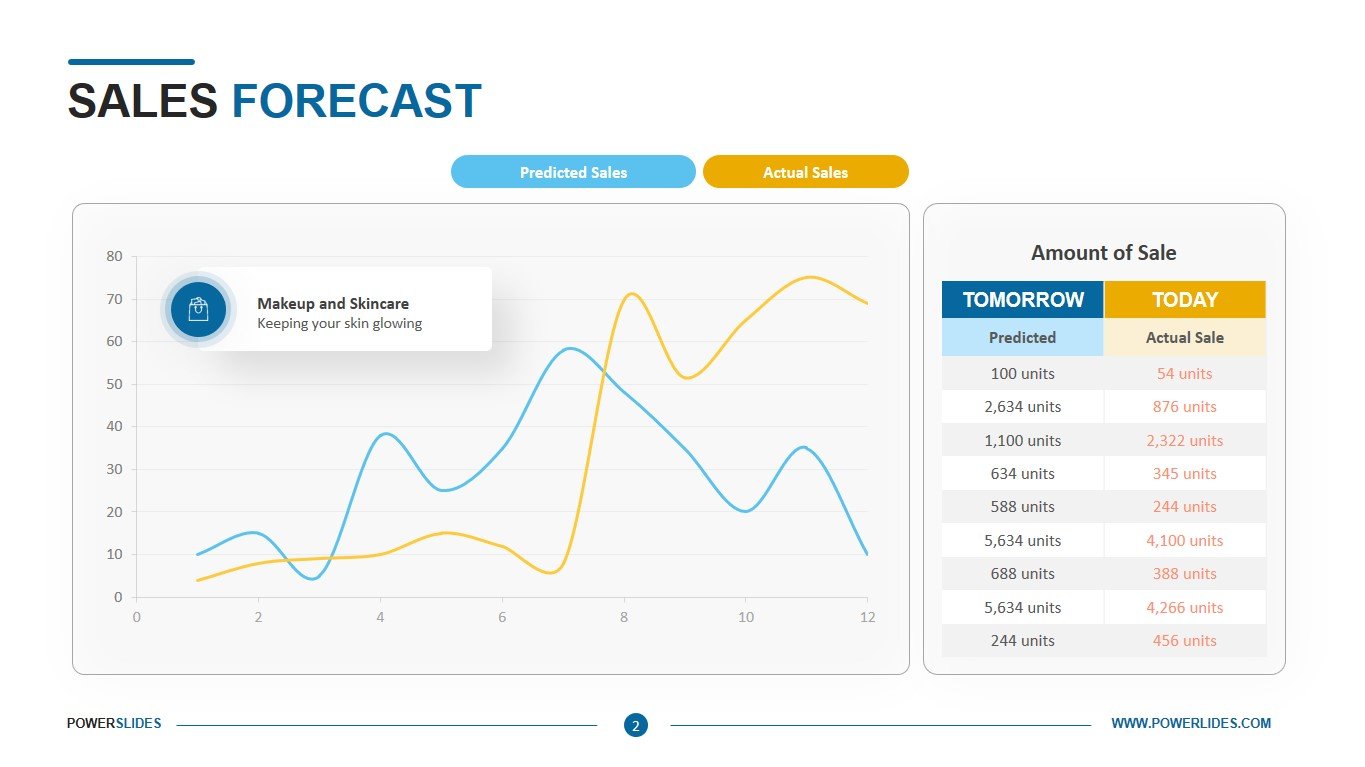
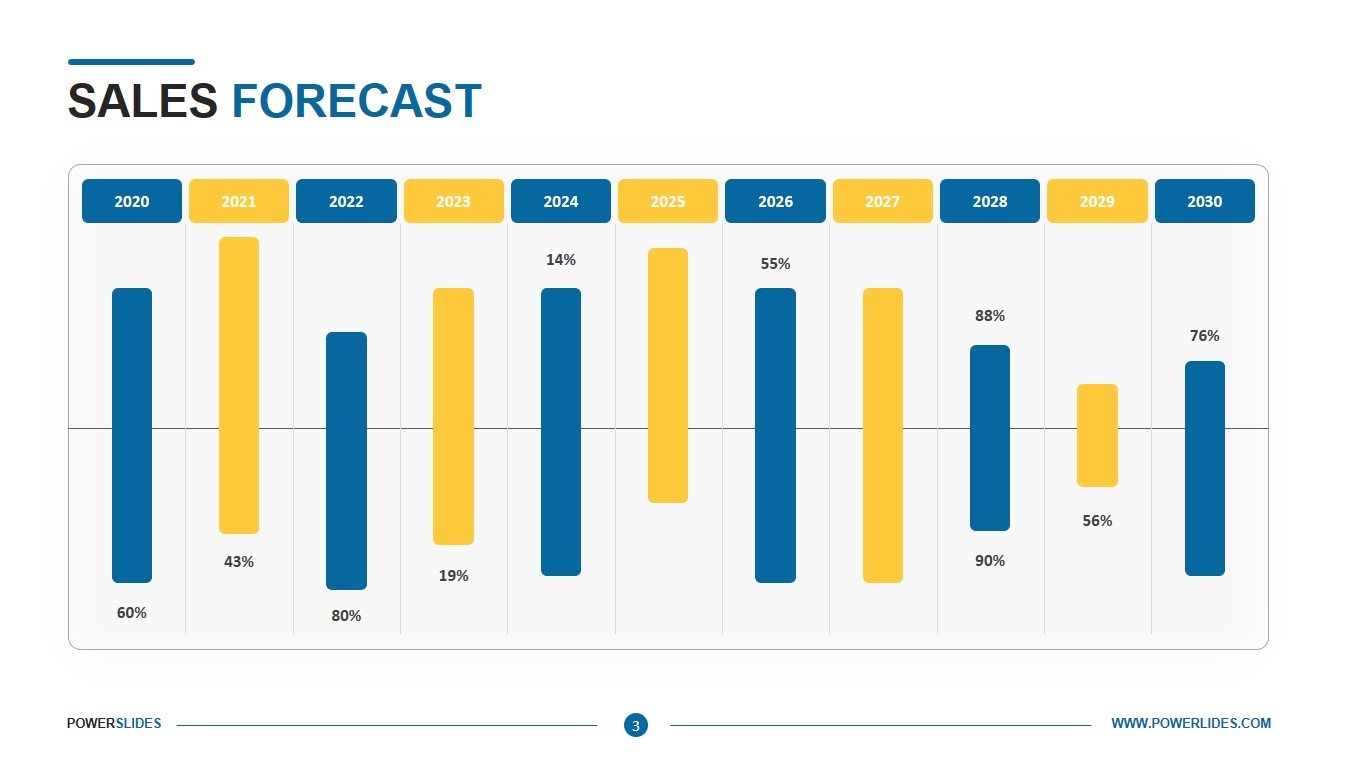
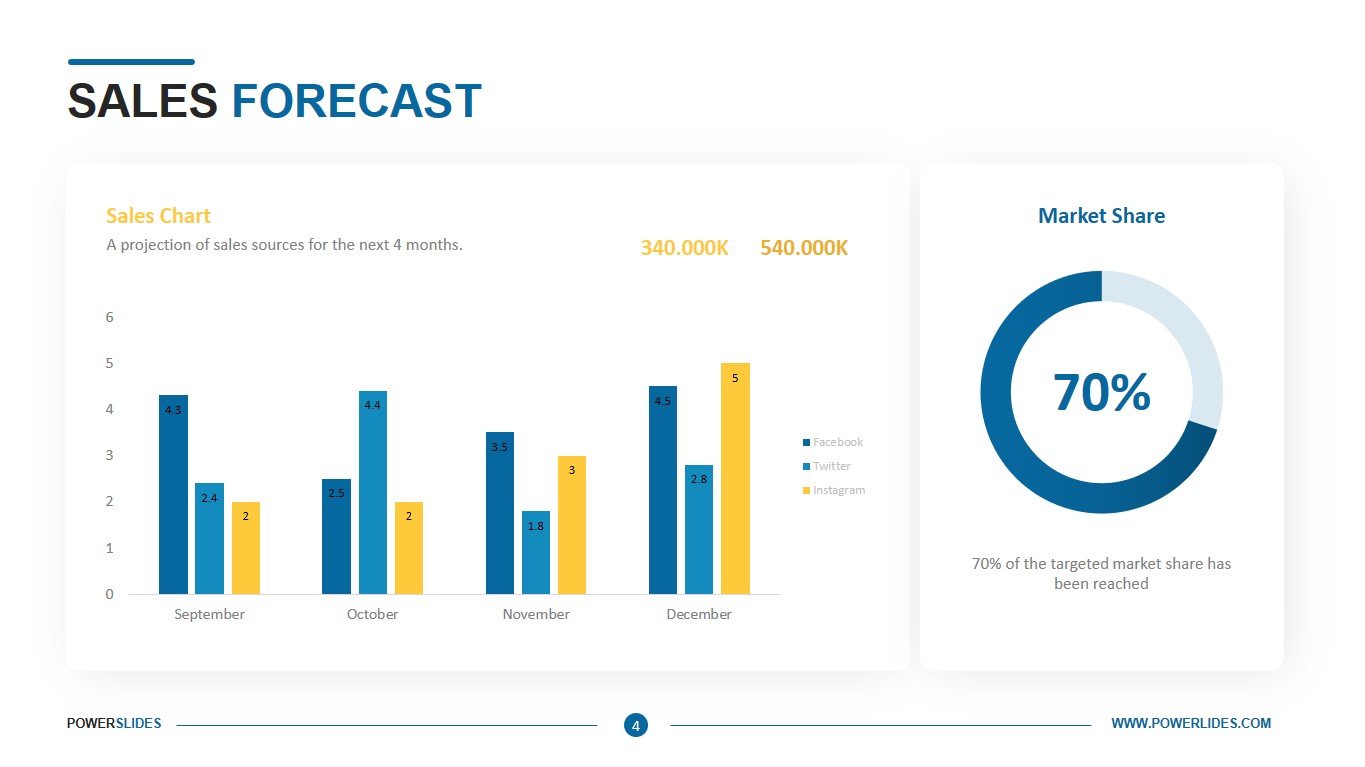
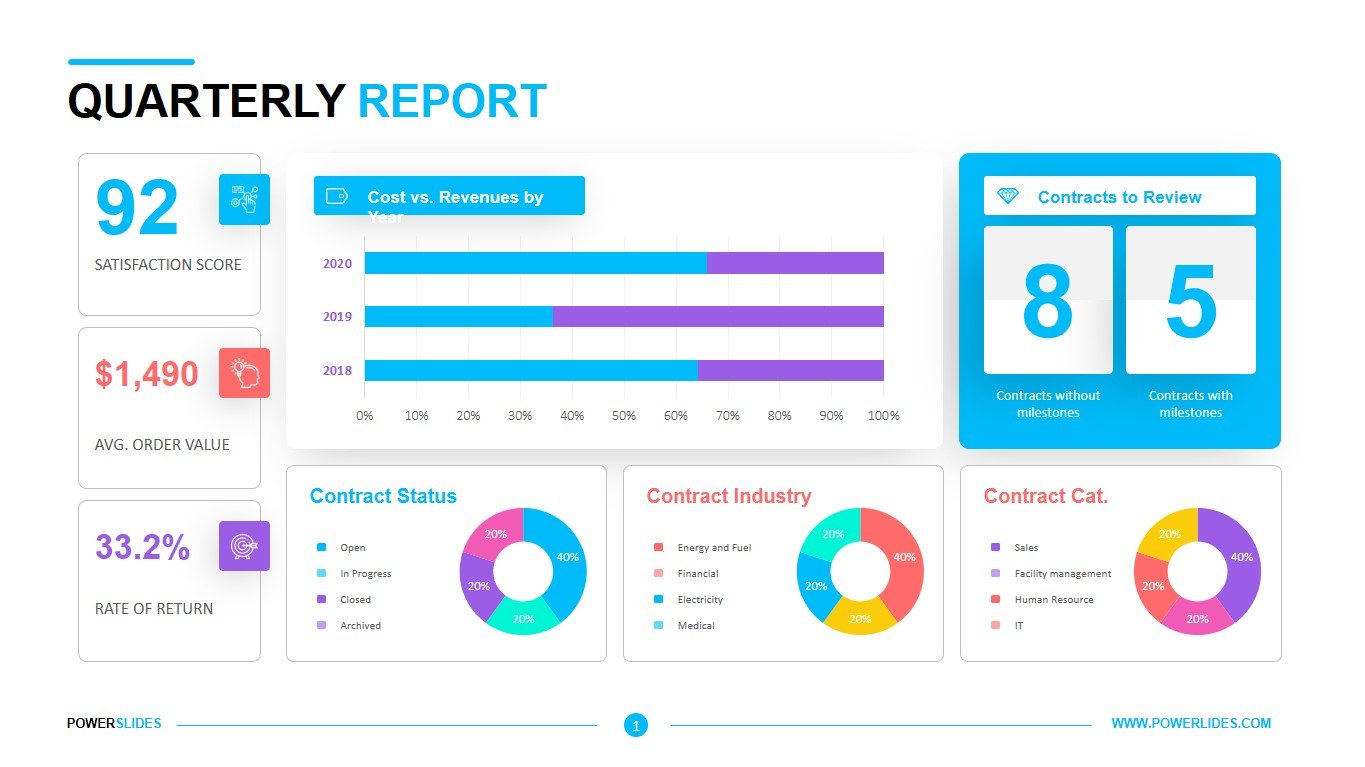
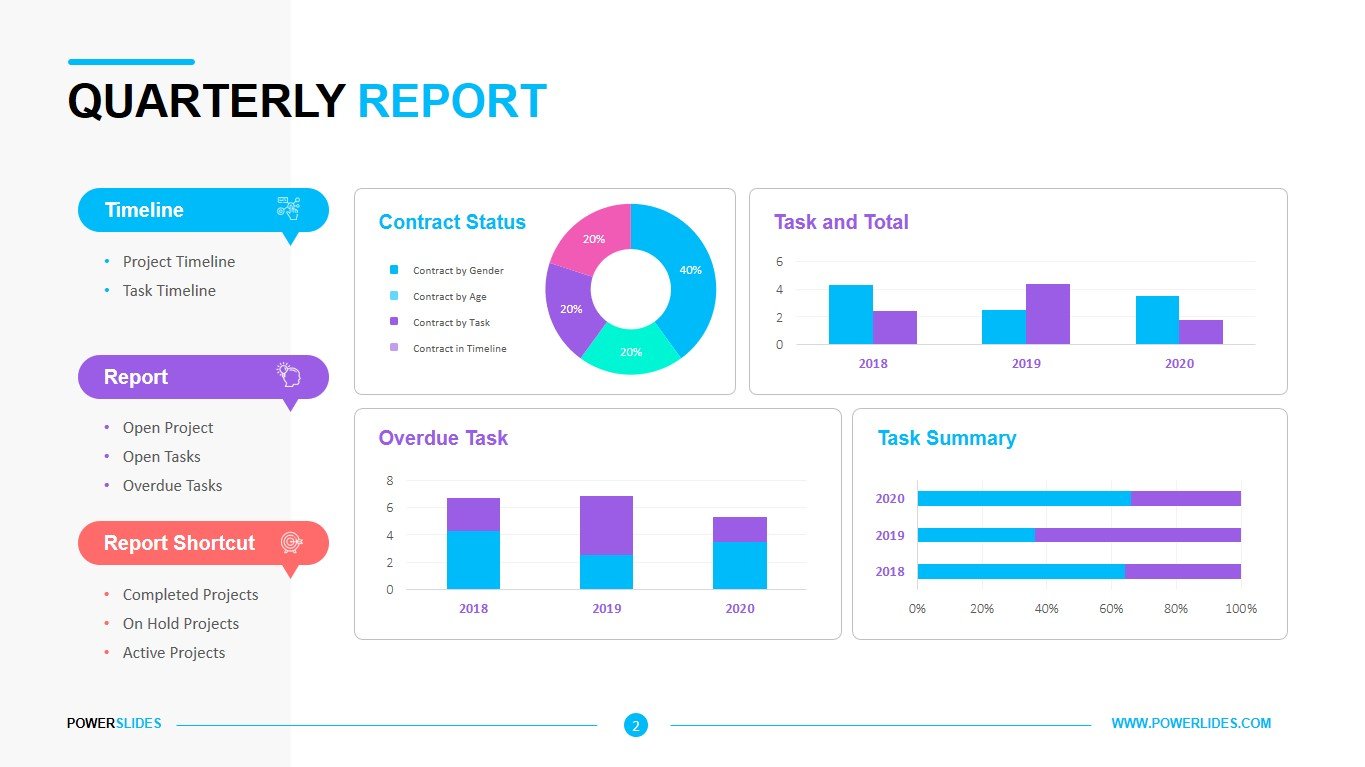
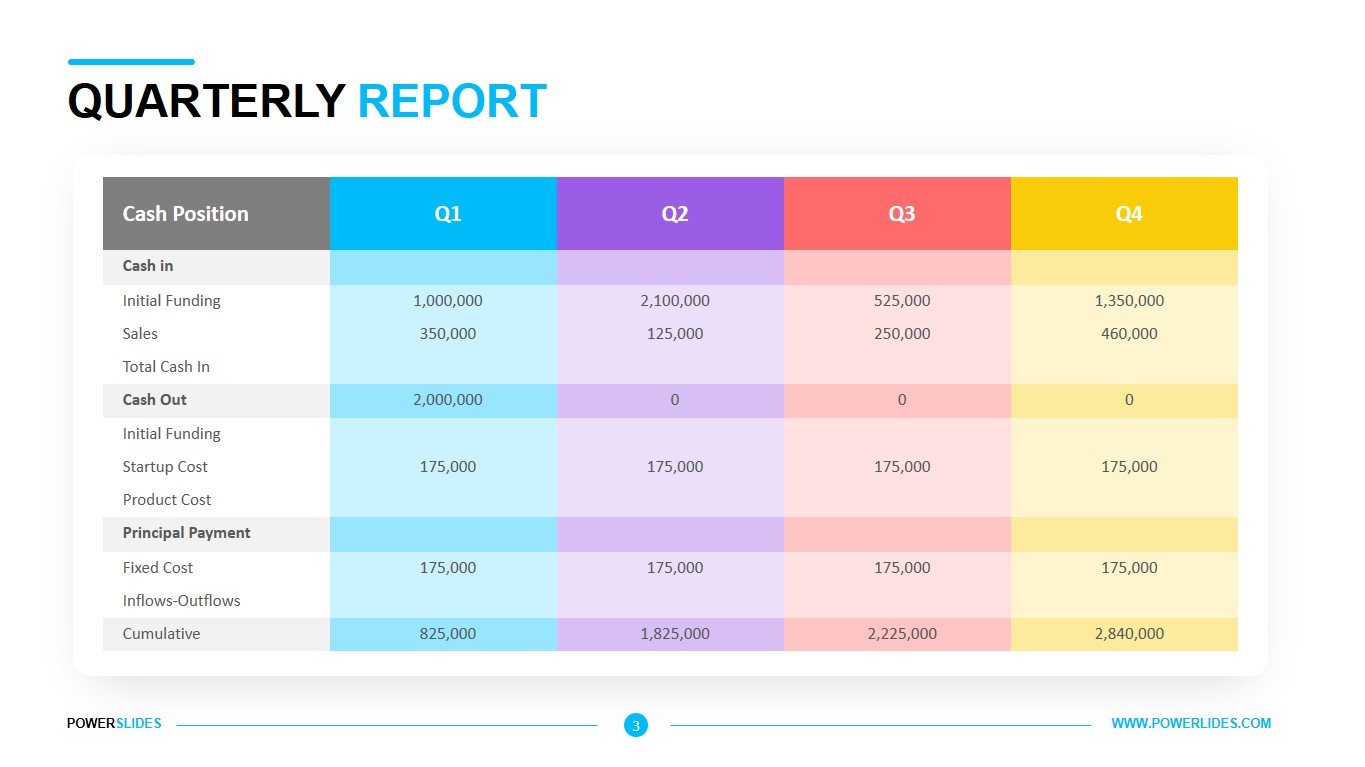
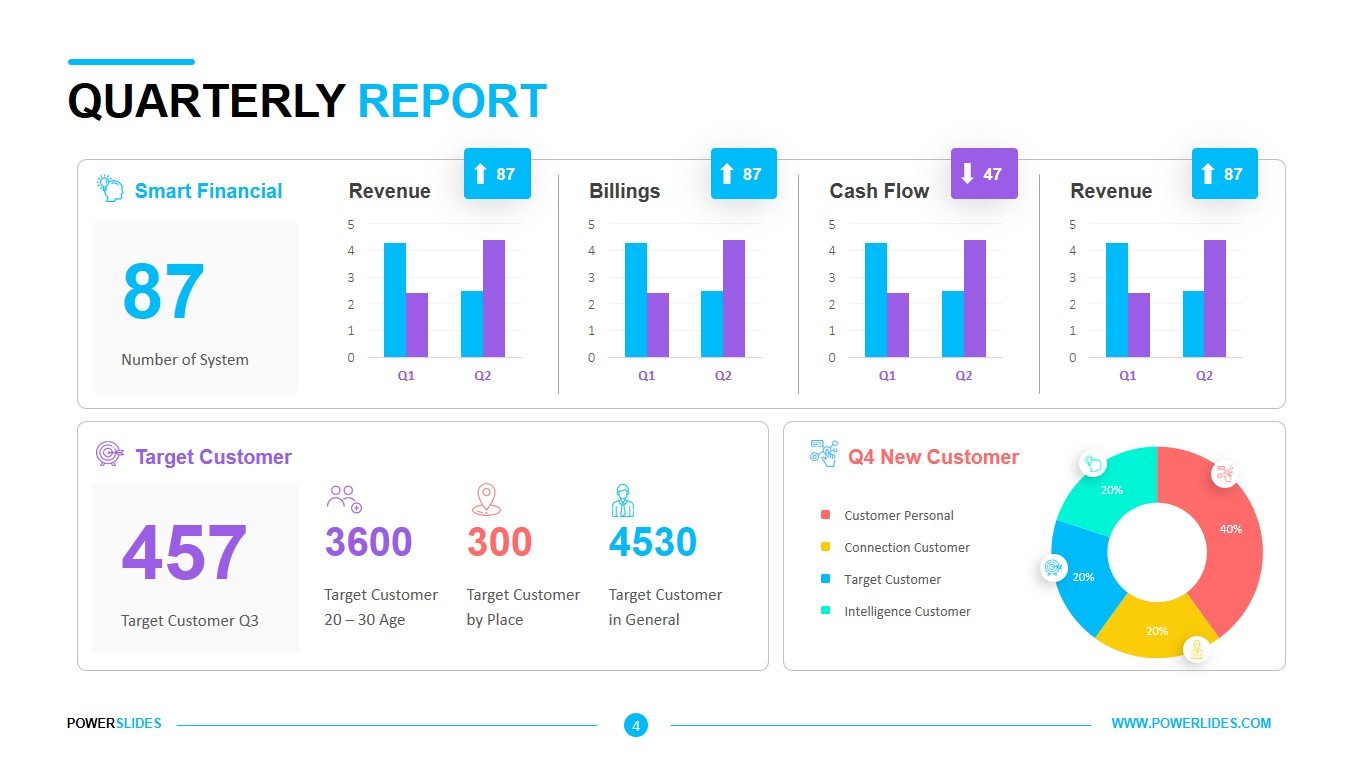
The Quarterly Report template consists of four slides in a cool colour scheme. All slides in the template have a huge number of infographics, charts and tables. This template will primarily be useful for financiers and investment companies. You can prepare an analysis of profit and loss, fixed and variable costs, the number of clients, the average income per client, or the average purchase order. Arranging blocks on a slide gives you the ability to group different data and present it in an easy and accessible way. Company accountants can use these slides to prepare their quarterly reports for company directors. Analysts from different industries can also use this template. Also, this template can be used by business coaches and course teachers when preparing courses in financial disciplines. All slide elements can be edited to suit your corporate style. Quarterly Report template will be a worthy addition to your collection of professional presentations.


