Thermometer Diagrams
What do you think of this template?
 (5.00/ 5)
5 ratings

 4 Slides
 File size: 16:9
 Fonts: Lato, Calibri
 Supported version
PPT 2010, PPT 2013, PPT 2016
Supported version
PPT 2010, PPT 2013, PPT 2016

Product details
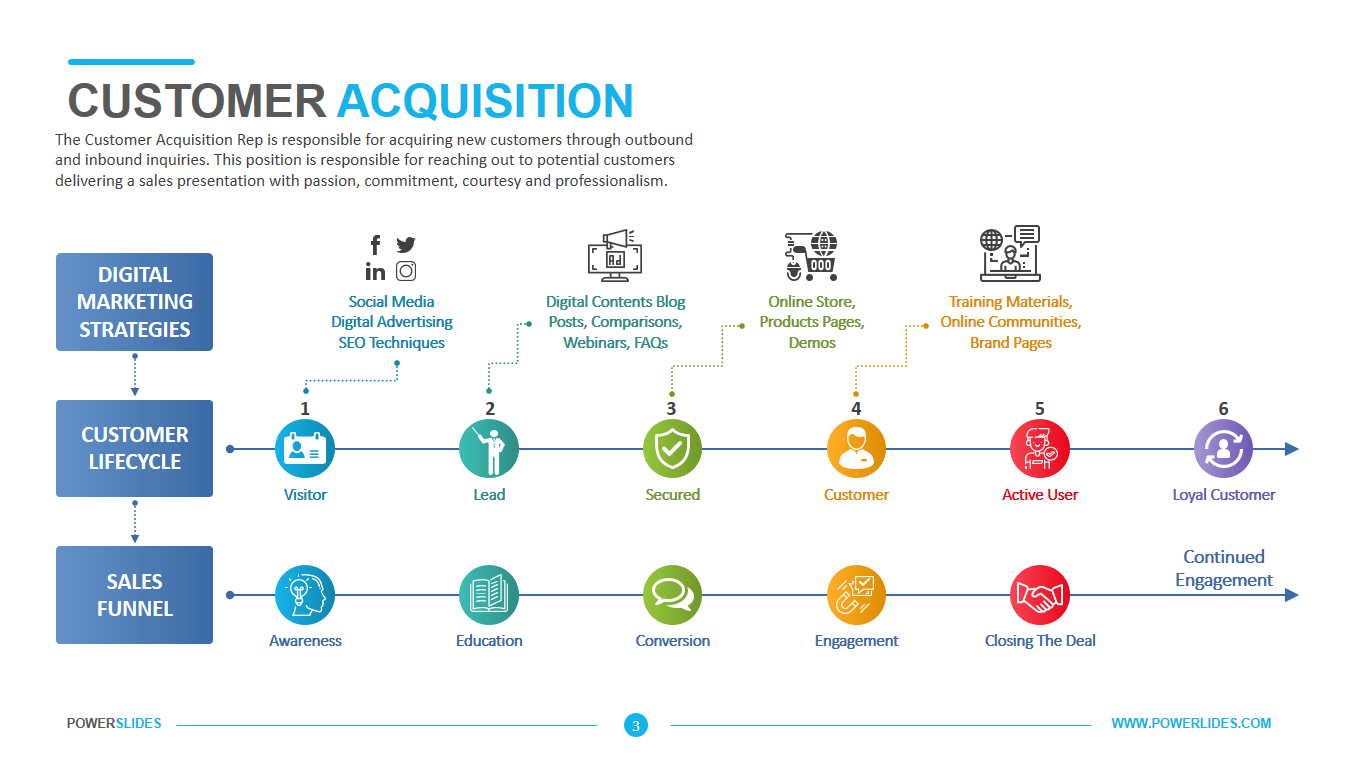
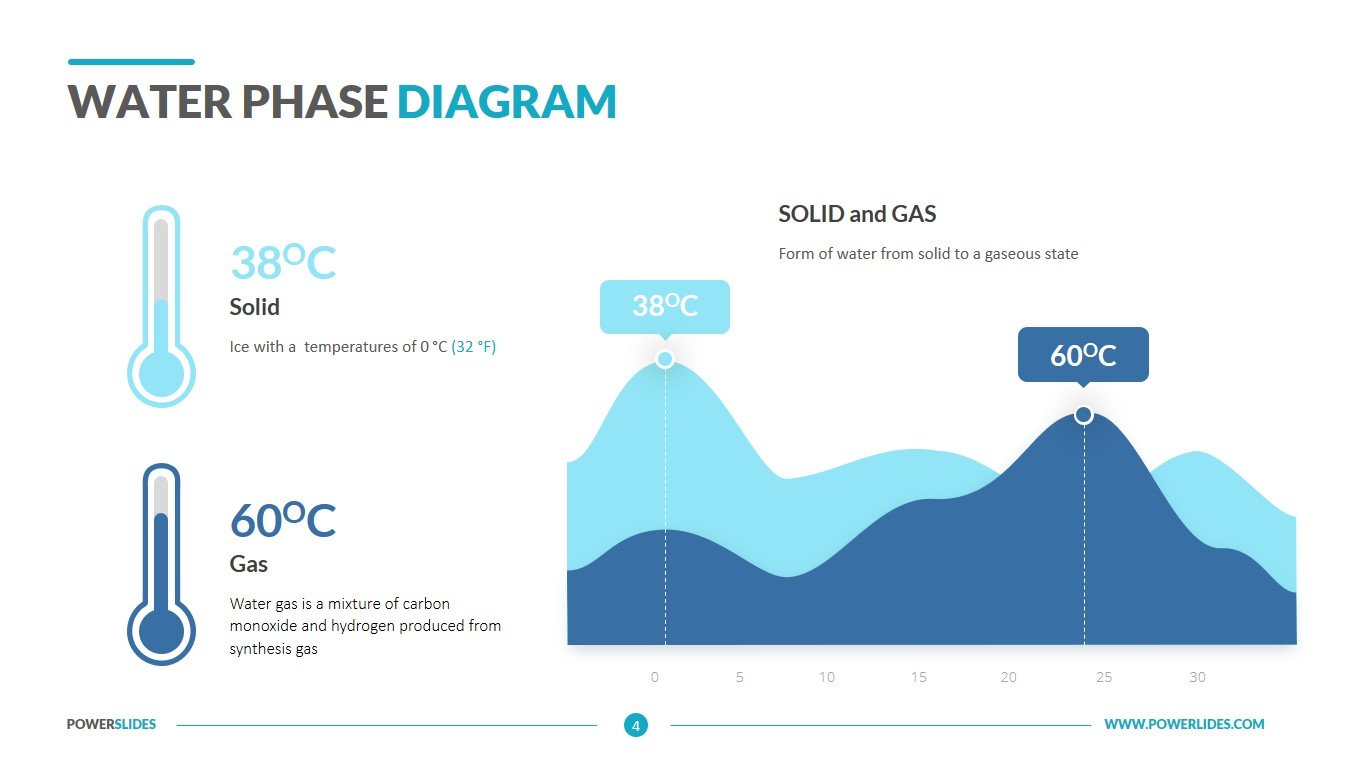
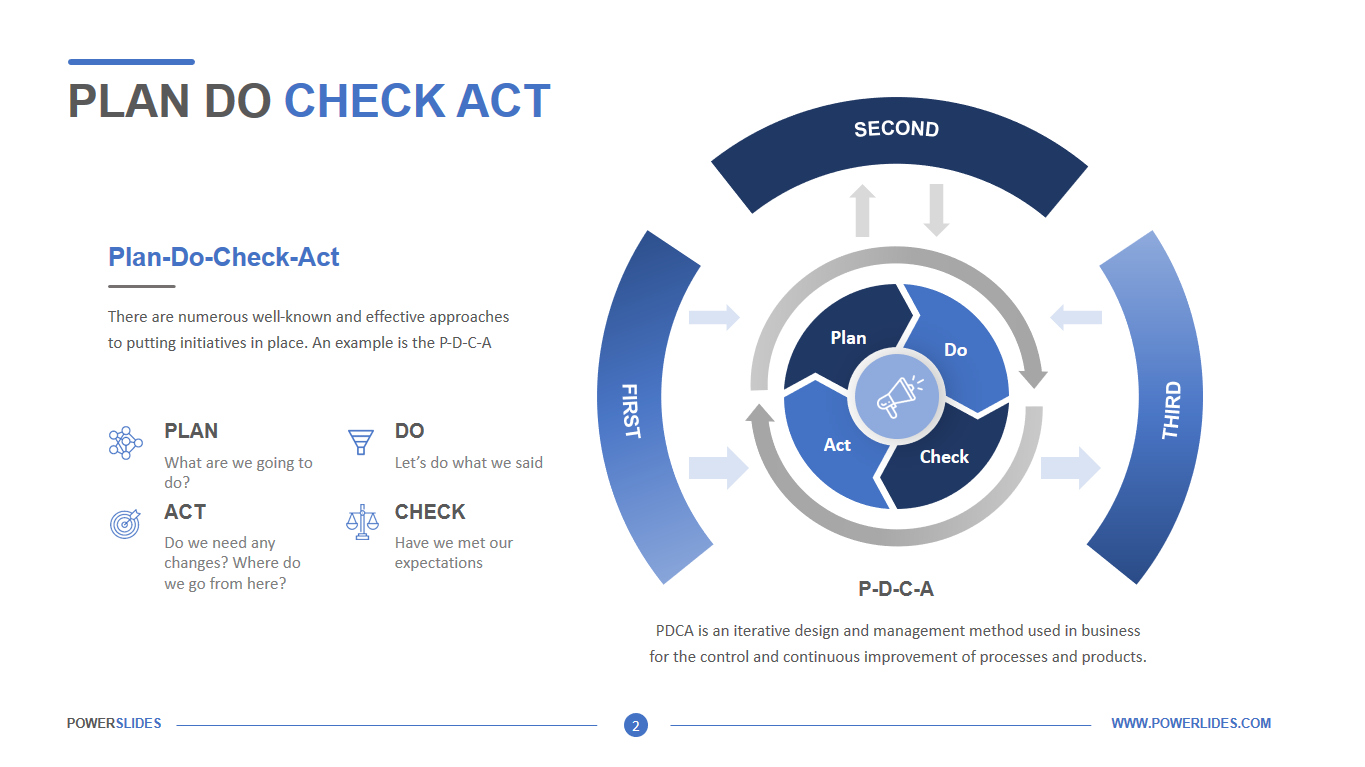
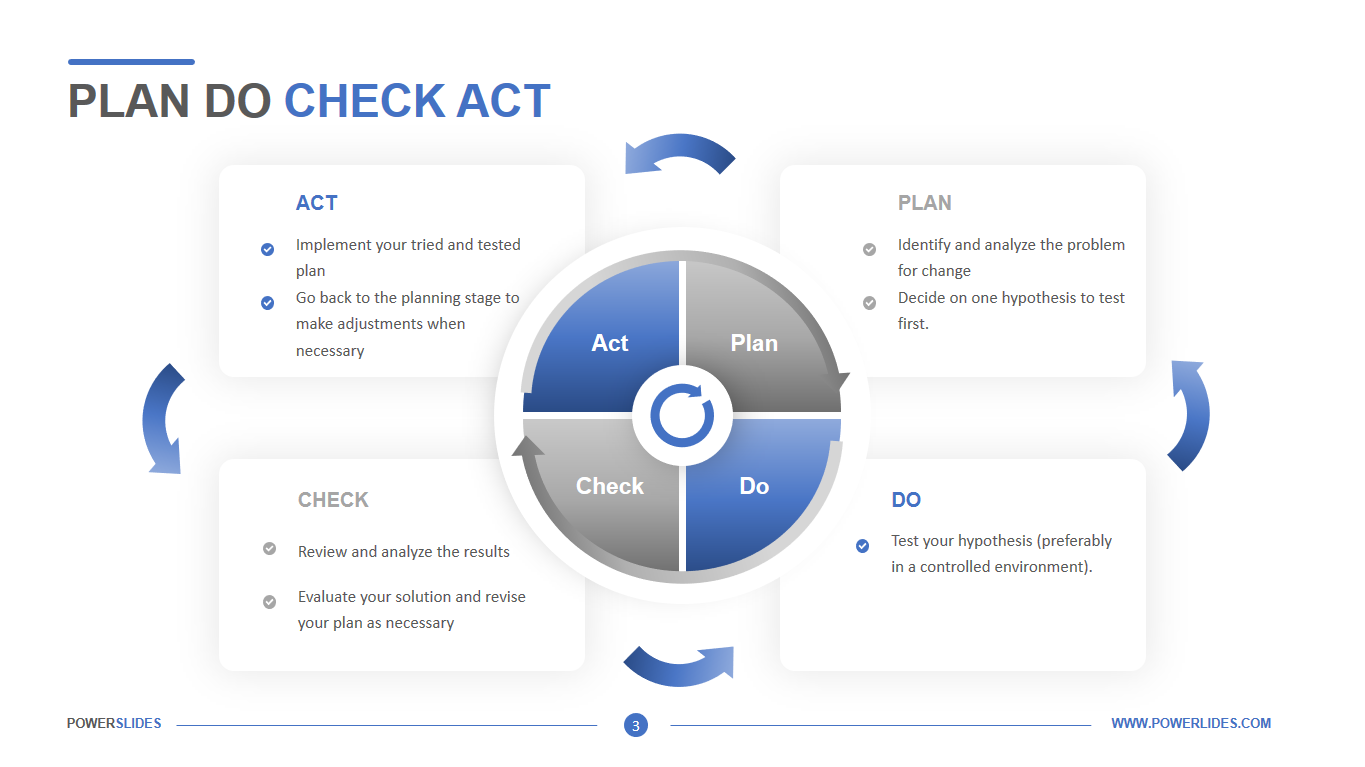
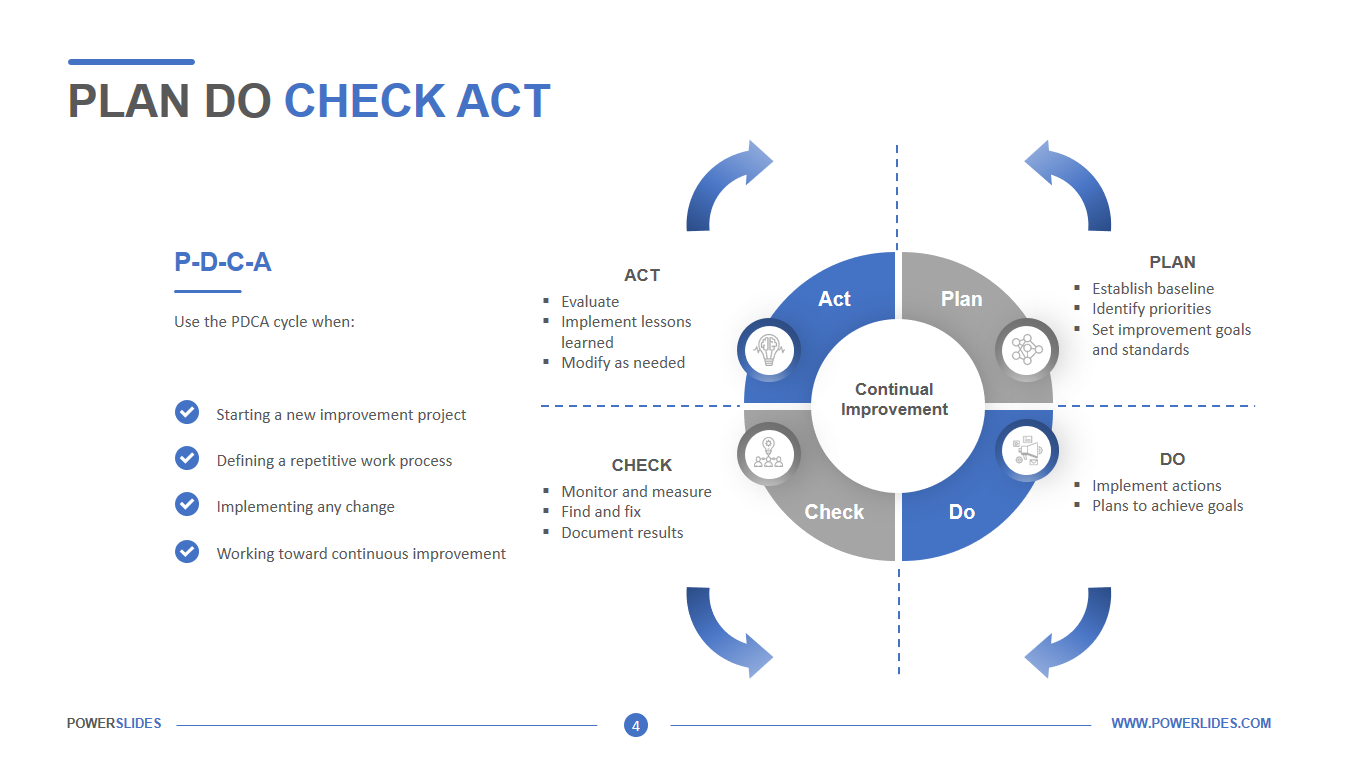
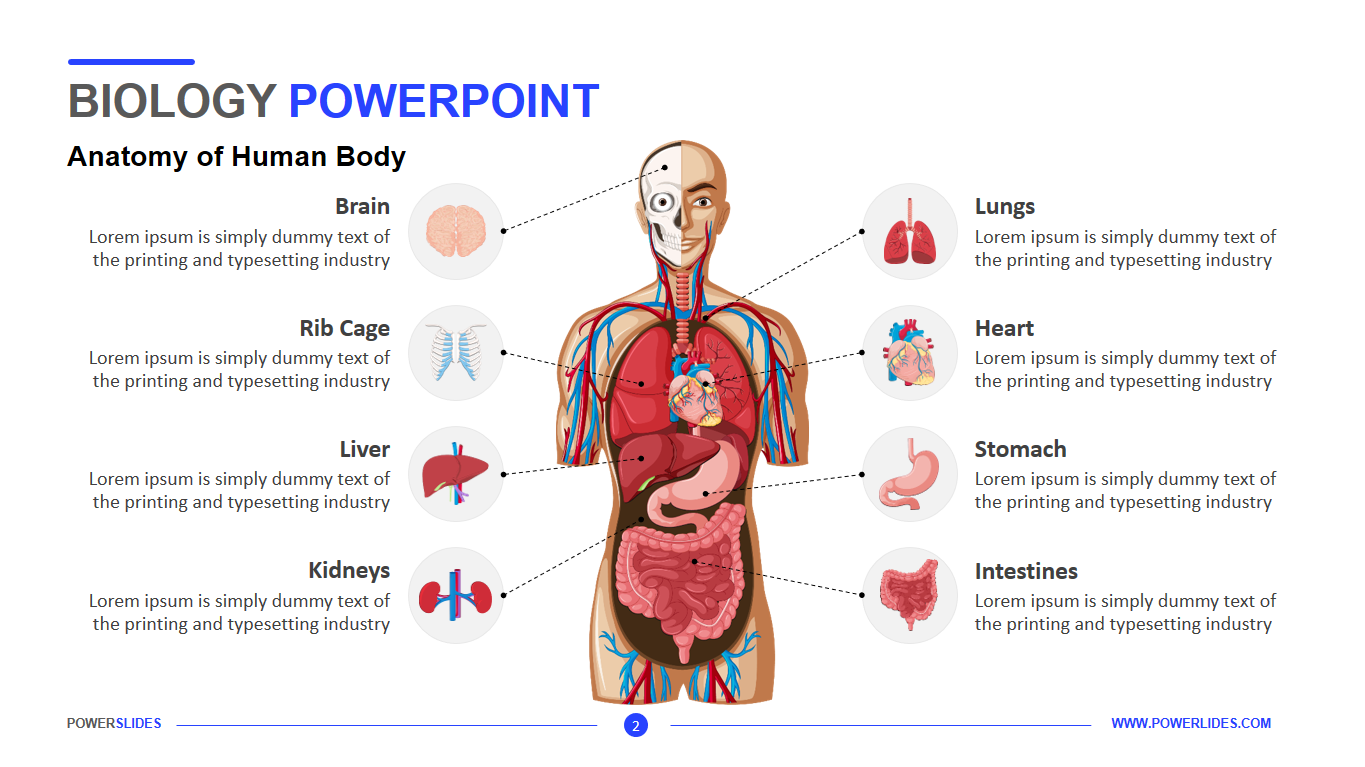
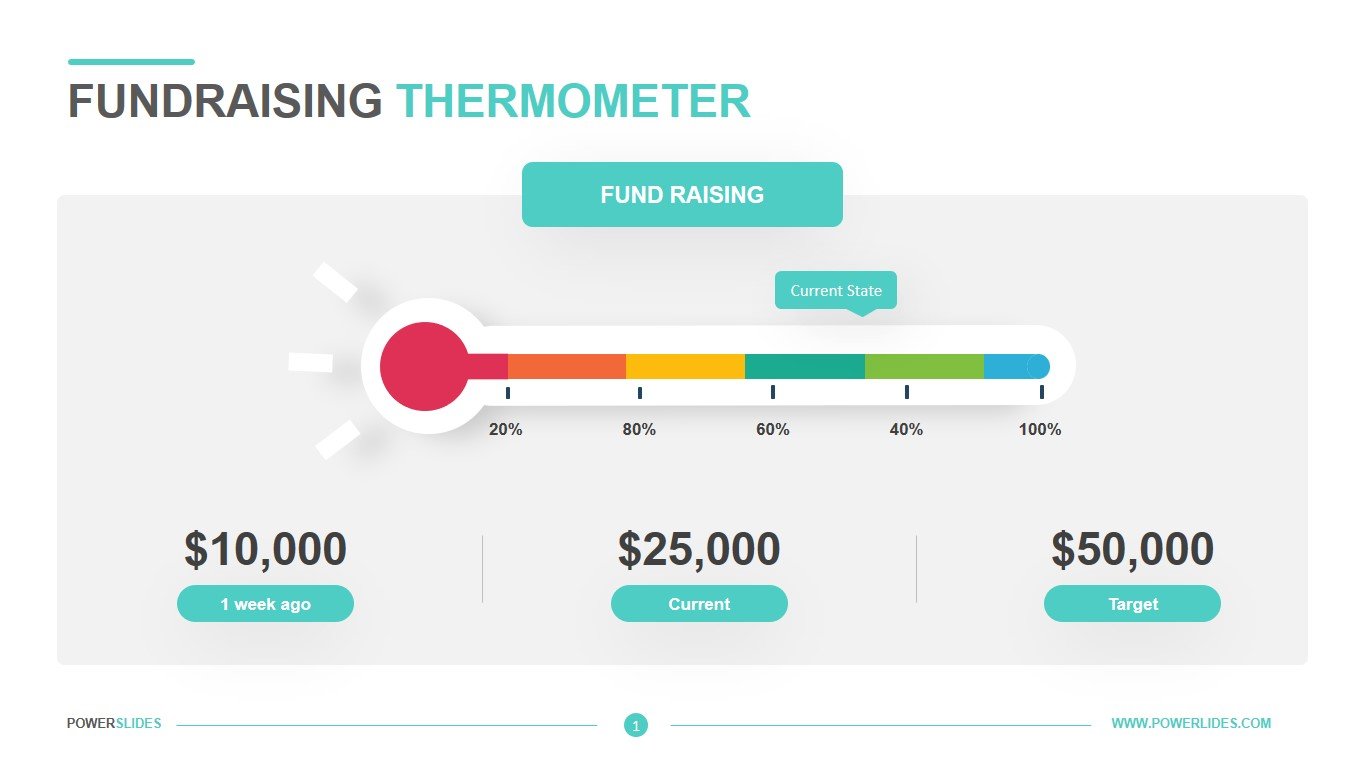
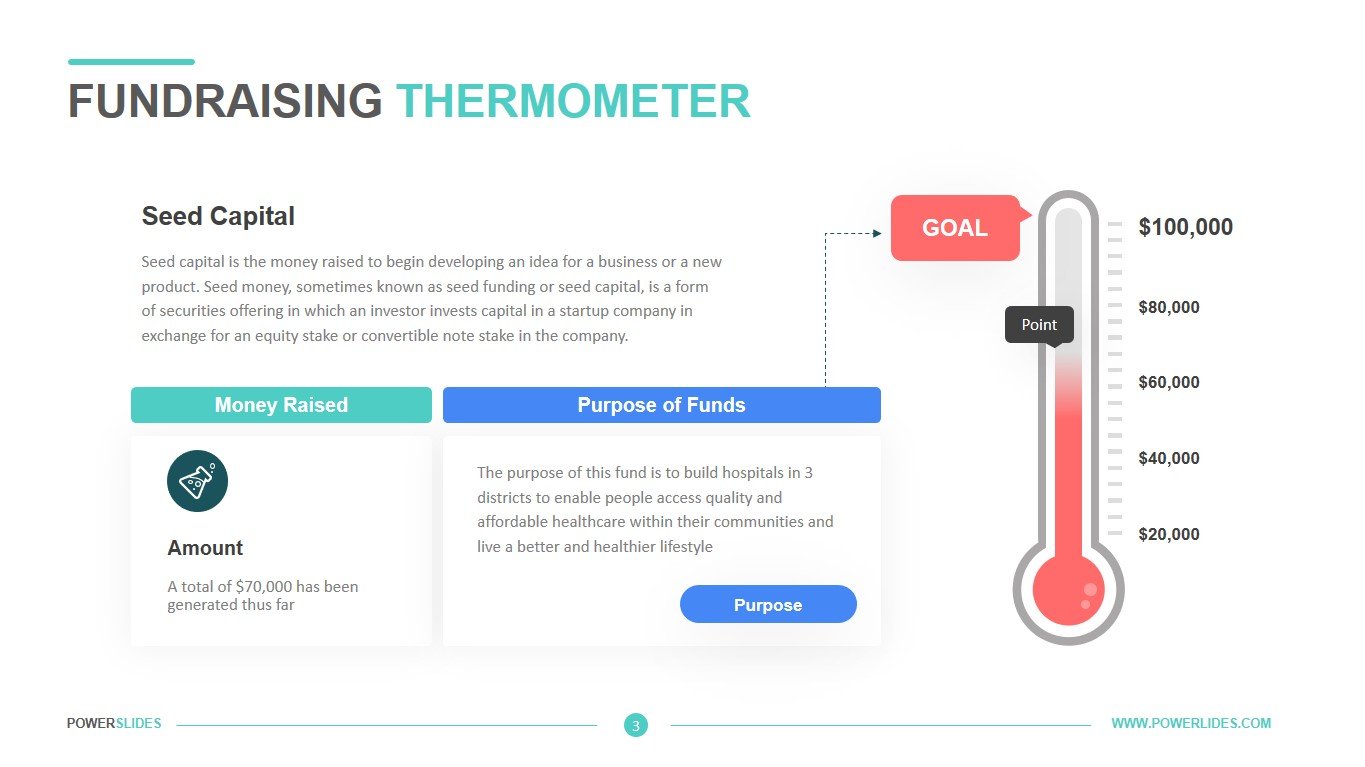
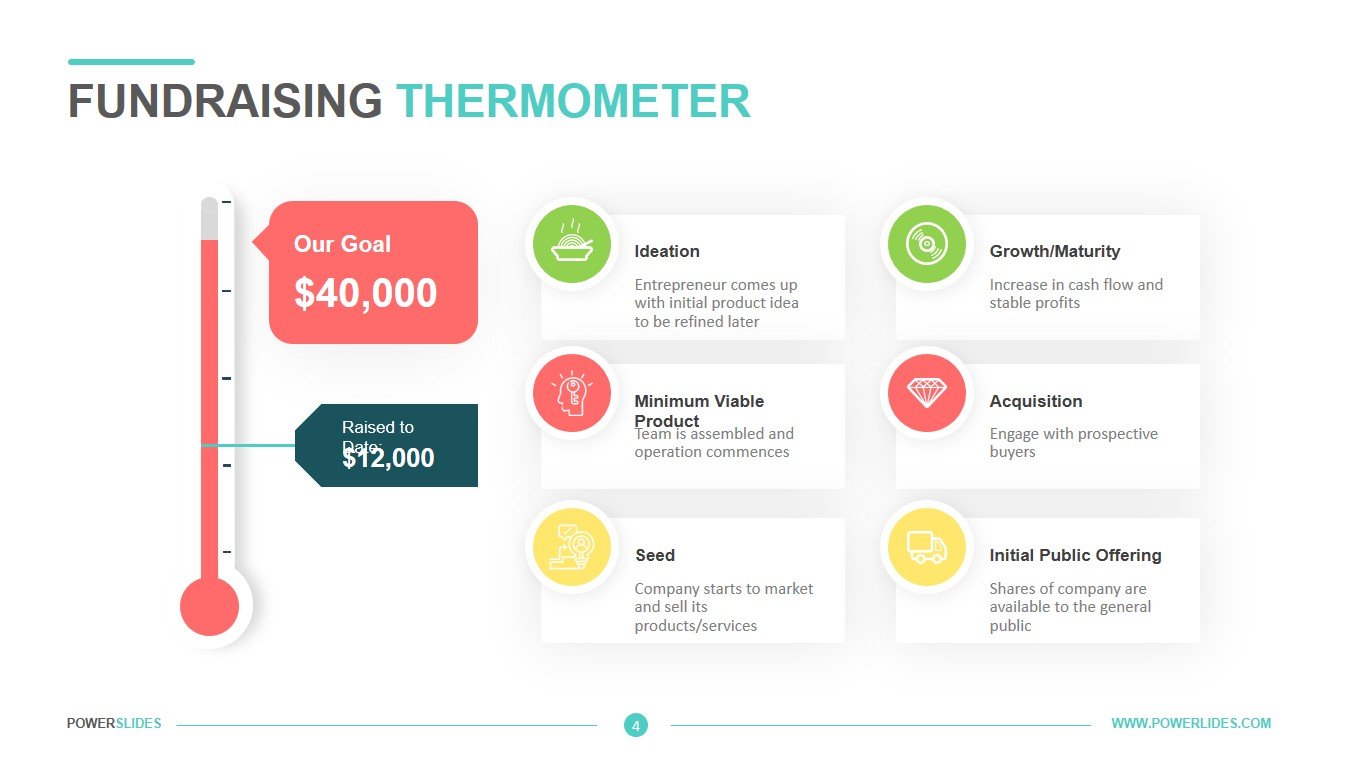
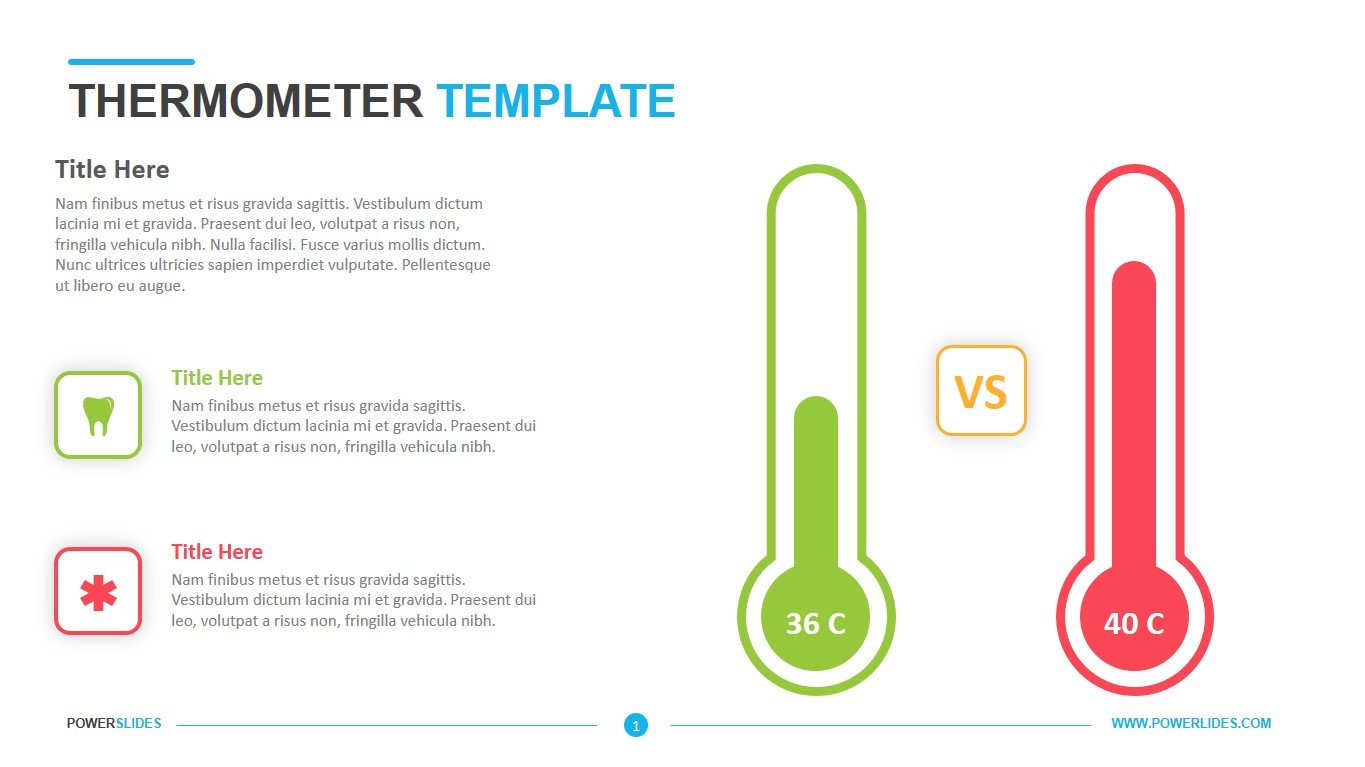
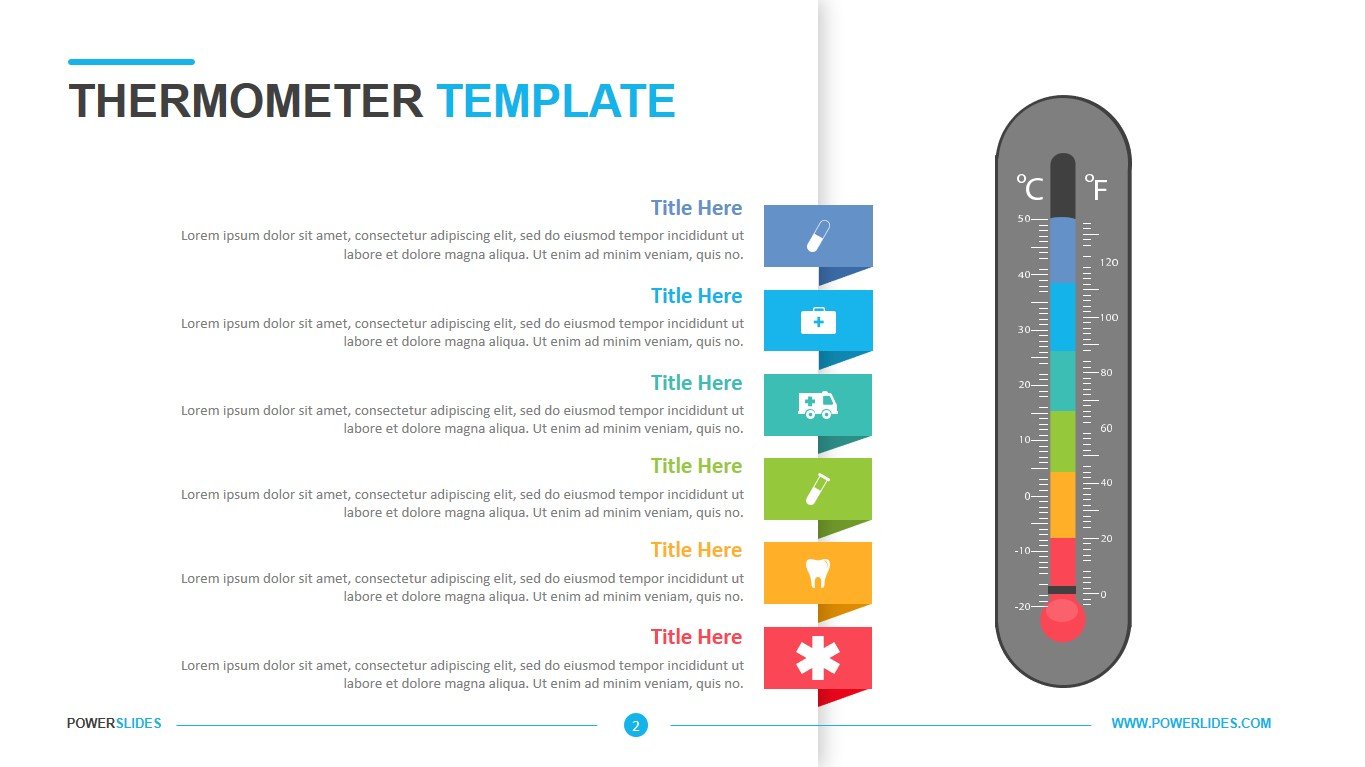
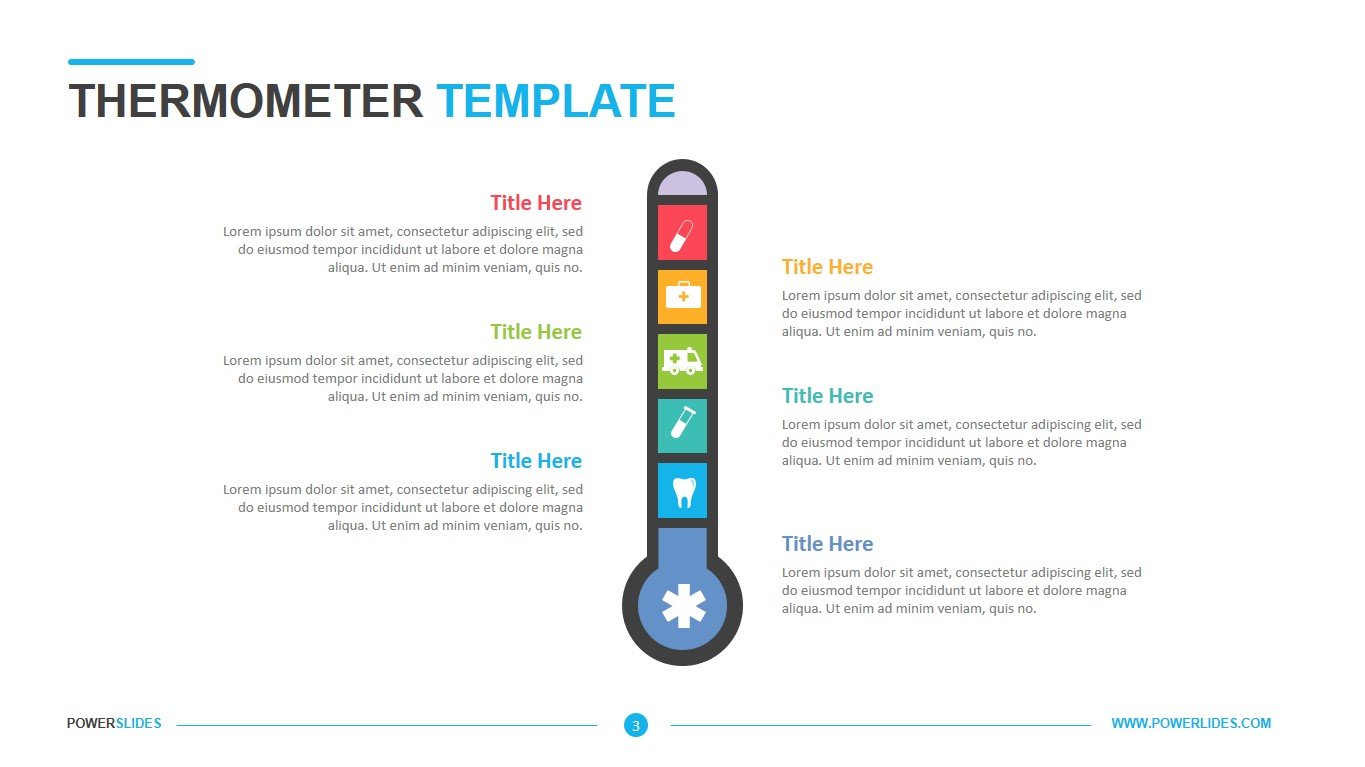
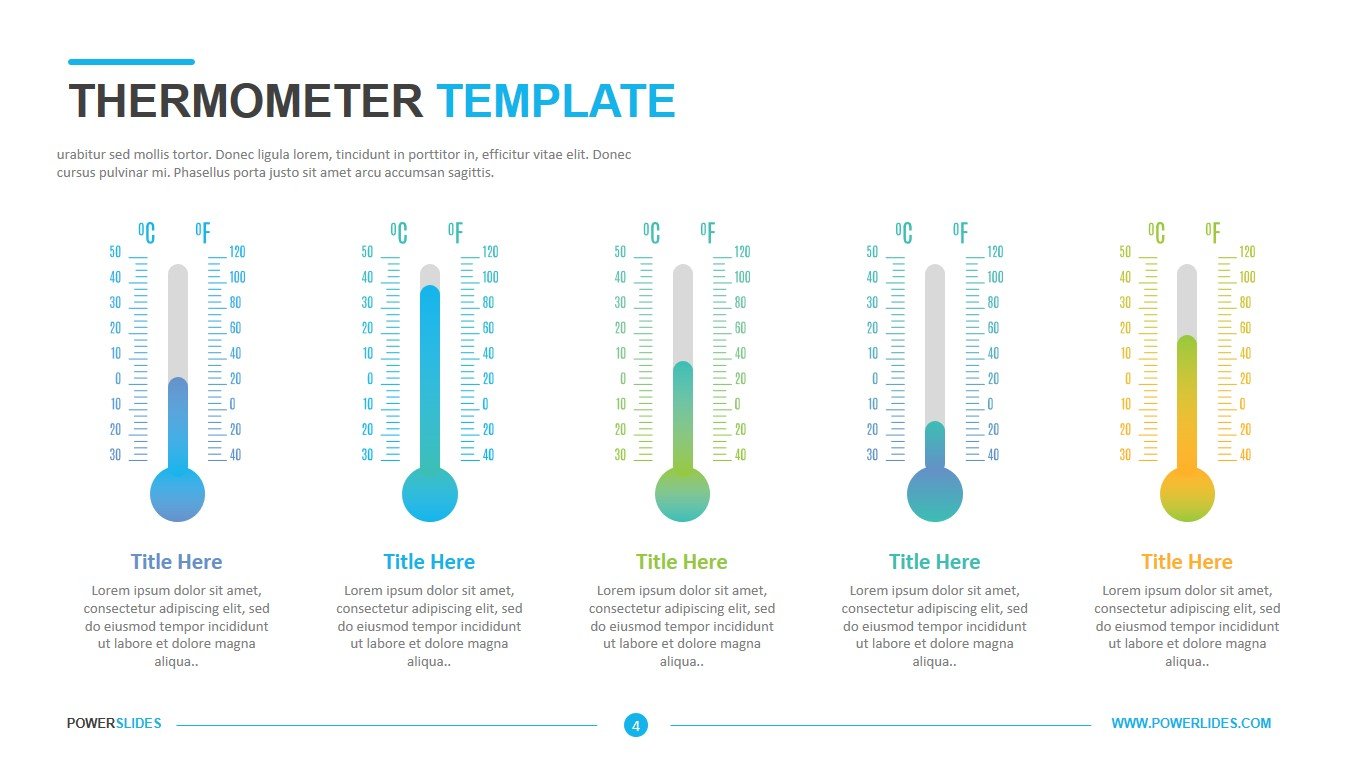
The Thermometer PowerPoint template with professionally designed thermometer visuals allows you to explain temperature chart reading in Celsius and Fahrenheit with ease. The template can be used for business and corporate dashboards as part of a BPM ( Business Process Management) within your organization to show the key indicators in your organization. It can also be used to make fundraising campaigns presentation.
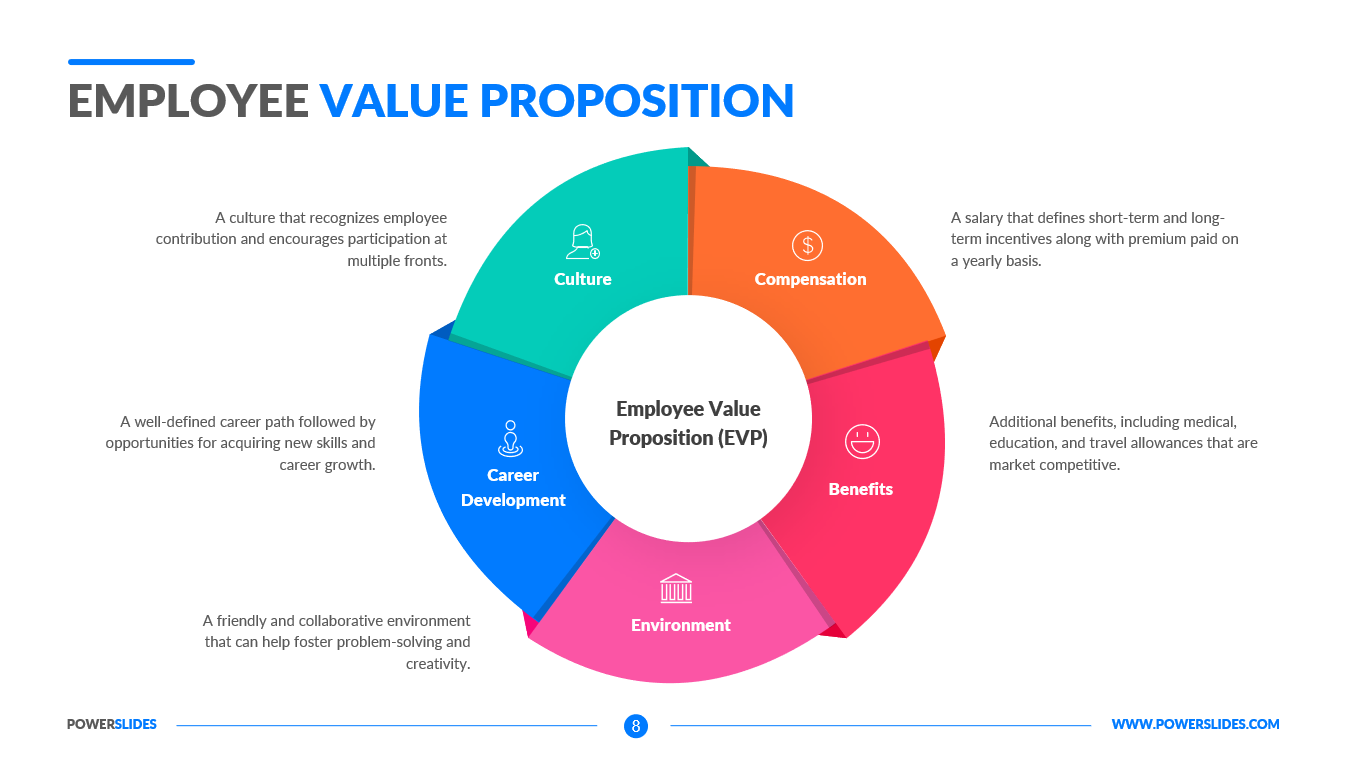
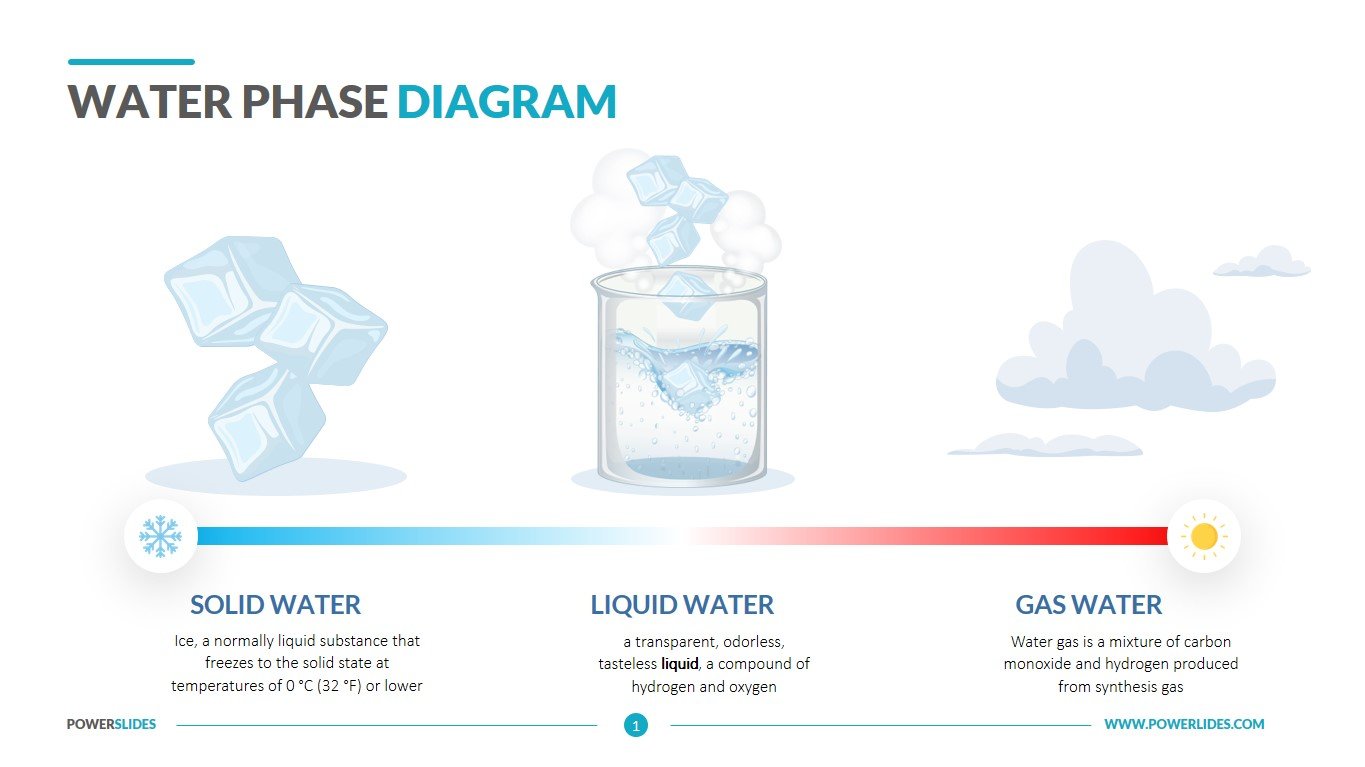
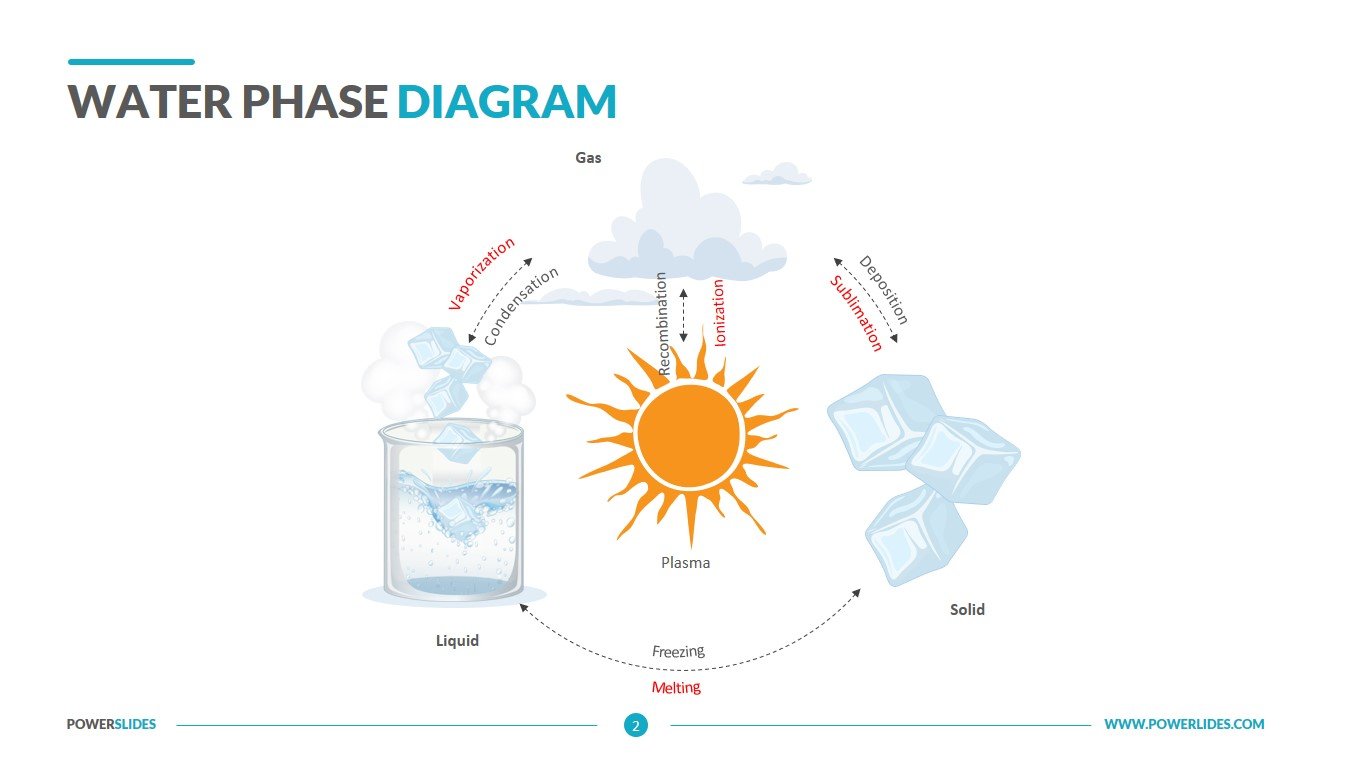
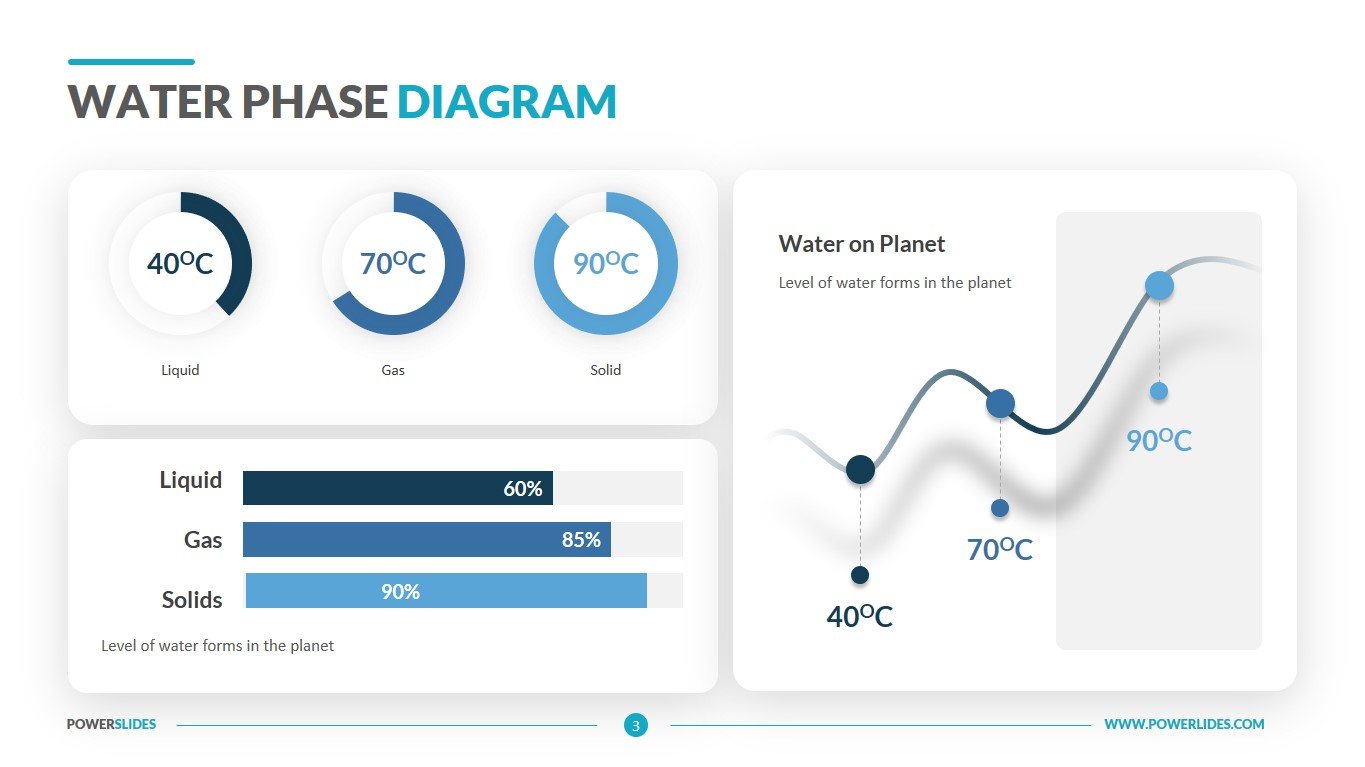
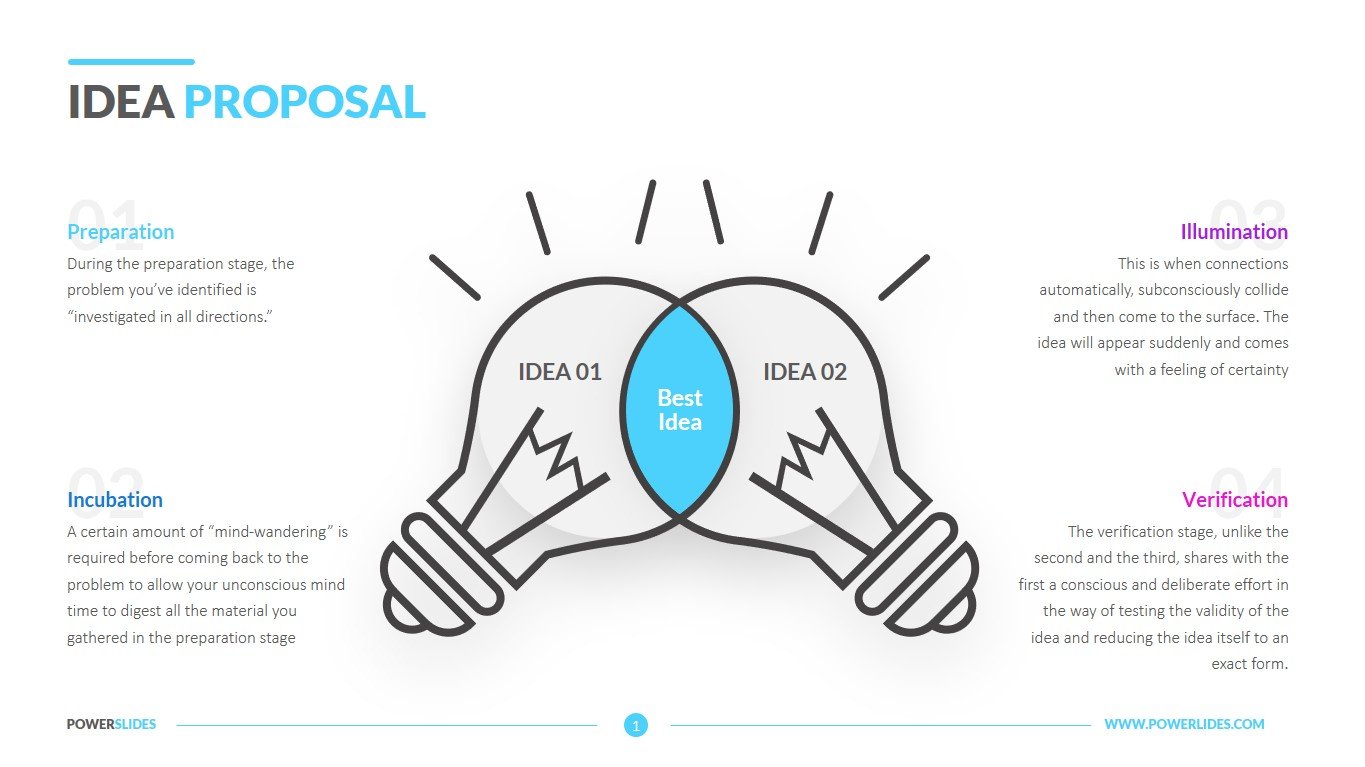
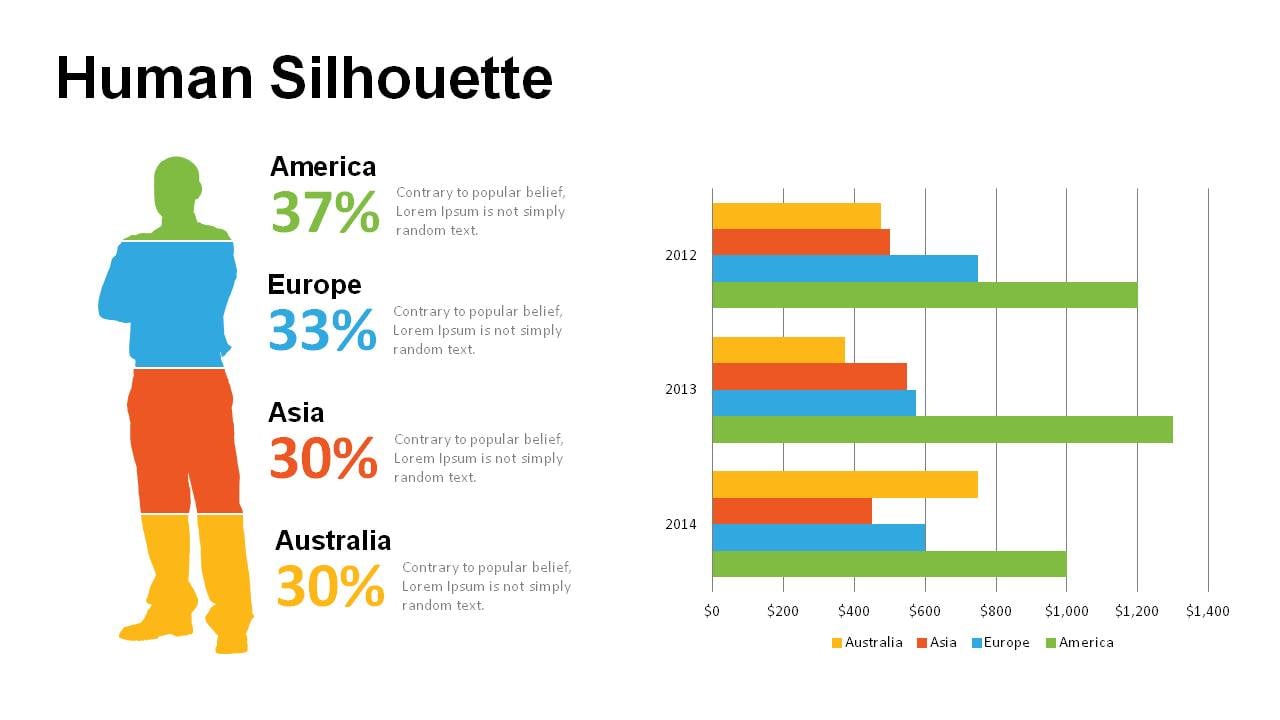
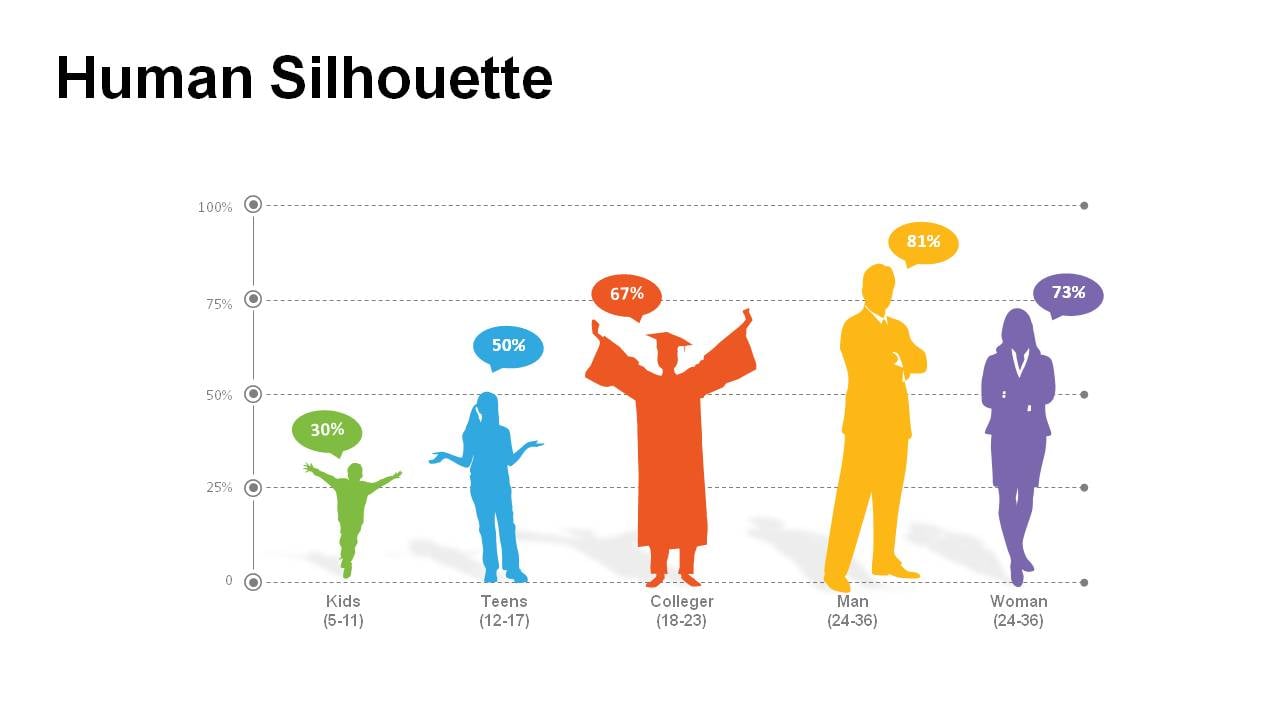
The infographic in the first slide can be used in your presentation to compare quantitative results. You can use the thermometer icon with both Celsius and Fahrenheit scale in the second, third and last slides to show visualization for a range of values of different processes.
The Thermometer template is well-designed with infographics for business and executive PPT presentations. Ideal for business analysts, subject matter experts, educators, consultants, project managers, department heads, project managers, etc.
The template’s text placeholders are 100% editable and customizable as per your requirements. You can change the color, text, resize icons and shapes to suit your preference. The thermometer PowerPoint template can be used as an alternative to other visualization template It can be used for school classes, business purposes, and commercial purposes.


