Gartner Magic Quadrant Diagrams
What do you think of this template?
 (5.00/ 5)
10 ratings

 5 Slides
 File size: 16:9
 Fonts: Lato Black, Calibri
 Supported version
PPT 2010, PPT 2013, PPT 2016
Supported version
PPT 2010, PPT 2013, PPT 2016

Product details
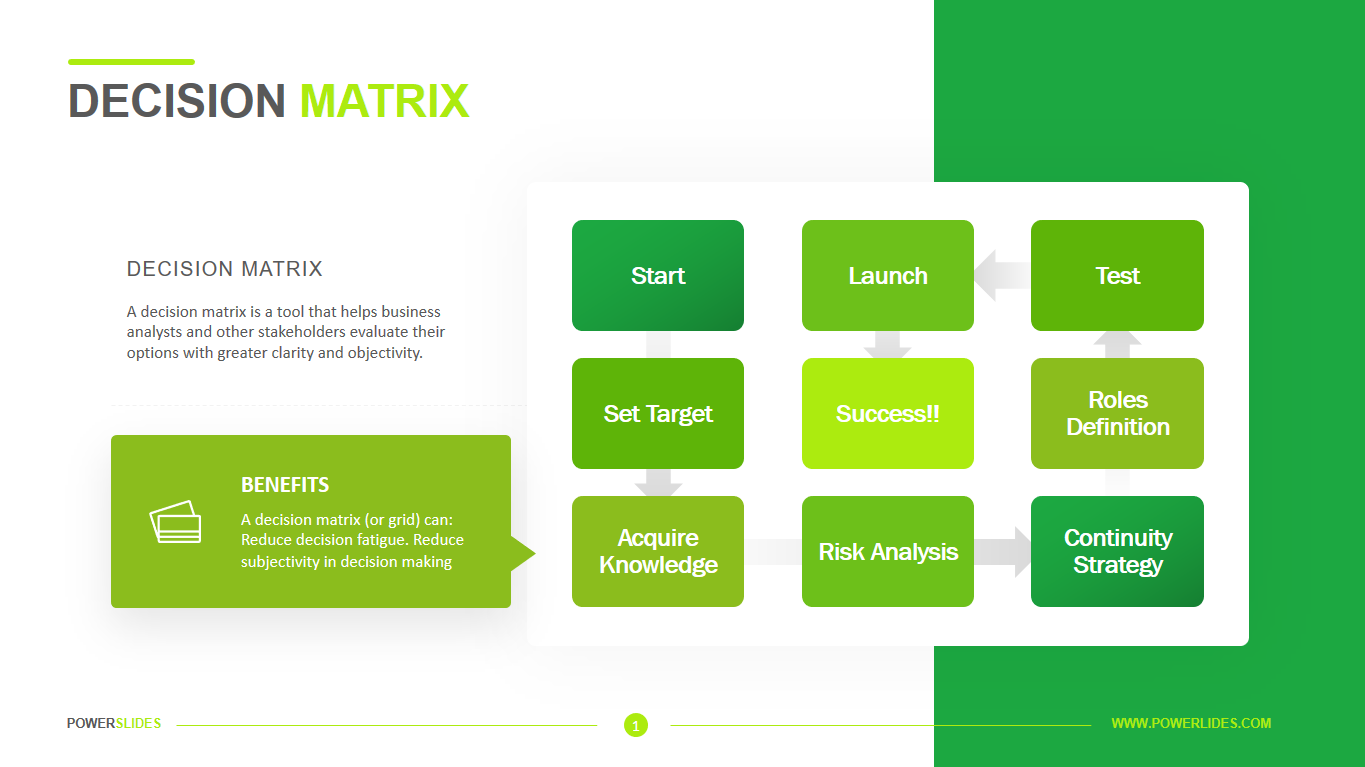
Looking to persuade investors by using your strong market positioning as leverage? Gartner’s Magic Quadrant is a well-known research methodology that provides competitive positioning in fast-growing markets. Released on a quarterly basis, the graphical report provides a summary of specific market research and competitors. With so many businesses relying on this data to position their own strategies, we created a template that would be visually appealing and flexible to meet unique business needs without sacrificing key information.
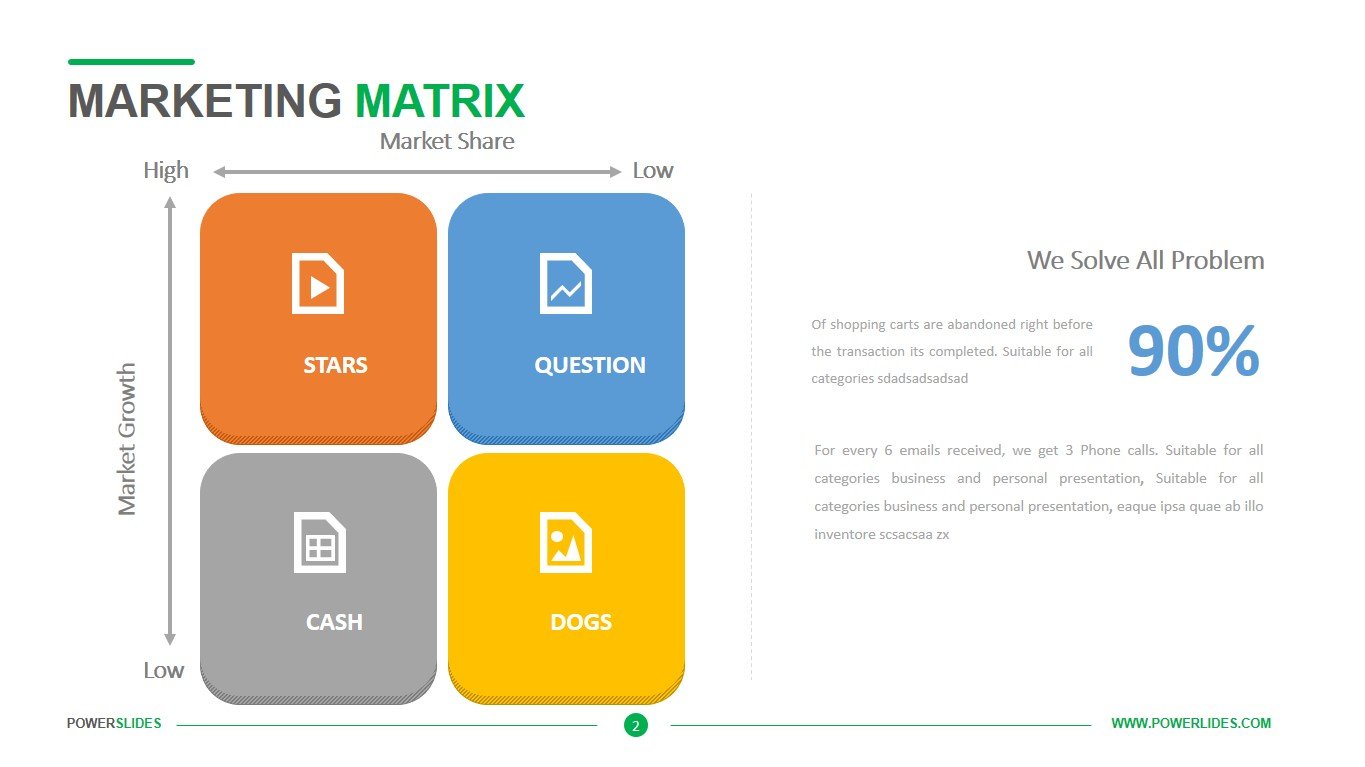
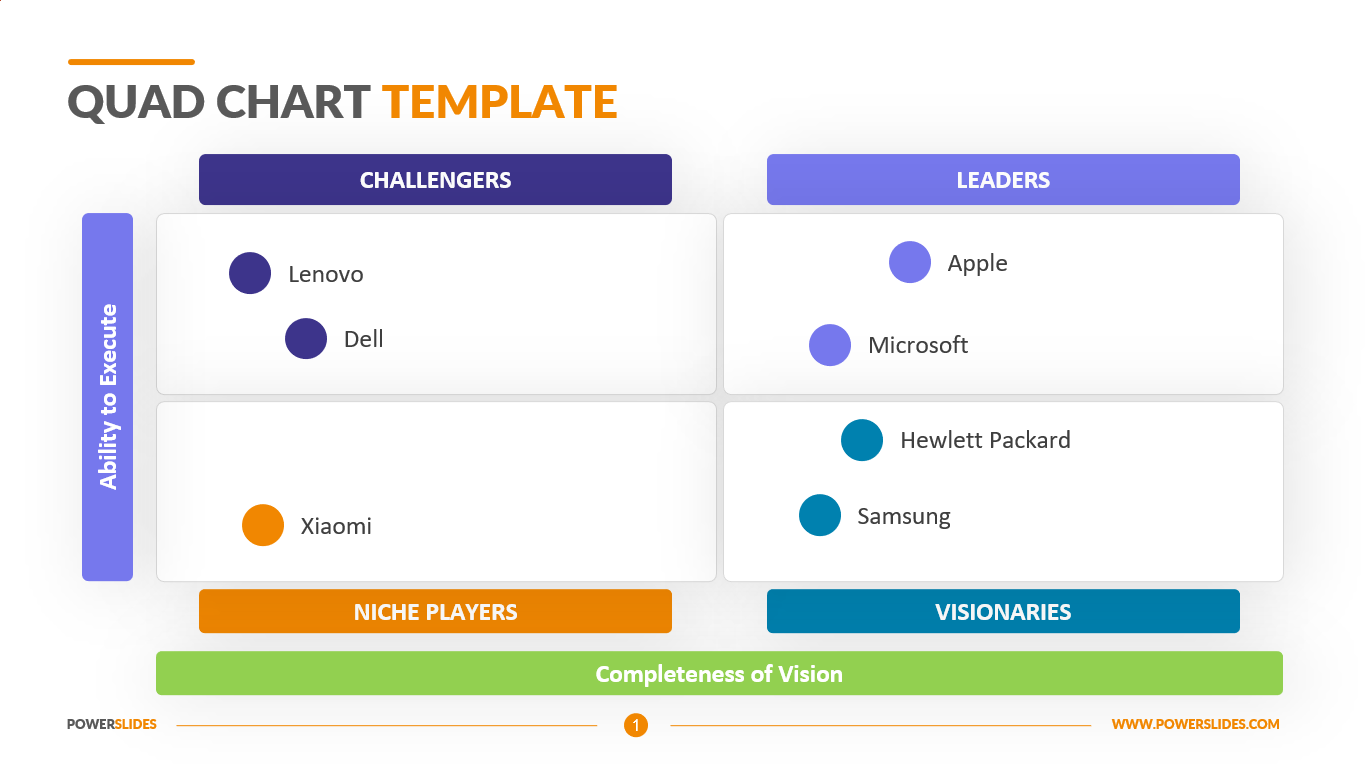
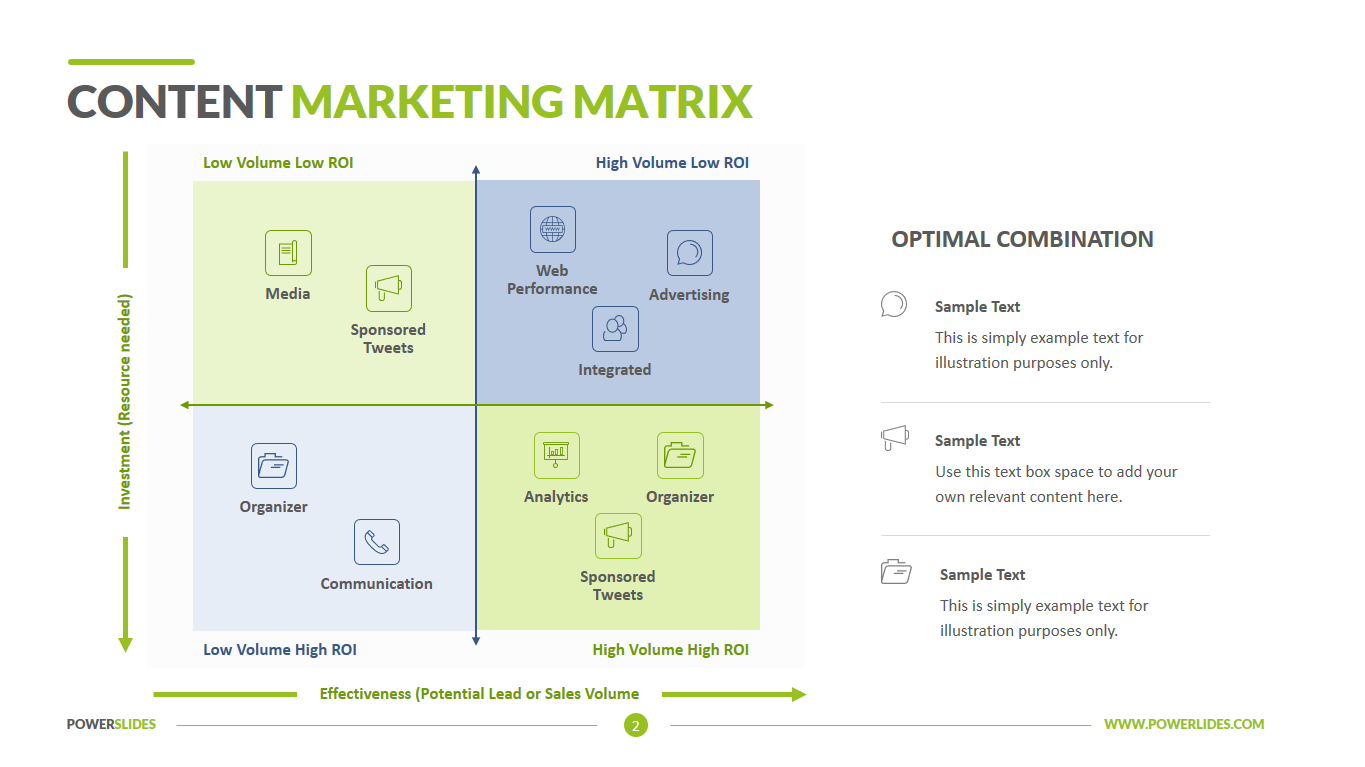
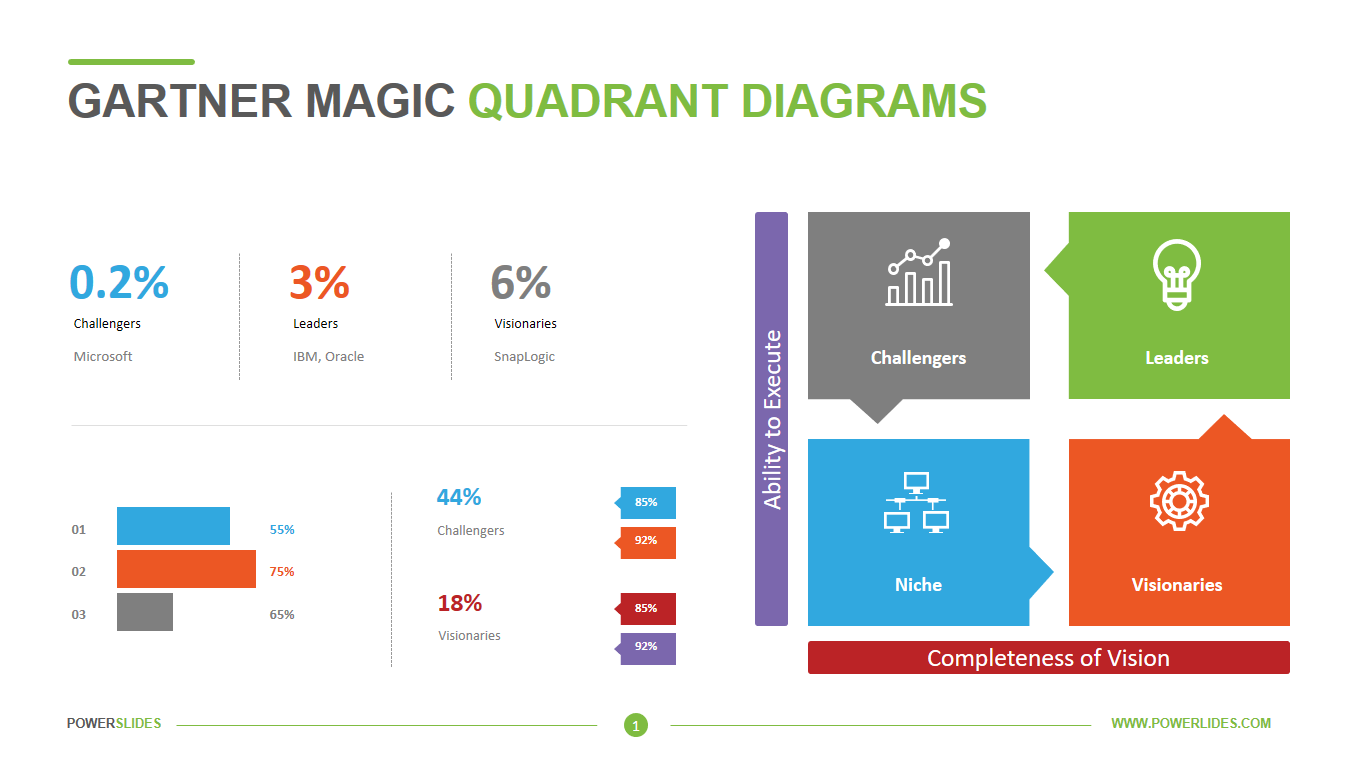
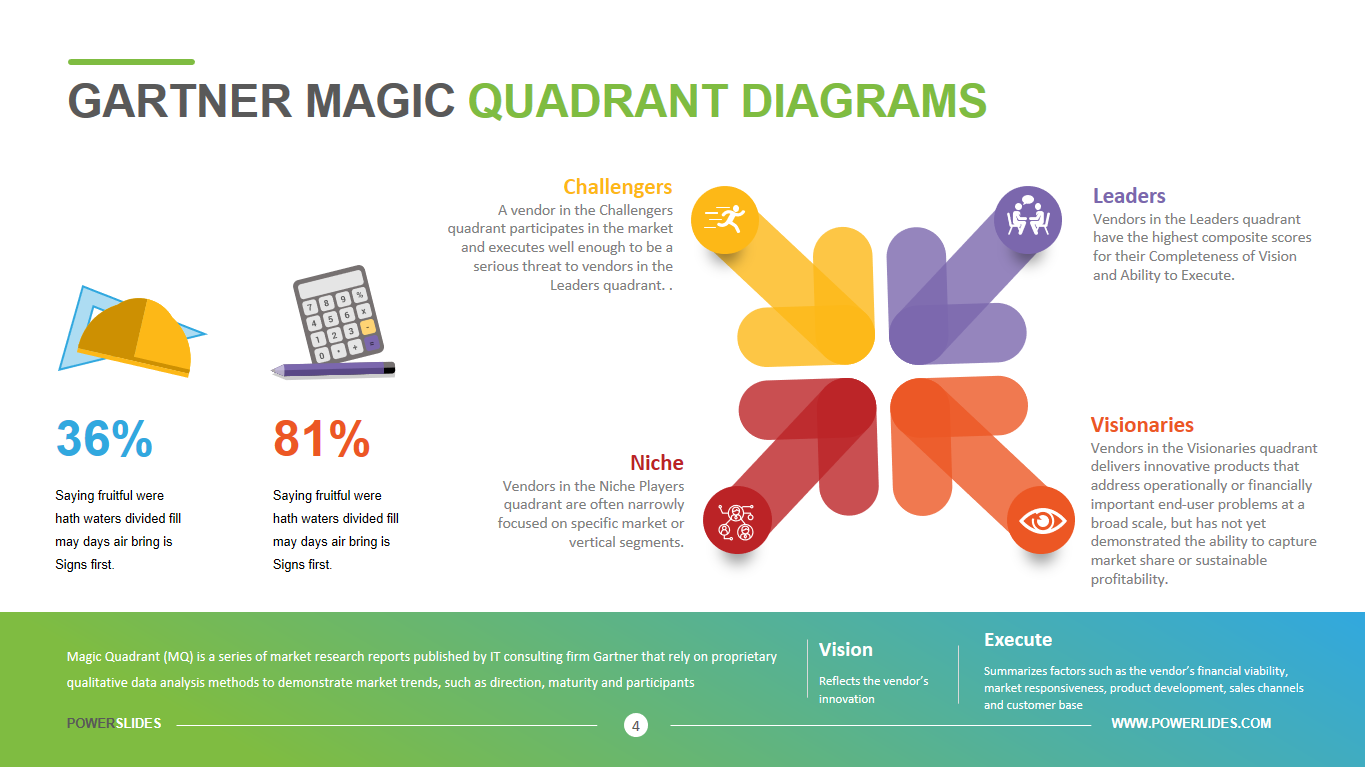
The Magic Quadrant is a graphical presentation of a company’s Completeness of Vision and Ability to Execute their vision compared to market standards and other technologies in the same category.
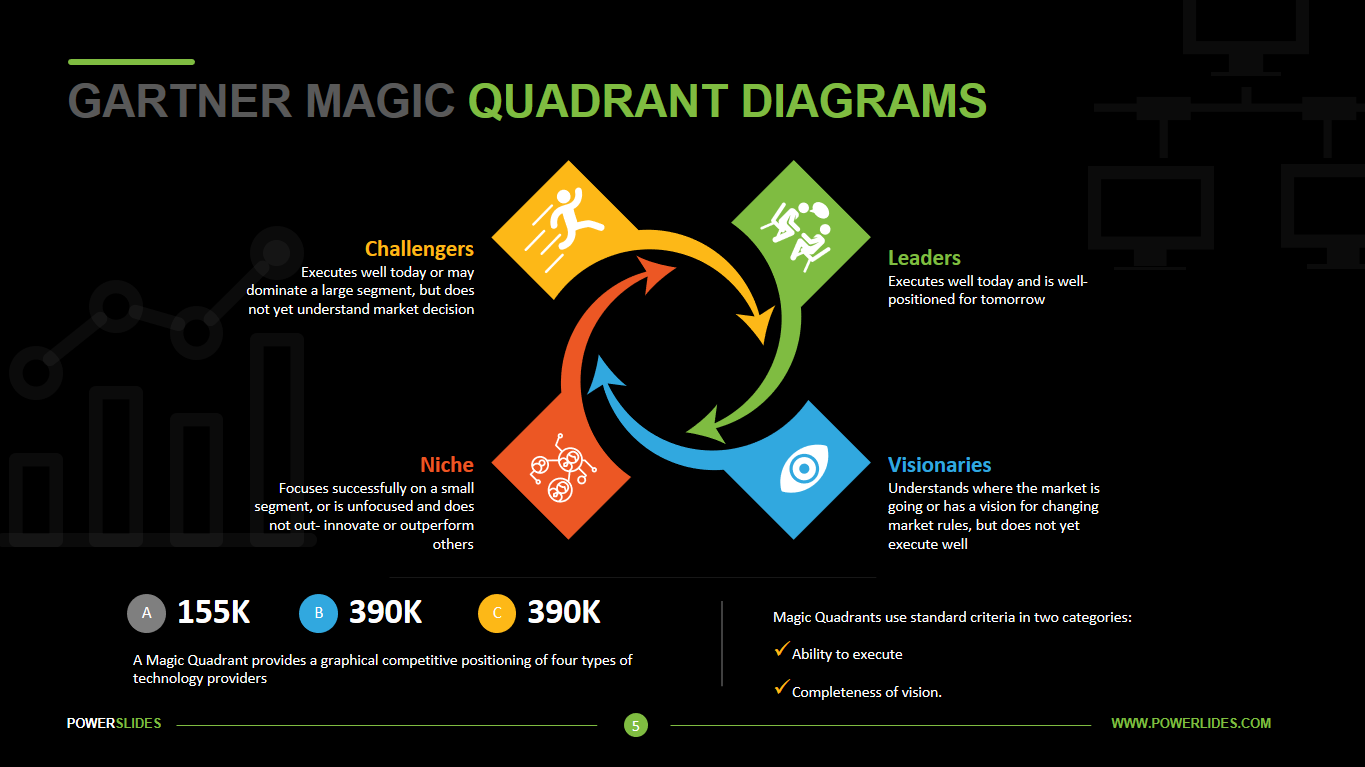
The Ability to Execute is fairly self-explanatory and is the y-axis. The x-axis is the Completeness of Vision, which is heavily influenced by a company’s recent three-year history of innovation and success with its strategies. It is important to understand that a Magic Quadrant is not specific to a product, rather a Magic Quadrant evaluates a vendor in a defined market.
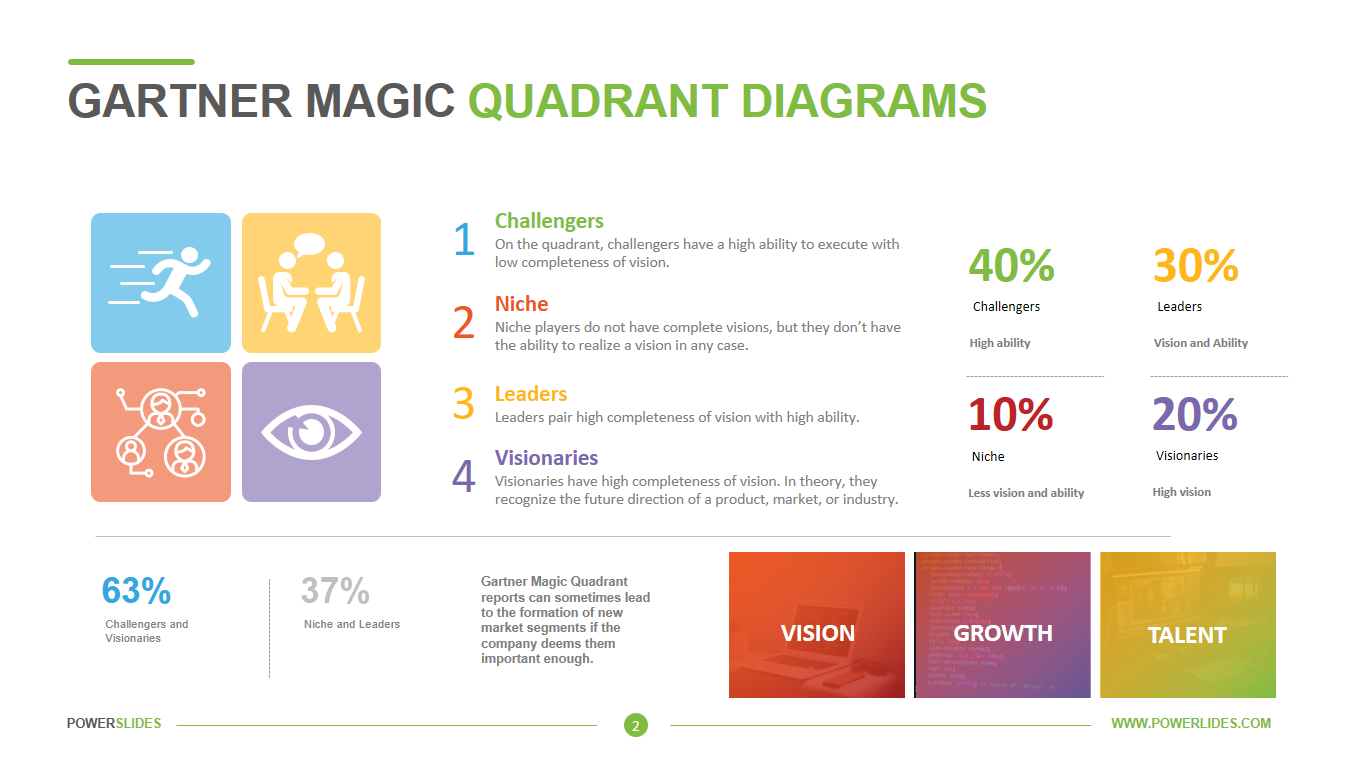
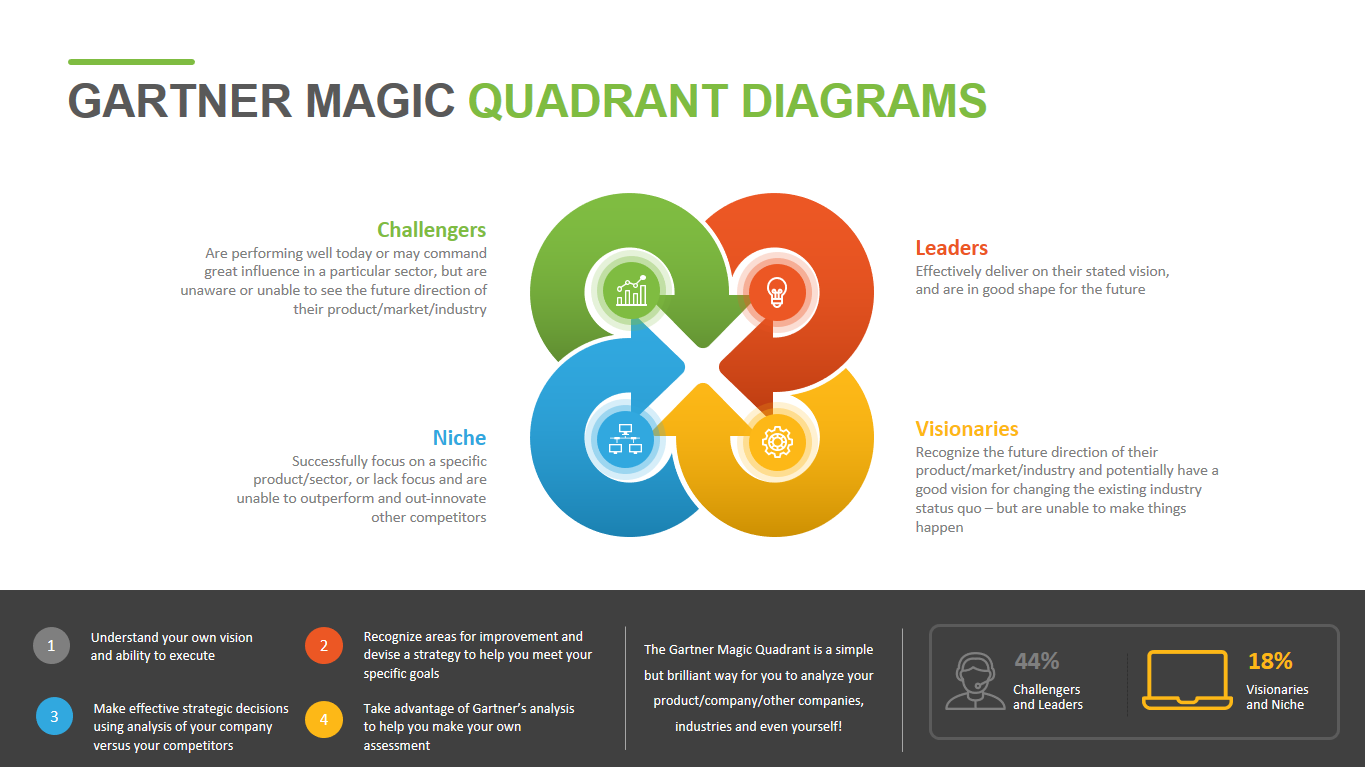
There are four sections, or quadrants, that a company can fall into – Niche Players, Challengers, Visionaries, Leaders. A company that is in the Niche Players category, the lower left quadrant of the chart, usually means the company focuses solely on specializing in a small section of the entire market and do not present a clear vision for expanding and executing more qualifiers.
Moving to the lower right section of the chart we find the Visionaries; these companies have a clear view of where the market is heading or can see a way to reshape the perception of the technology in a way that is innovative, but lack in the demonstration of those ideas today.
This leads into the upper left side of the chart with what is called the Challengers; these companies are well-structured and have orchestrated the ability to keep up with today’s standards but tend to fall short in the vision of what is in demand for tomorrow.
Last is the upper right portion of the chart: this is referred to as the Leaders quadrant. These companies have demonstrated the ability to execute today’s standards and have demonstrated past success along with clear roadmaps of the standards expected in the future.
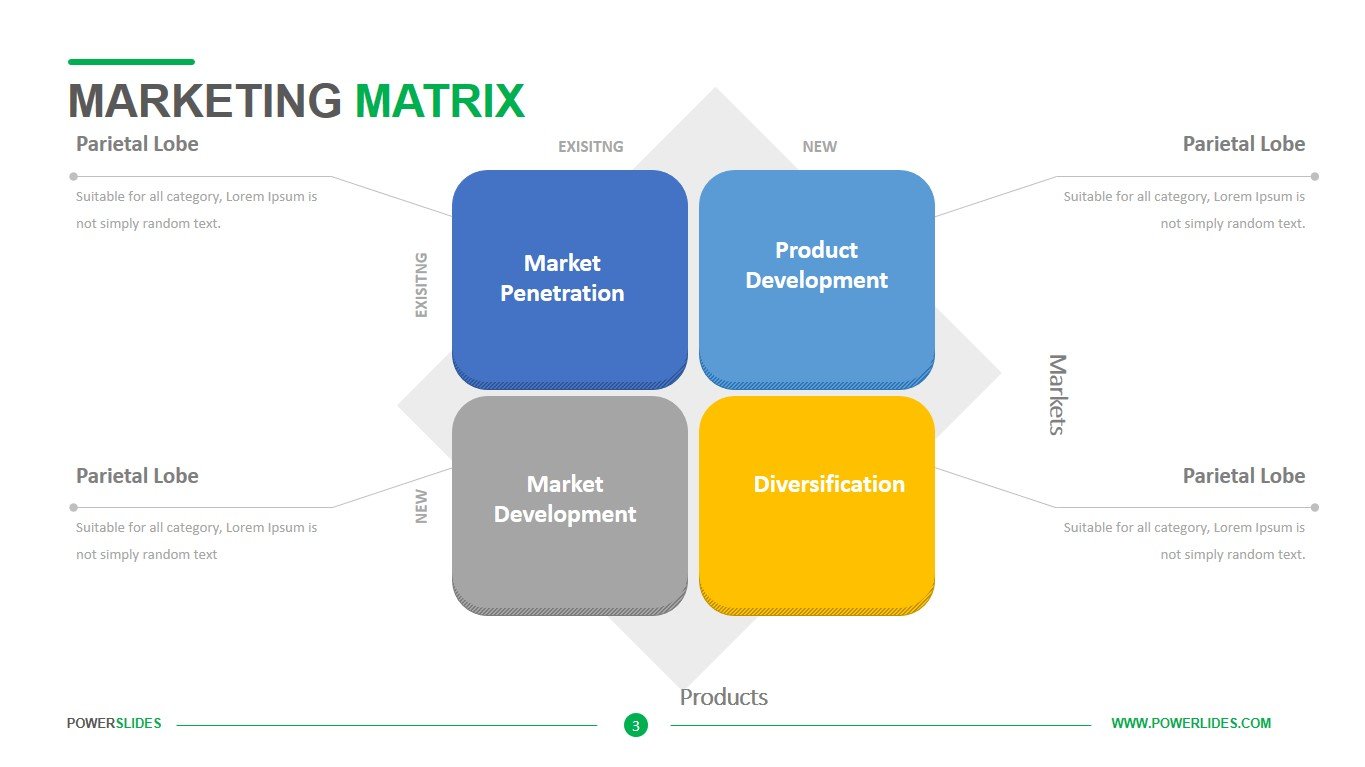
This template will be useful for startups when preparing their development plan for investors. Also, this template can be used by marketers when preparing information about the strengths and weaknesses of the company’s product. You can describe what steps you need to take to get a large share of the sales in the market.
This template will also be useful for purchasing managers when conducting supplier analysis. Business leaders can use this template when designing a company’s development strategy. You can also use the slides in this template to prepare department management changes and optimize functional linkages between departments.
This PowerPoint template leads with the key categorizations provided by Gartner: leaders, challengers, niche and visionaries. Each of the five design variations clearly outlines specific market research, provides an overview of competitor positioning and has call-outs for statistics and figures. Analysts and strategists can use this template to provide a persuasive evaluation of companies across all sectors, particularly information technology. The Gartner Magic Quadrant Diagrams template will organically complement your old presentations.


