Quad Chart Template
What do you think of this template?

 (3.00/ 5)
9 ratings

 4 Slides
 File size: 16:9
 Fonts: Lato Black, Calibri
 Supported version
PPT 2010, PPT 2013, PPT 2016
Supported version
PPT 2010, PPT 2013, PPT 2016

Product details
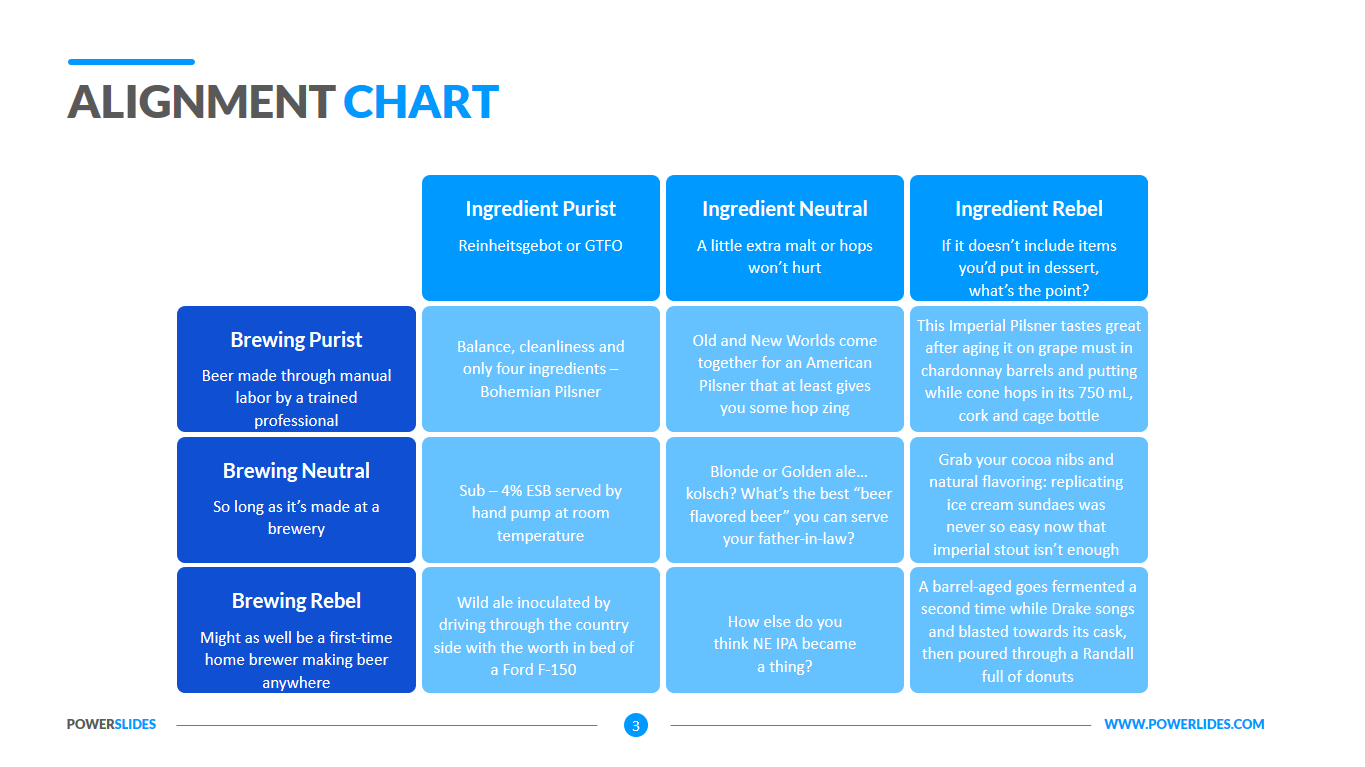
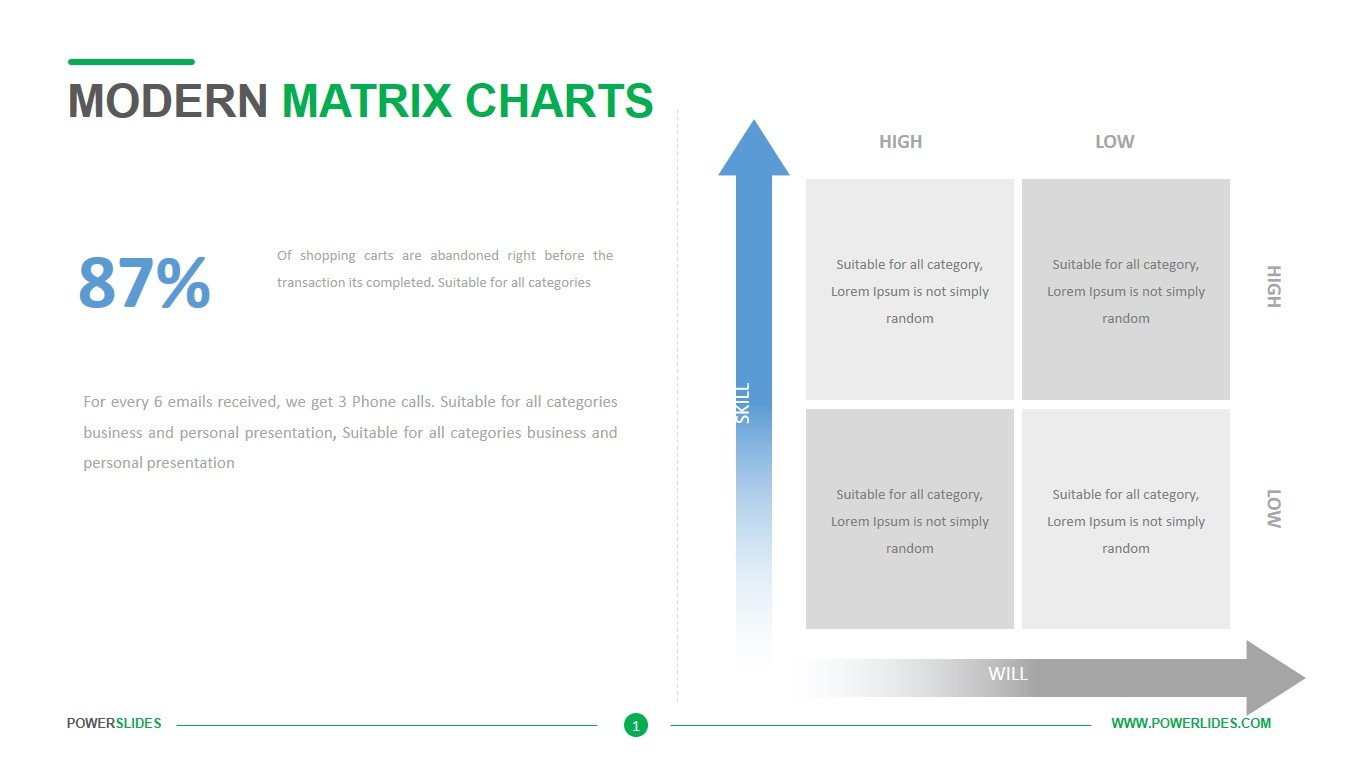
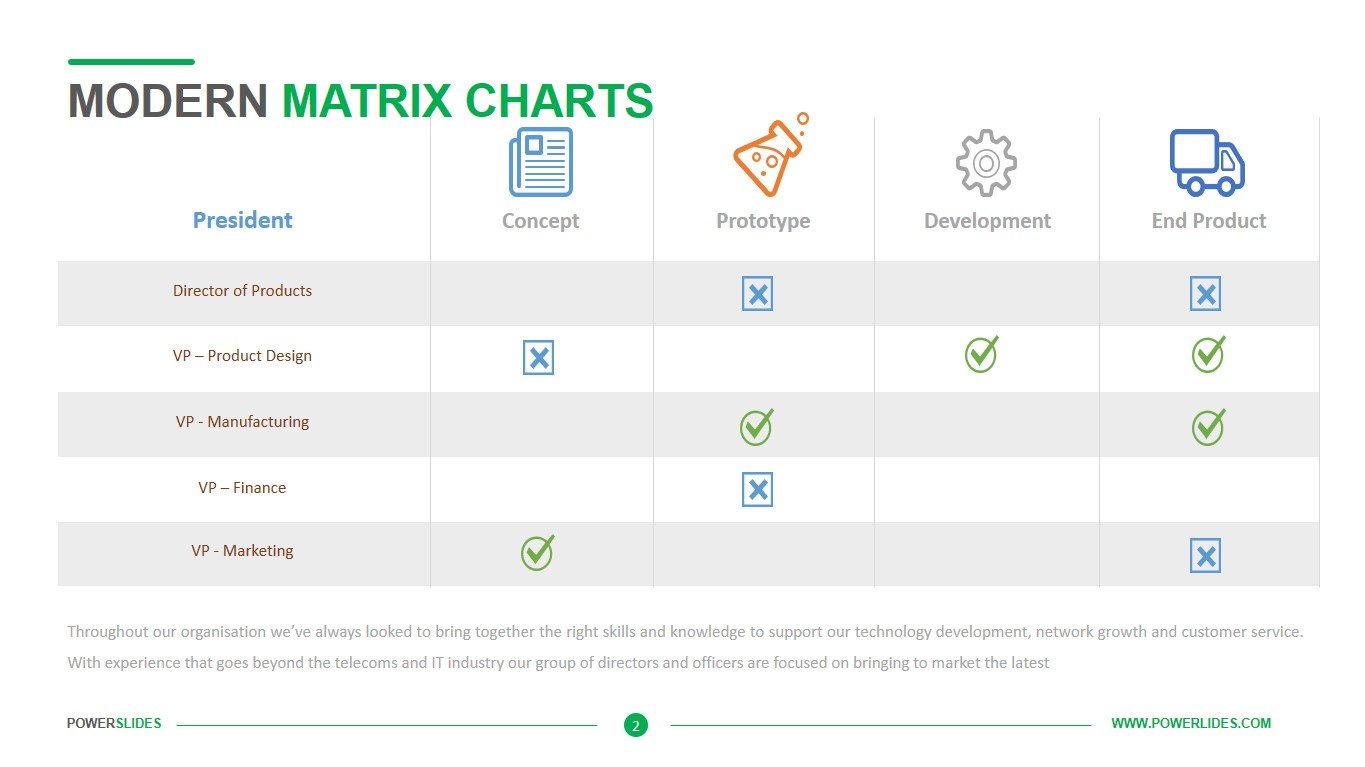
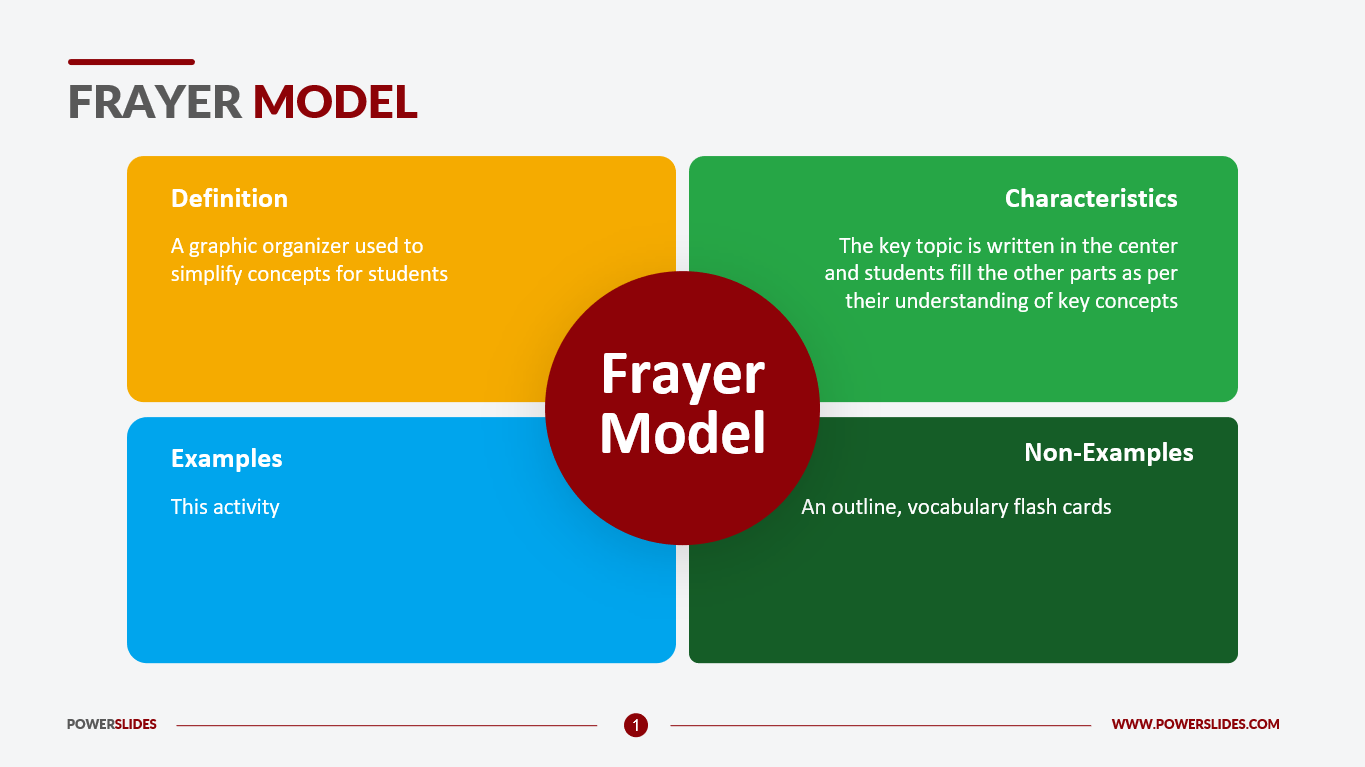
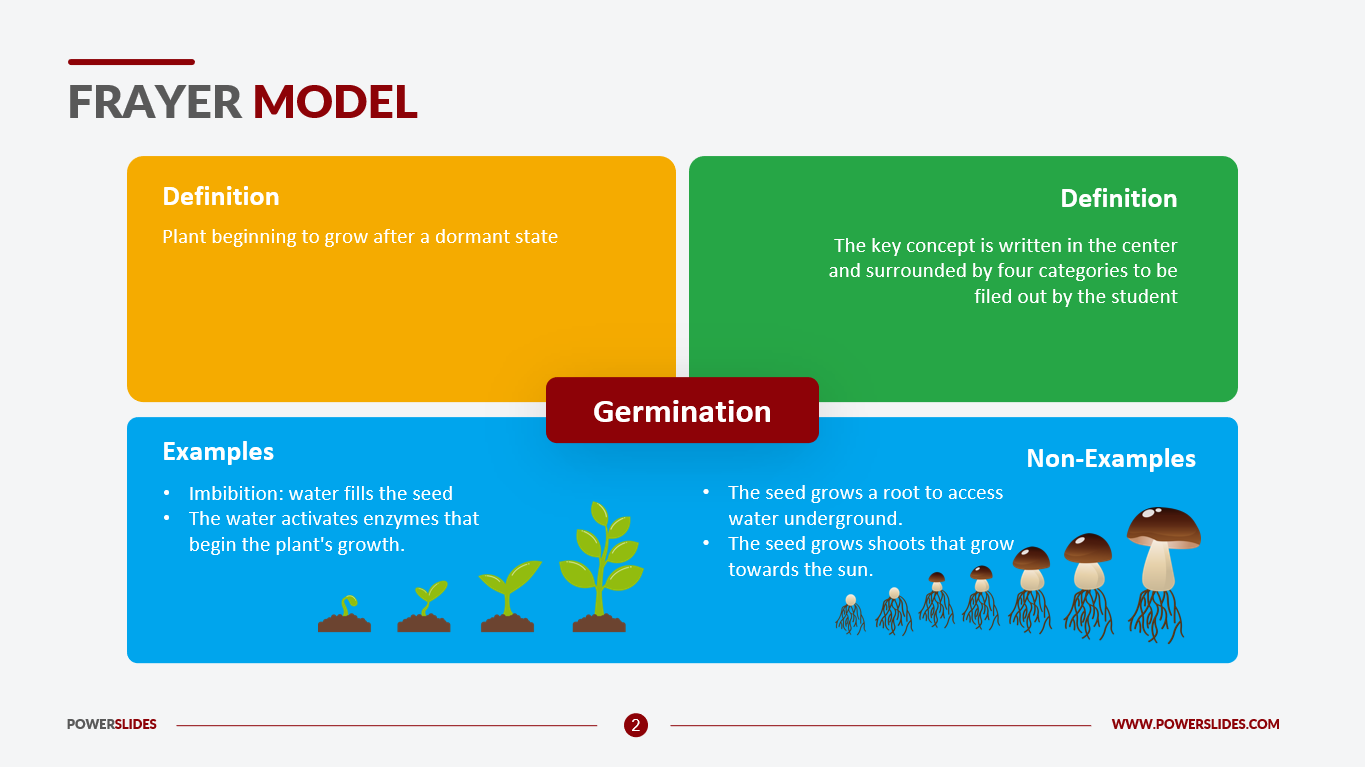
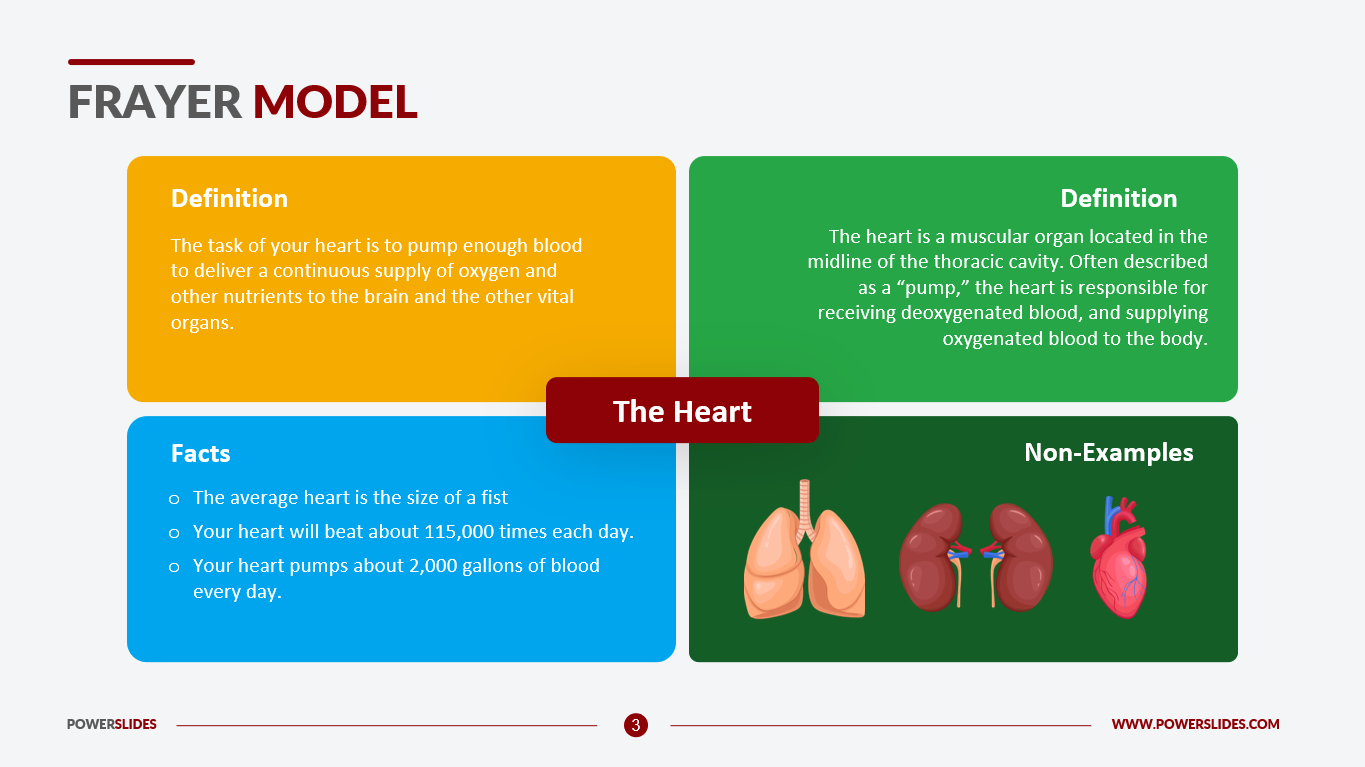
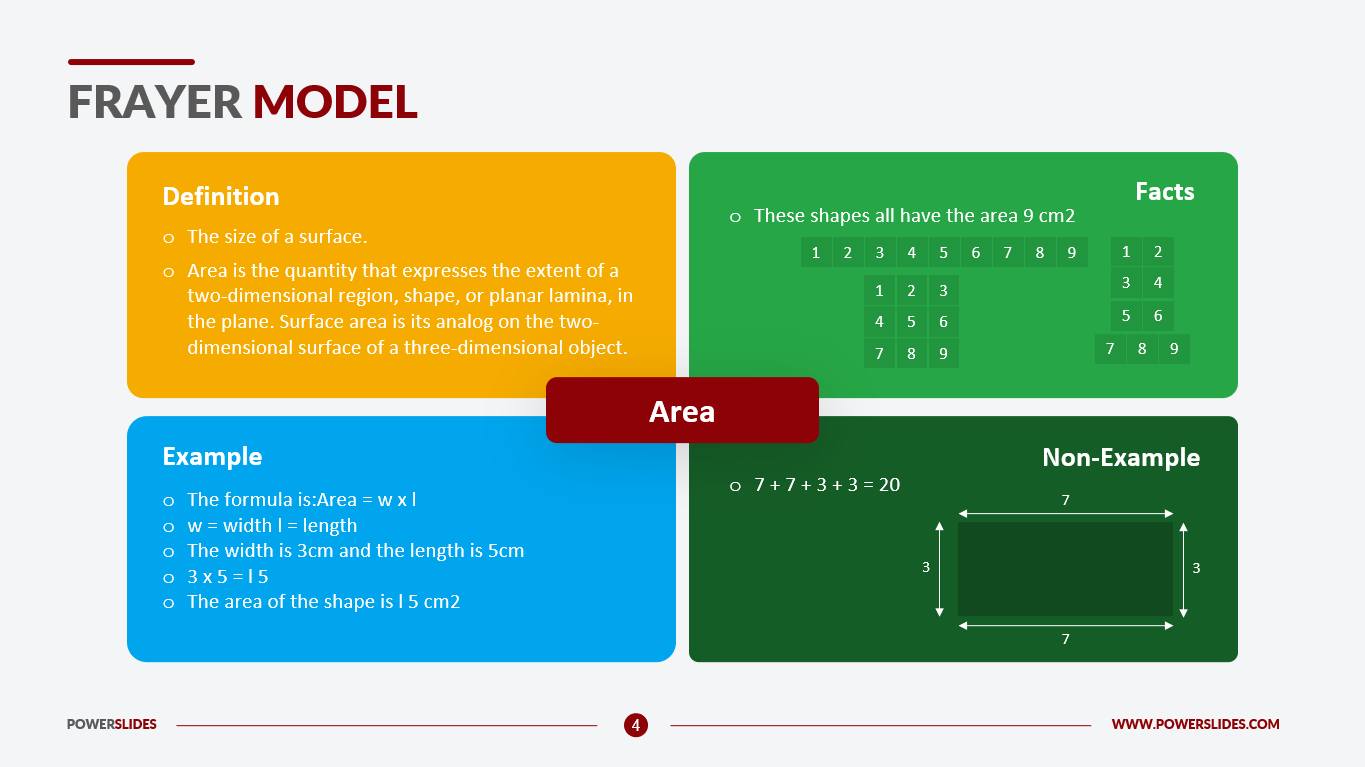
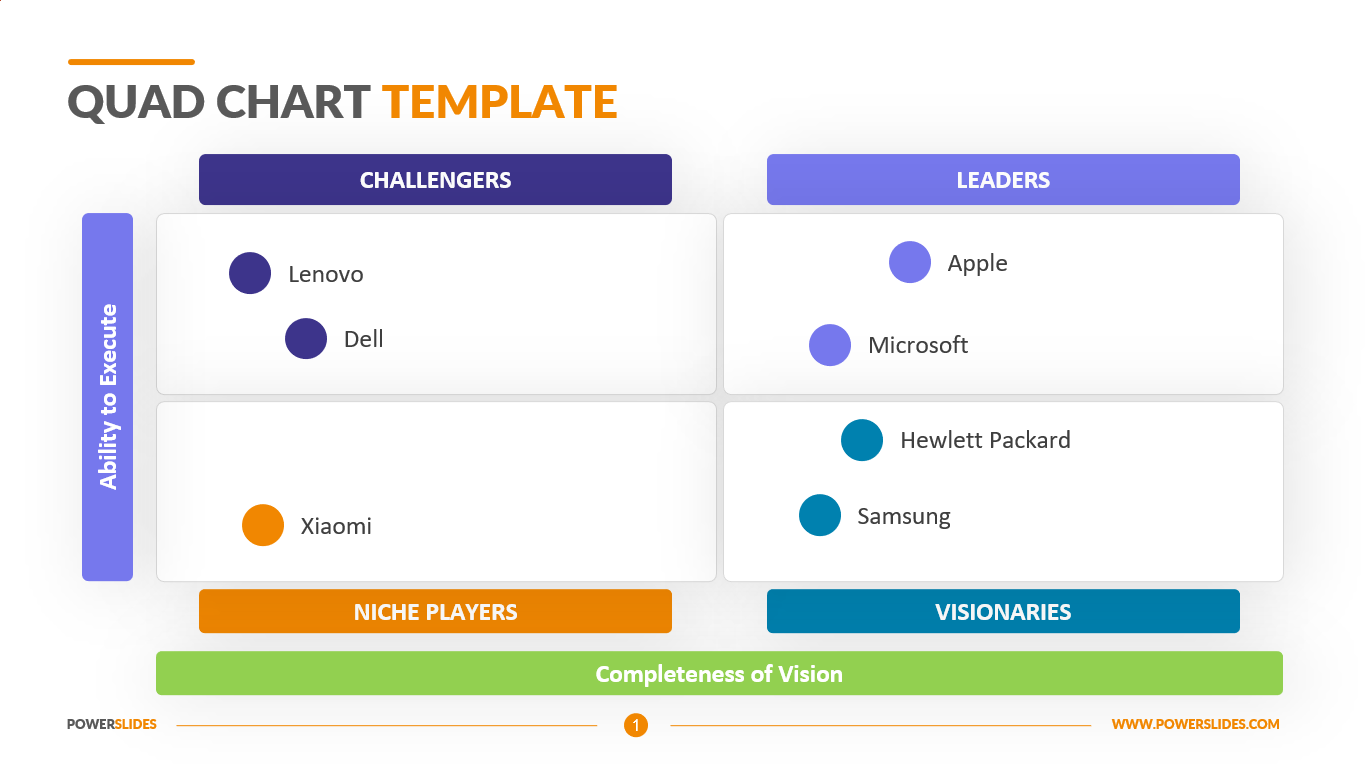
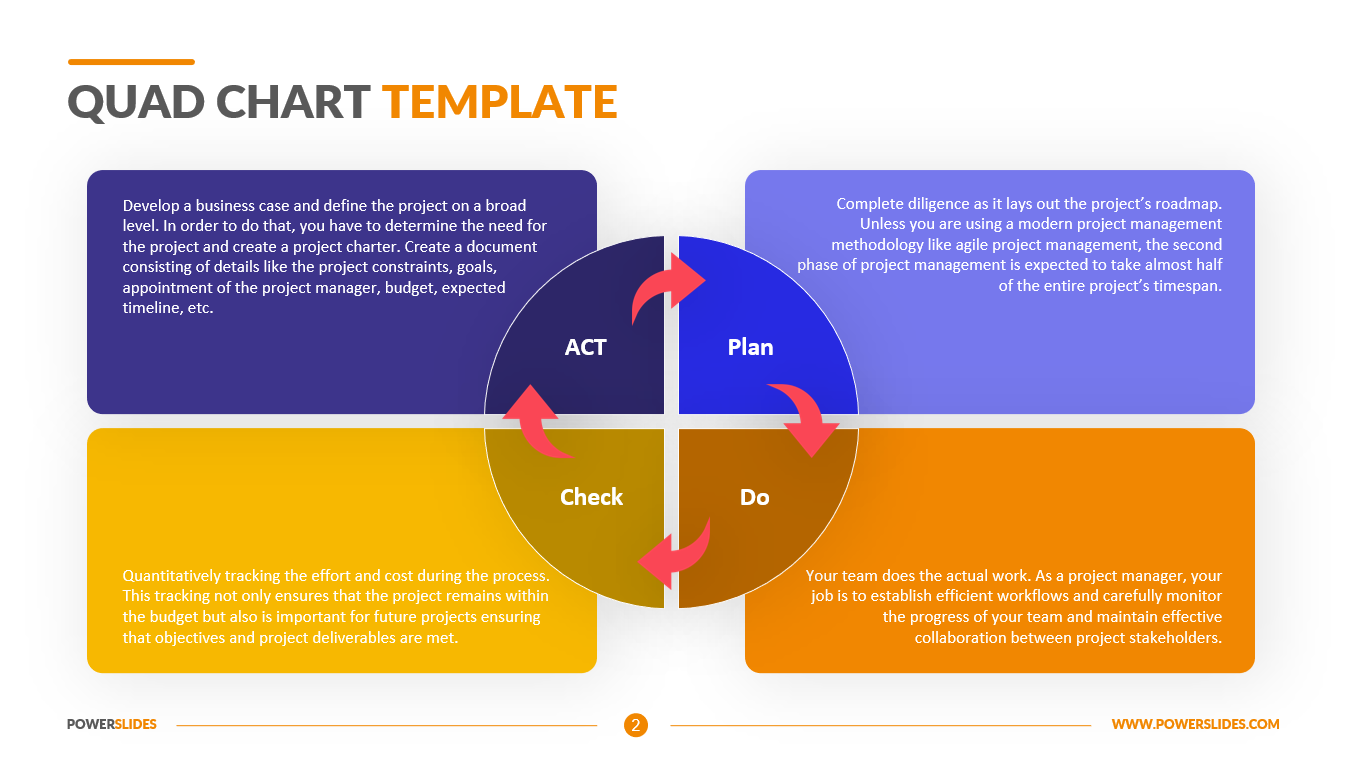
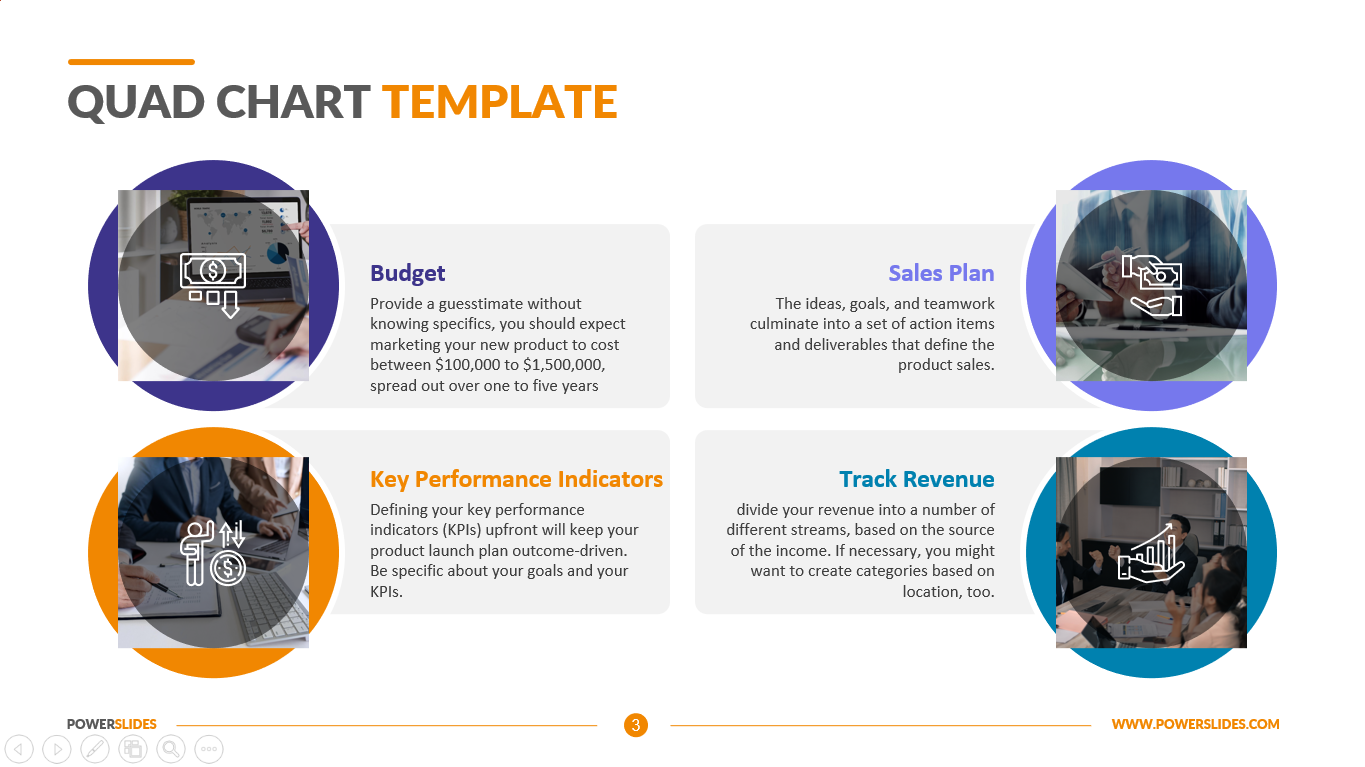
As you will have deduced from the name, it is a chart with four sections. It is what can be represented in the chart that is so powerful.
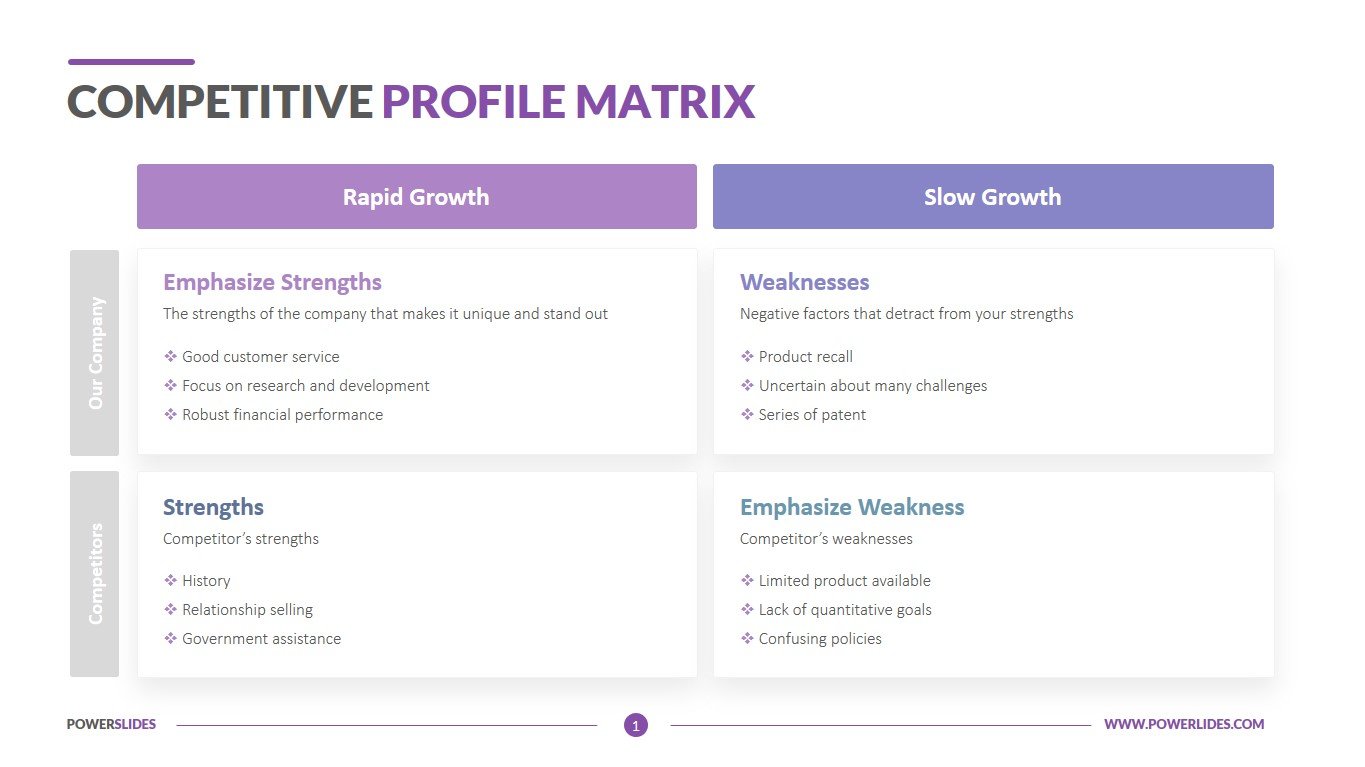
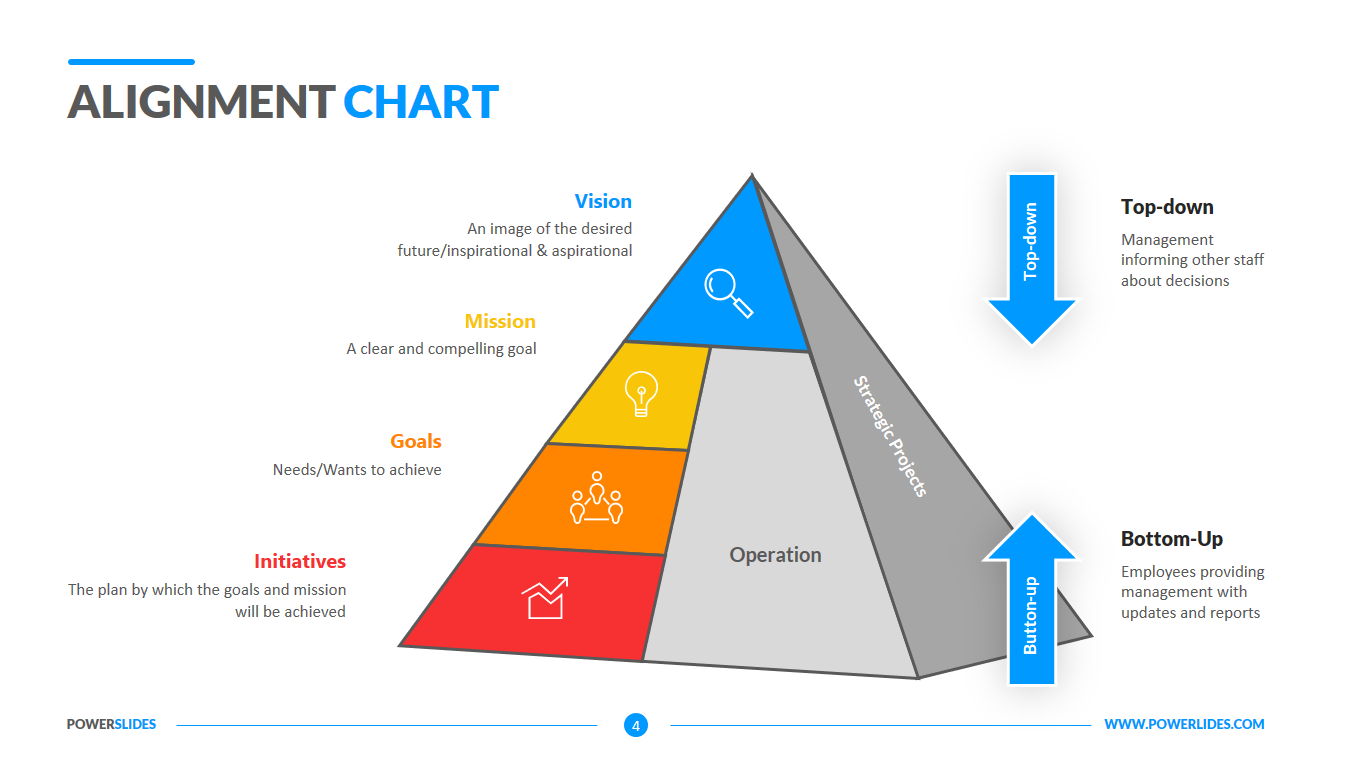
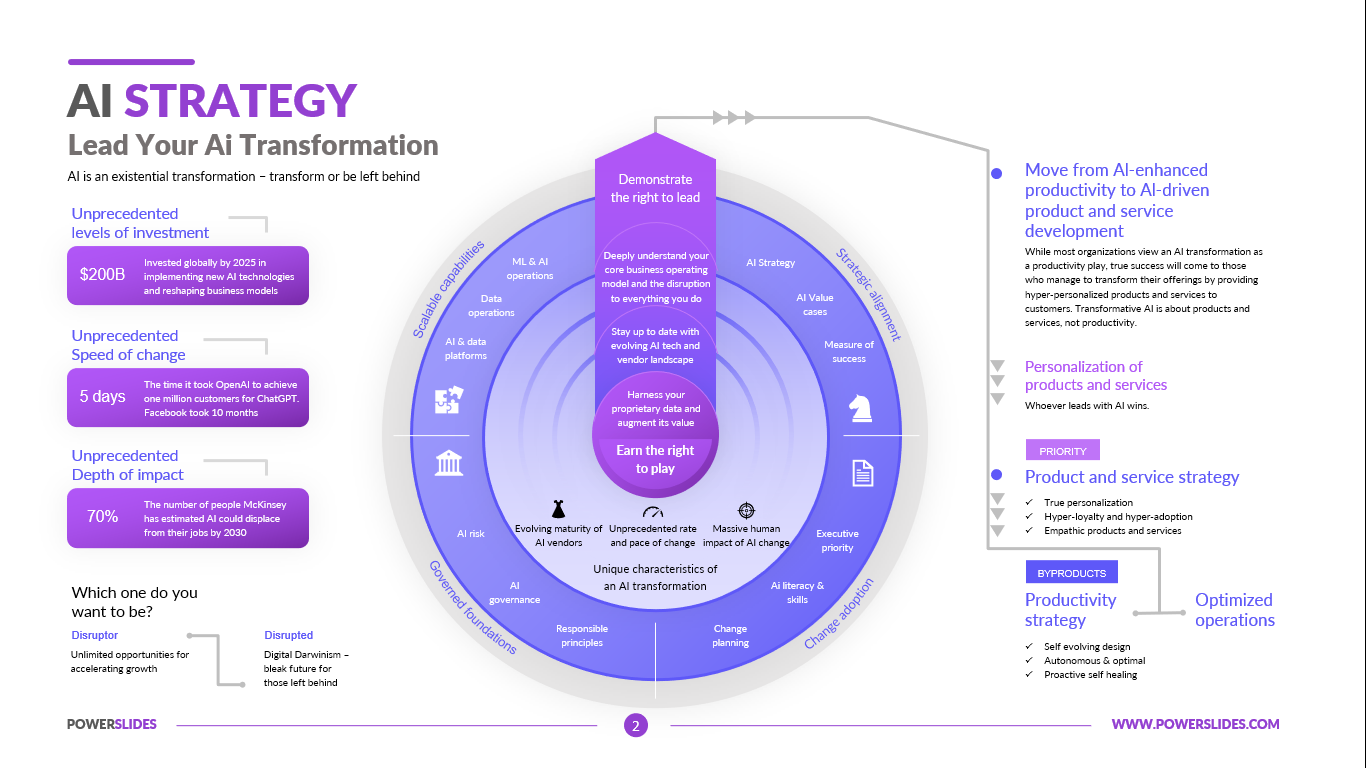
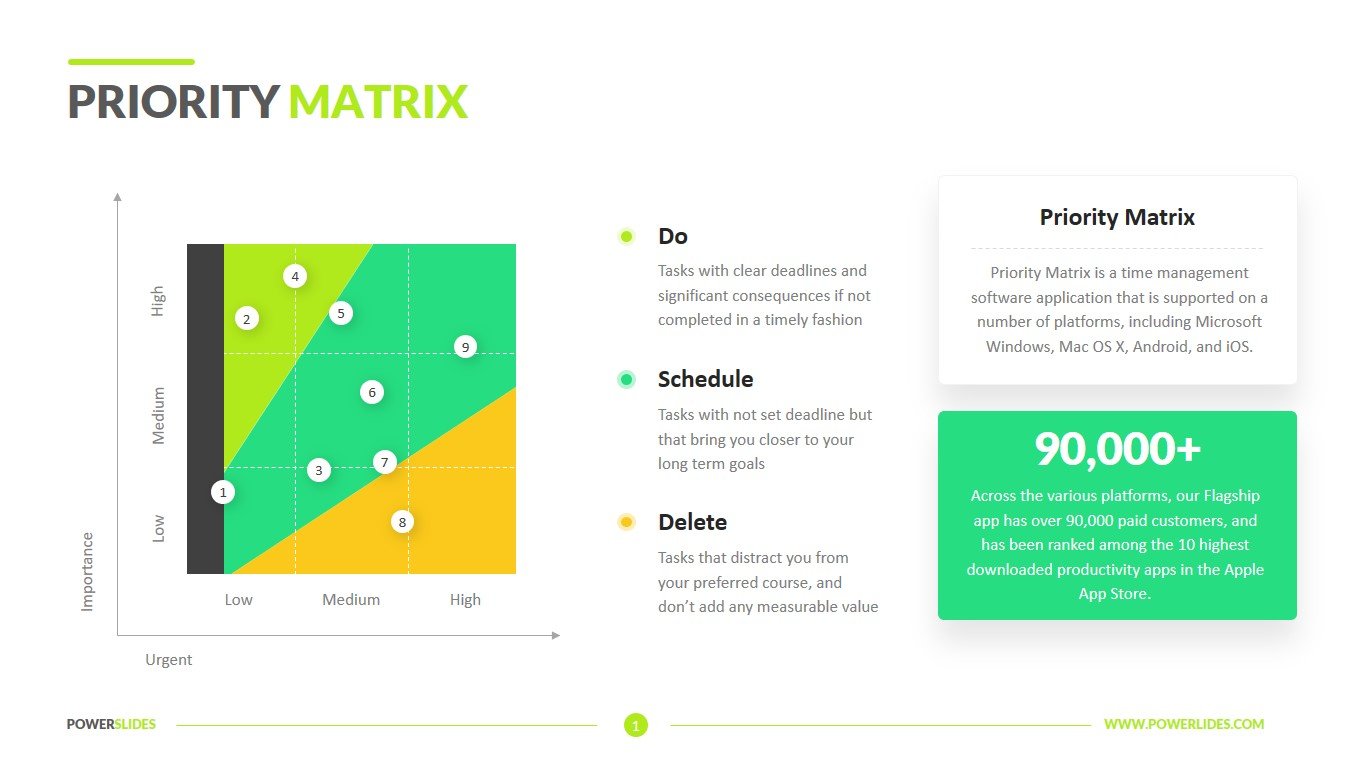
A quad chart is a one-page summary of a project that is visual, as well as descriptive. It is a very simple tool but extremely effective tool used for a variety of planning and communication purposes that explains what a project is all about. It helps to structure a concept or ideas into manageable pieces so you can define what you do before you start. It is usually used to introduce a new product or offer a solution to a problem. It helps to streamline proposals or ideas. It is often used in organizational administration, vehicle design, and government grant applications.
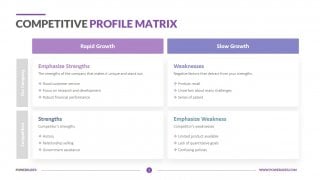
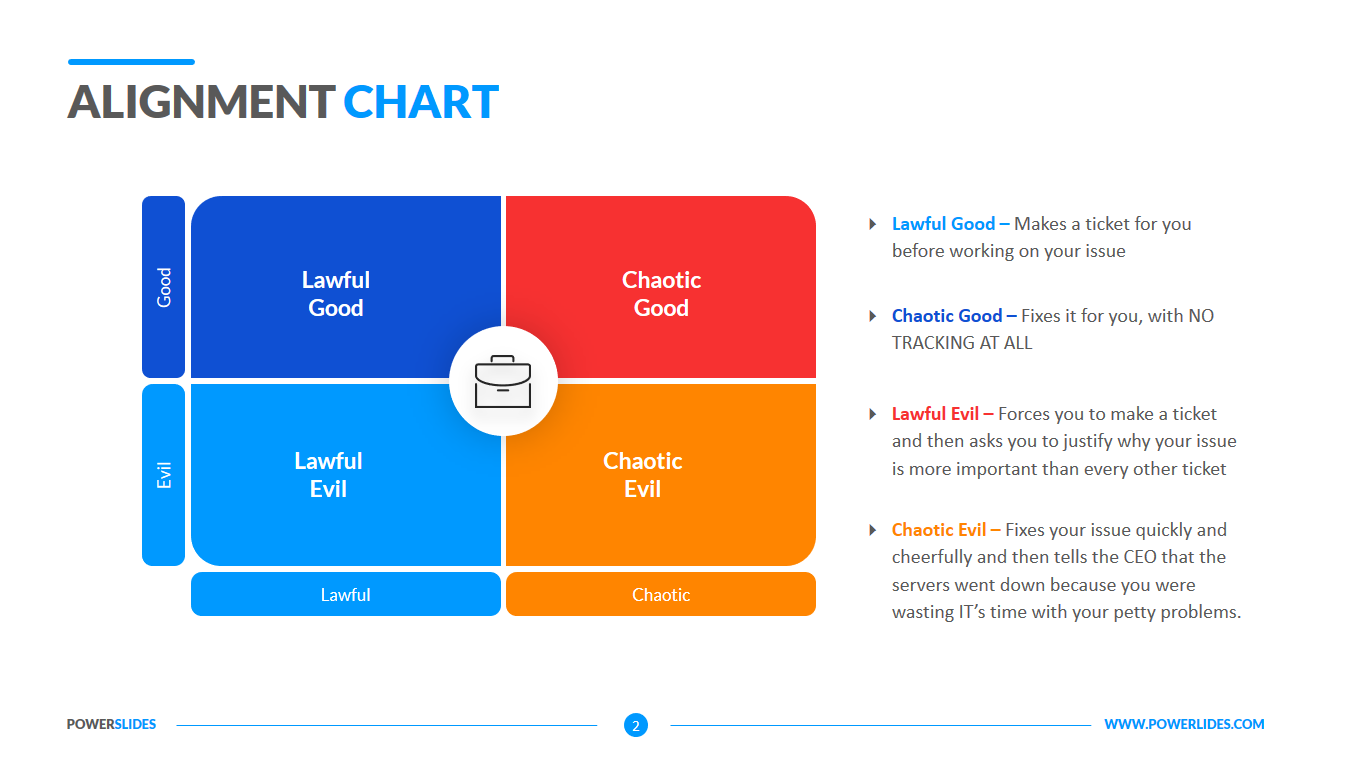
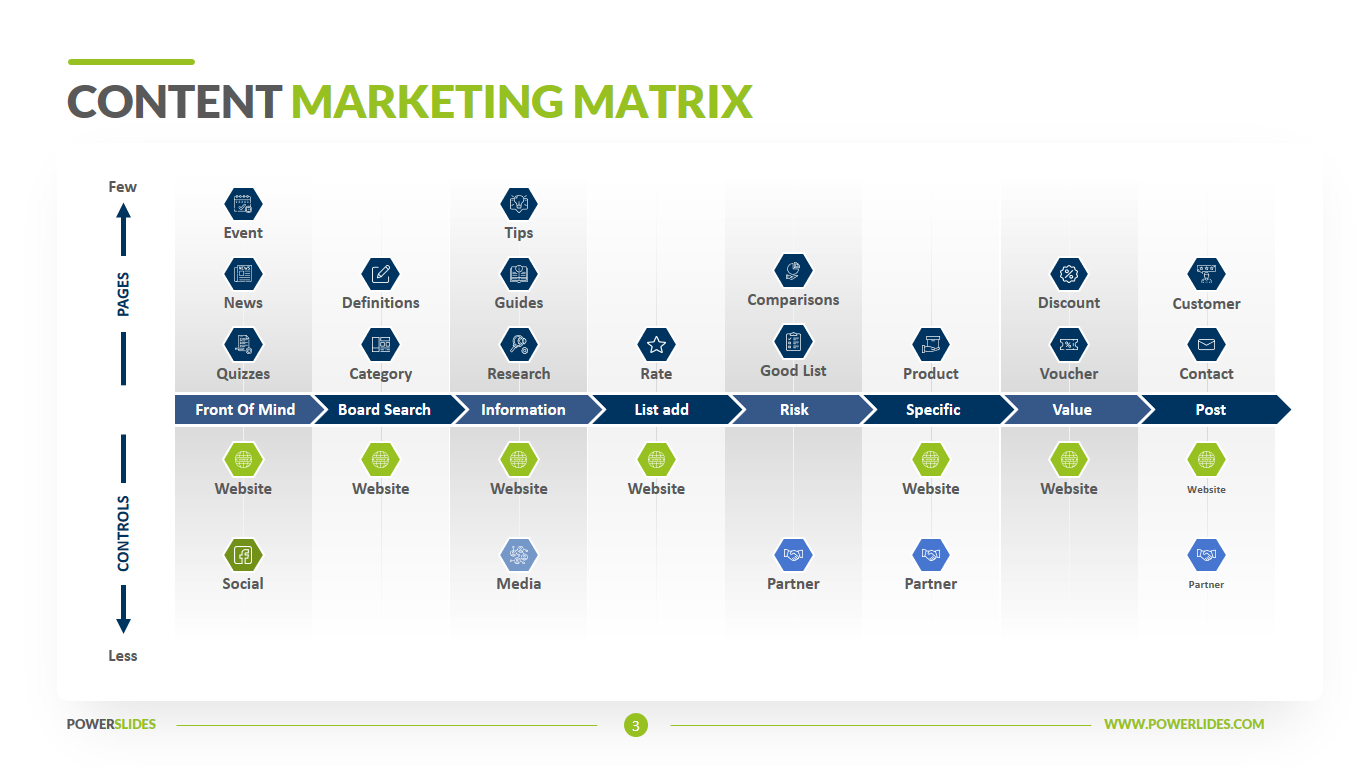
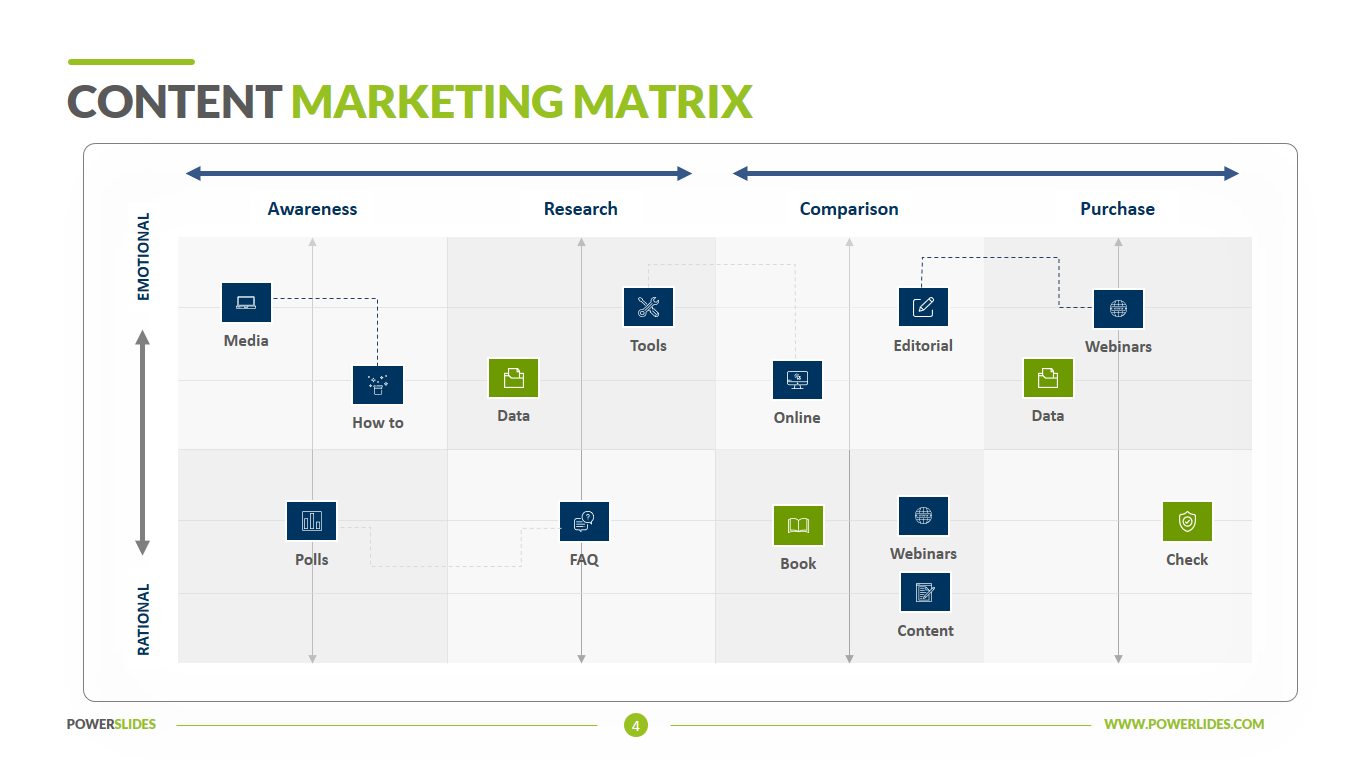
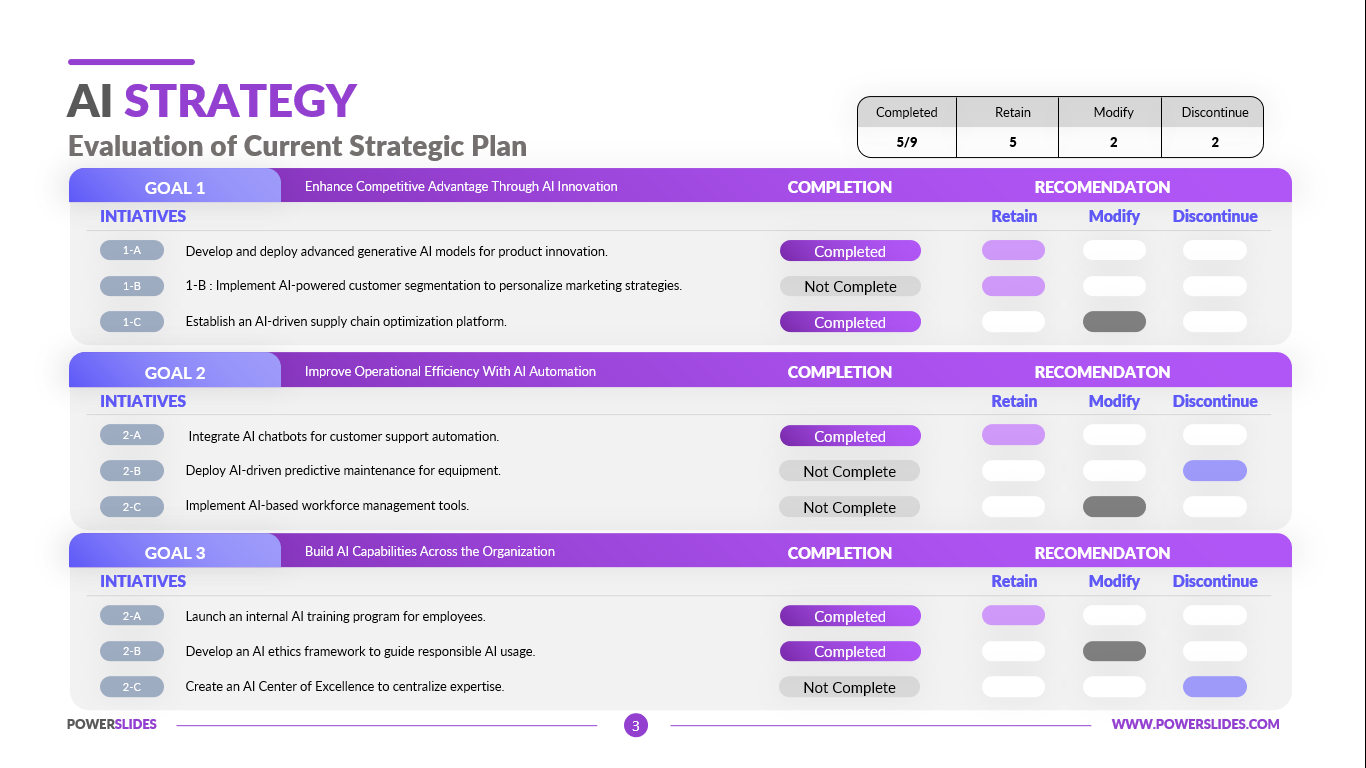
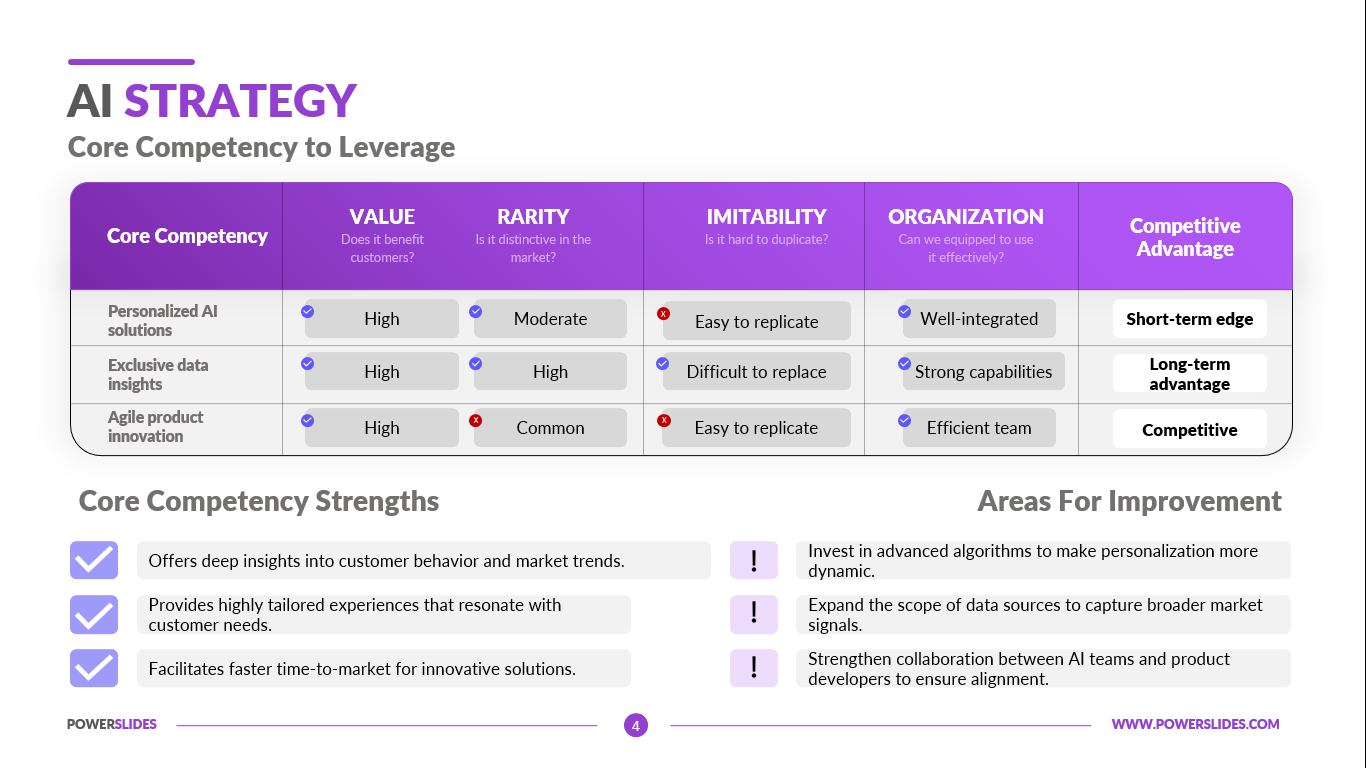
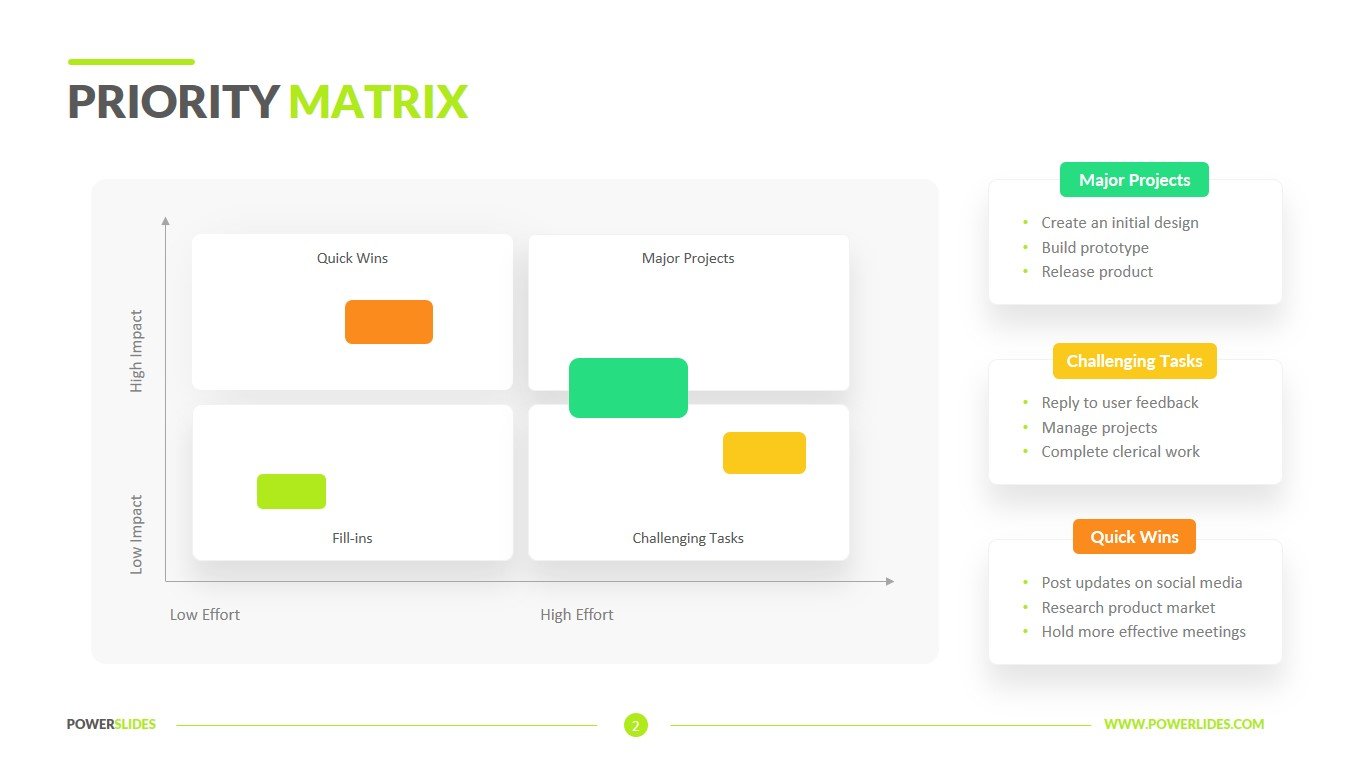
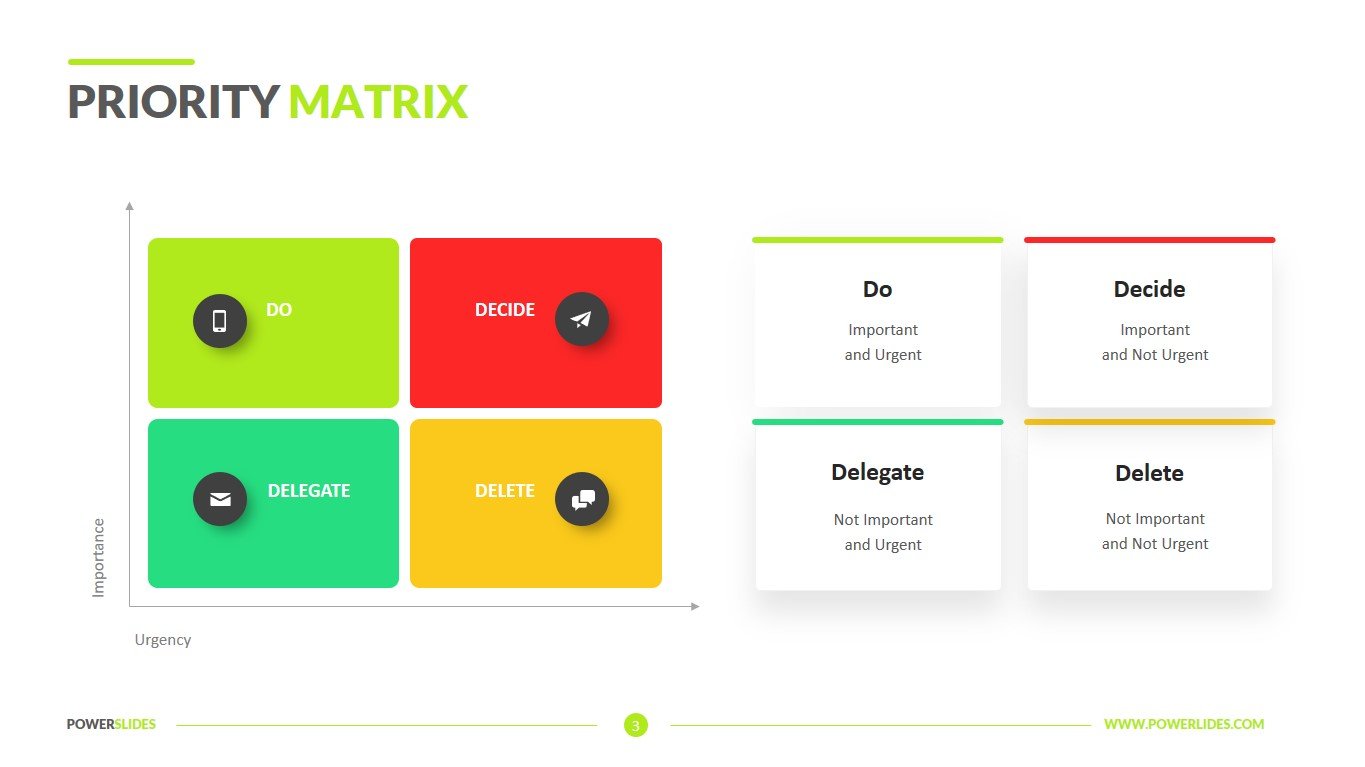
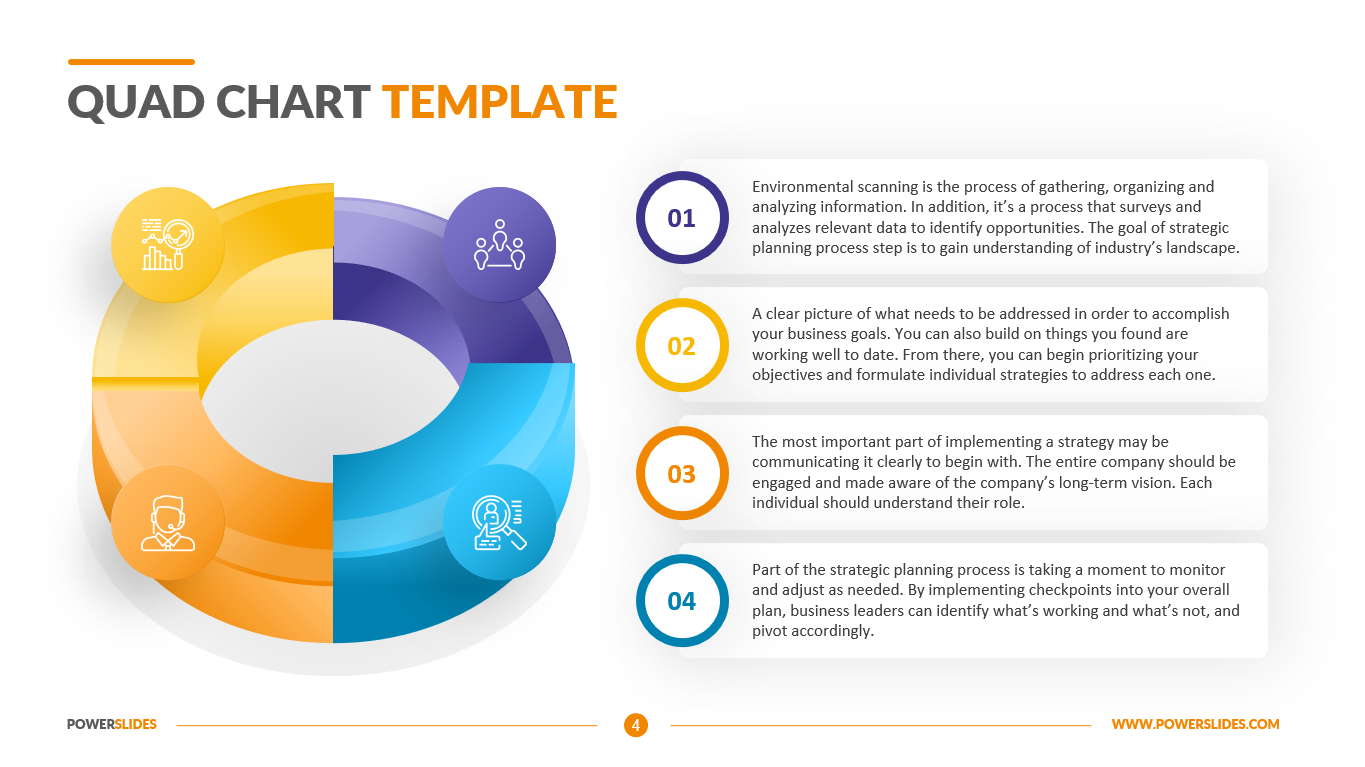
The quad chart presents a brief snapshot of a study across four quadrants of a single PowerPoint slide – thus the name quad. It includes Project Scoping, Stakeholders and Stakeholder Analysis, Desired Outcomes (Critical Success Factors), and measures of Success (Secondary Benefits). The upper left quadrant summarizes science issues, approaches and data used. The upper right quadrant is about the project plans, milestones and progresses. The lower left gives some examples of significant results and findings. The last quadrant shows the relation of your project with other projects and general science community.
Though shorter, quad charts often serve in a similar capacity to white papers and the two documents are often requested alongside one another. Even though the majority of Quad charts at present are defense-focused, you should really consider them as a new tool in your marketing portfolio.
In preparation for a workshop, consider to customise your Quad chart with specifics that you might be discussed at the event. Review the event agenda and include some relevant buzzwords.
Project managers can use the slides in this template as they prepare to meet with their team. You can present in detail the main stages of a new project, indicate strengths and weaknesses, describe the stages and methods of control.
Also, this template can be used by CEOs of startups in preparation for meeting with investors. Team leaders can use the slides in this template as they prepare for their weekly sprints with team members.
Financiers and economists can use this template when preparing analytical reports. Occupational safety professionals can use this template when preparing instructions with repetitive processes to monitor equipment availability.
Marketers can use this template when preparing their new product-to-market marketing strategy. University teachers and business coaches can use this template when preparing their courses and webinars.
Quad Chart Template will be useful for marketers, analysts and startup executives. All slides in this template have all the tools you need to build a professional presentation. You can customize colors, block sizes and infographics yourself. Quad Chart Template will be a worthy addition to your collection of professional presentations.


