Perceptual Map
What do you think of this template?

 (1.00/ 5)
1 ratings

 4 Slides
 File size: 16:9
 Fonts: Lato, Calibri
 Supported version
PPT 2010, PPT 2013, PPT 2016
Supported version
PPT 2010, PPT 2013, PPT 2016

Product details
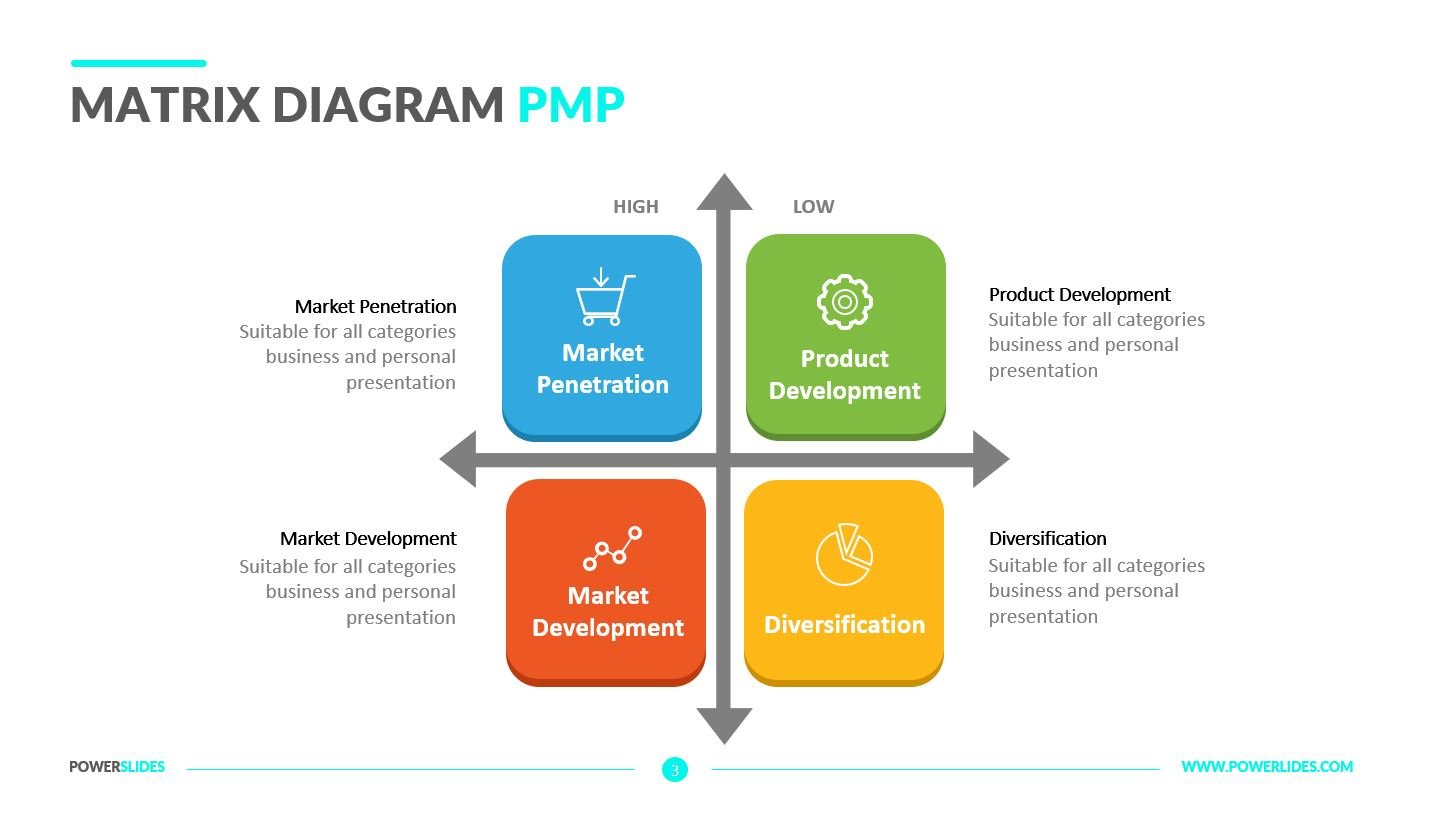
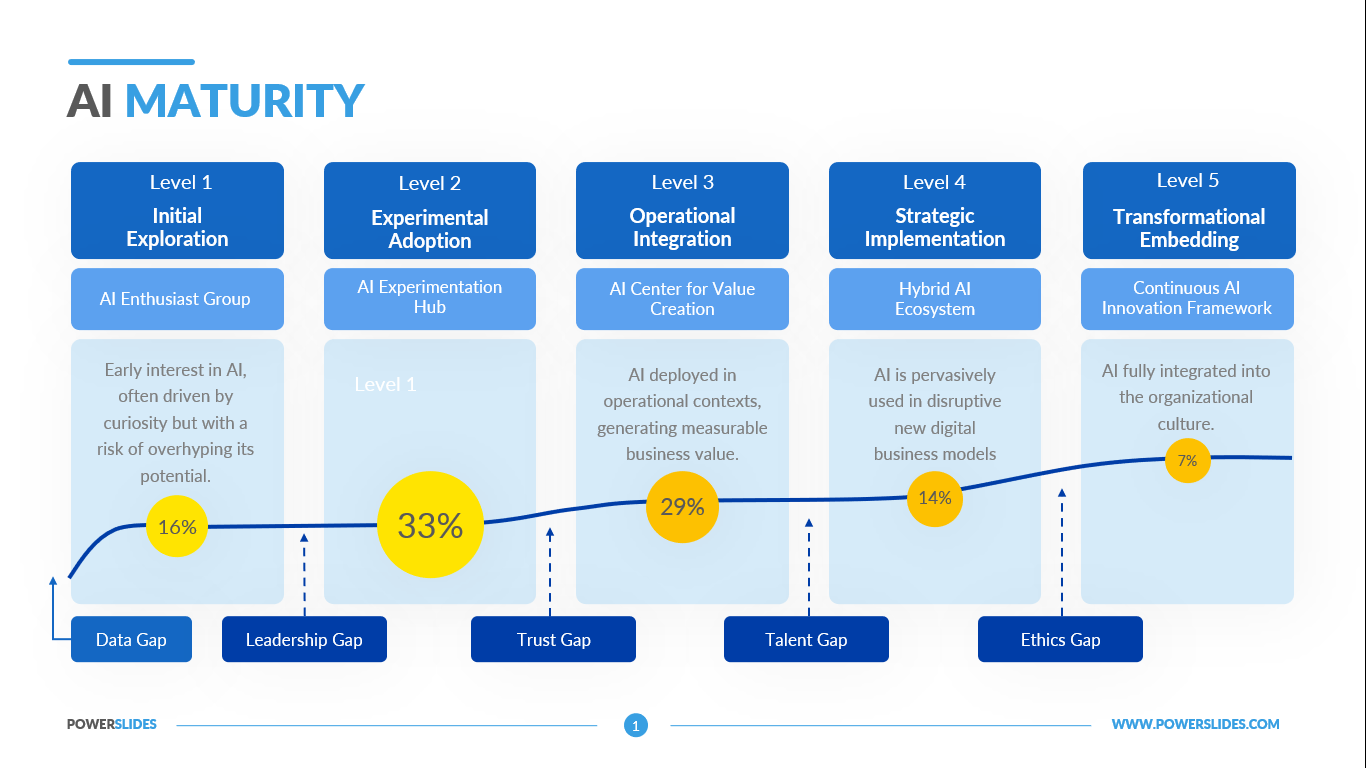
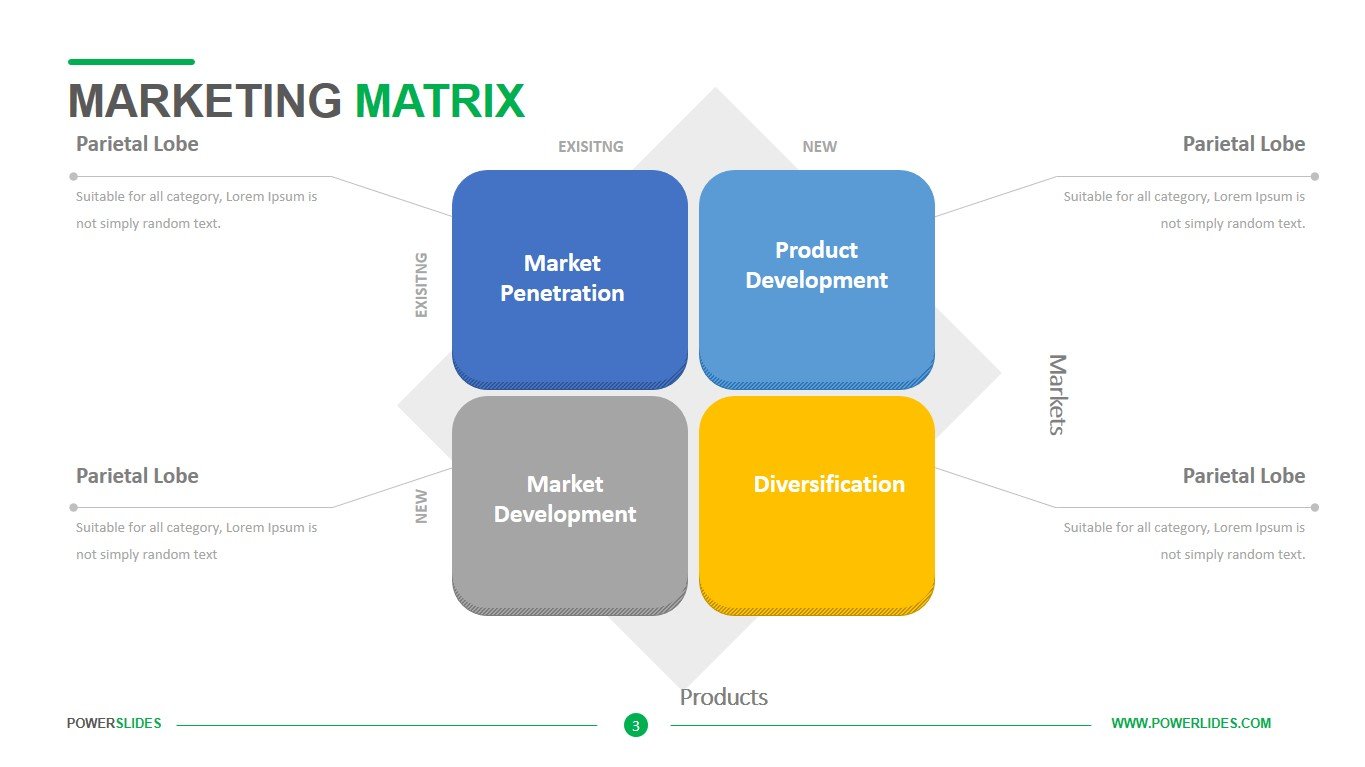
A positioning map or, more precisely, a perception map is a convenient way to visualize the target audience’s understanding of the key attributes of market products. In marketing, a positioning map is used to visualize how the average consumer perceives the positioning of competing products. And also, in order, knowing the actual state of affairs, formulate the correct vector of positioning development and draw up an action plan to achieve the target positioning of the product.
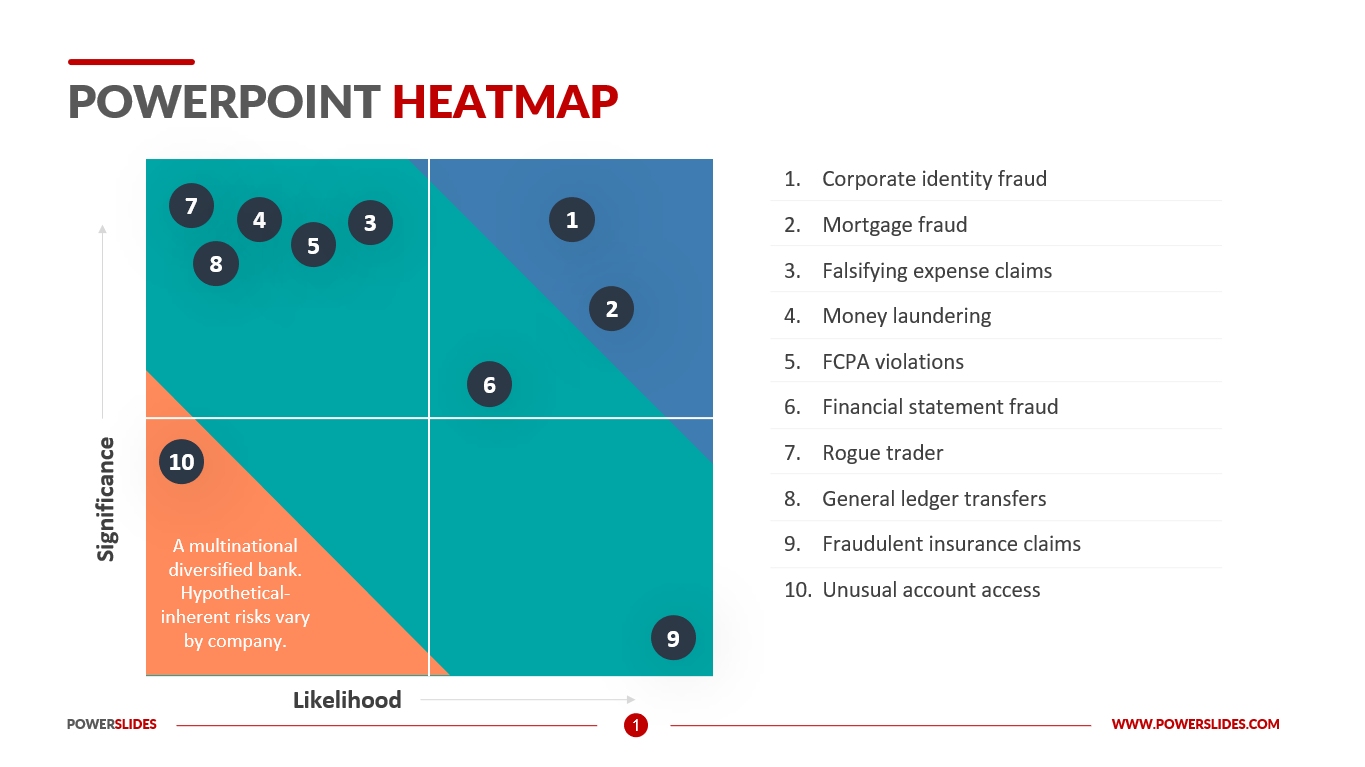
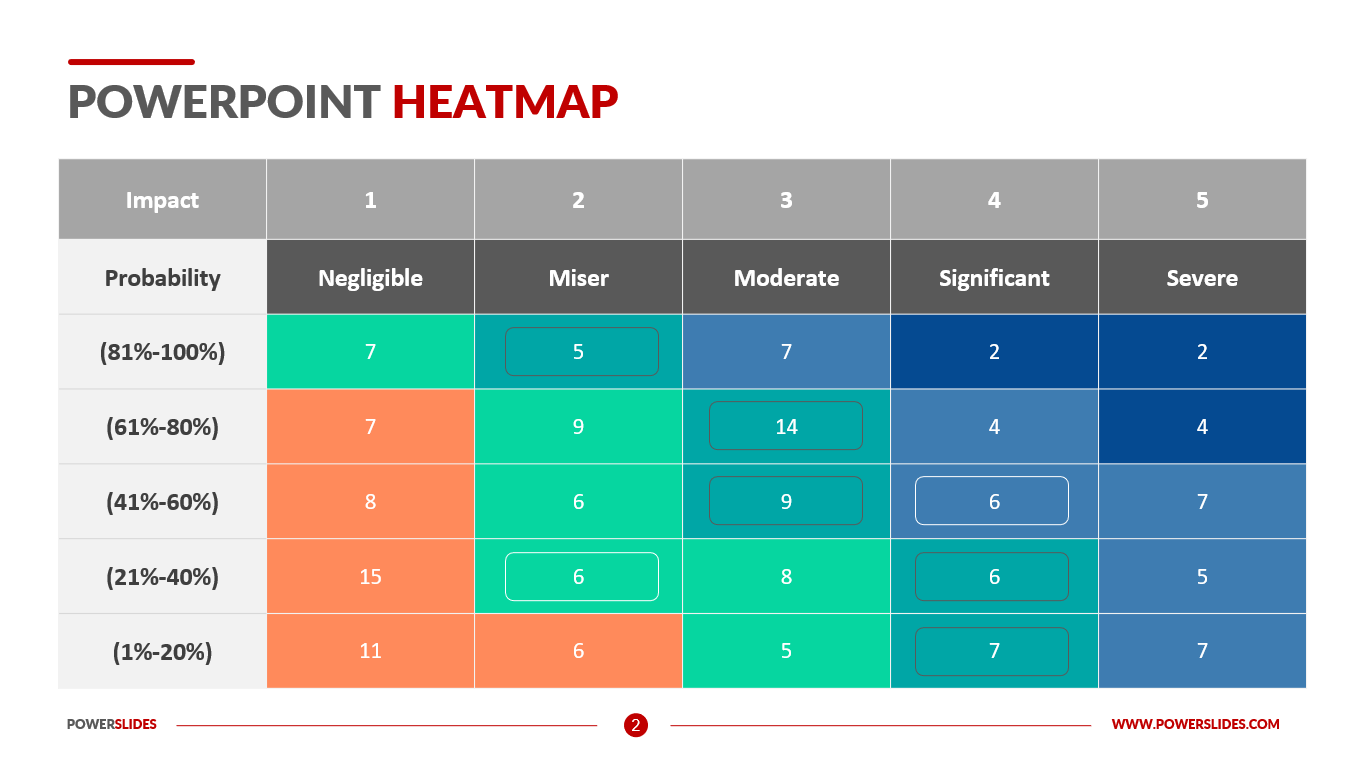
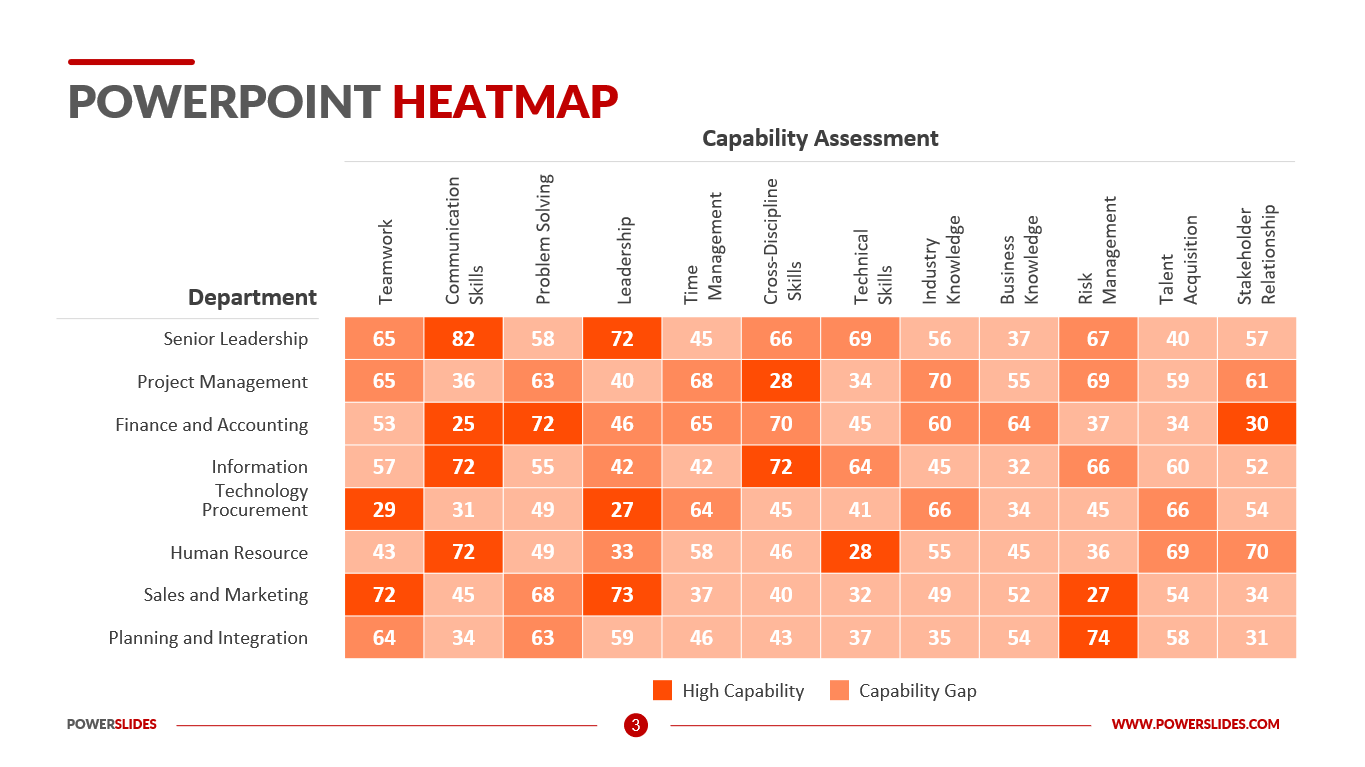
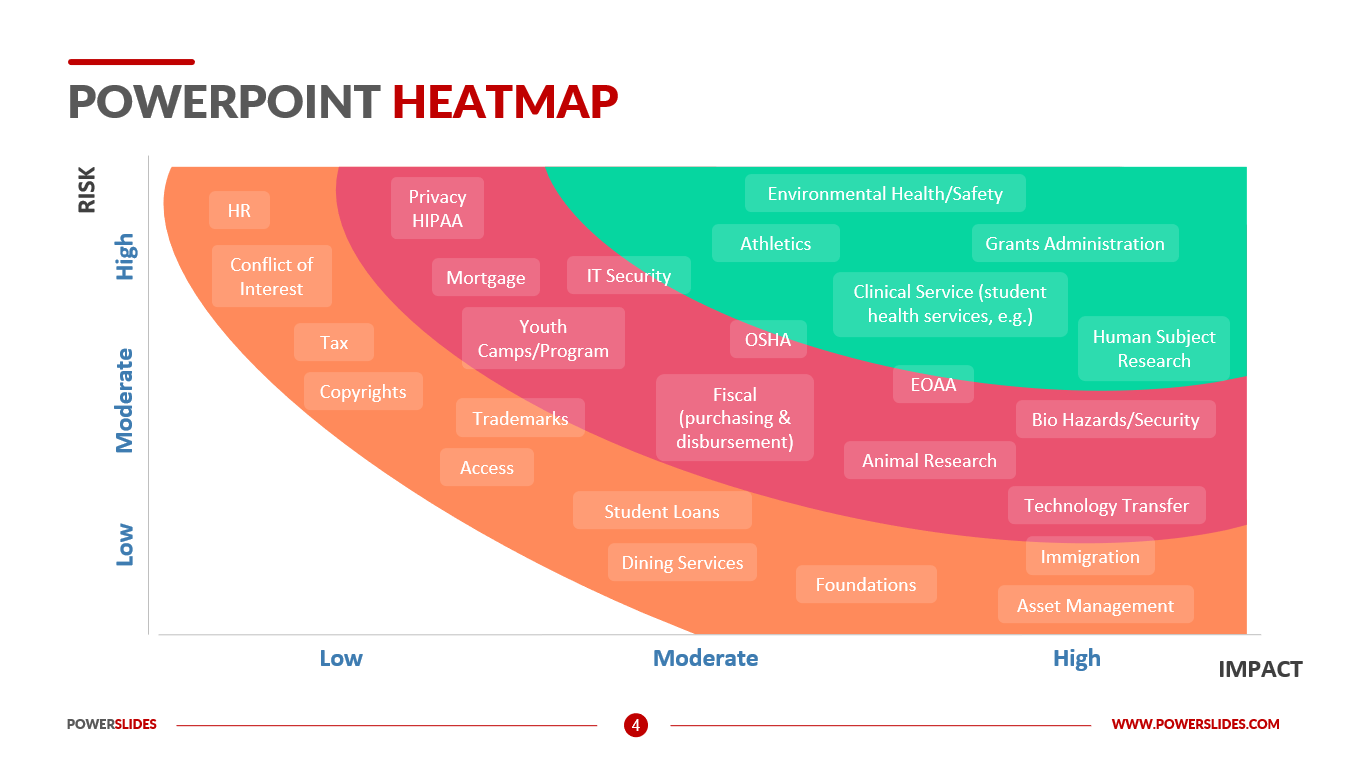
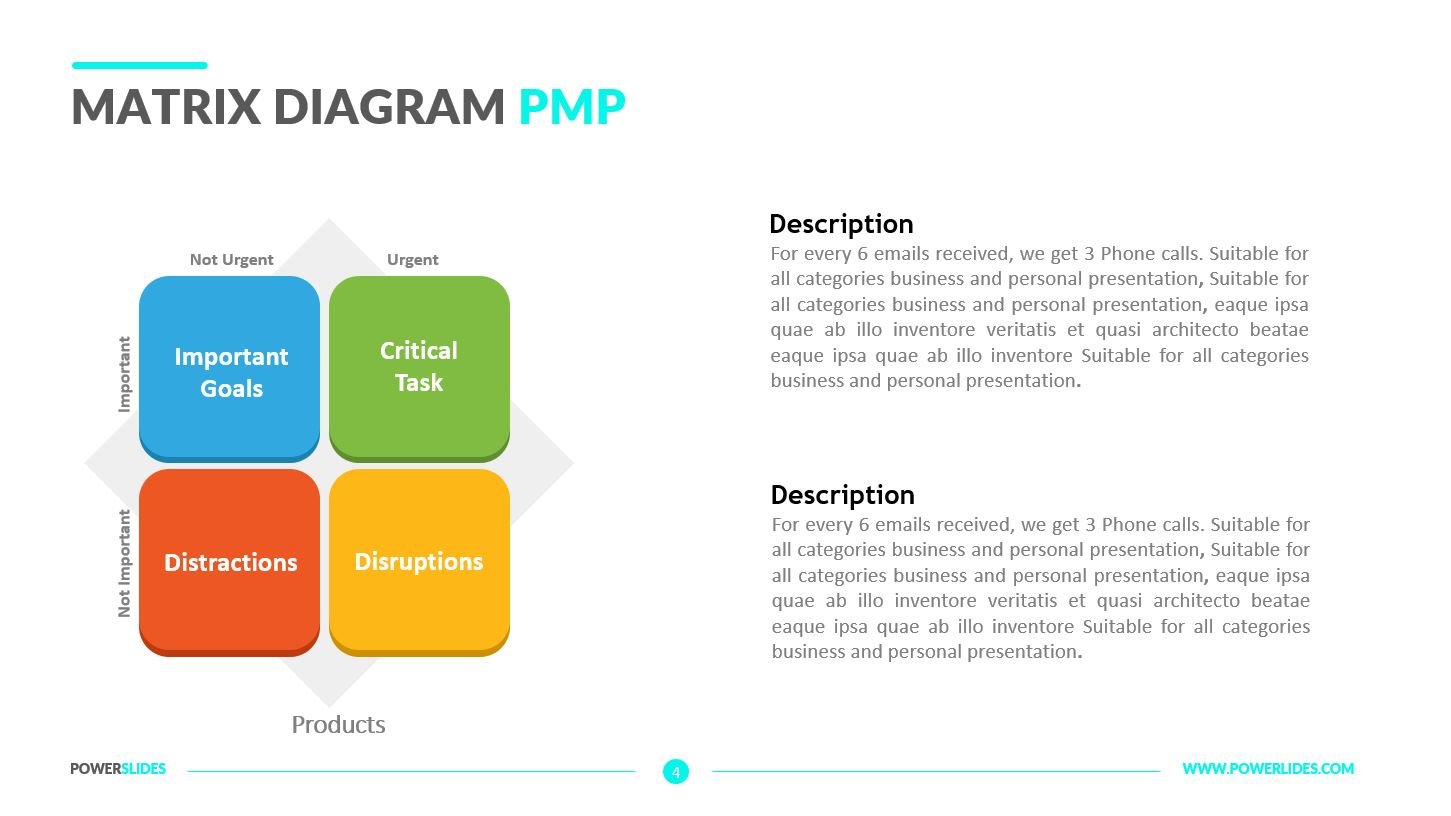
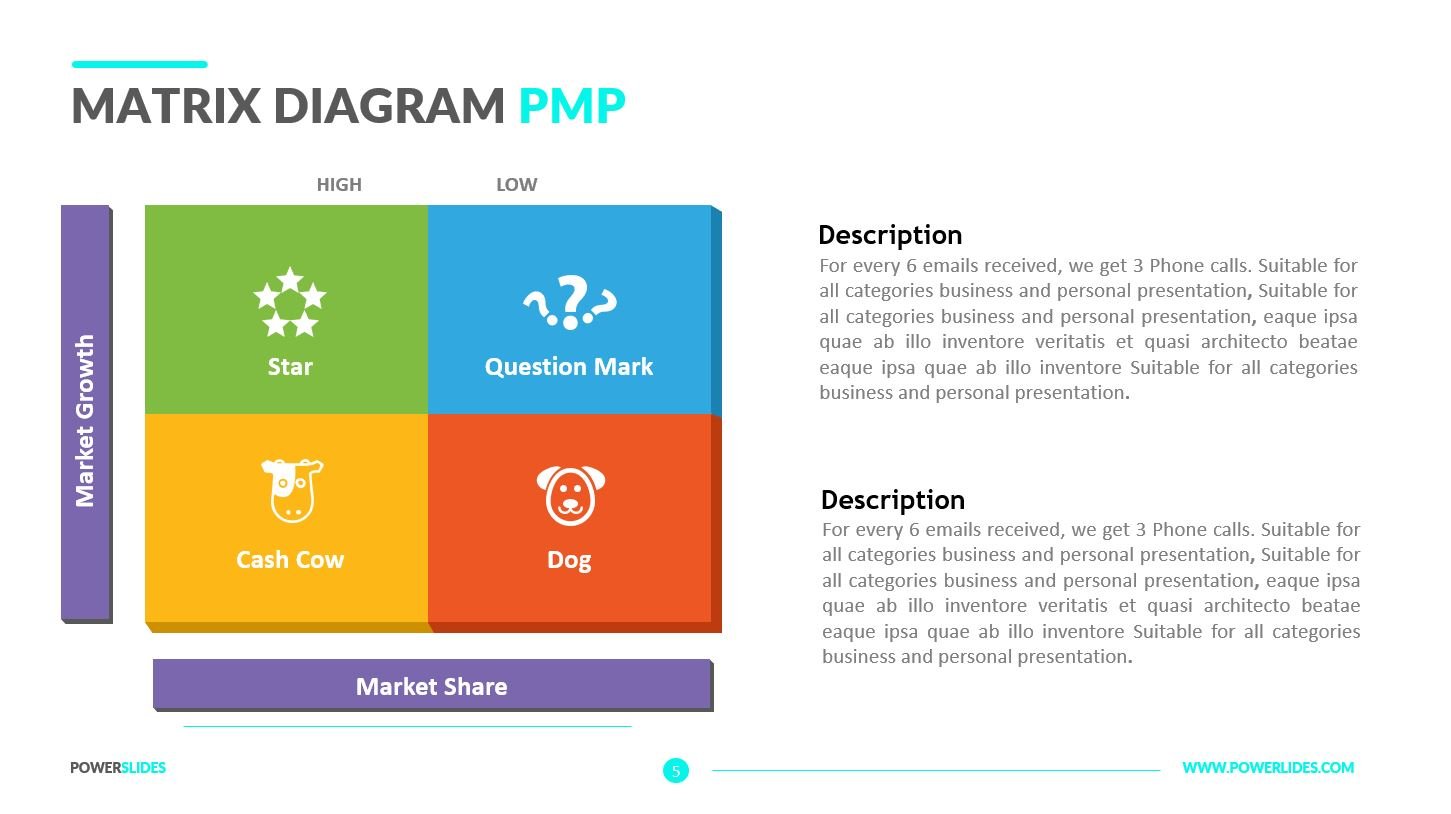
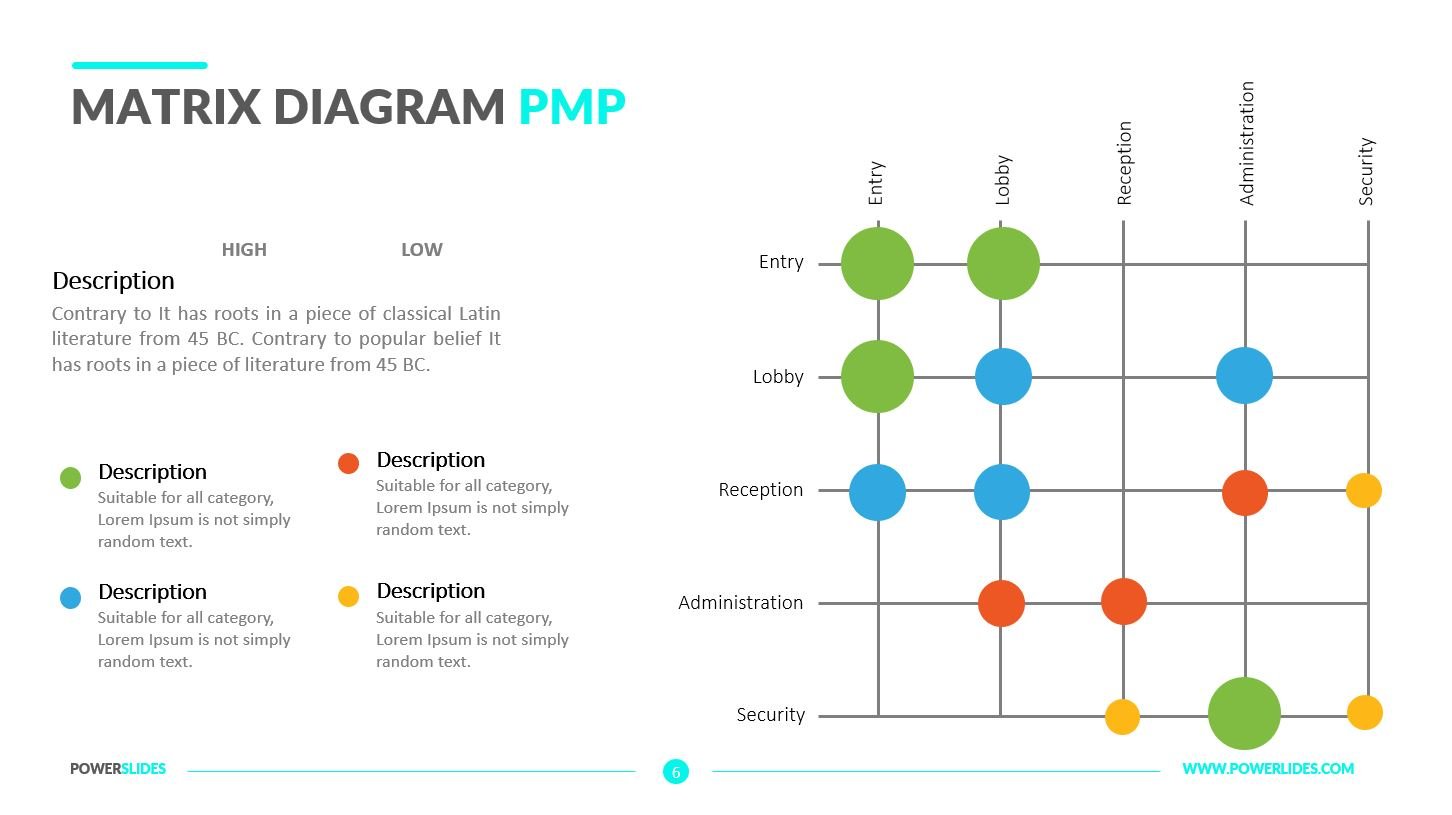
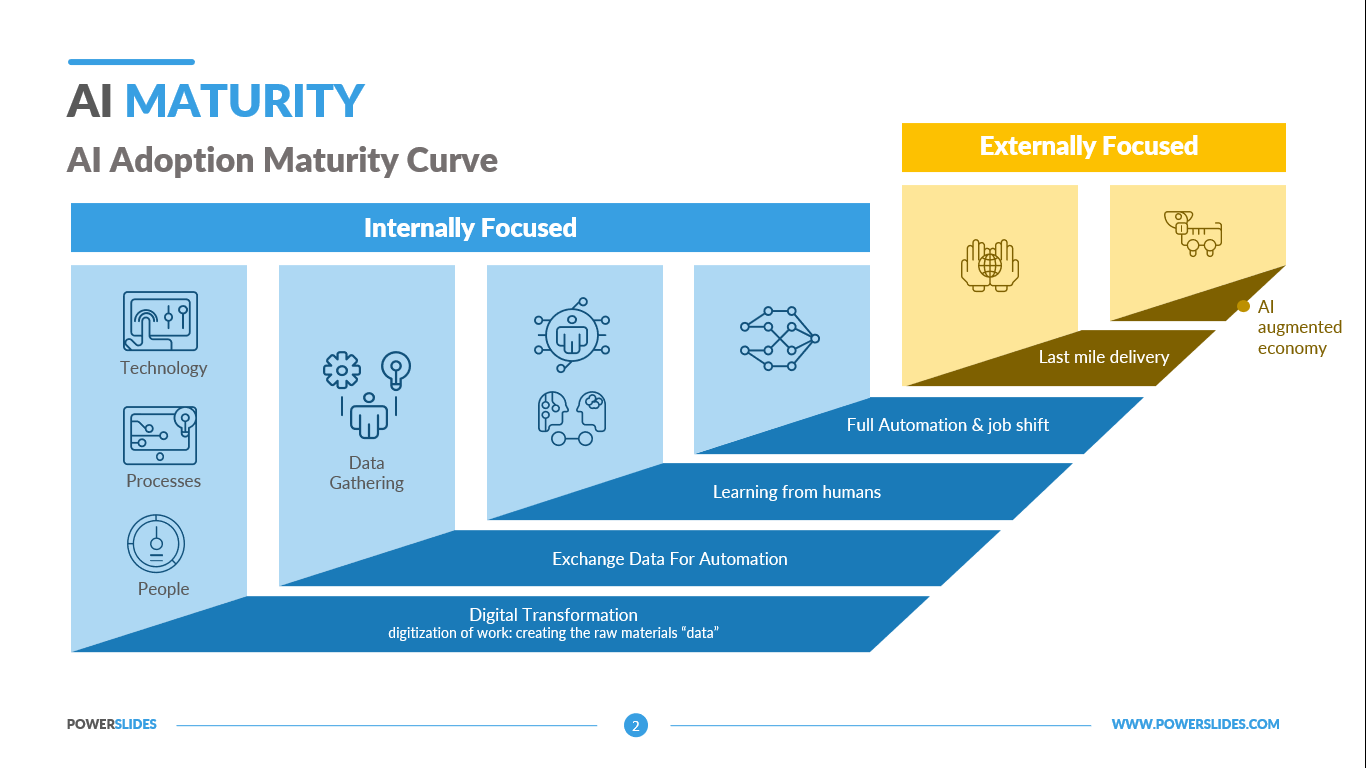
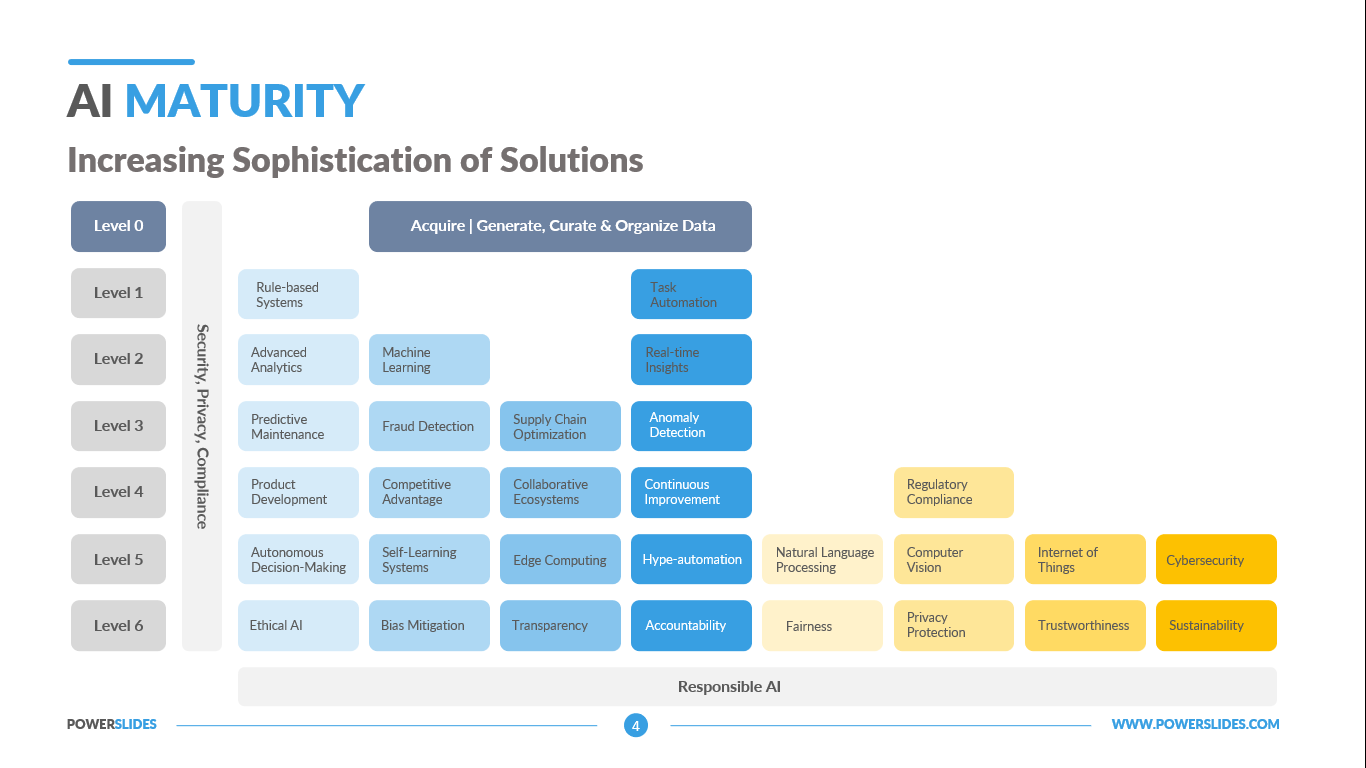
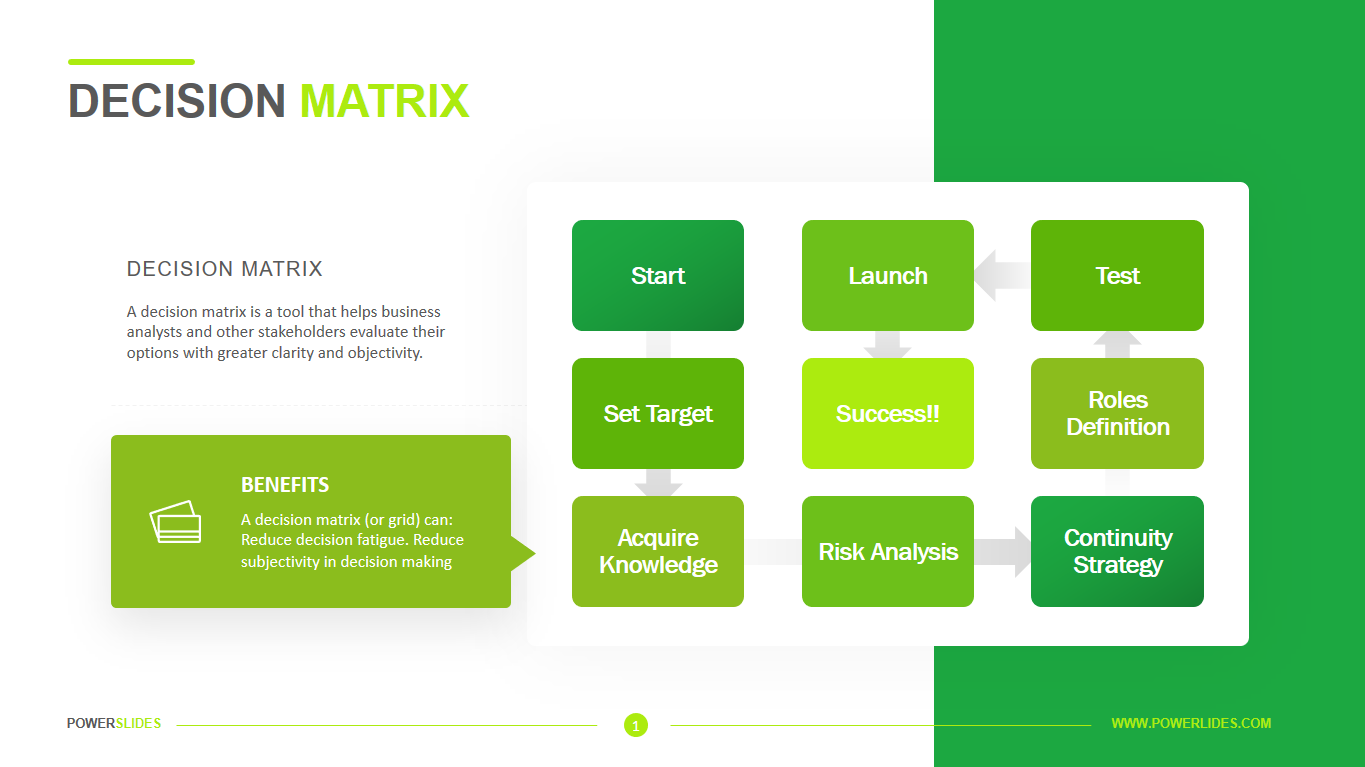
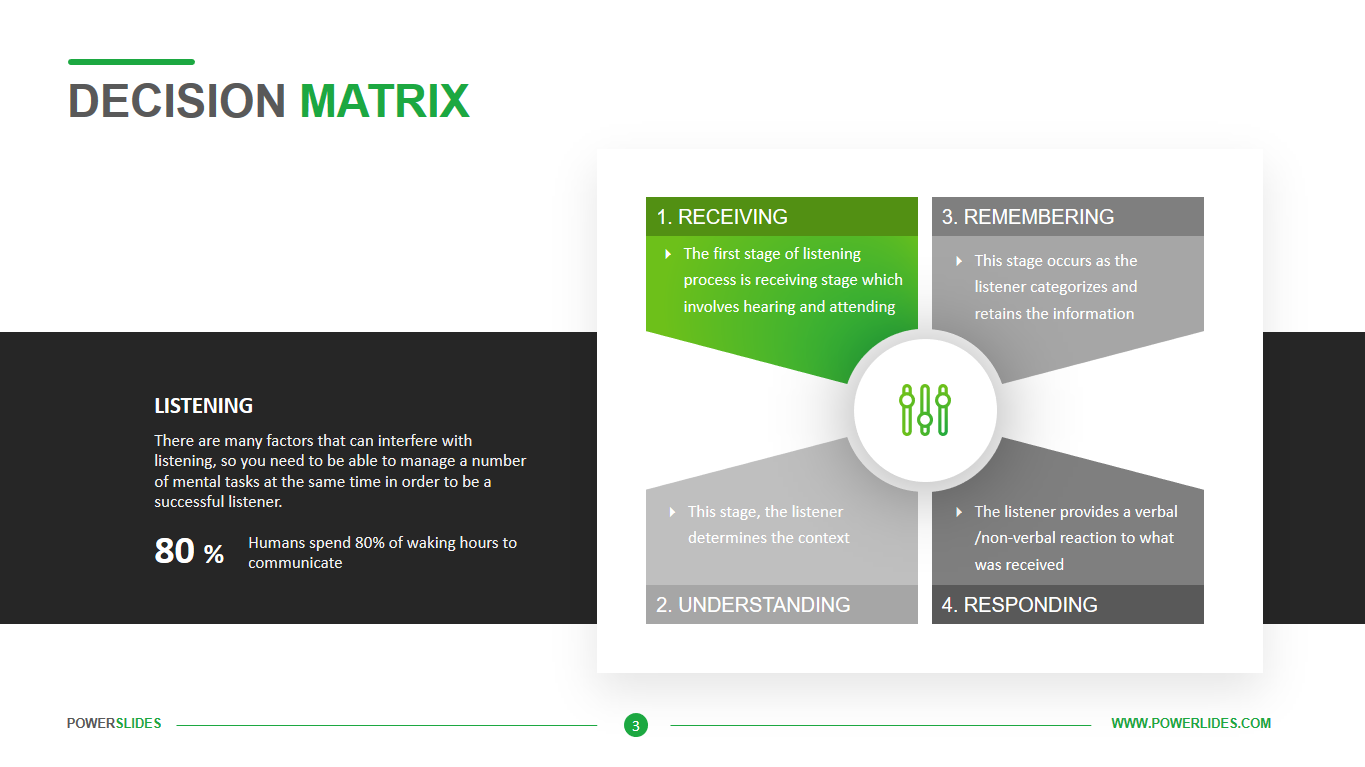
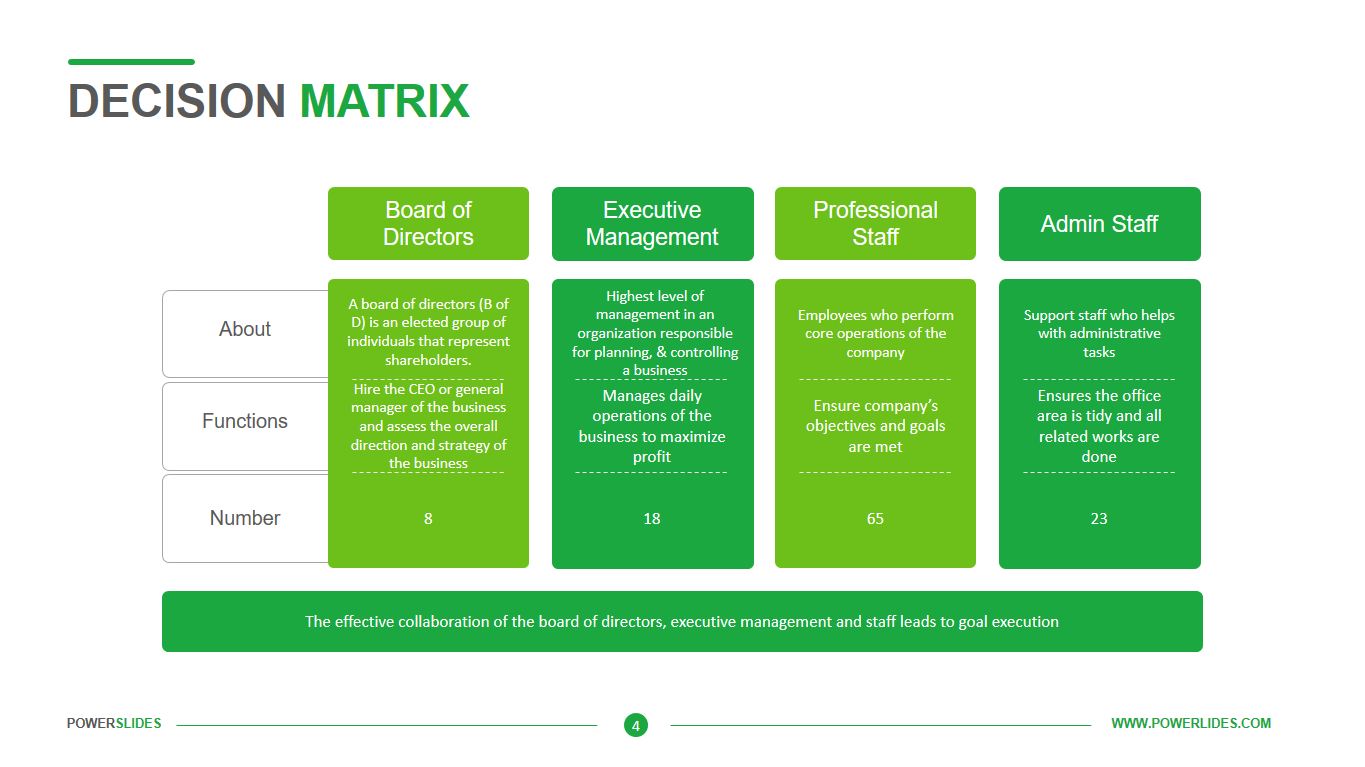
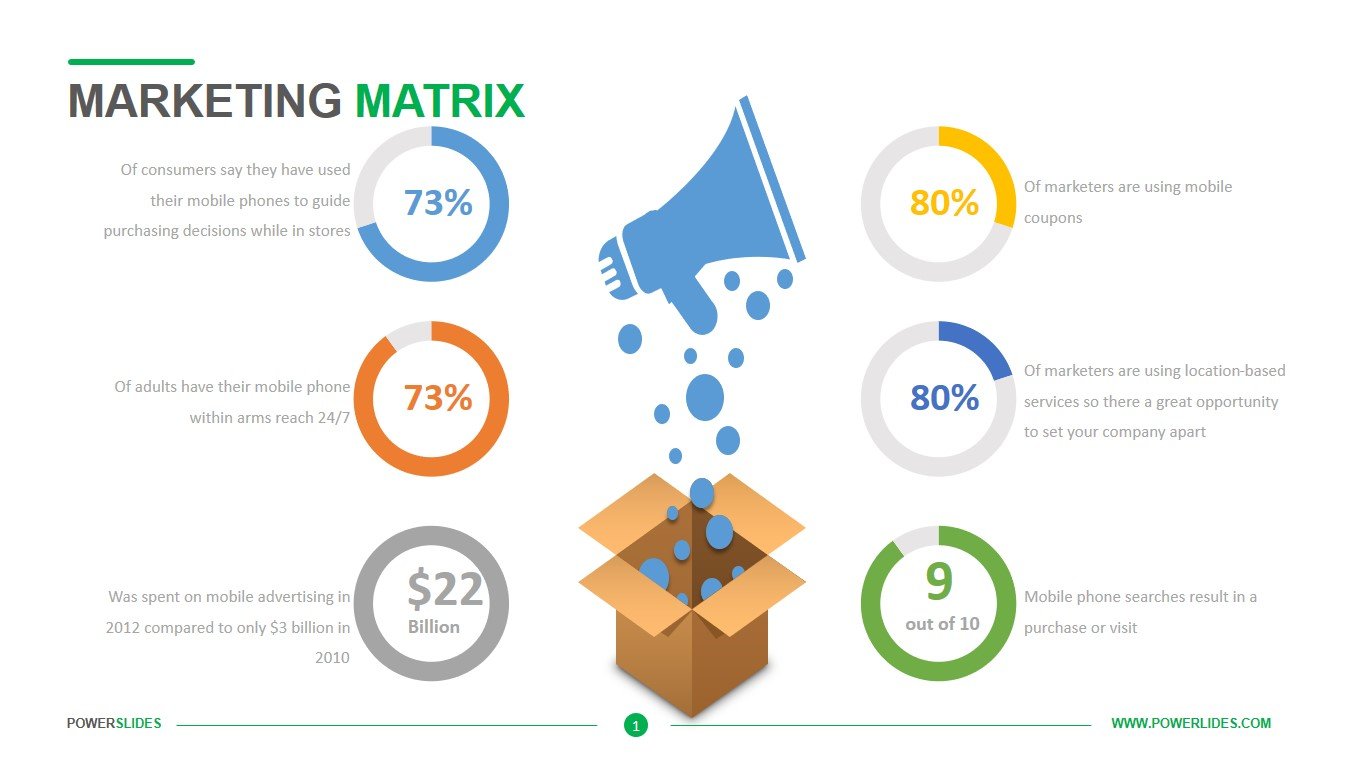
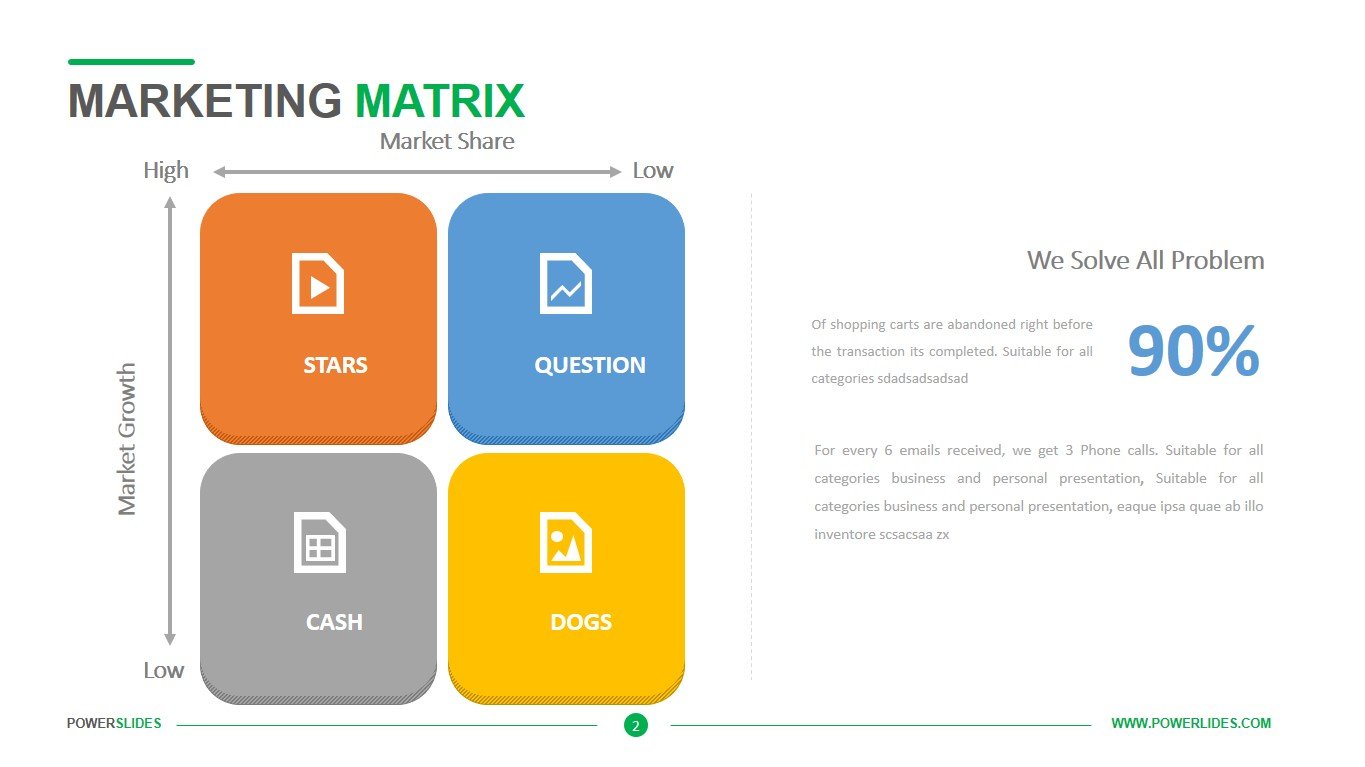
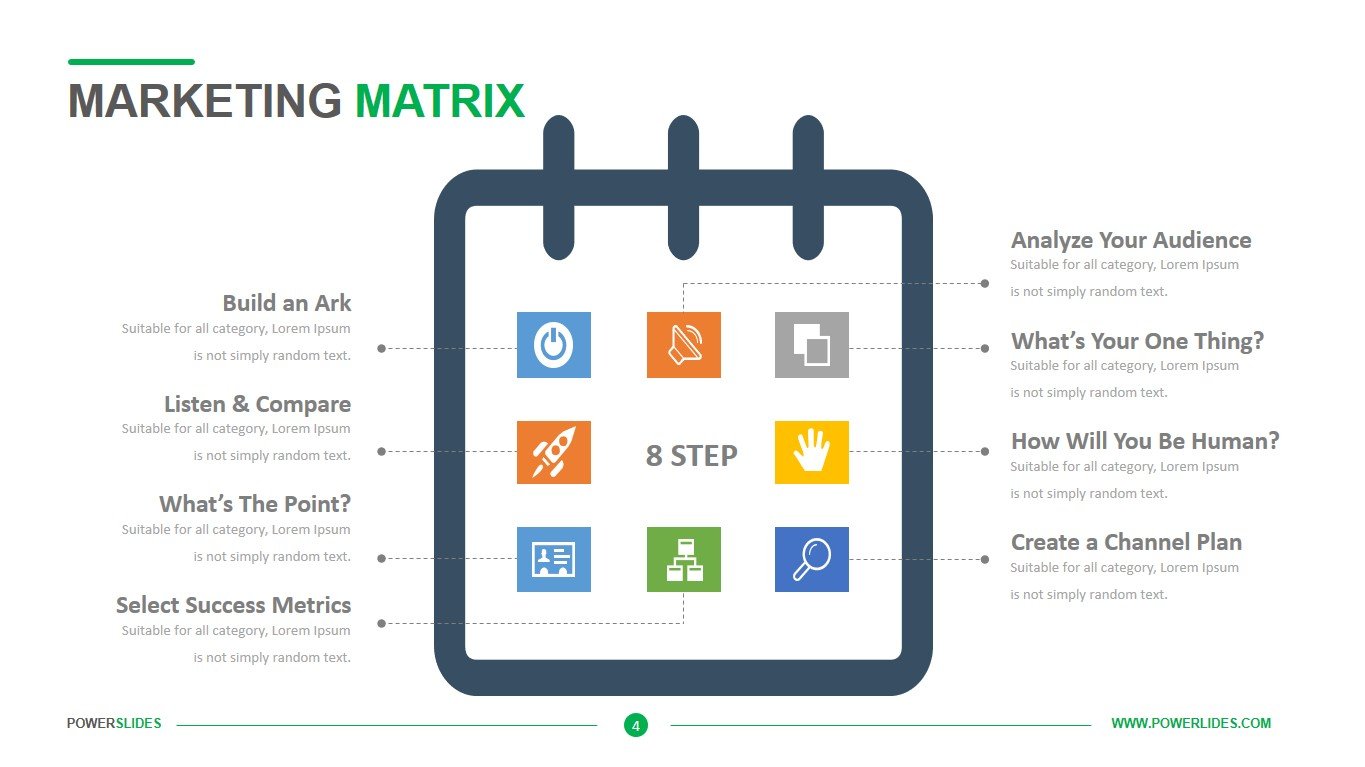
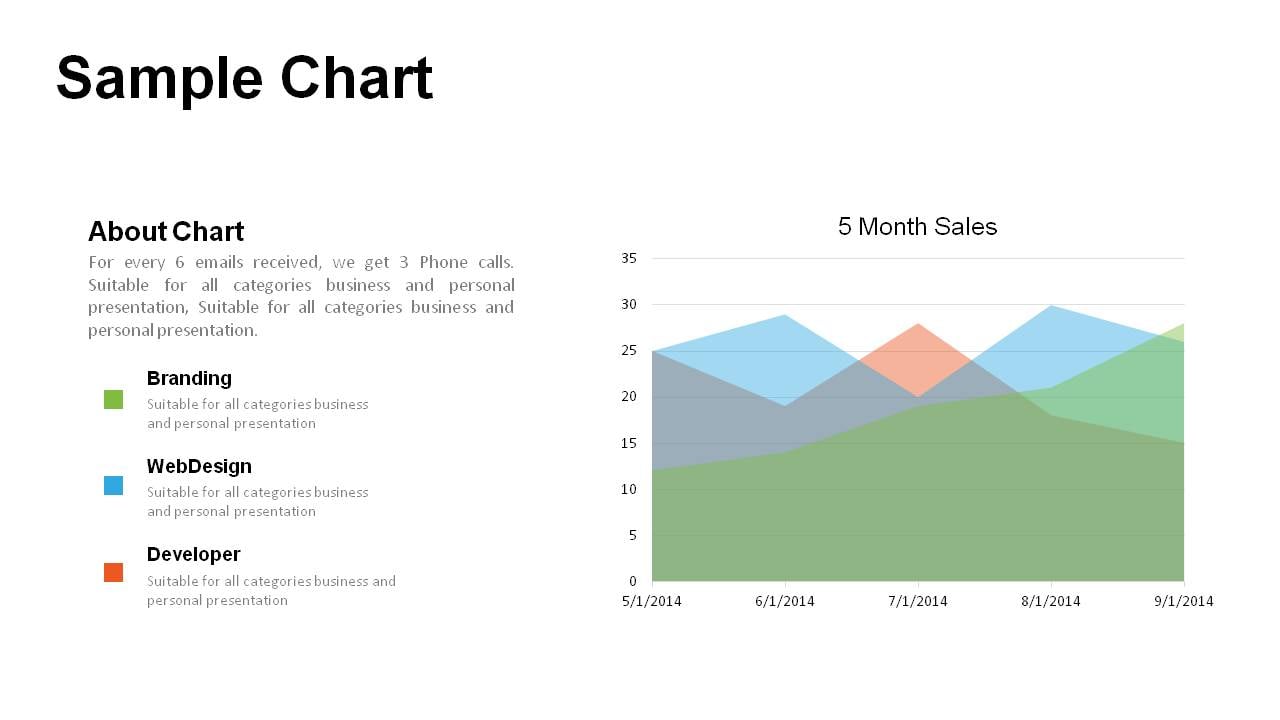
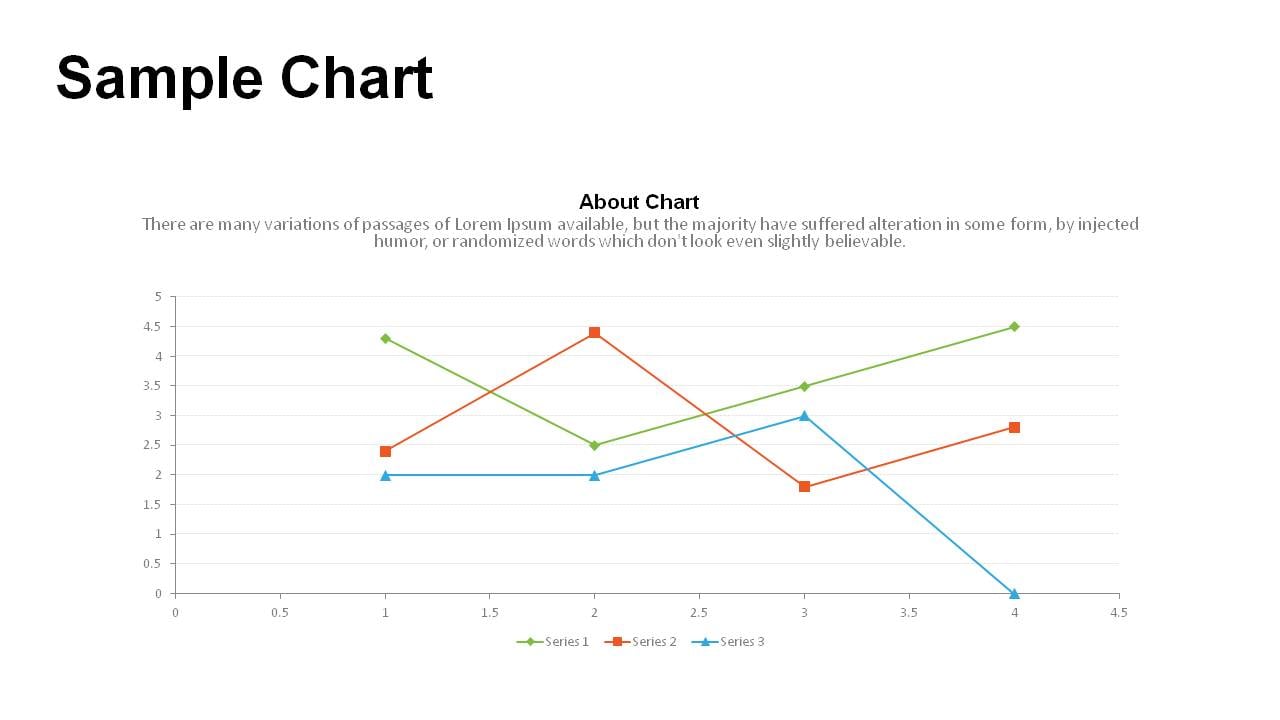
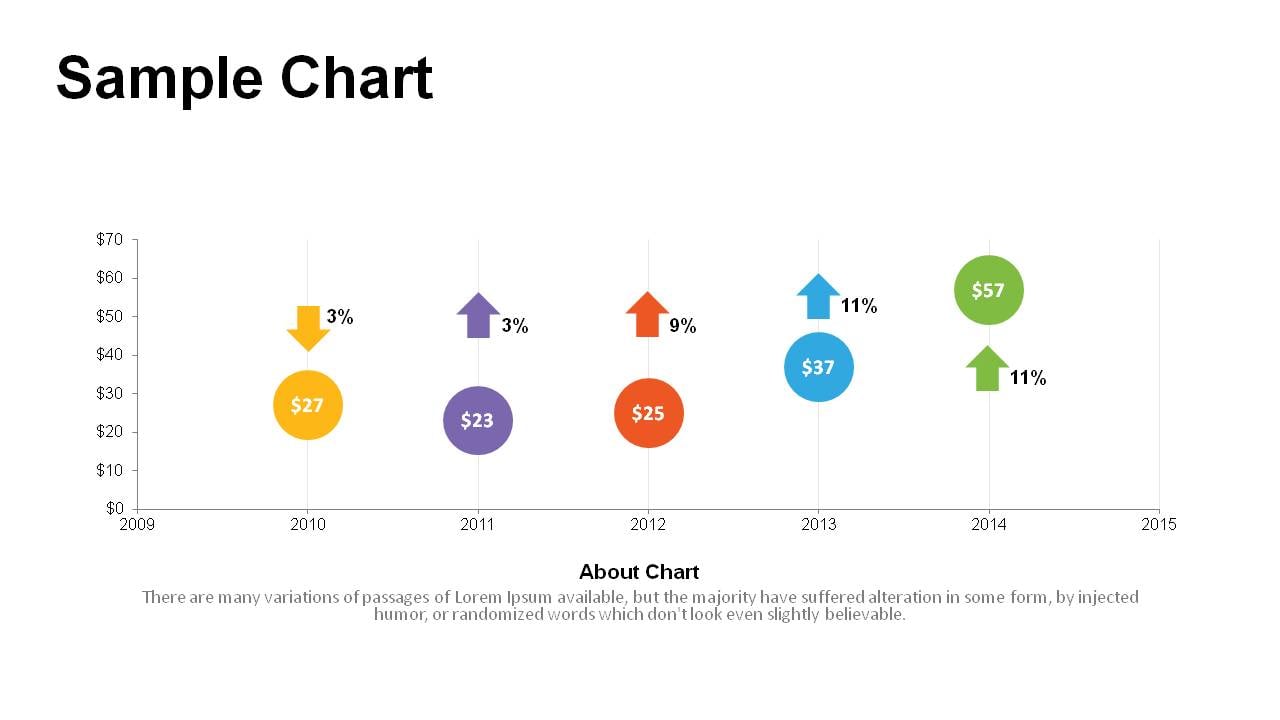
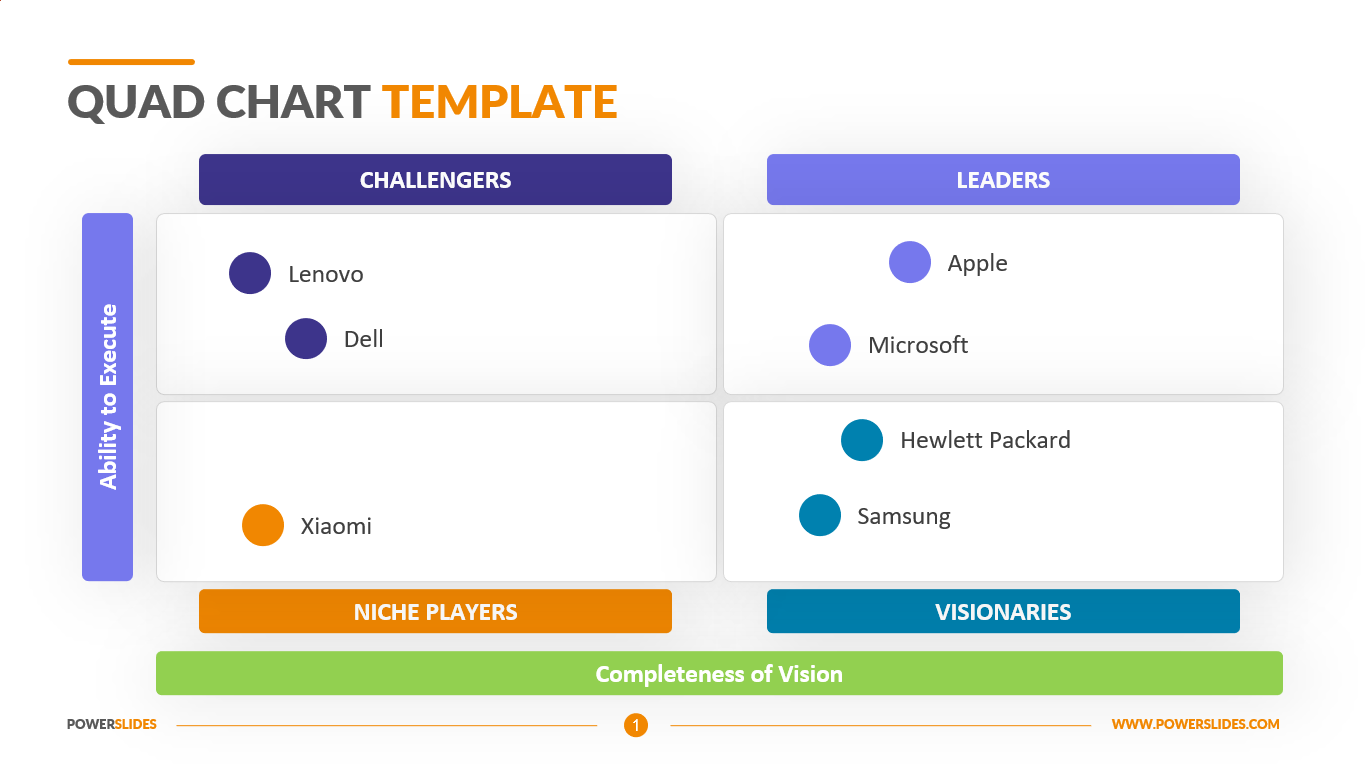
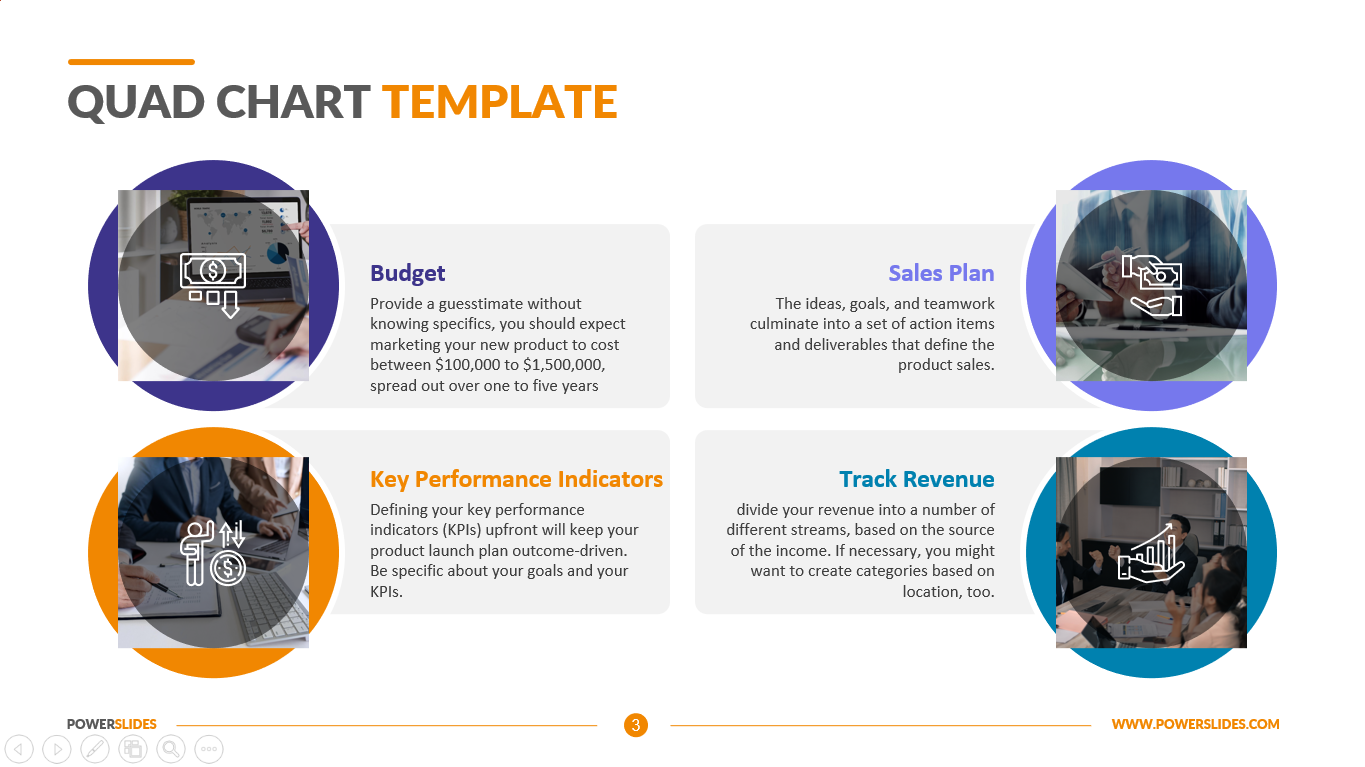
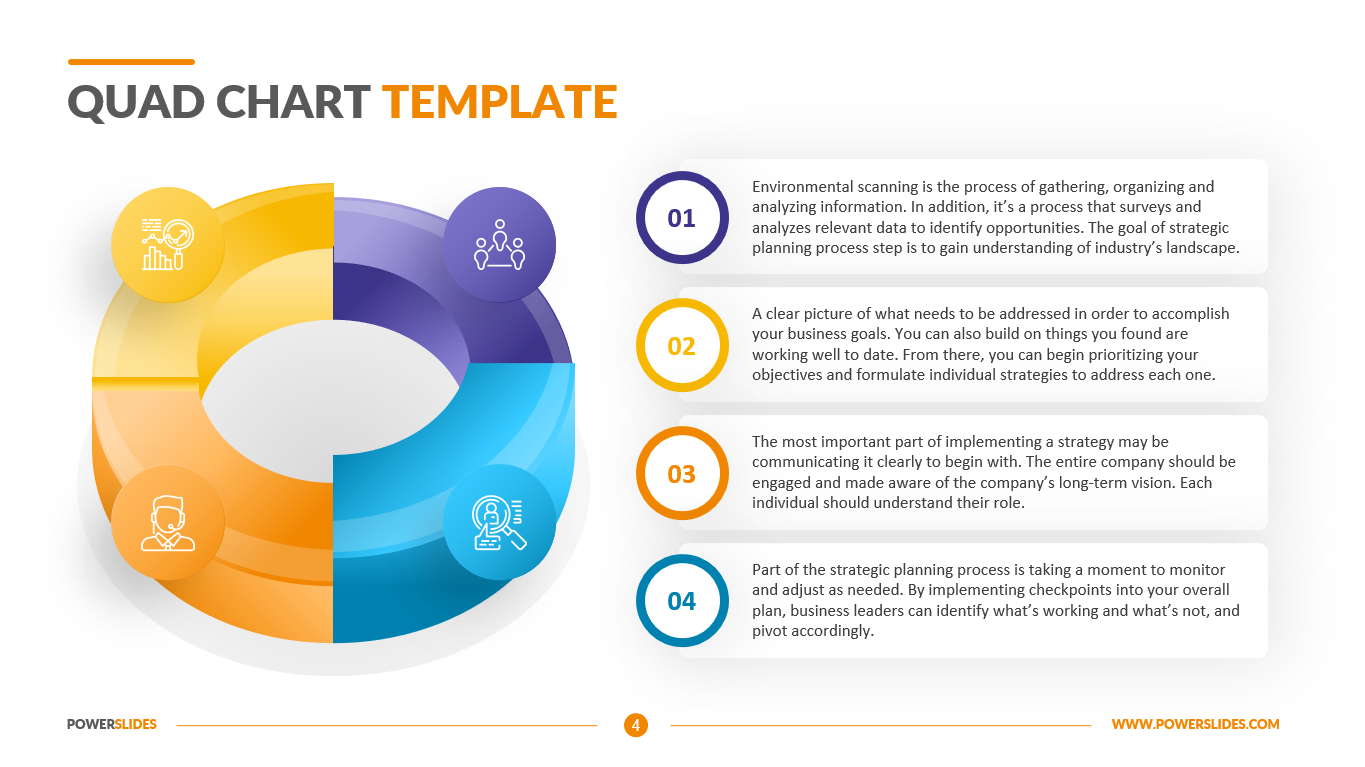
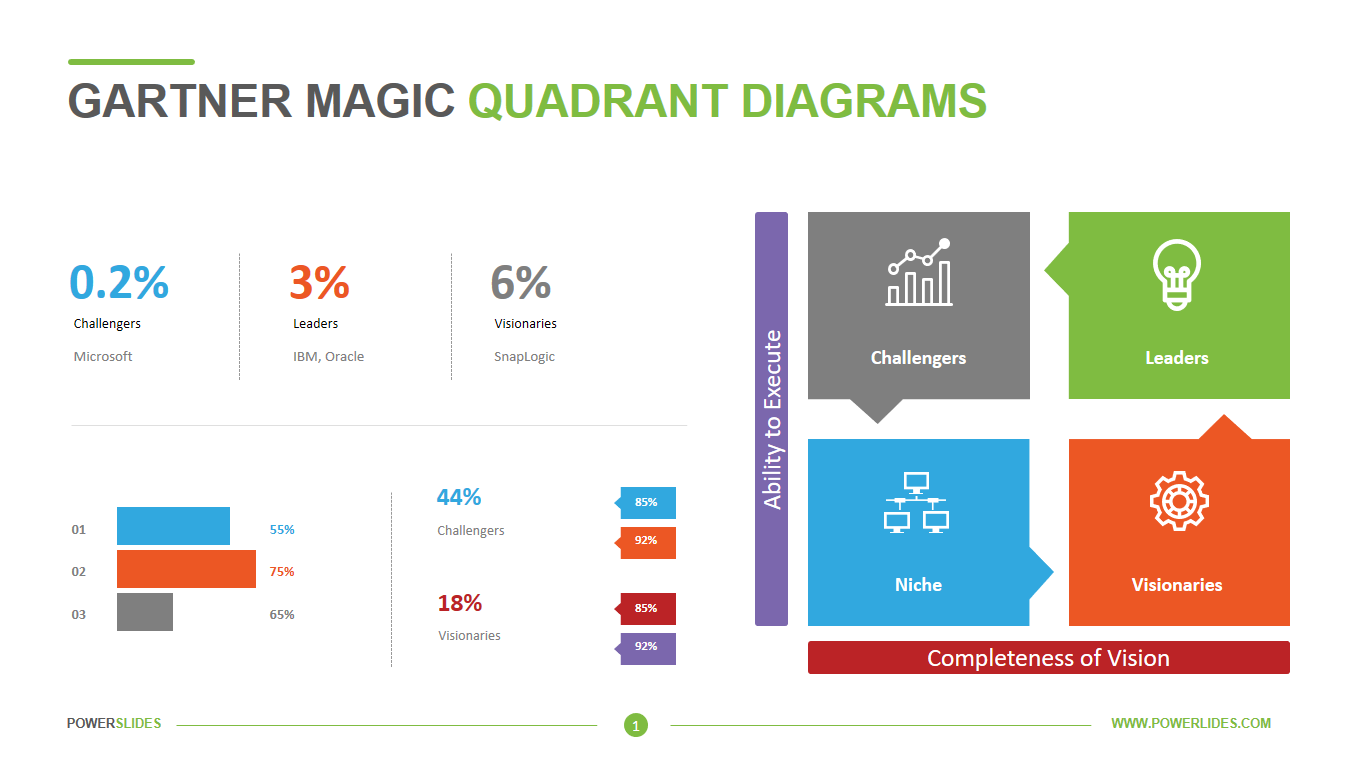
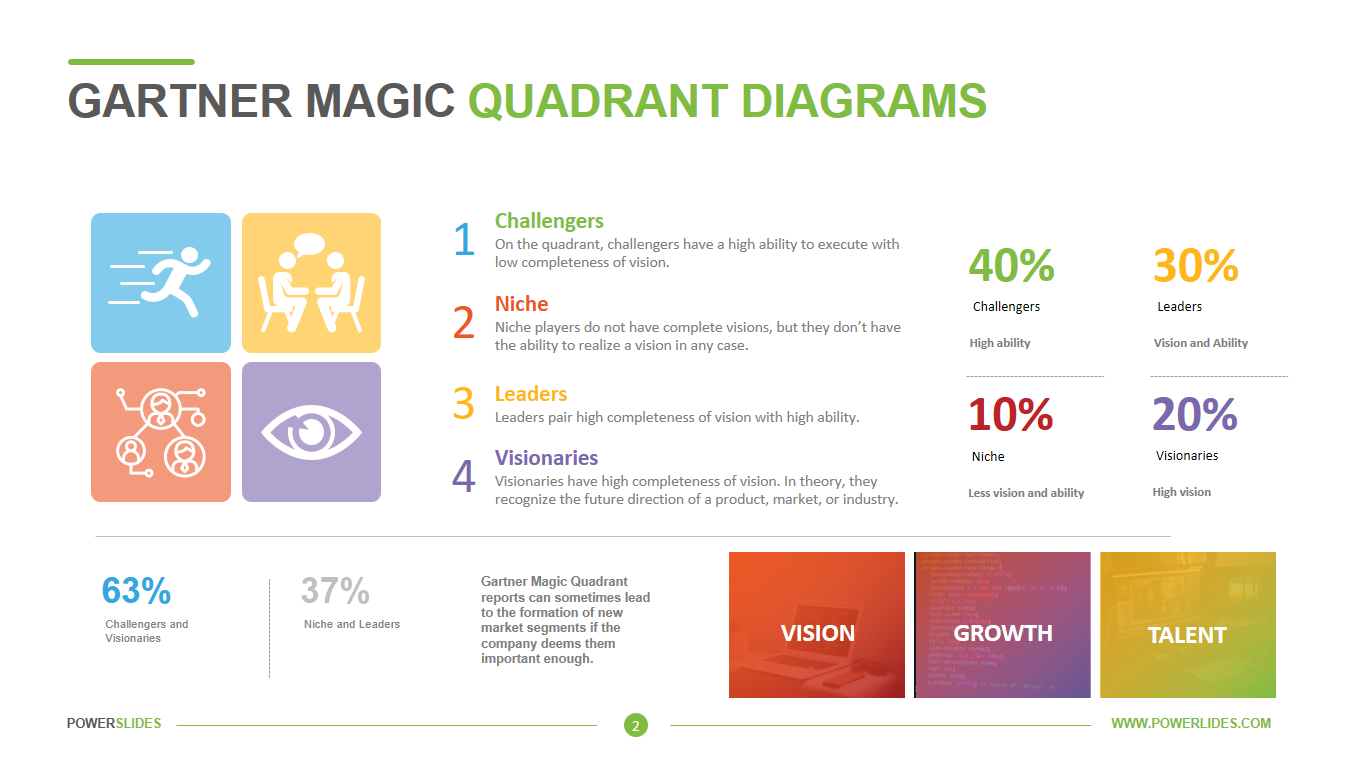
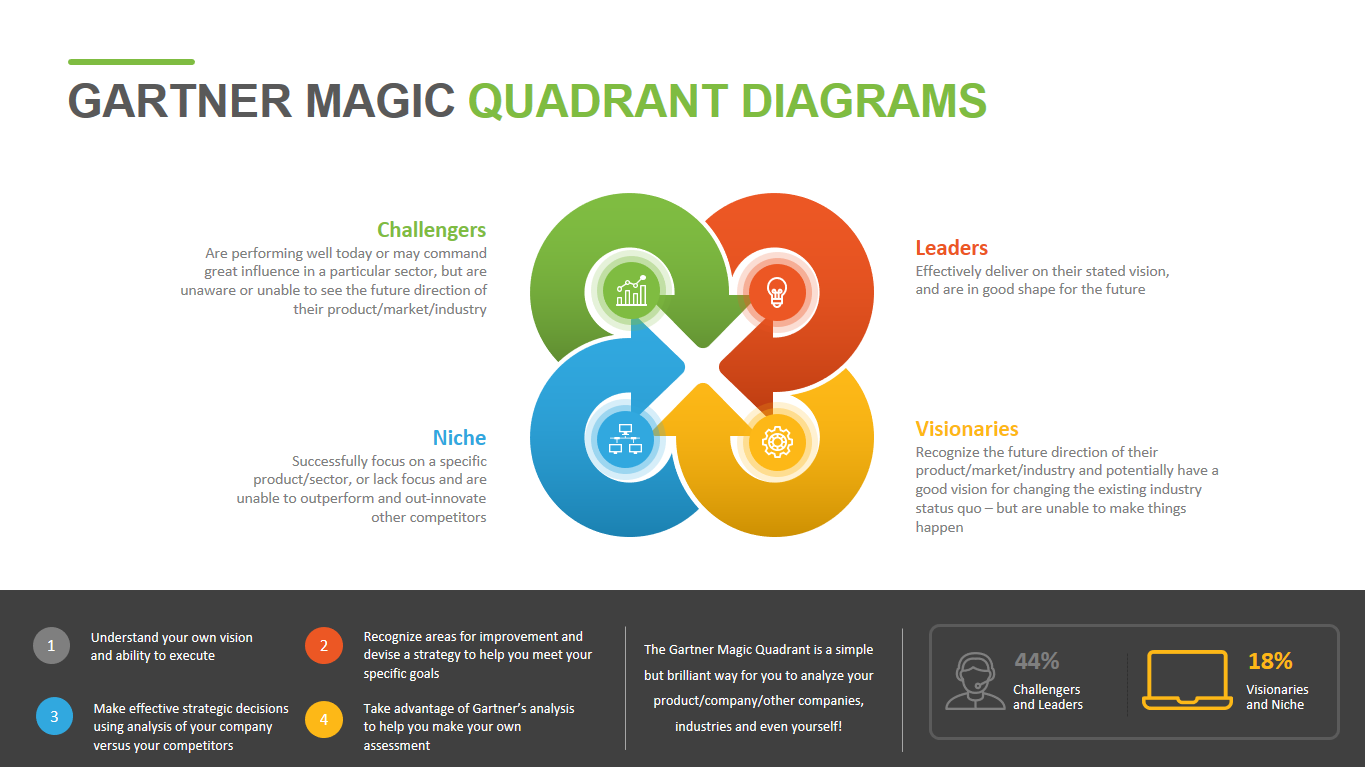
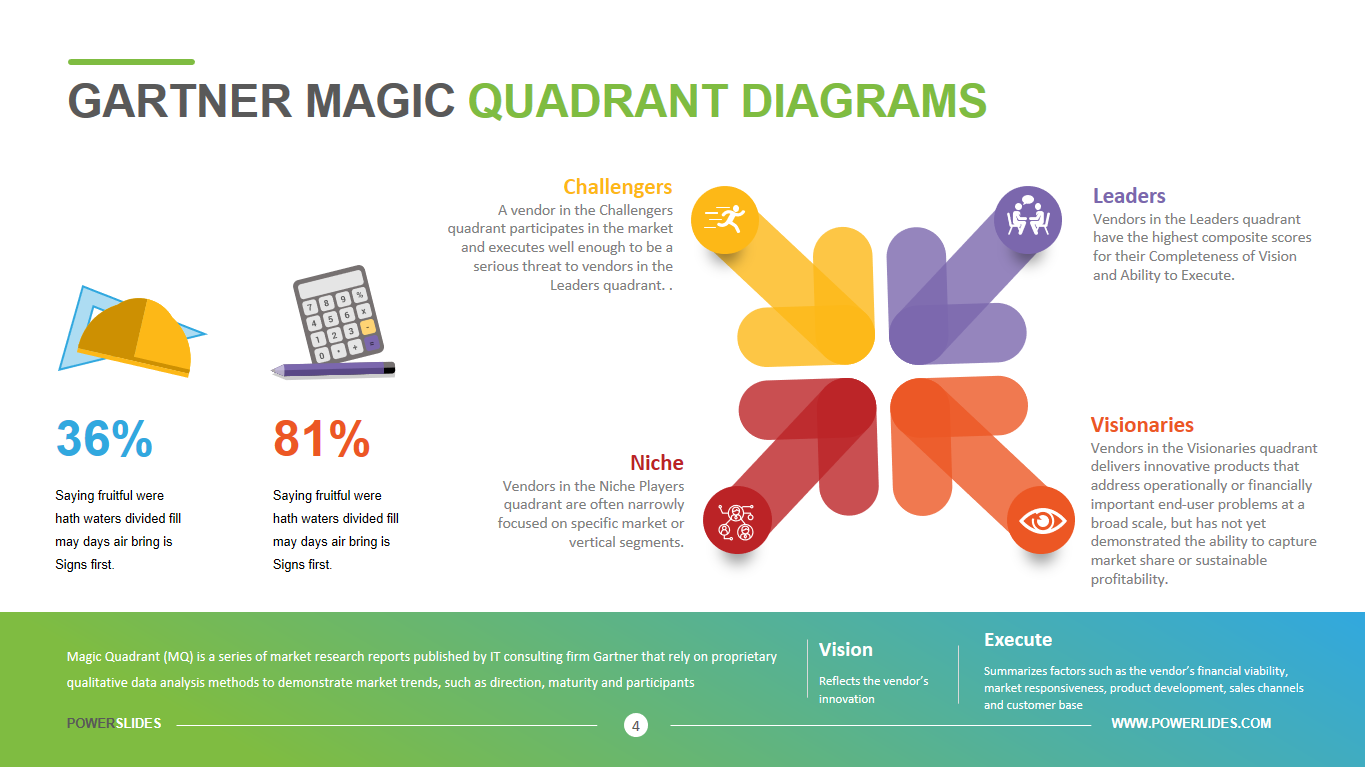
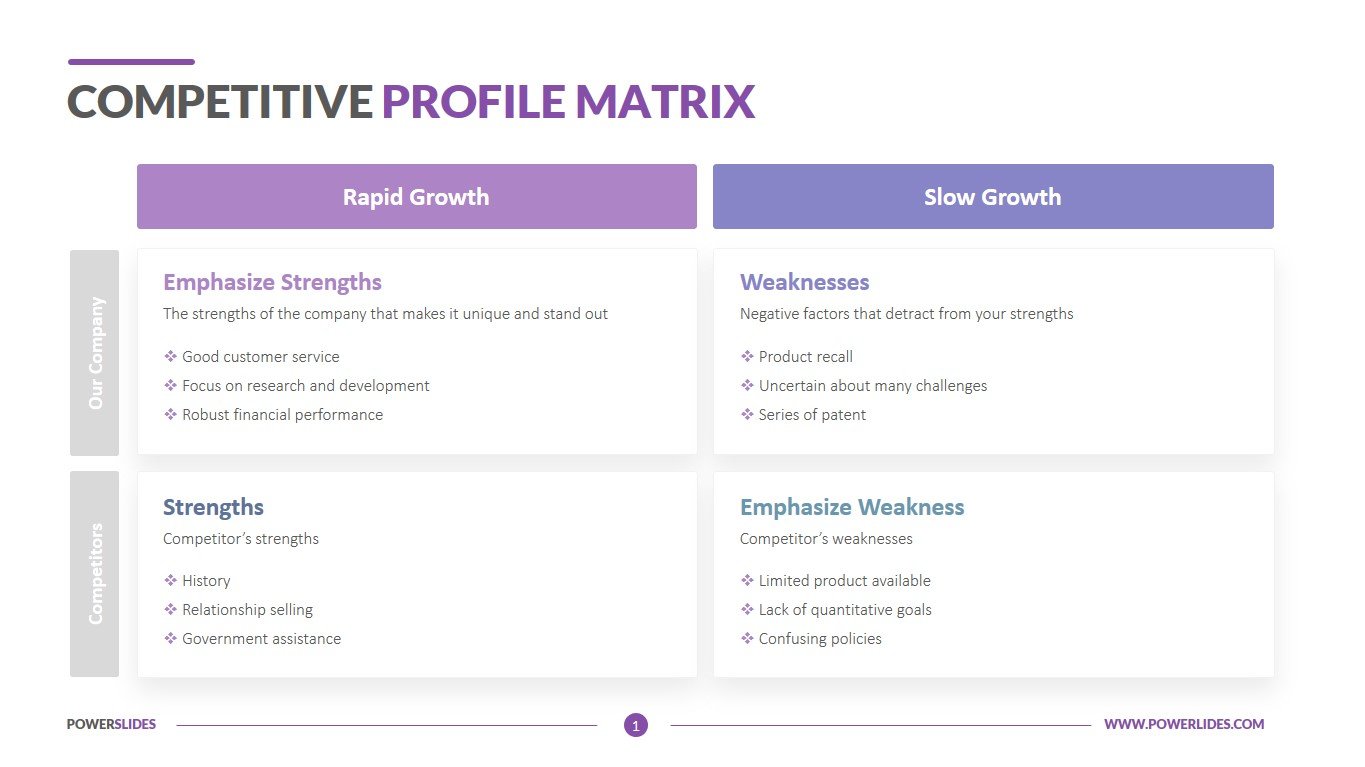
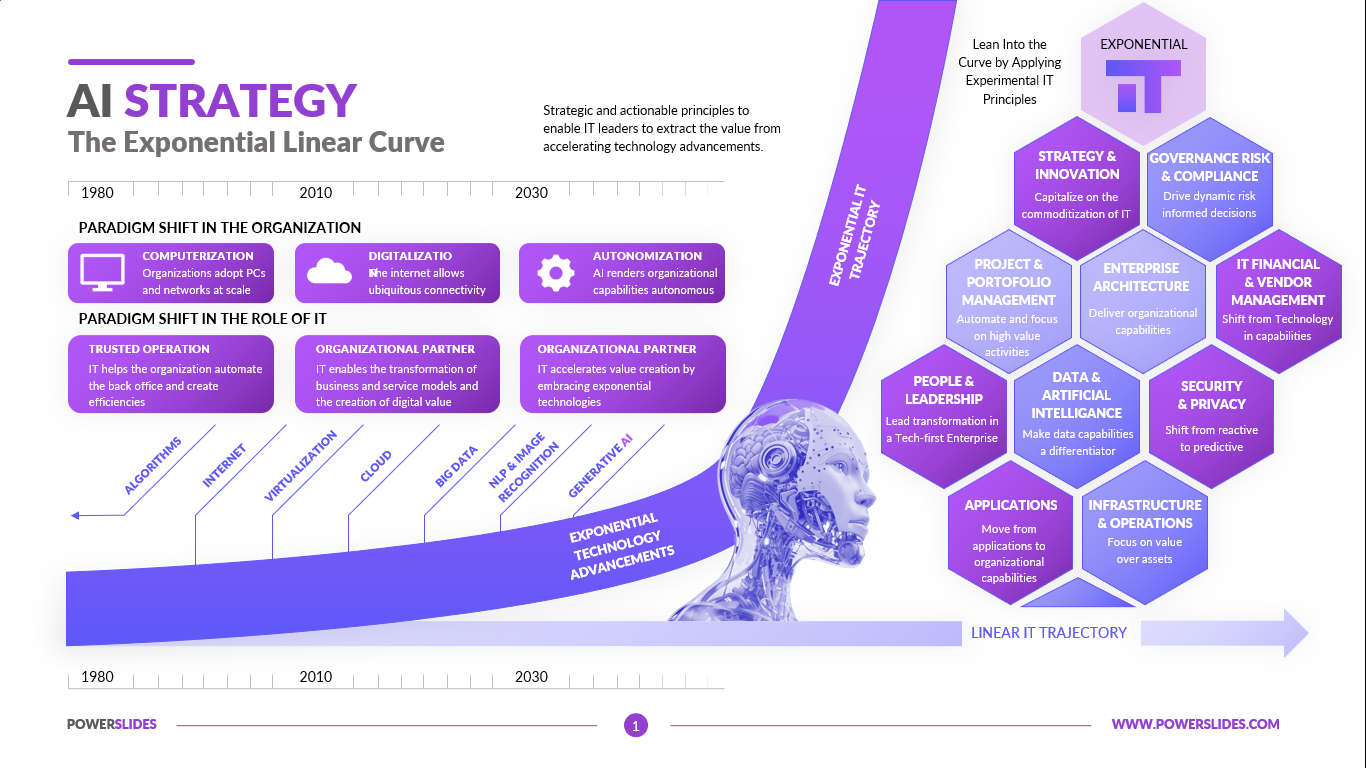
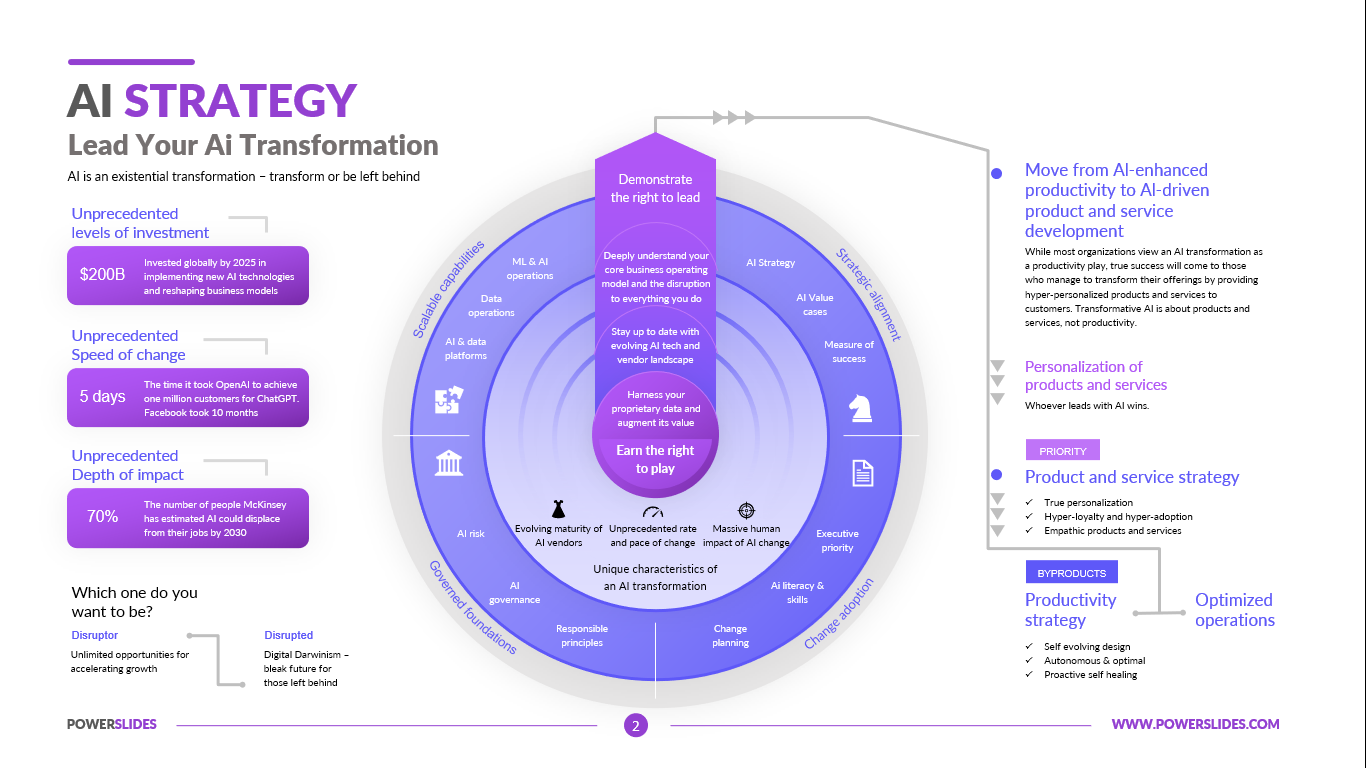
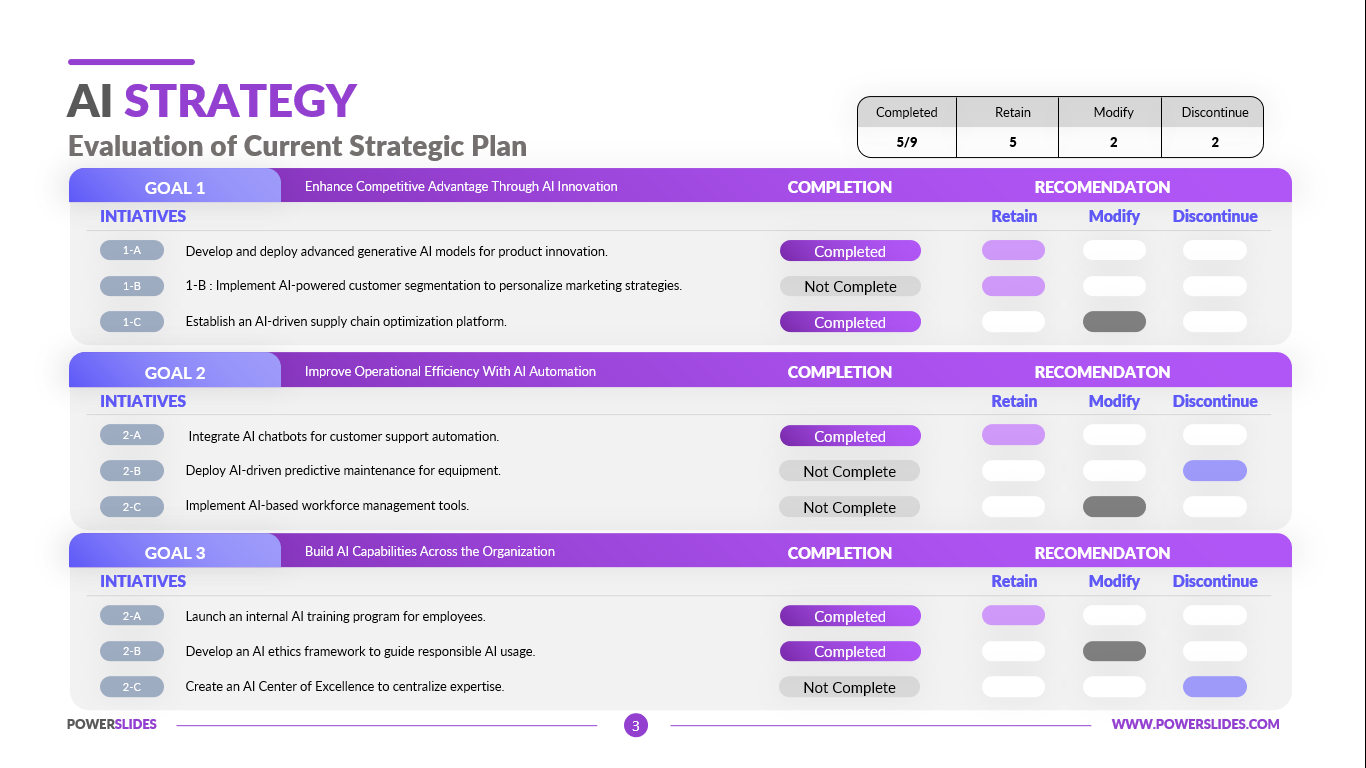
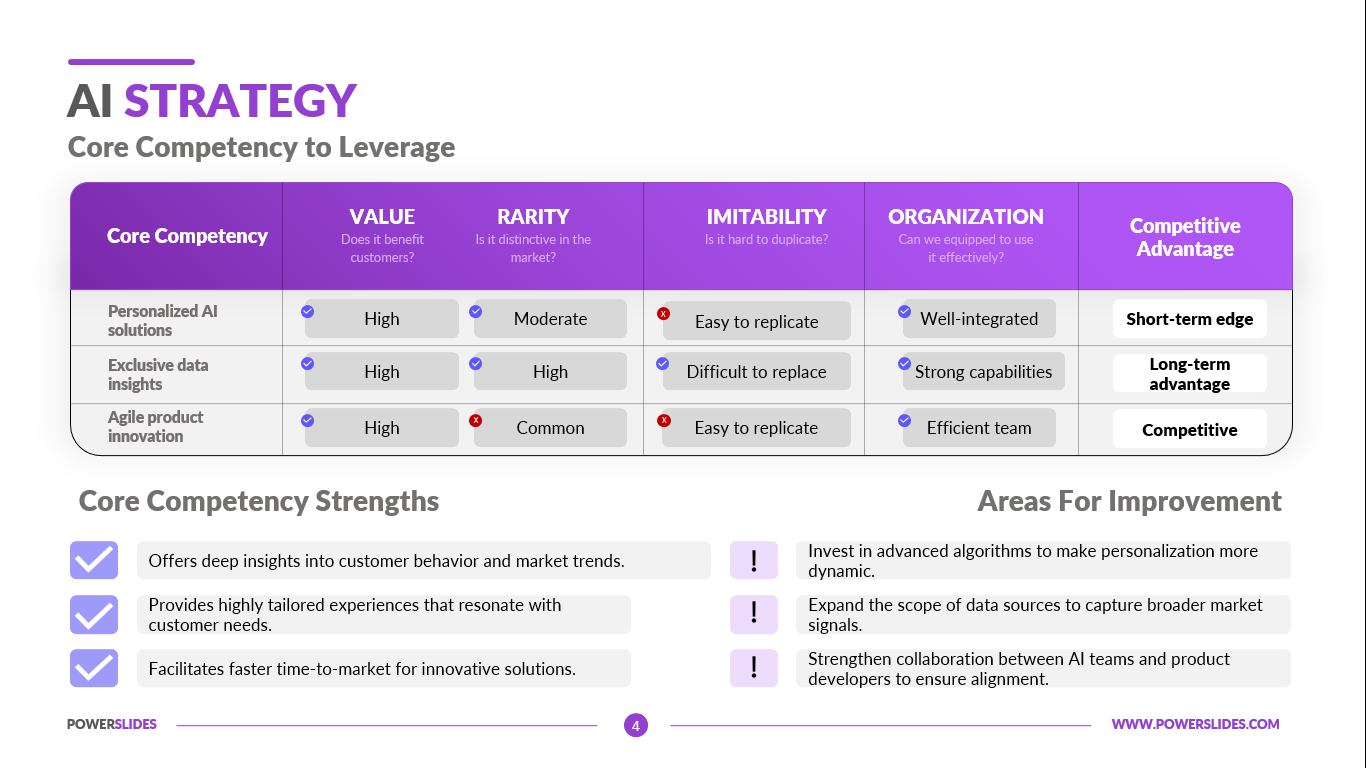
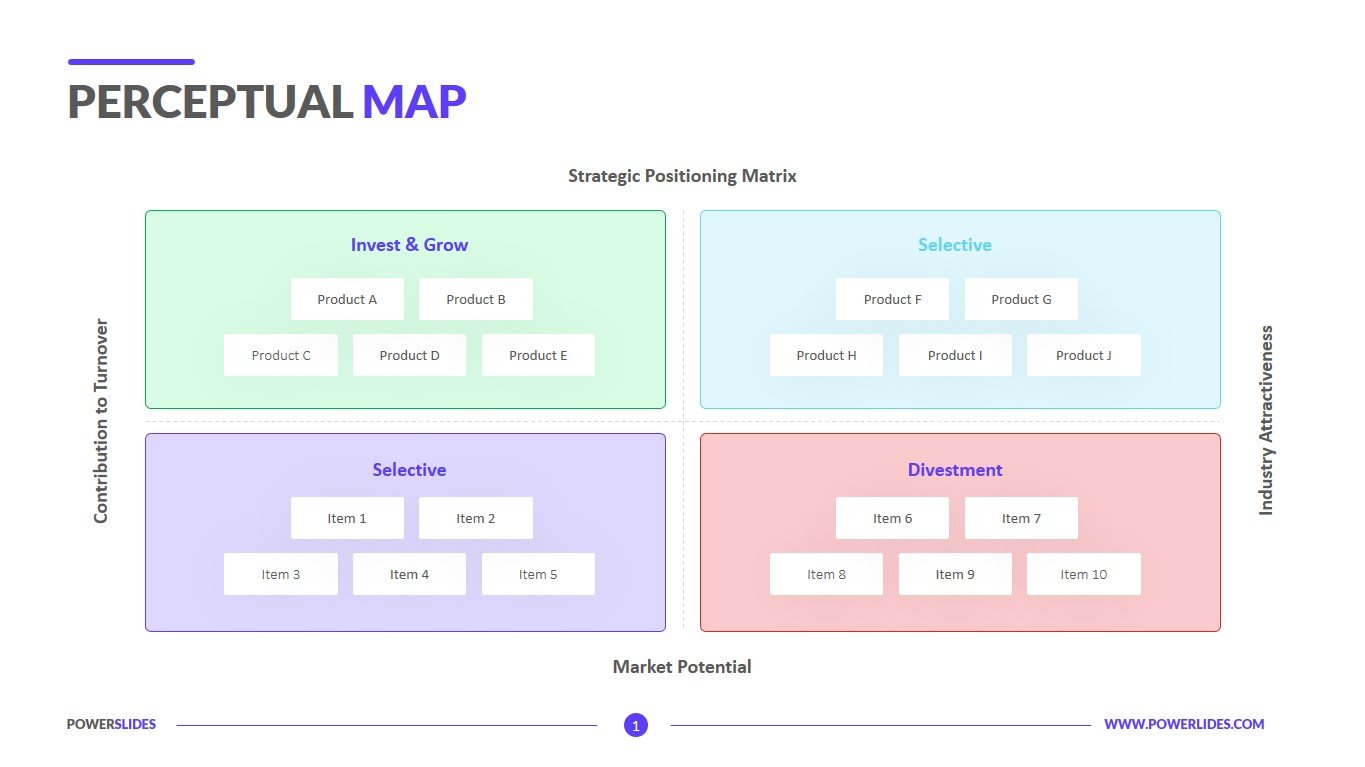
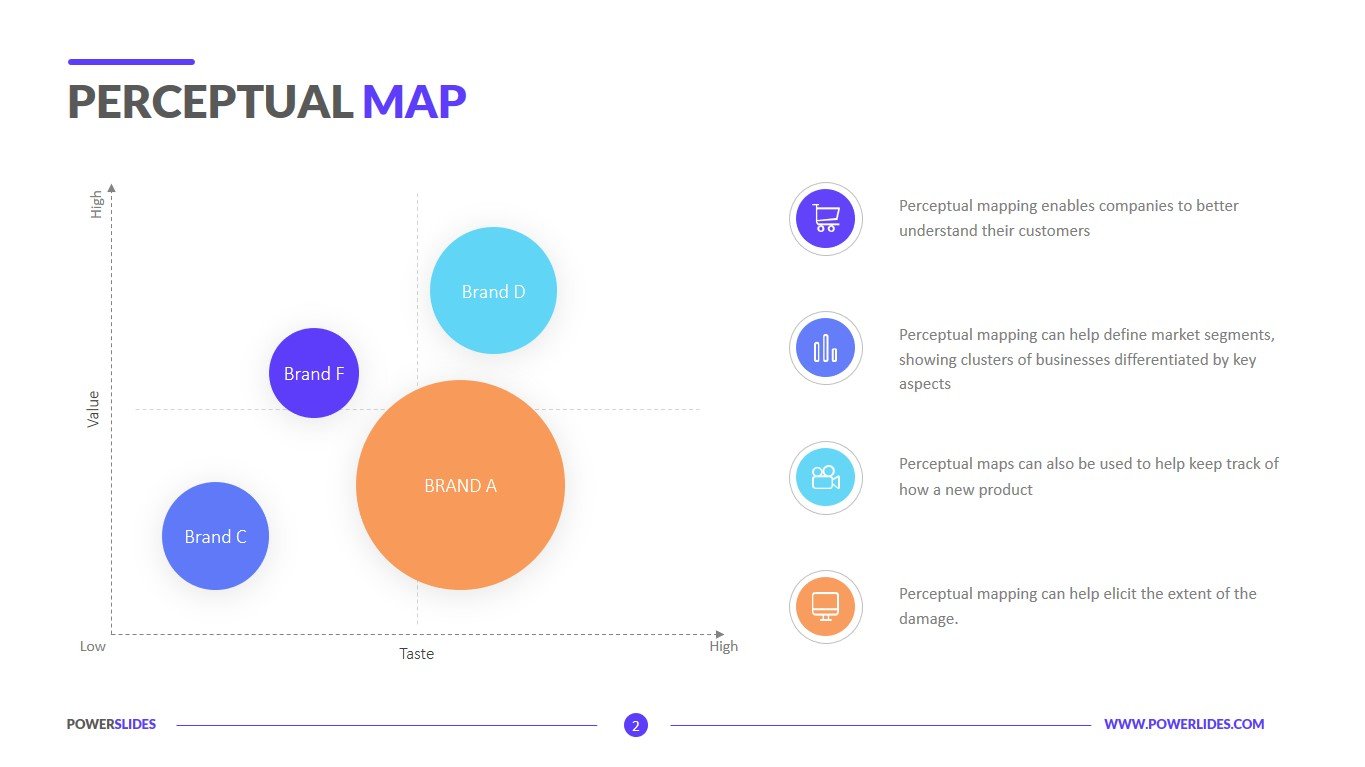
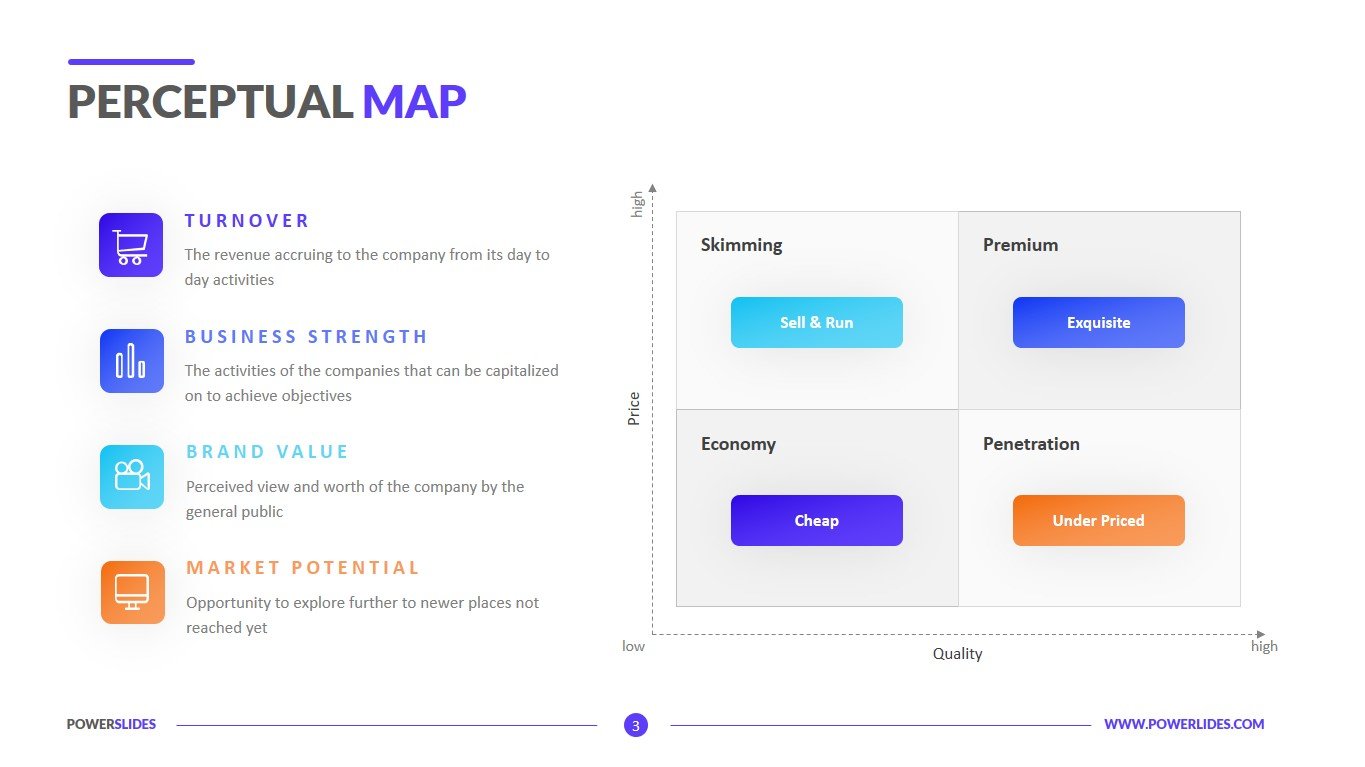
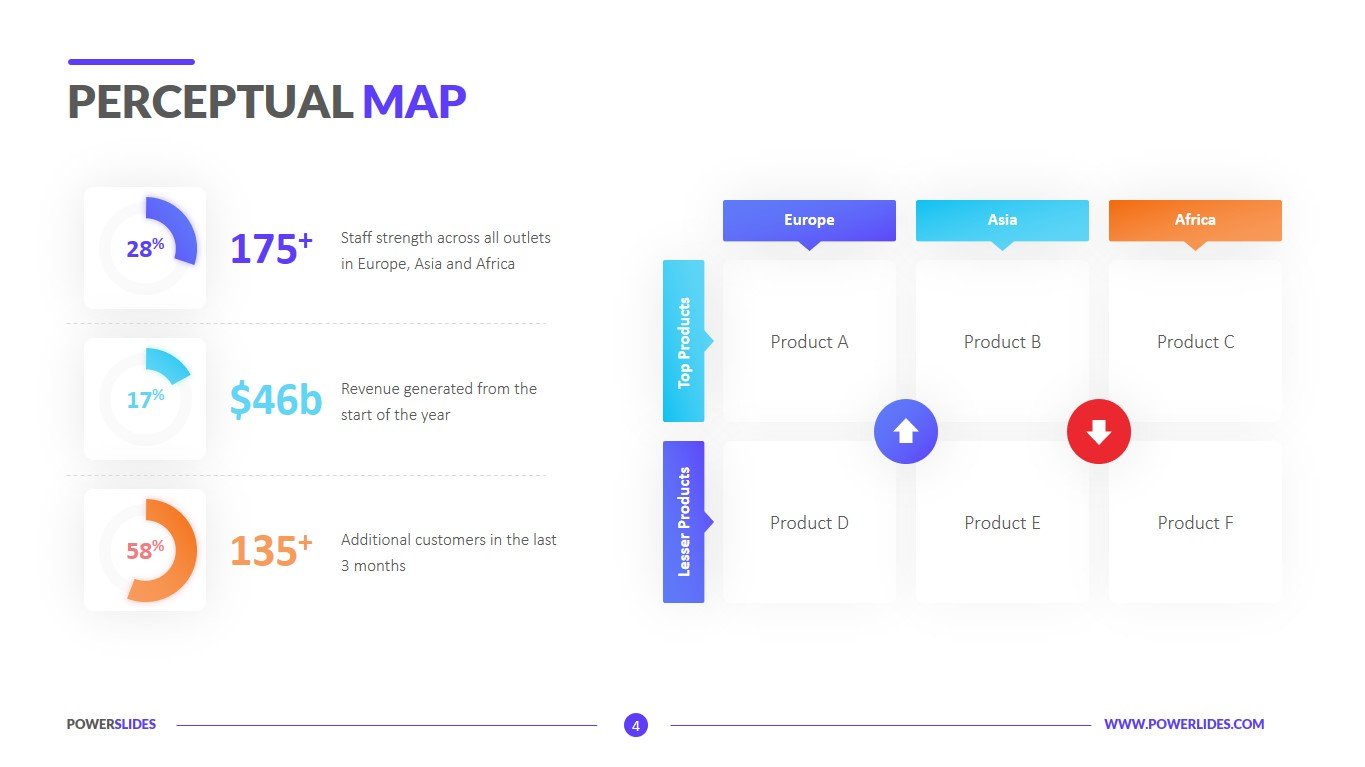
The Perceptual Map template has all the necessary tools to prepare a professional presentation. The first slide contains a graph that is divided into four areas. In each area, you can describe the positioning of the product in the market. The slide distributes the product depending on industrial attractiveness, marketing potential, strategic positioning, contribution to turnover. The second slide will allow you to place products on the graph on the left side and give a short description on the right side of the slide. You can edit the title of the chart axes depending on your needs. For example, you are researching how consumers feel about breakfast cereals. On the Y-axis you indicate tasty and not tasty, and on the X-axis useful and unhealthy. After surveying customers, you place brands based on consumer preferences. The next slide categorizes products by attributes such as turnover, business strength, brand value, market potential. You can change the names of the main attributes depending on your marketing analysis needs. The slide will also be useful in identifying the intangible needs of the company’s employees. For example, what kind of sport do software developers in a large IT company prefer? Based on the survey, the company will be able to offer them payment for a gym, provide them with the opportunity to play table tennis at work, participate in football competitions, or hold chess tournaments. The last slide provides the ability to display your survey data as a percentage in pie charts. On the right side, just like in the previous slides, you can show the attitude of consumers to the product based on key indicators. For example, this slide can be used to analyze consumer opinion on famous car brands. You can find out what consumers are prioritizing – comfort, speed, safety, or fuel consumption.
The Perceptual Map template is in line with current trends in design and functionality. The slides of this template will be useful for university teachers and business trainers when they prepare courses on marketing or social surveys. Also, this template can be used by journalists when preparing social surveys of the population. The slides in this template will complement any data analysis presentation. For example, you can use the slides in this template when preparing a sales report. The slide can also be used to describe client preferences in the weekly developer sprints. Perceptual Map template will be appreciated by marketers and specialists of advertising agencies and will be happy to use it in their daily work.


