Industry Analysis
What do you think of this template?

 (4.00/ 5)
12 ratings

 4 Slides
 File size: 16:9
 Fonts: Lato, Calibri
 Supported version
PPT 2010, PPT 2013, PPT 2016
Supported version
PPT 2010, PPT 2013, PPT 2016

Product details
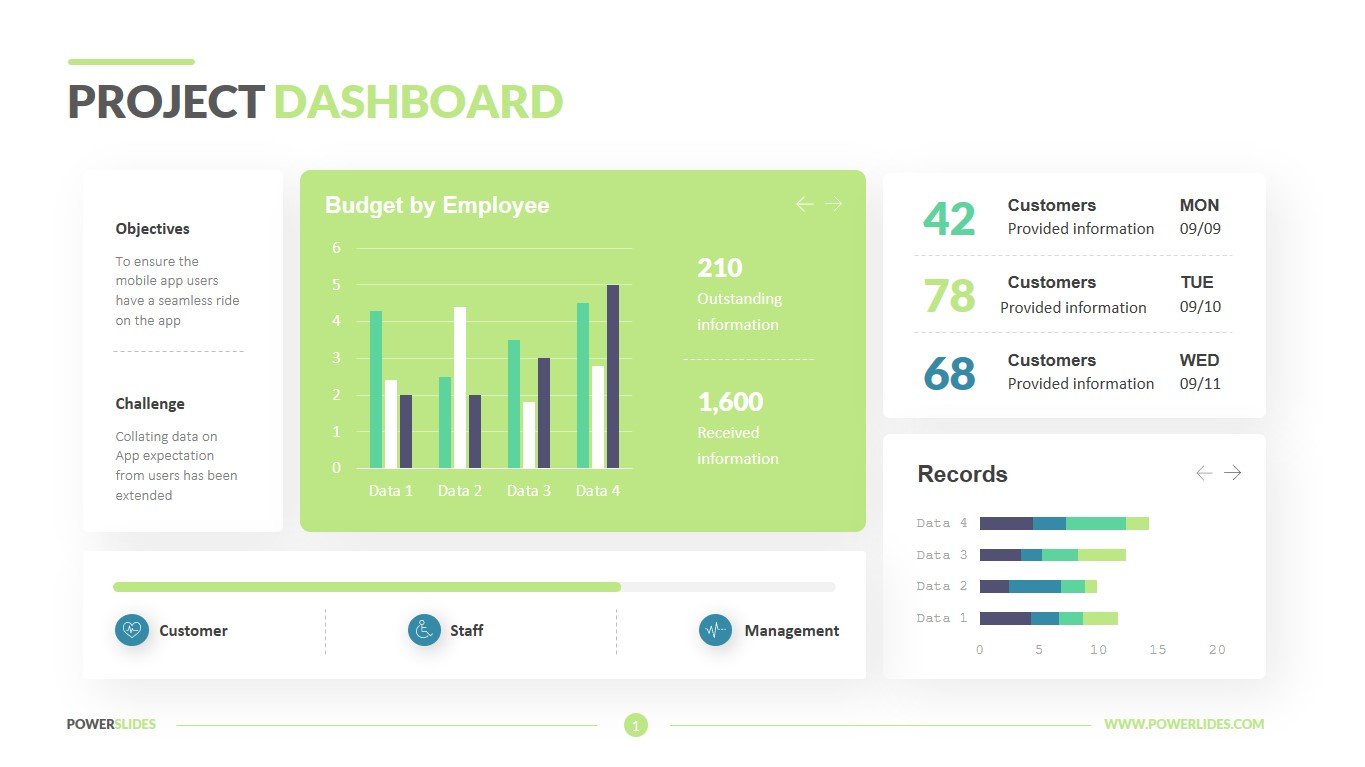
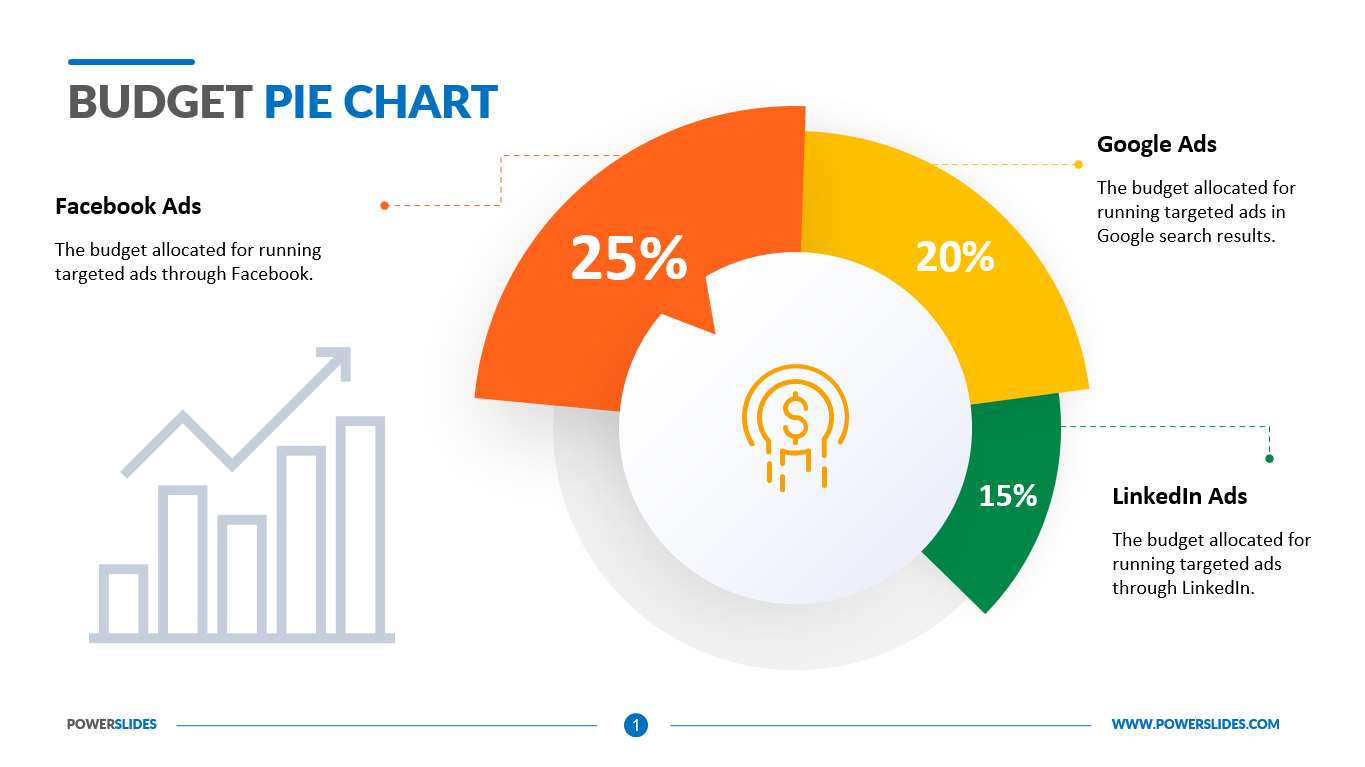
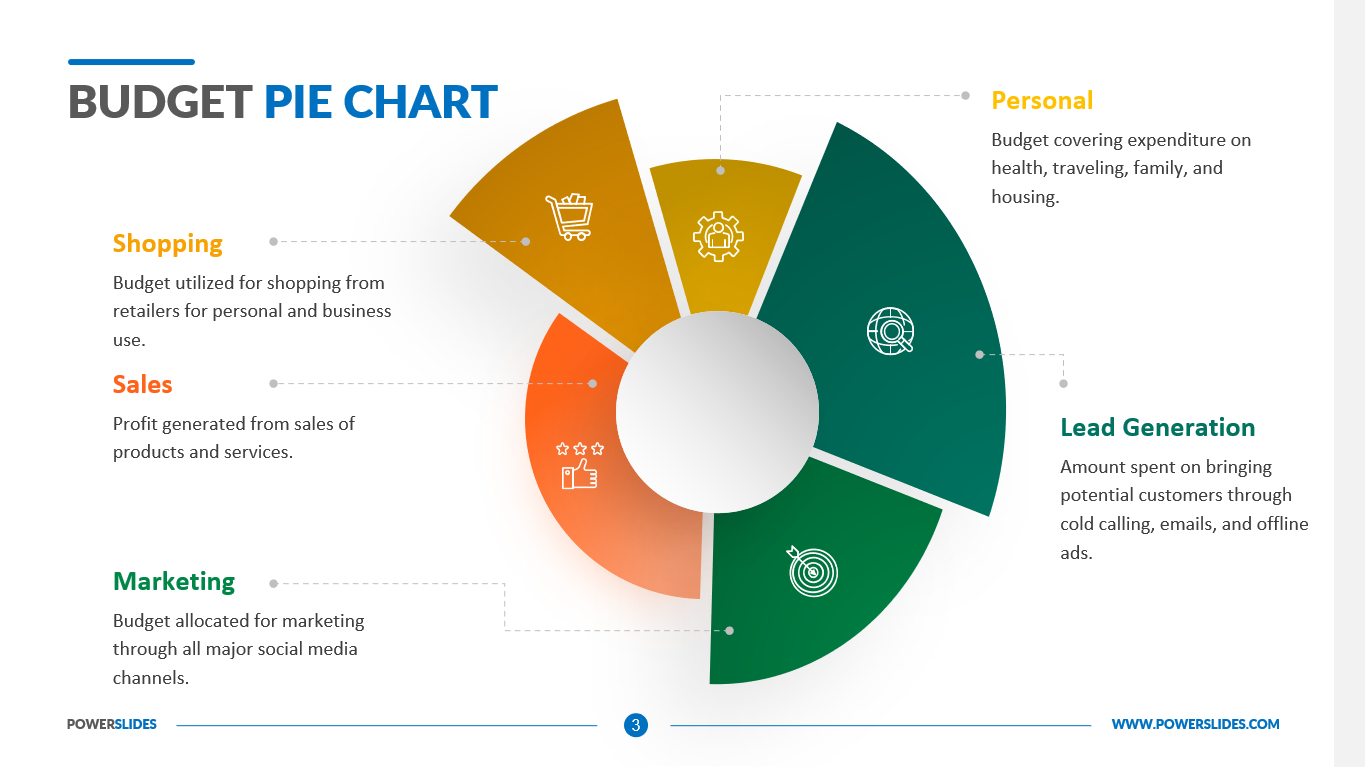
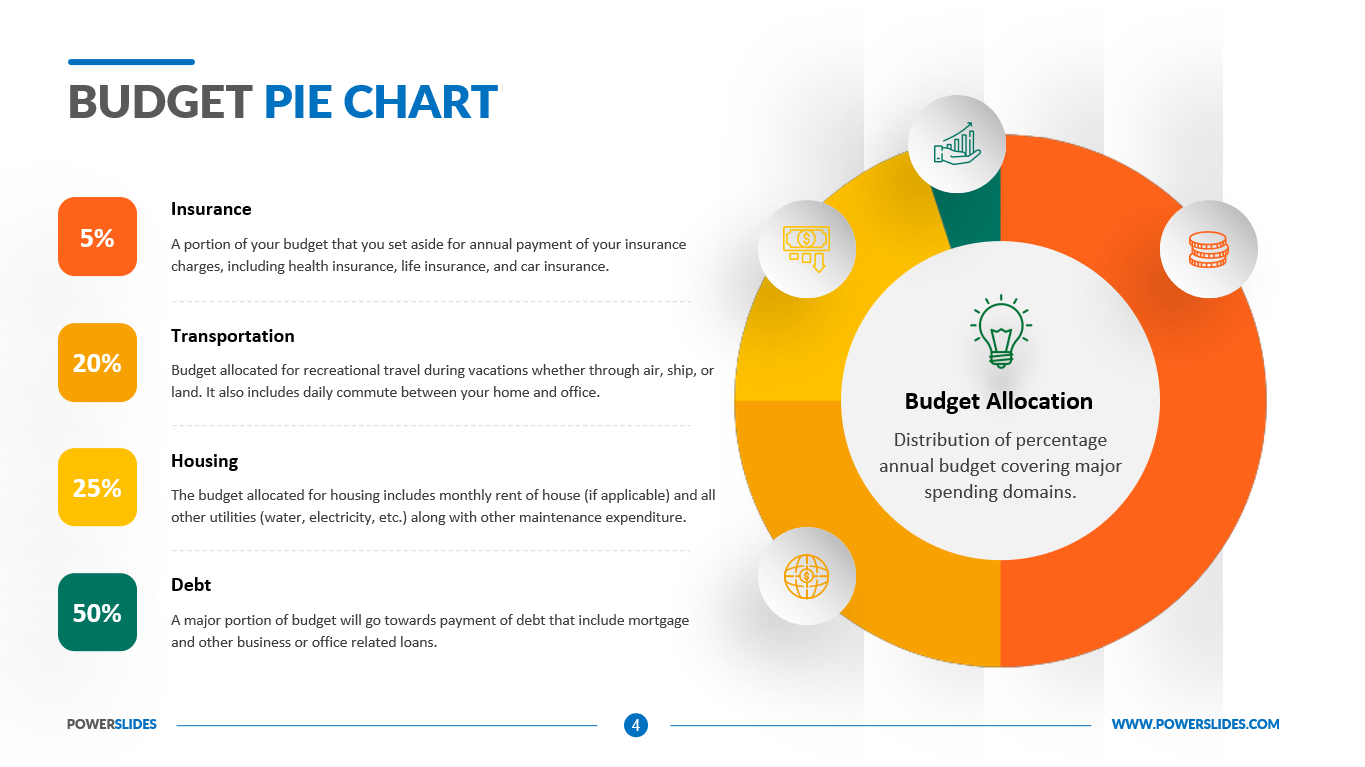
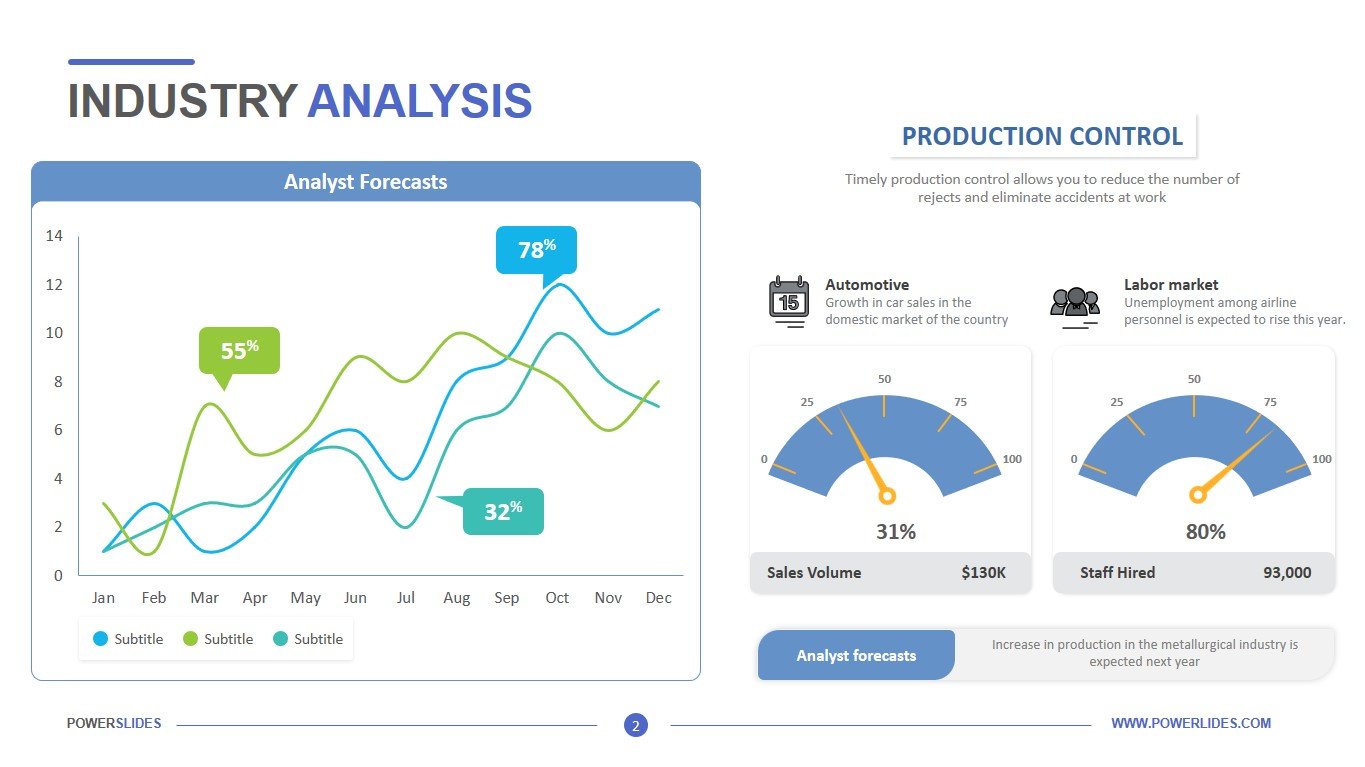
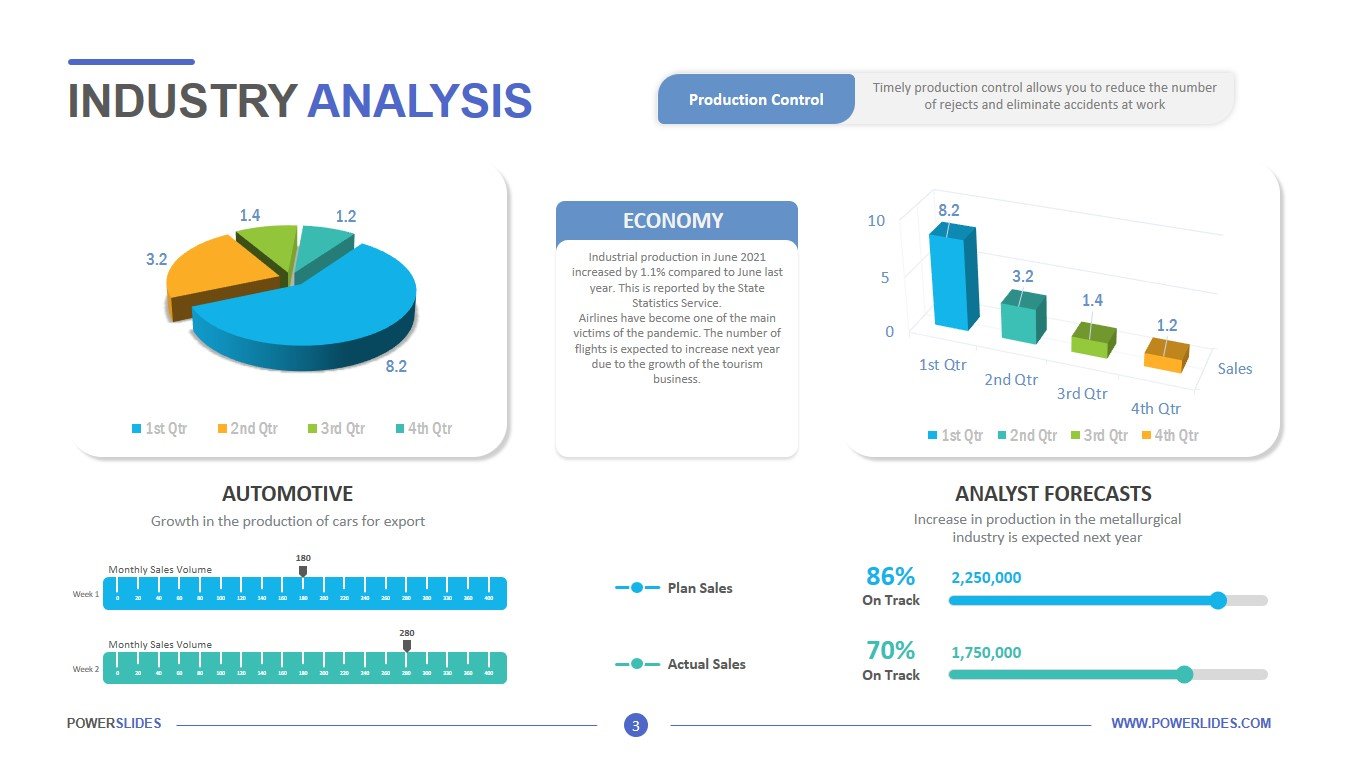
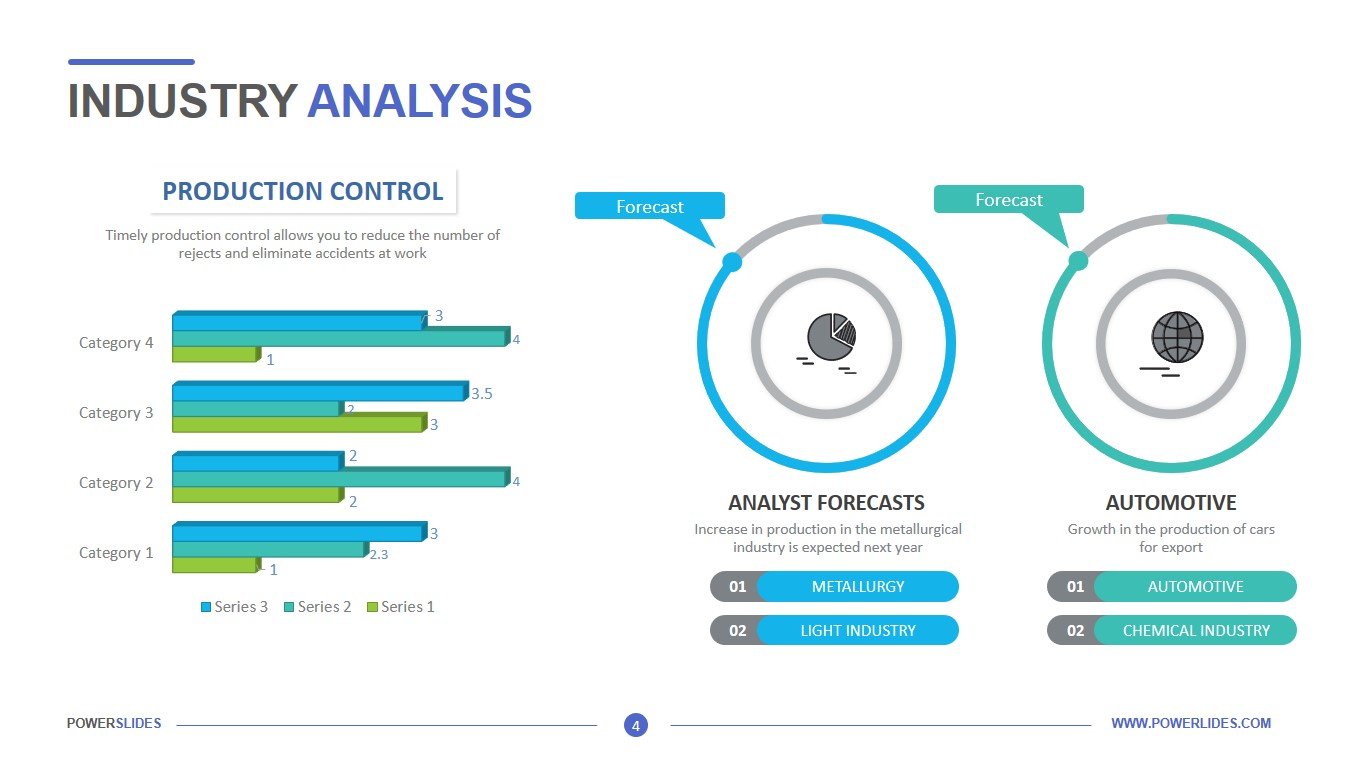
Workers and managers in industries are usually required to present and audit report of the finances over a specific time period of the work rate’s progress and other such matters. The power point’s free template of industry analysis with a wide range of designs and flexibility in customization makes this task really easy for the presenters. You can use the industry analysis template to show the loss and profit ratios overtime, revenues comparison, worker’s salary comparison, work output rates, etc. Among the most useful industry analysis templates are the Bar graphs, Pie charts, ring charts, line graphs, meter graphs, and various other charts to pick one according to your needs. Also an industry analysis is a business function completed by business owners and other individuals to assess the current business environment. This analysis helps businesses understand various economic pieces of the marketplace and how these various pieces may be used to gain a competitive advantage.
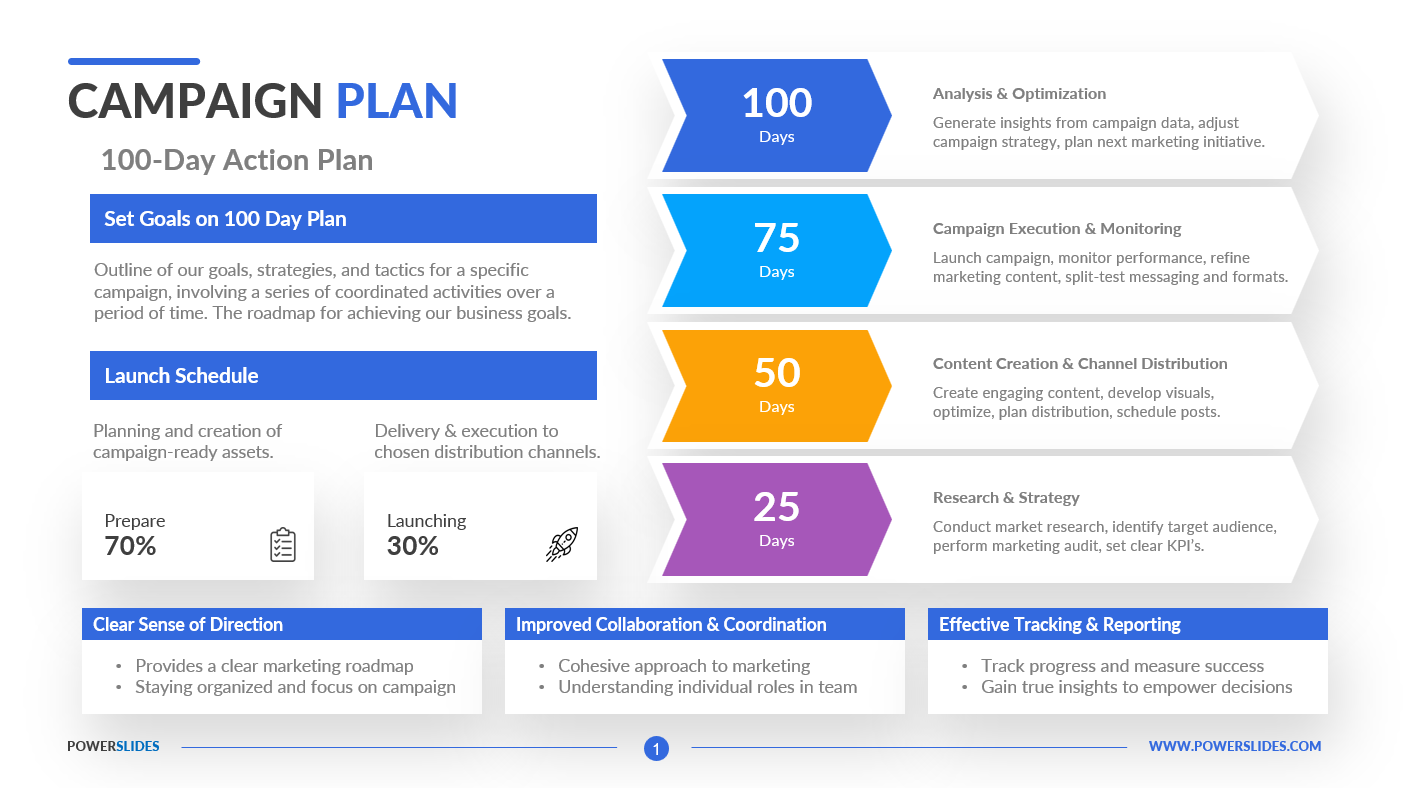
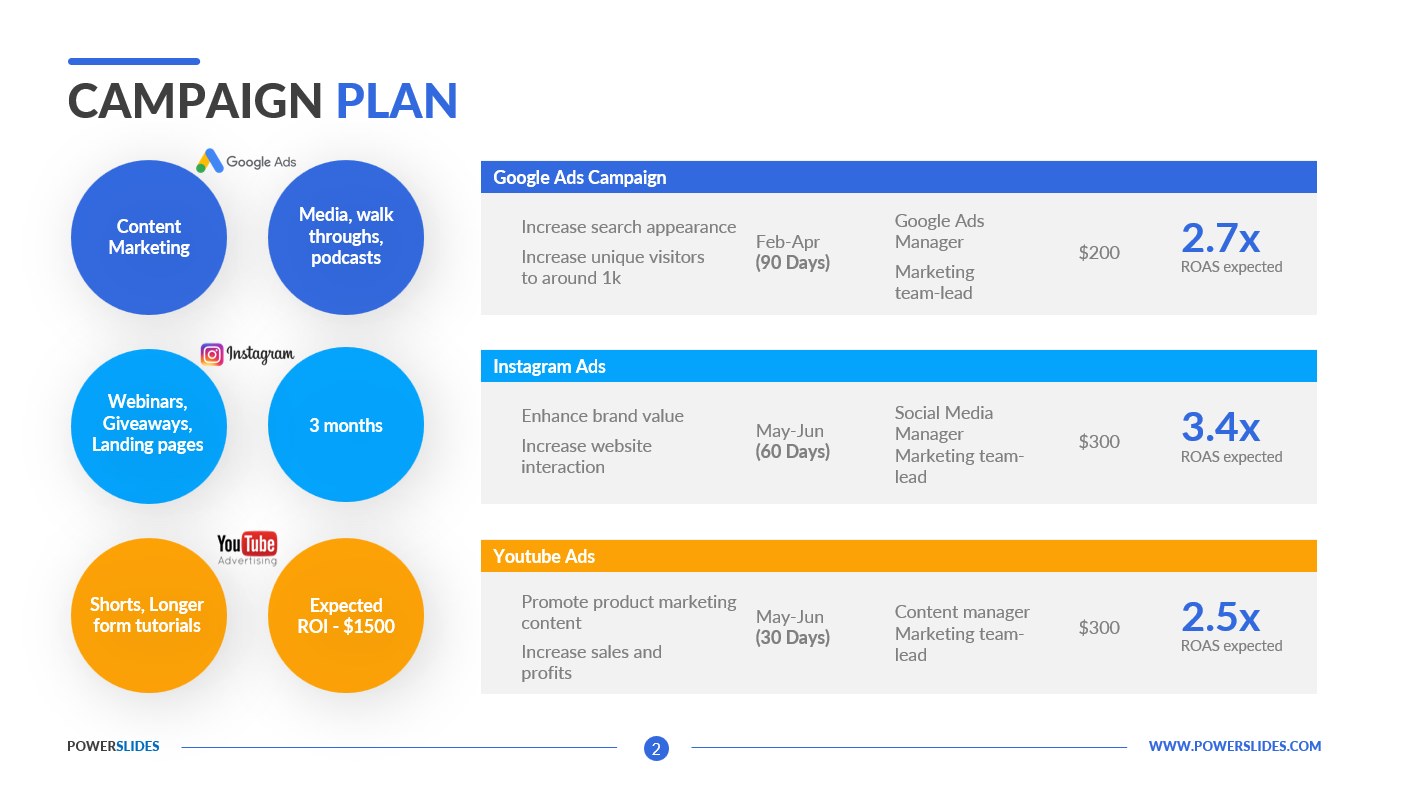
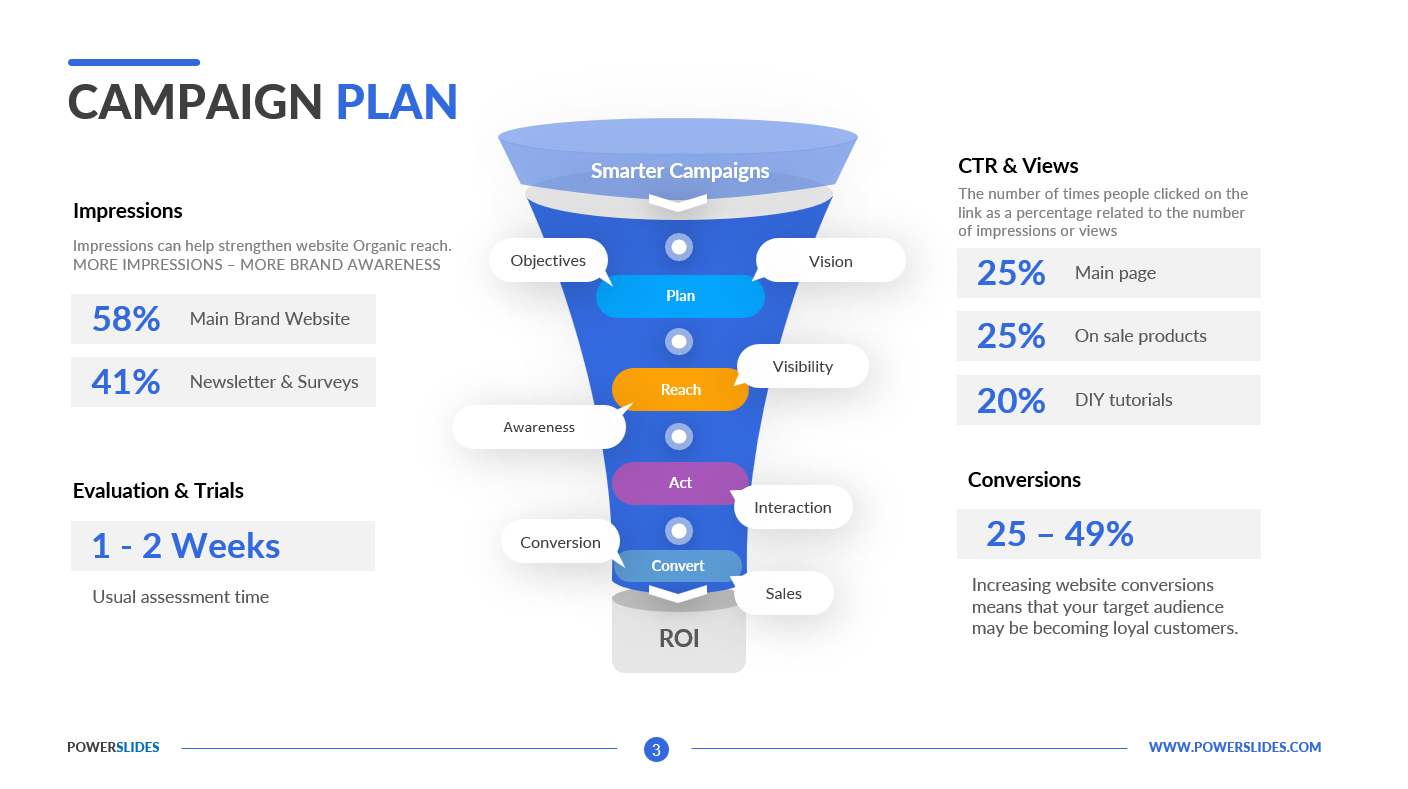
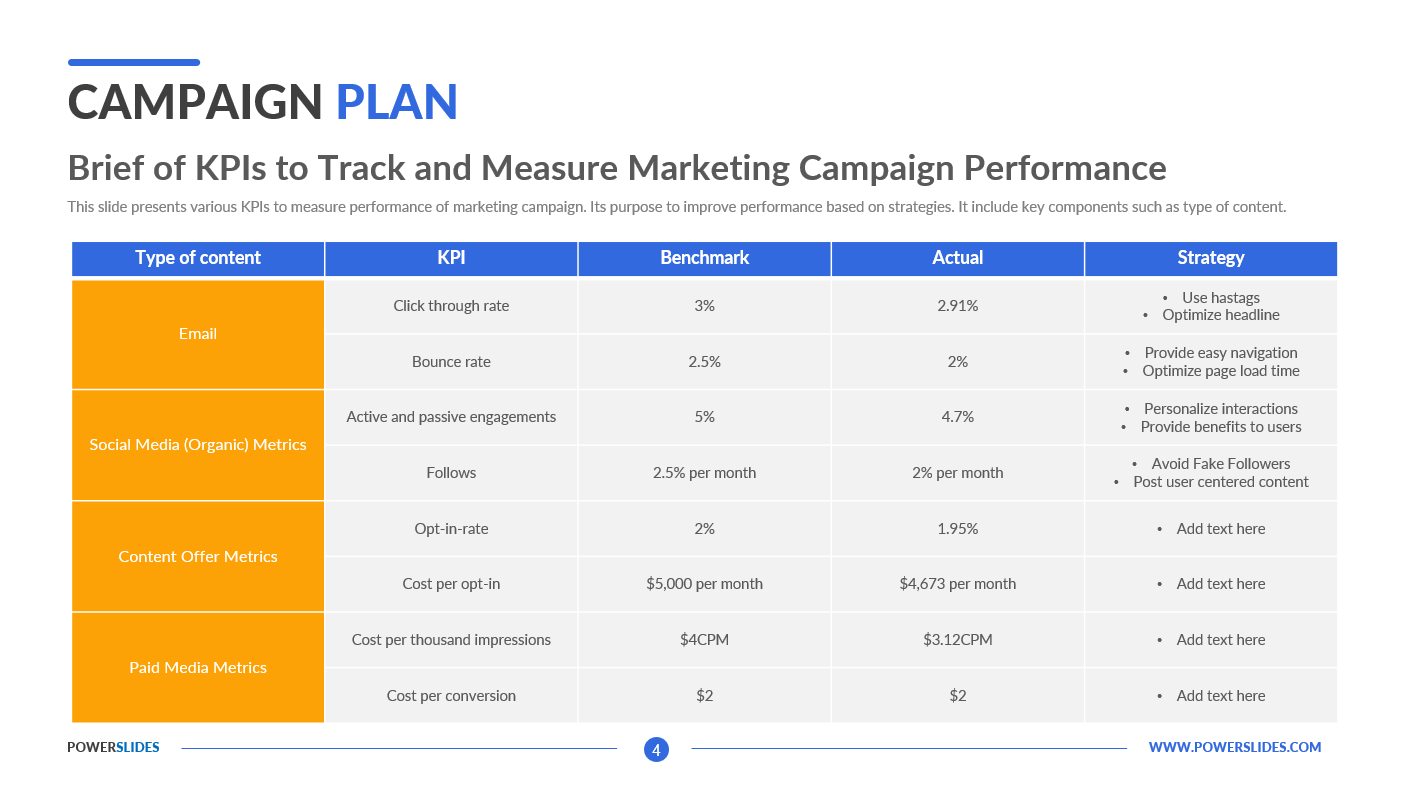
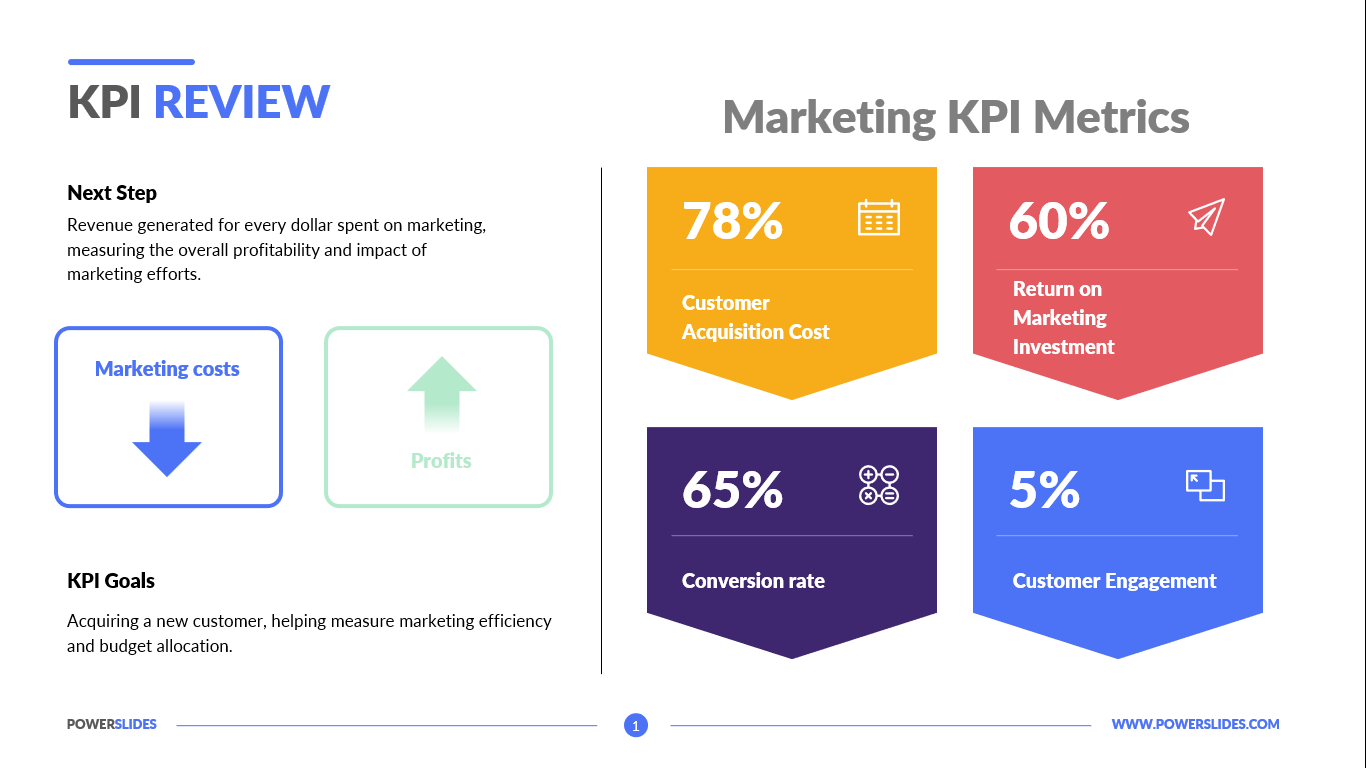
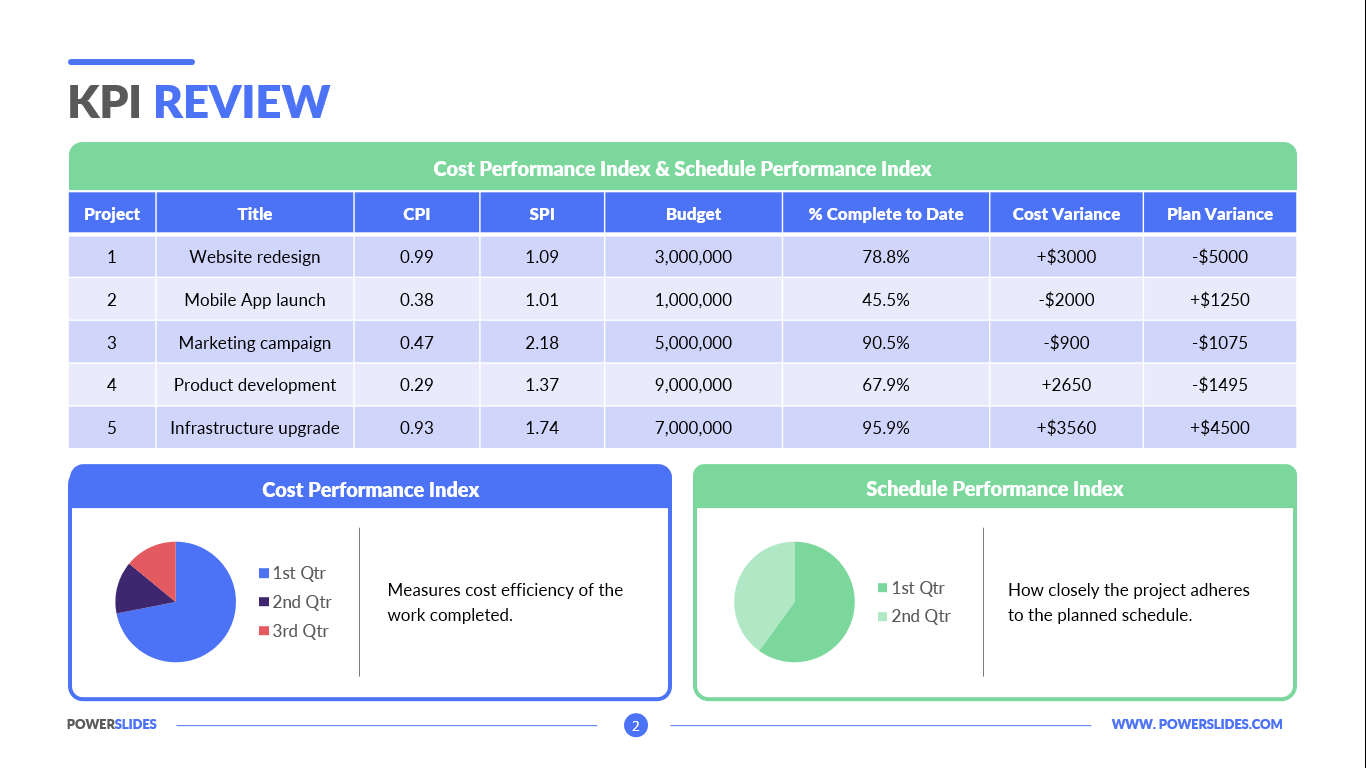
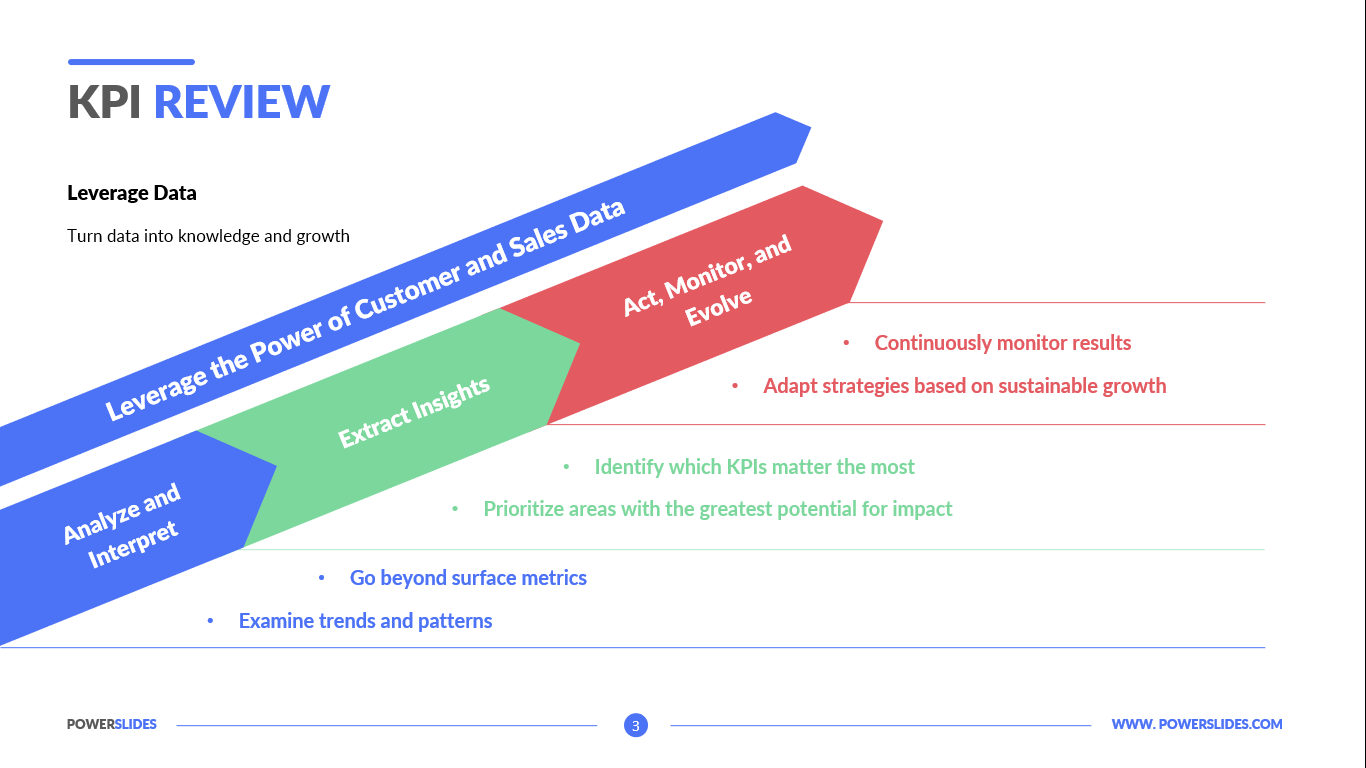
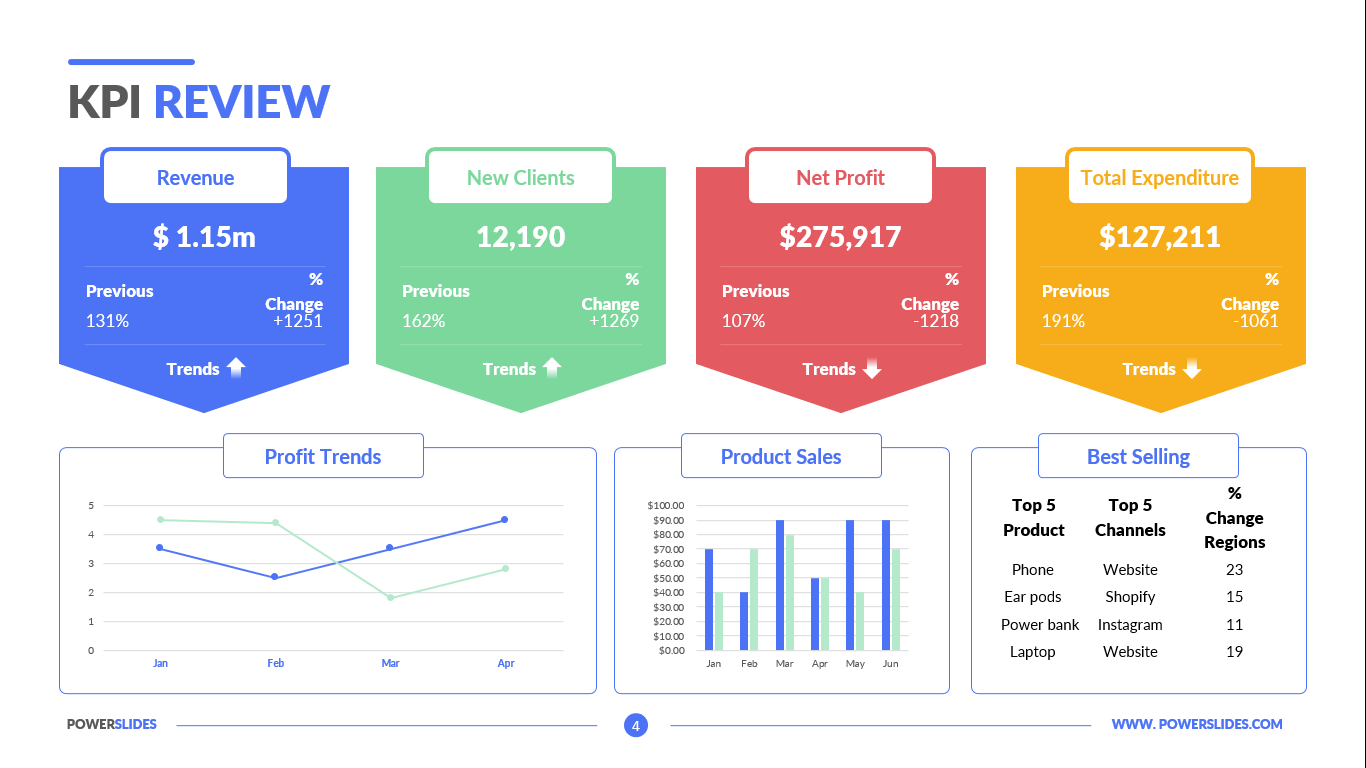
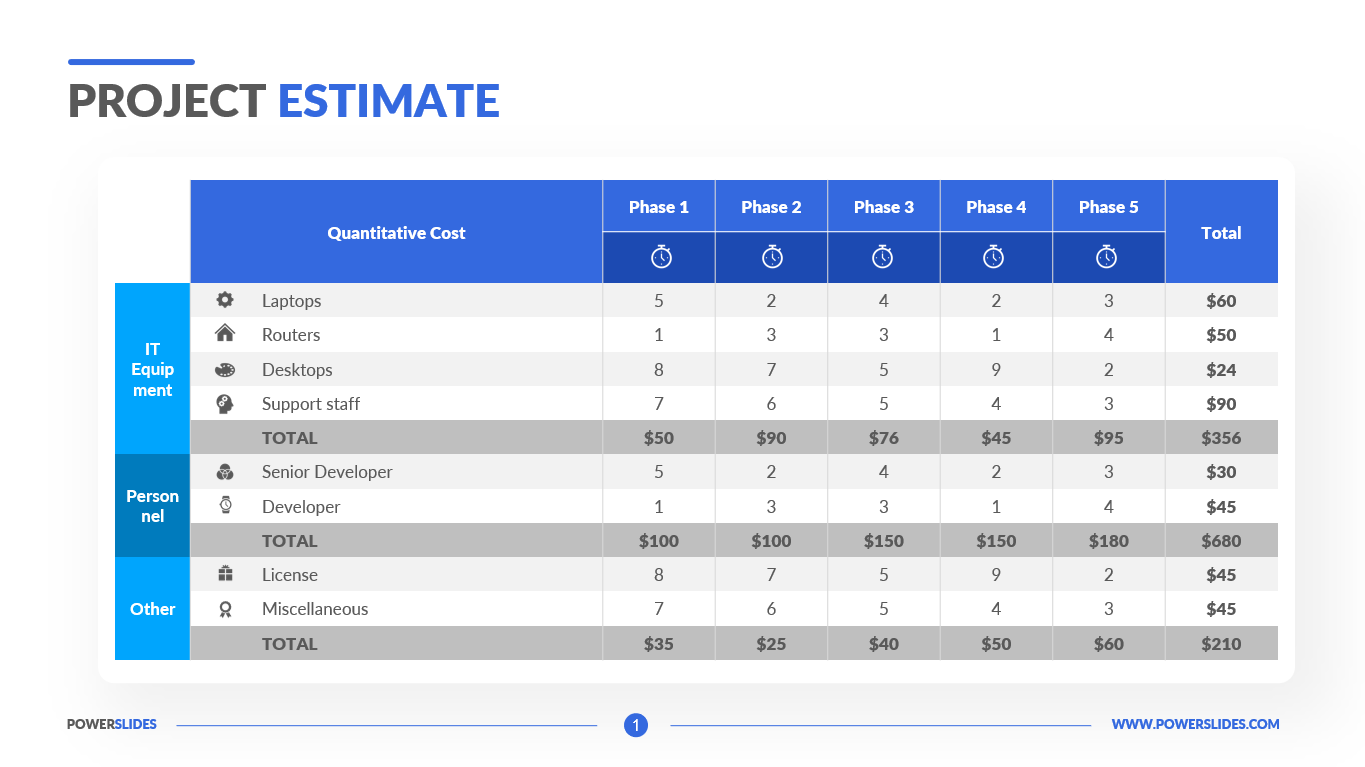
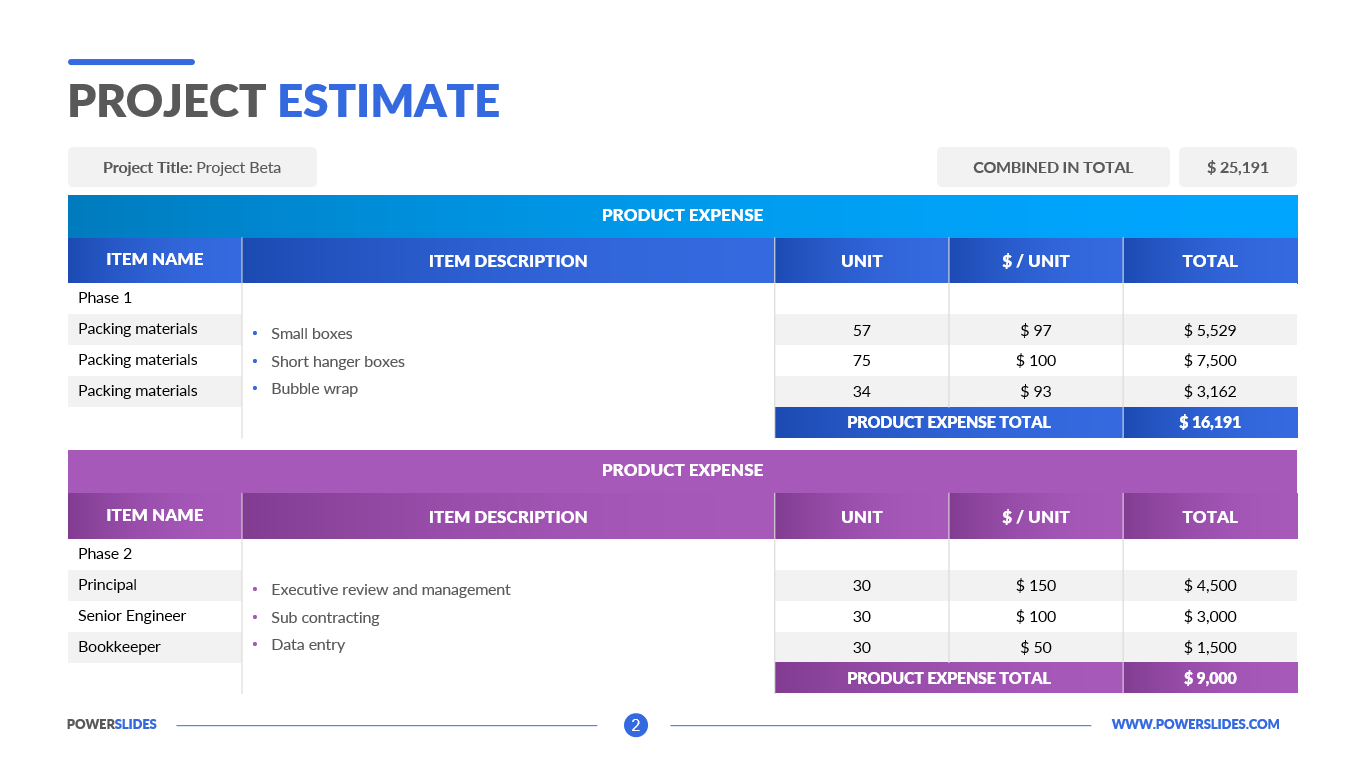
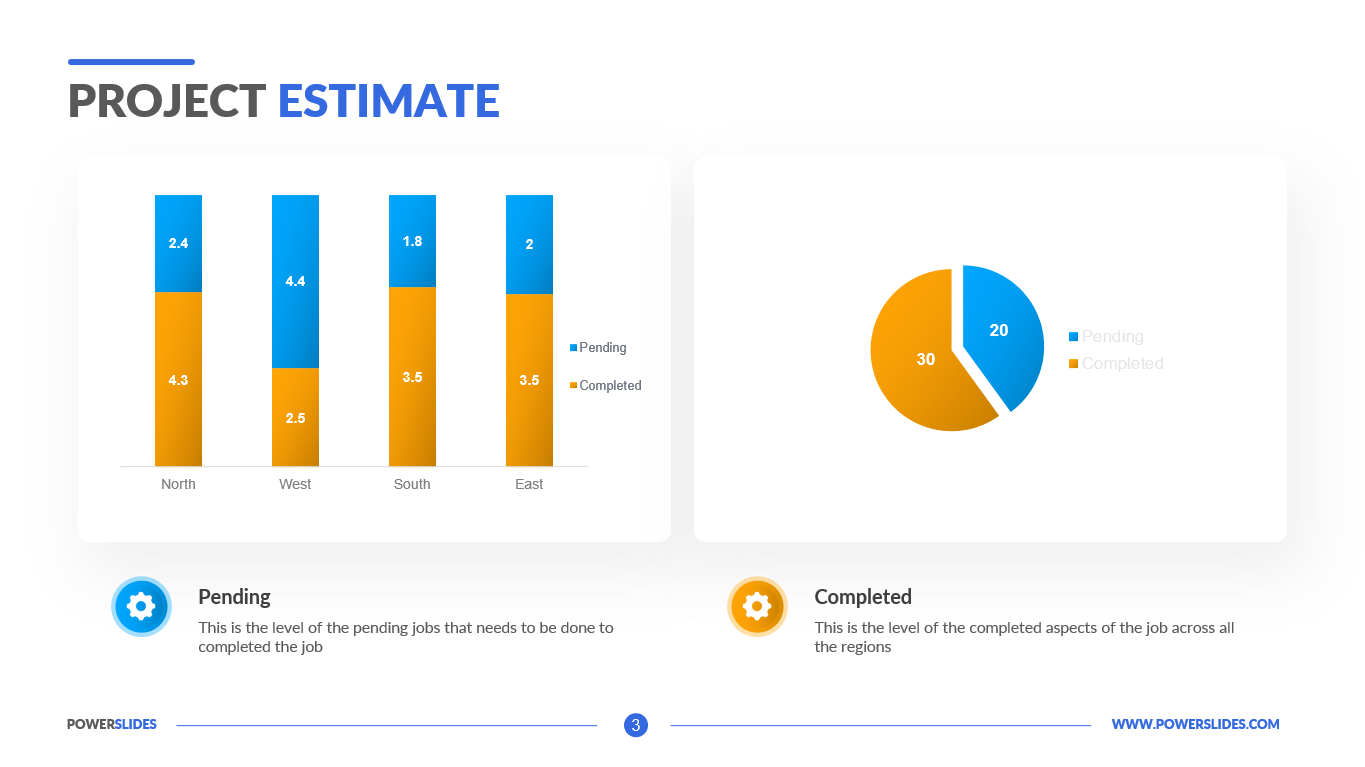
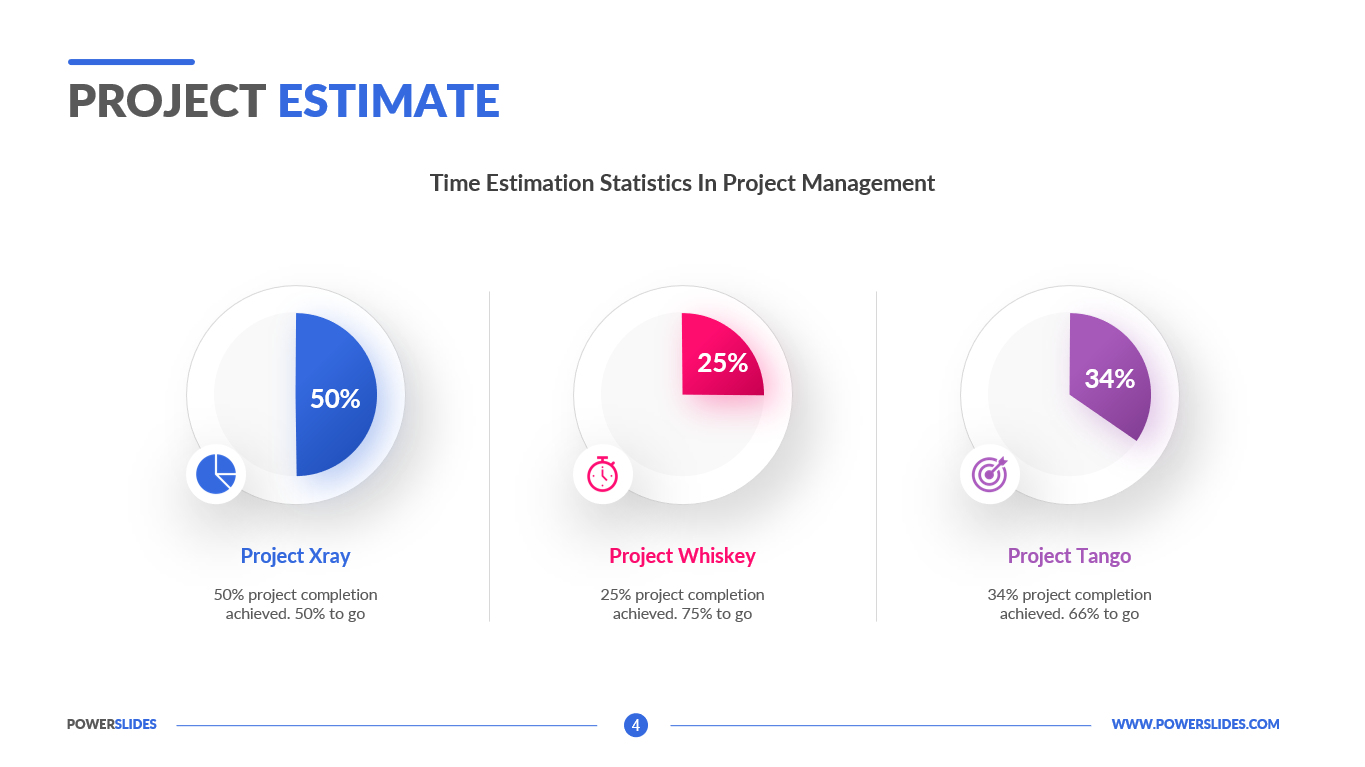
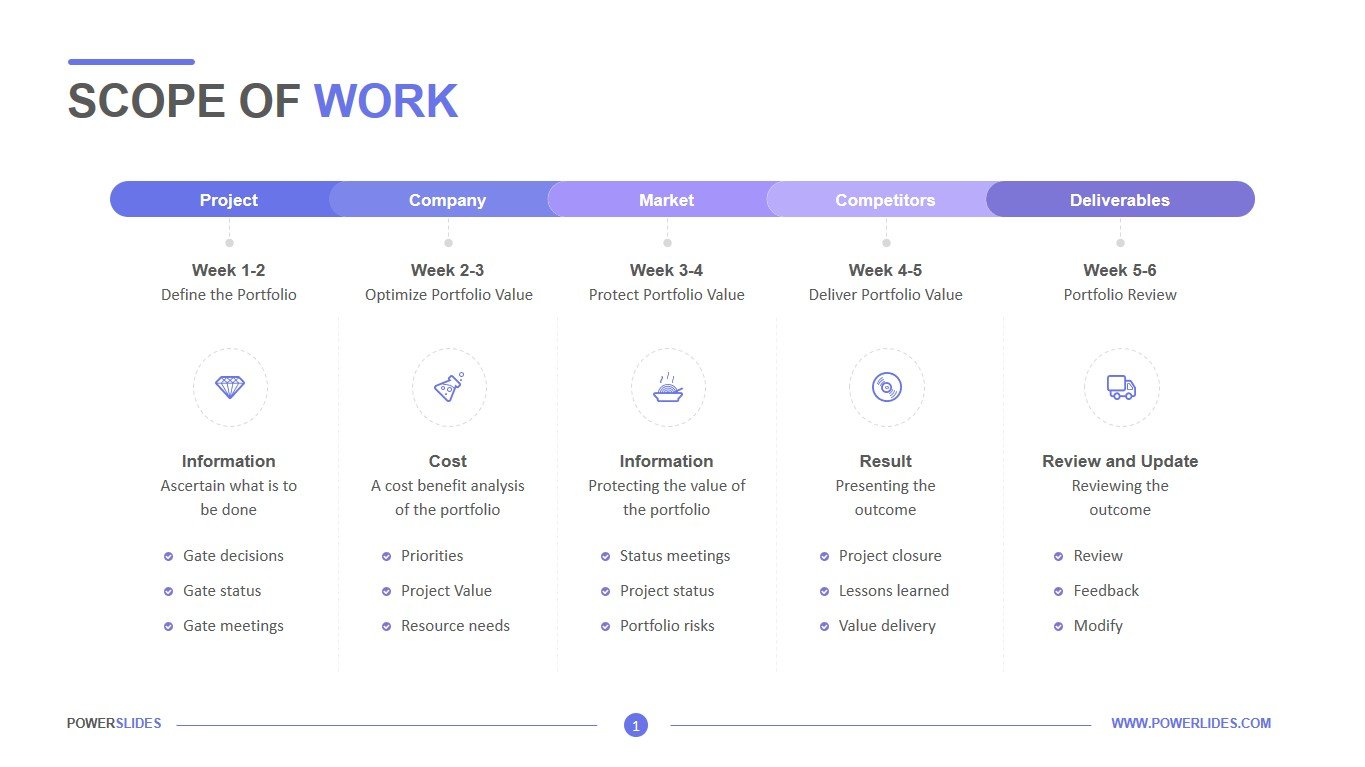
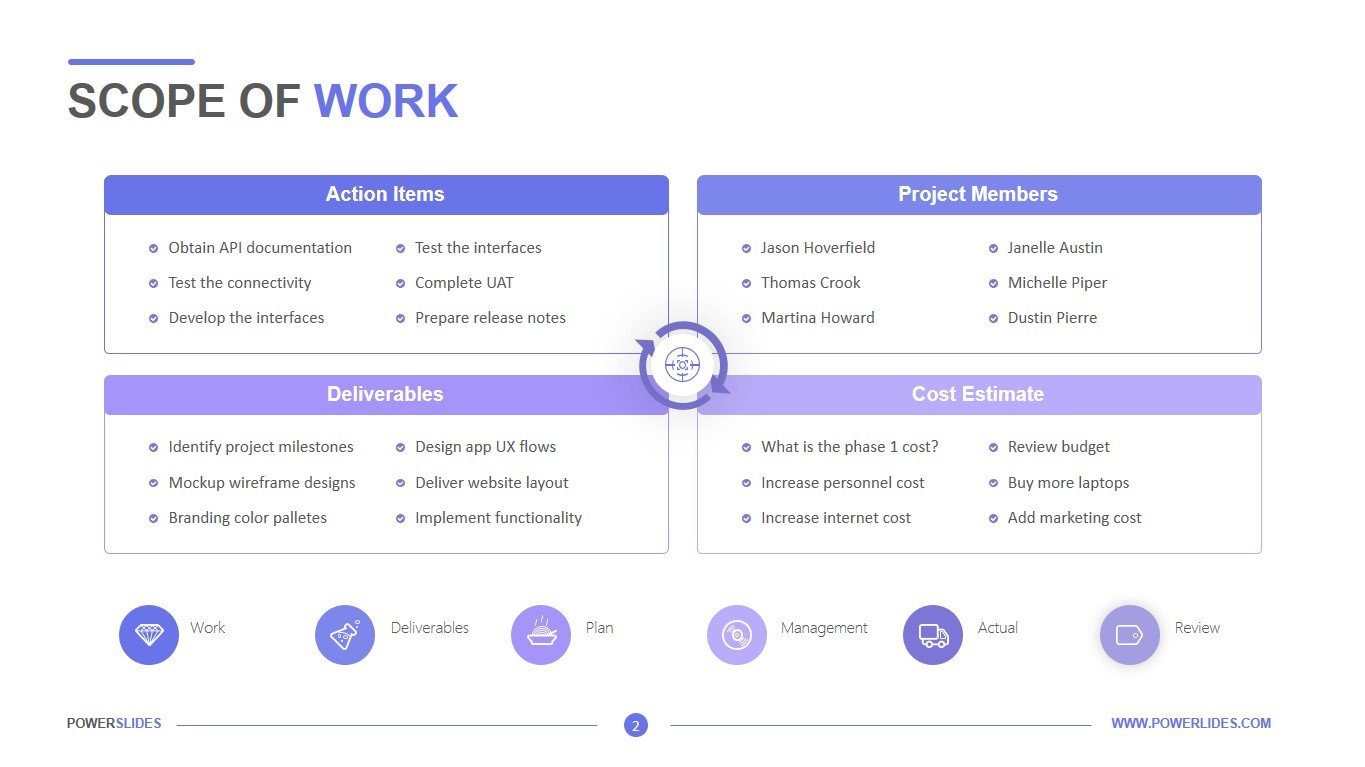
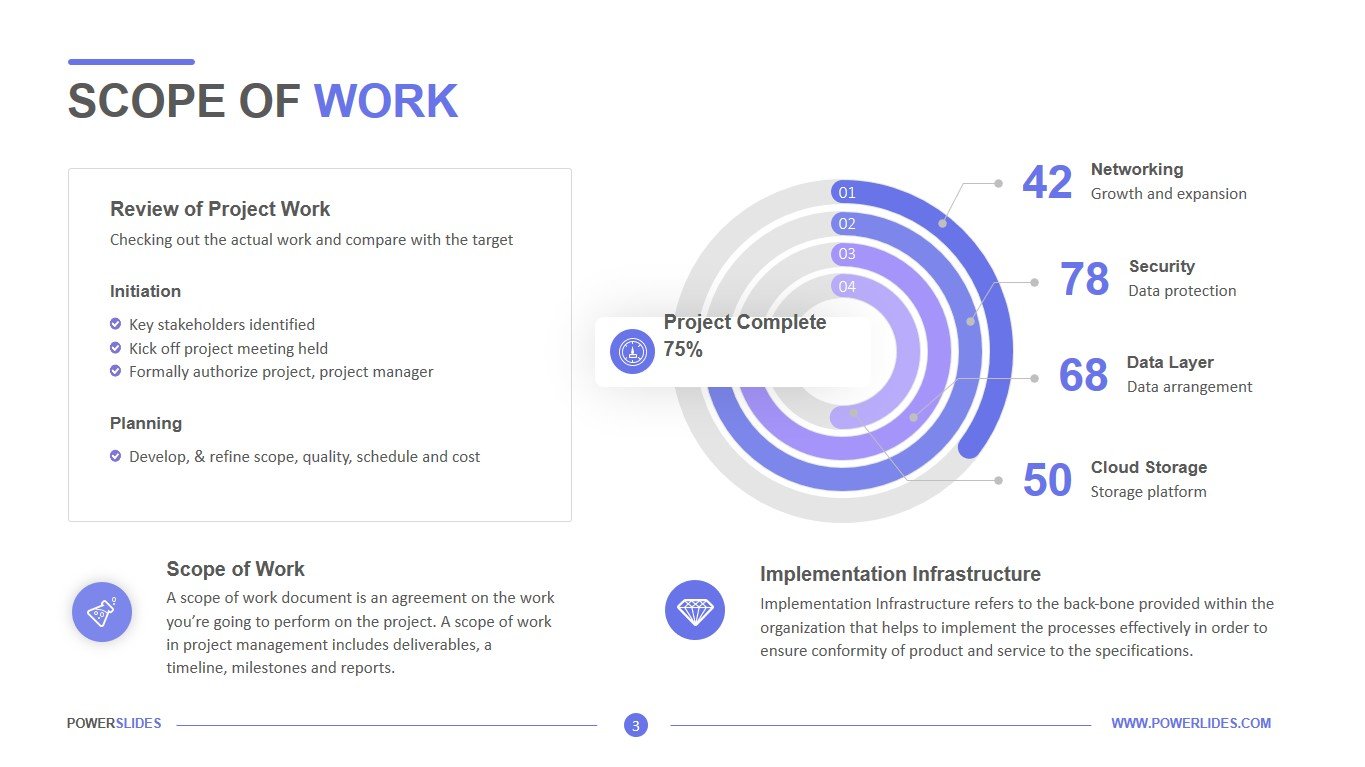
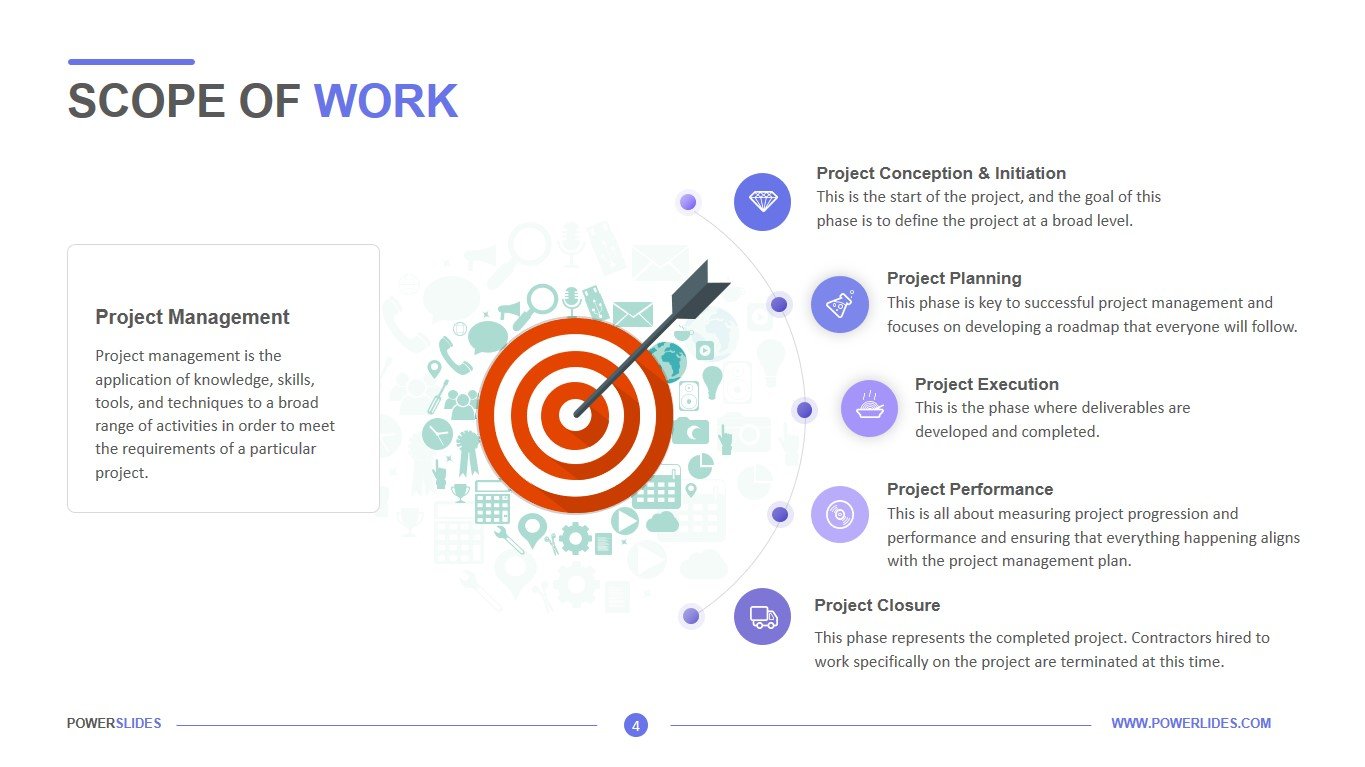
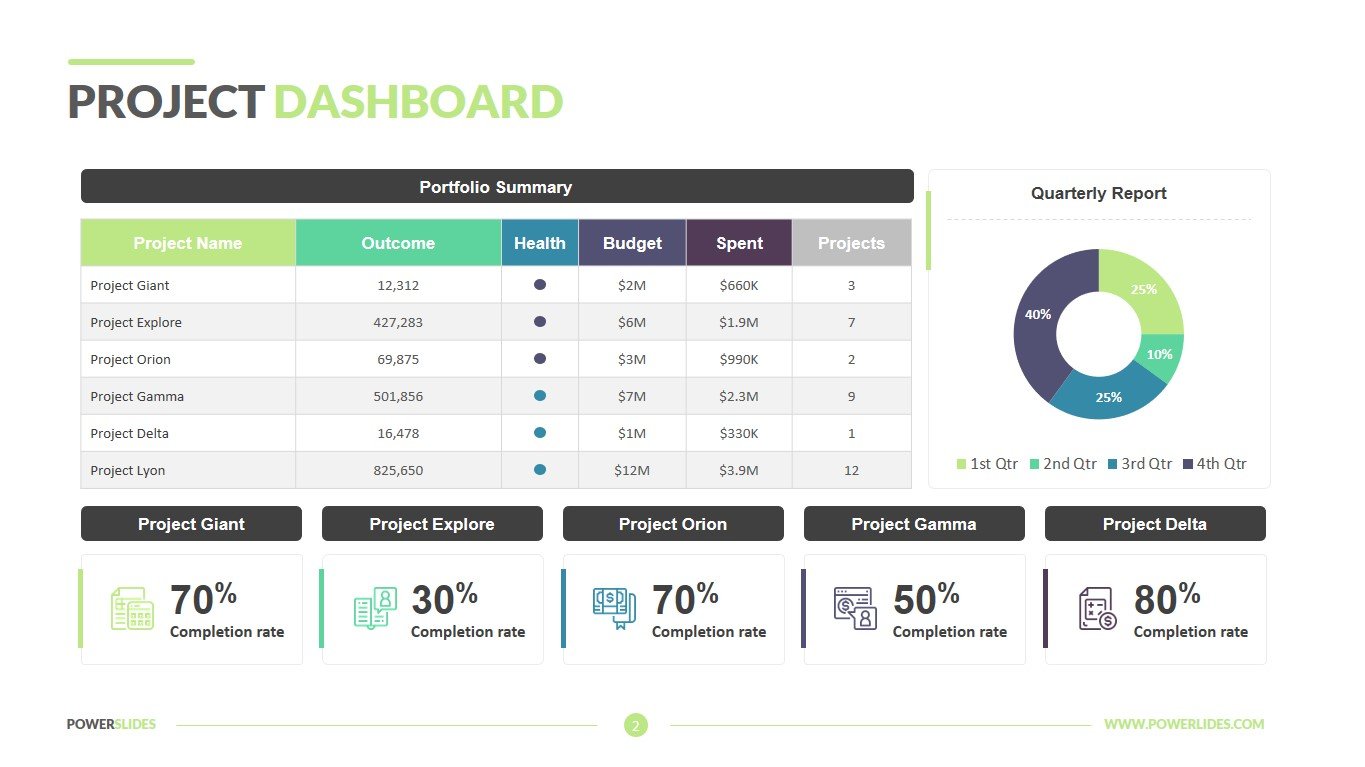
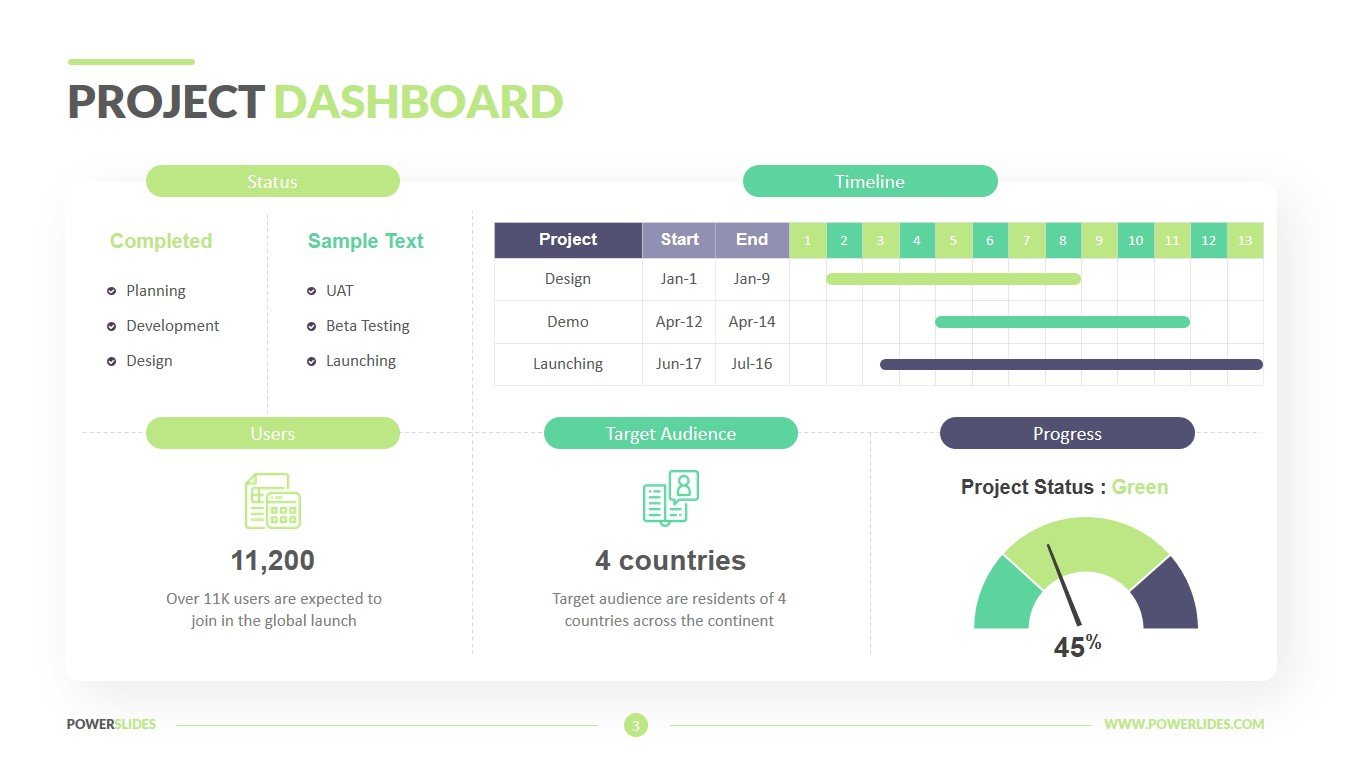
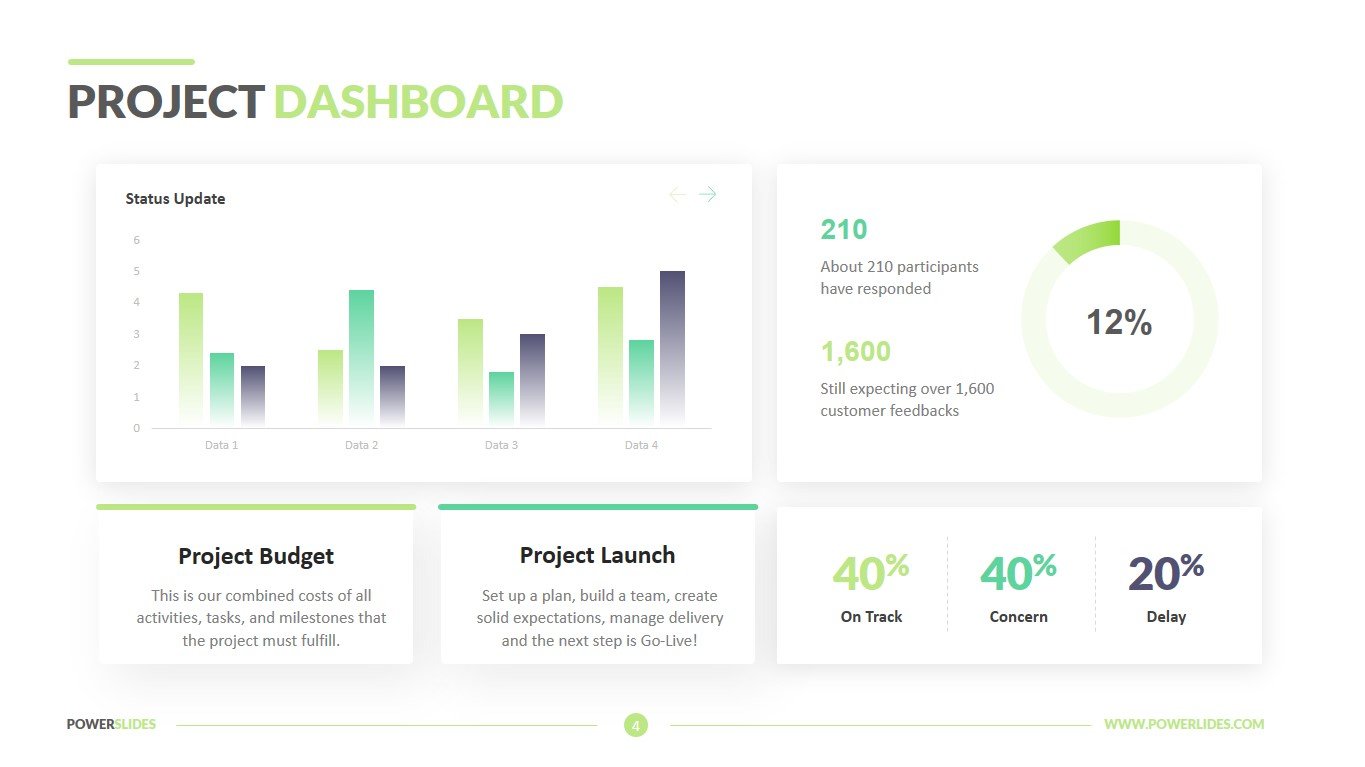
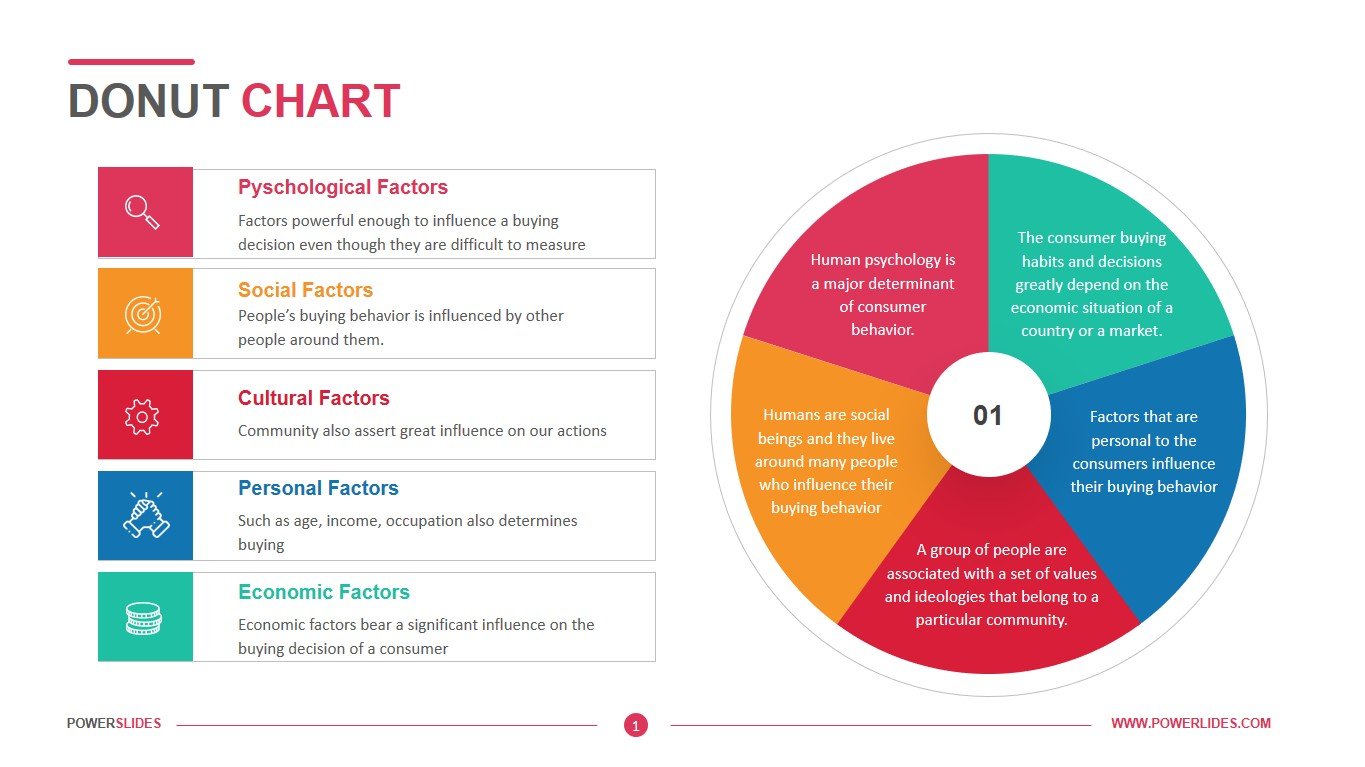
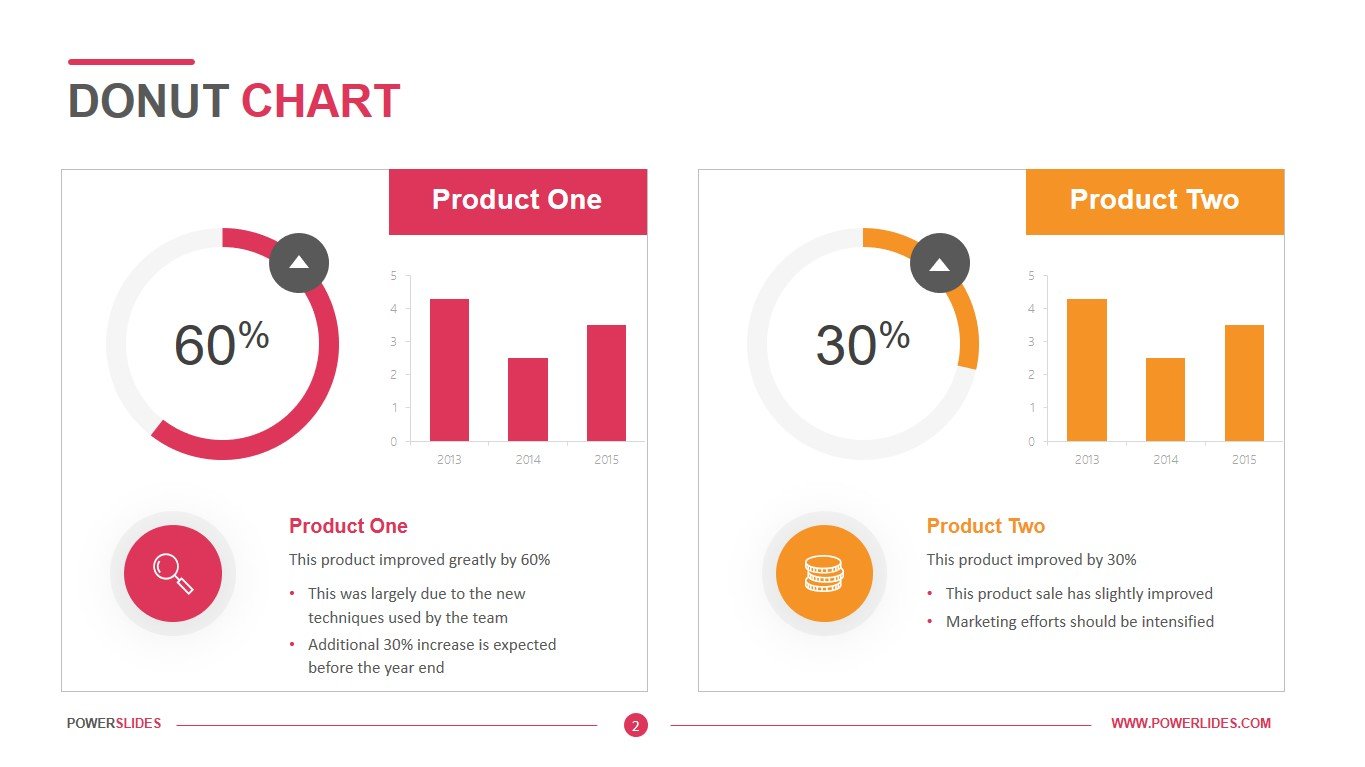
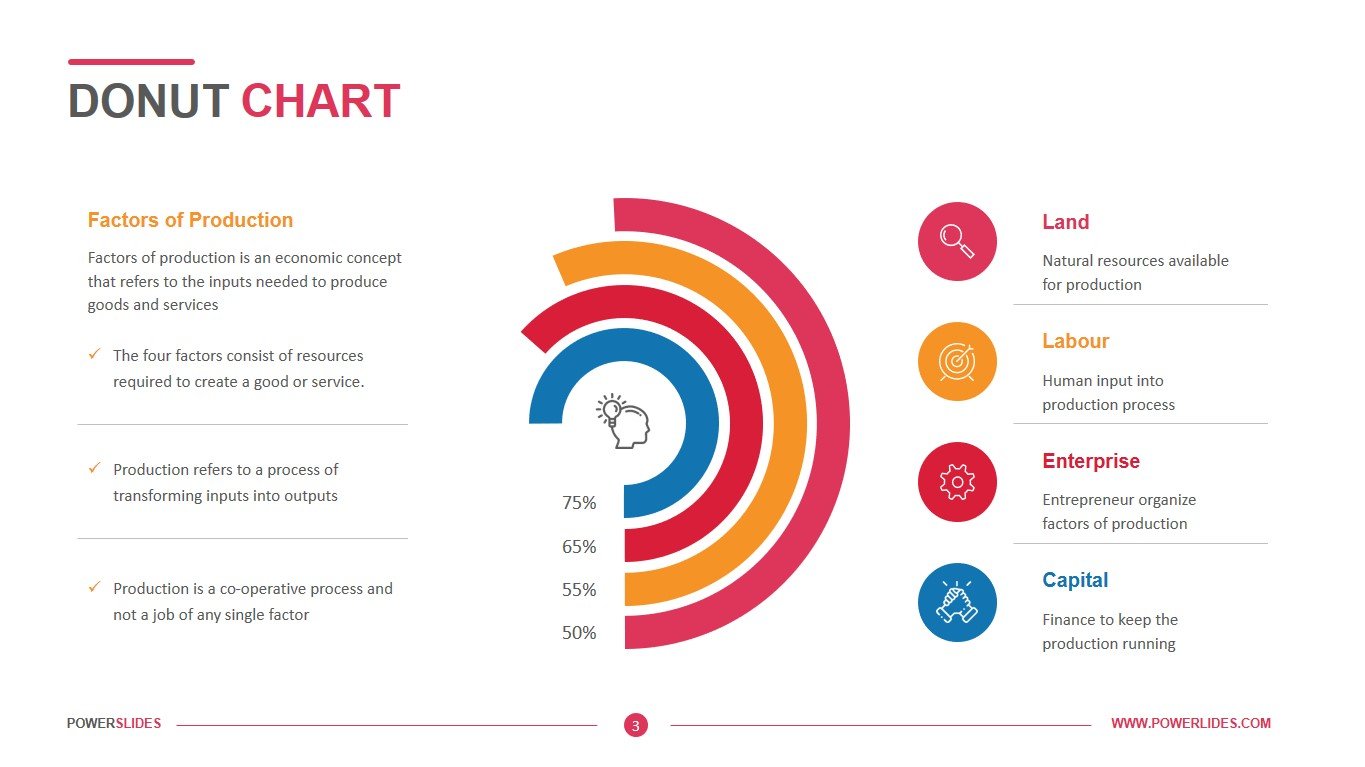
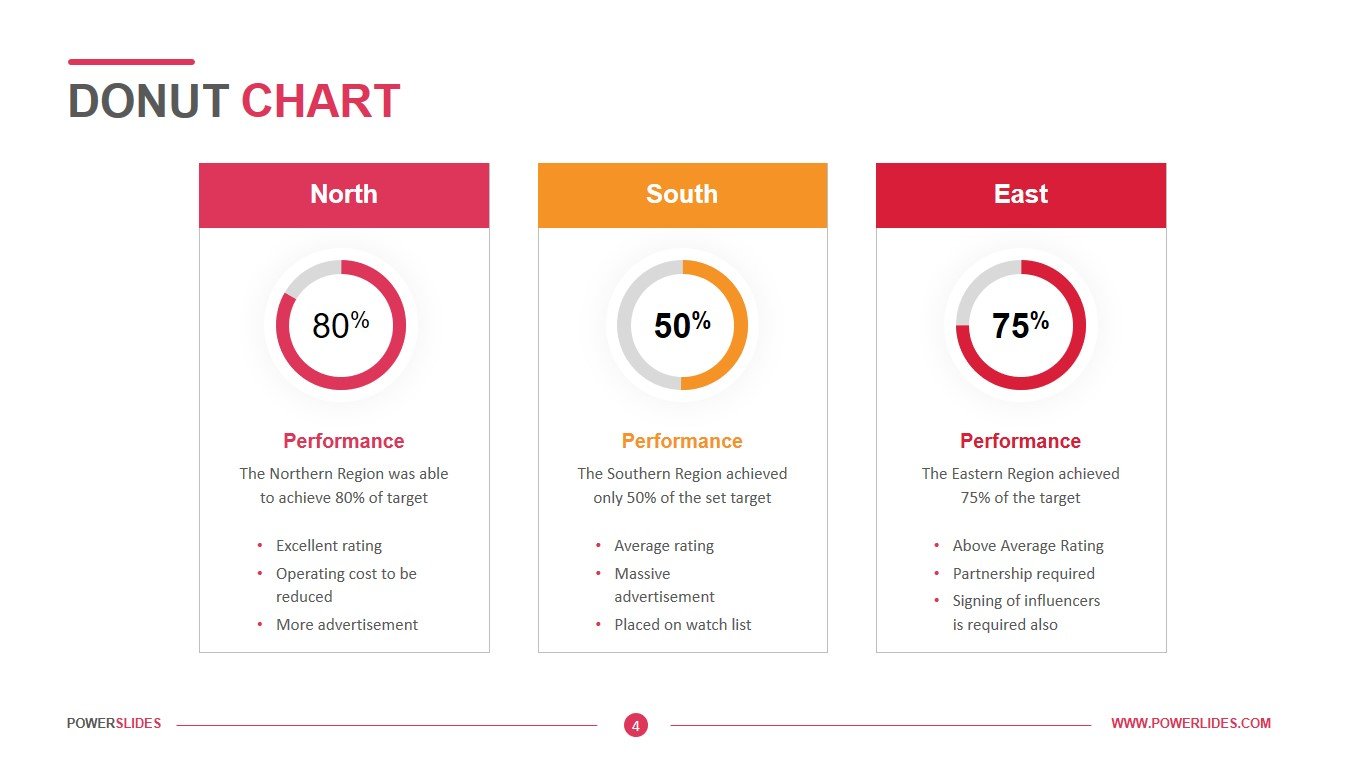
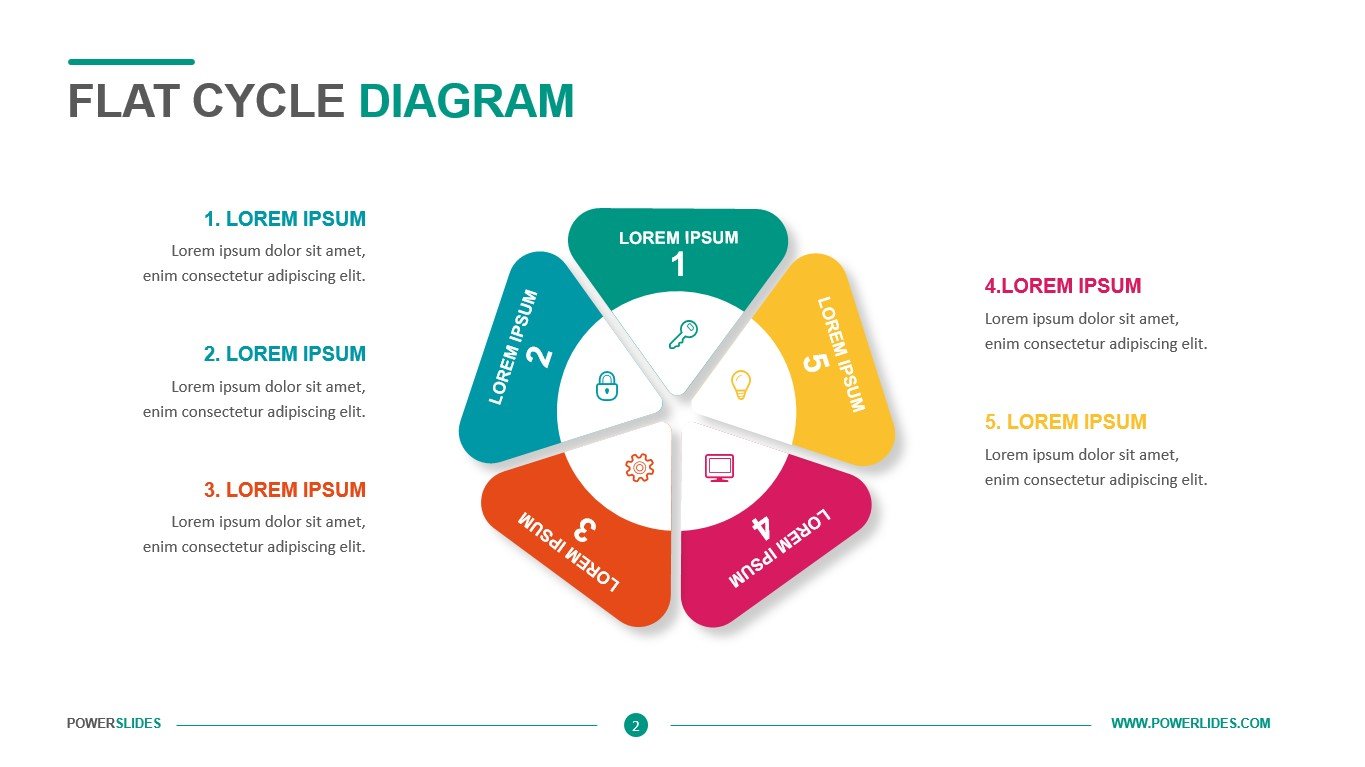
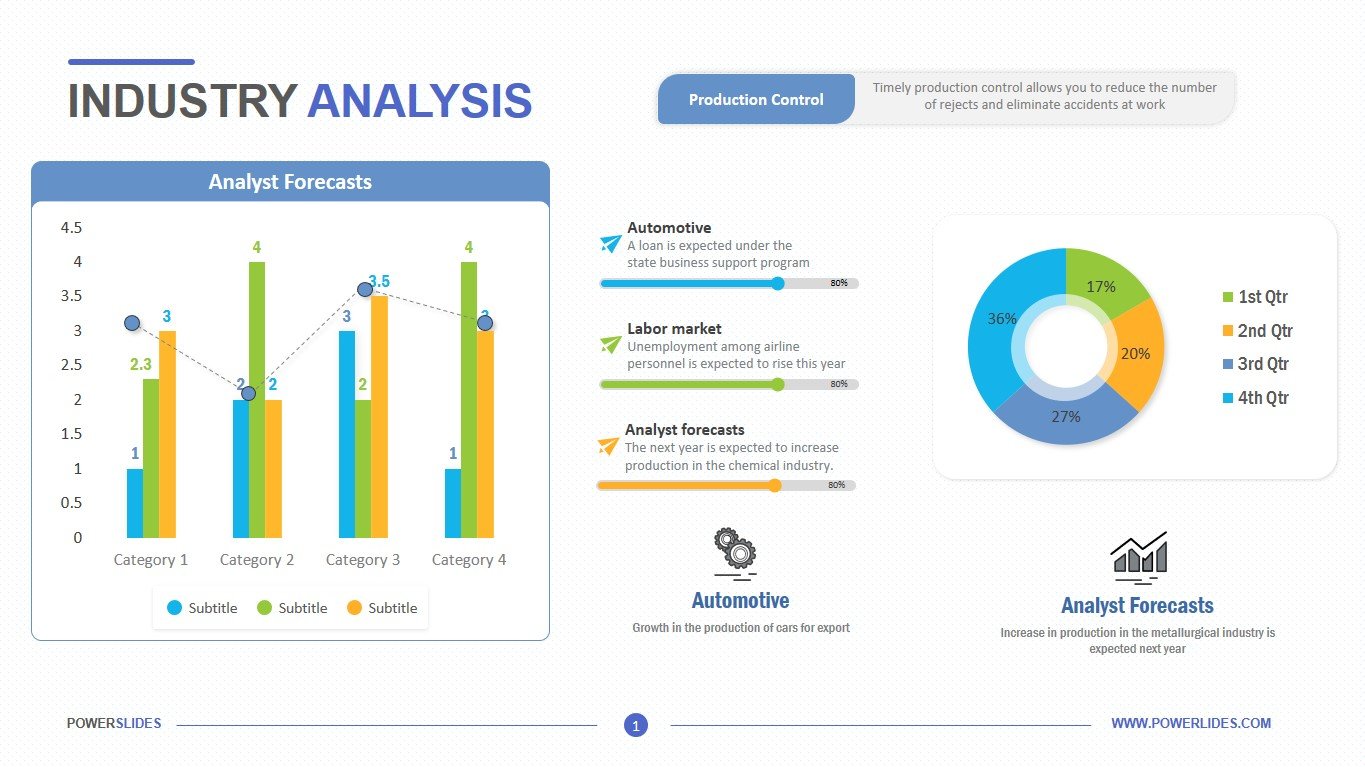
This template contains all the tools you need to create a highly professional Industry Analysis presentation. Let’s take a look at these tools and how they can be applied in practice. The first slide gives you the opportunity to display data for four products for the analyzed period. The slide will be useful in analyzing the competitive environment and preparing to enter a new market. You can present your data on the risks of launching a new product, main competitors, and similar products in an accessible form. The slide will be useful to all sales and market development managers. The second slide gives you the opportunity to present the data in a speedometer chart. You can also compare sales across your main products. For example, you can compare sales by product category star and cash cow. The slide can also be used by logisticians when preparing a report on shipping costs by mode of transport. For example, the cost of using road transport, sea transport, and delivery of goods by rail. You can also use this slide to analyze the labor costs of each operation before and after purchasing new equipment. The next slide contains a huge variety of graphs and charts. This slide will definitely be useful for employees of the statistical and planning departments of the company. You can present your sales analysis data from last year, present data for each quarter, display the percentage of completion in a pie chart – all on one slide. This slide will also be useful for project managers and leaders in promising areas. The last slide can be used by owners of small firms to prepare an analysis of their activities for banks in order to obtain a loan for business expansion. Also, this slide can be used by business trainers in the preparation of their programs for managing cash flows and obtaining super-profits.These templates come in a variety of colors and themes and are completely edit-friendly. You can add, cut, paste, copy, duplicate, replace, interchange, or even remove a portion from the templates if you do need it. Moreover, adding texts and pictures for further clarity of the audience is even more easy than before if you want to do so. You can also change colors and add sub-titles too. The industry Analysis template will be useful to all department heads, small business owners.


