Stoplight Charts
What do you think of this template?

 (3.00/ 5)
6 ratings

 4 Slides
 File size: 16:9
 Fonts: Lato Black, Calibri
 Supported version
PPT 2010, PPT 2013, PPT 2016
Supported version
PPT 2010, PPT 2013, PPT 2016

Product details
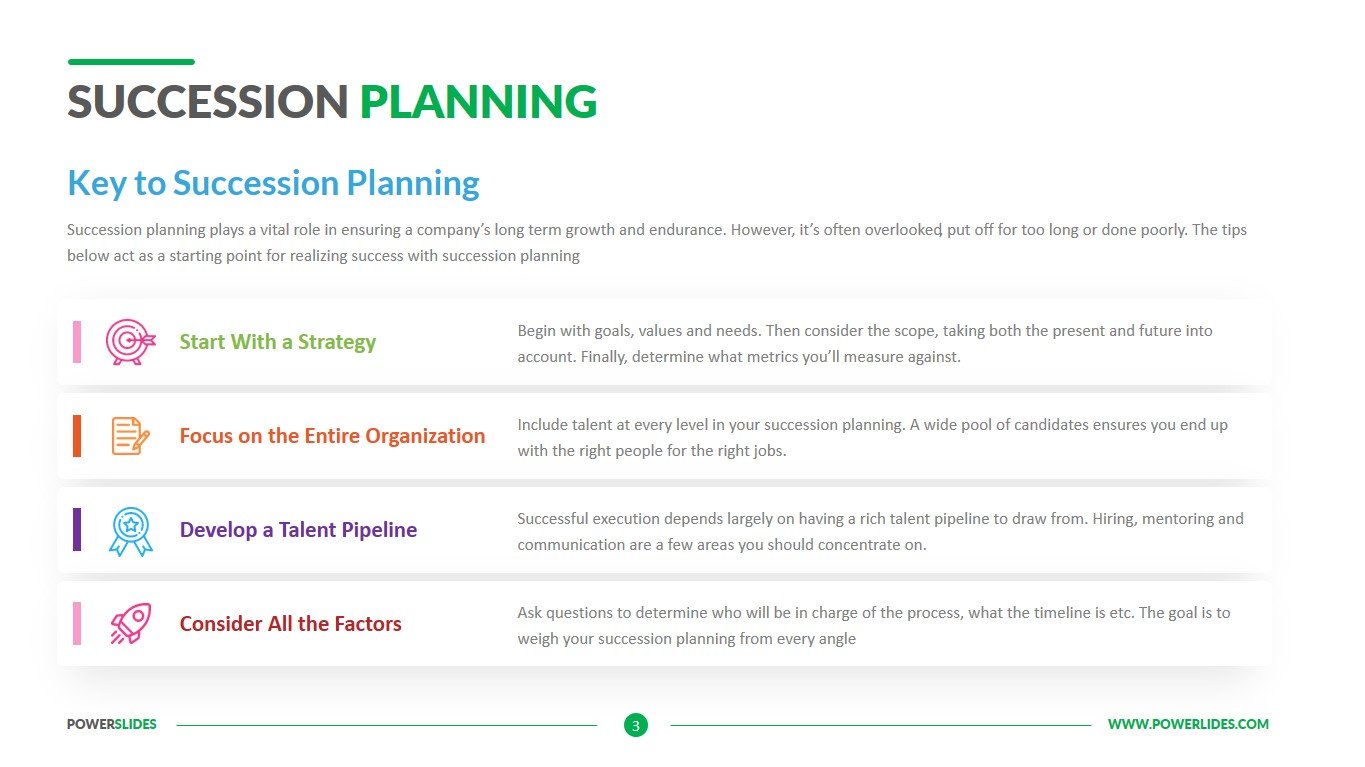
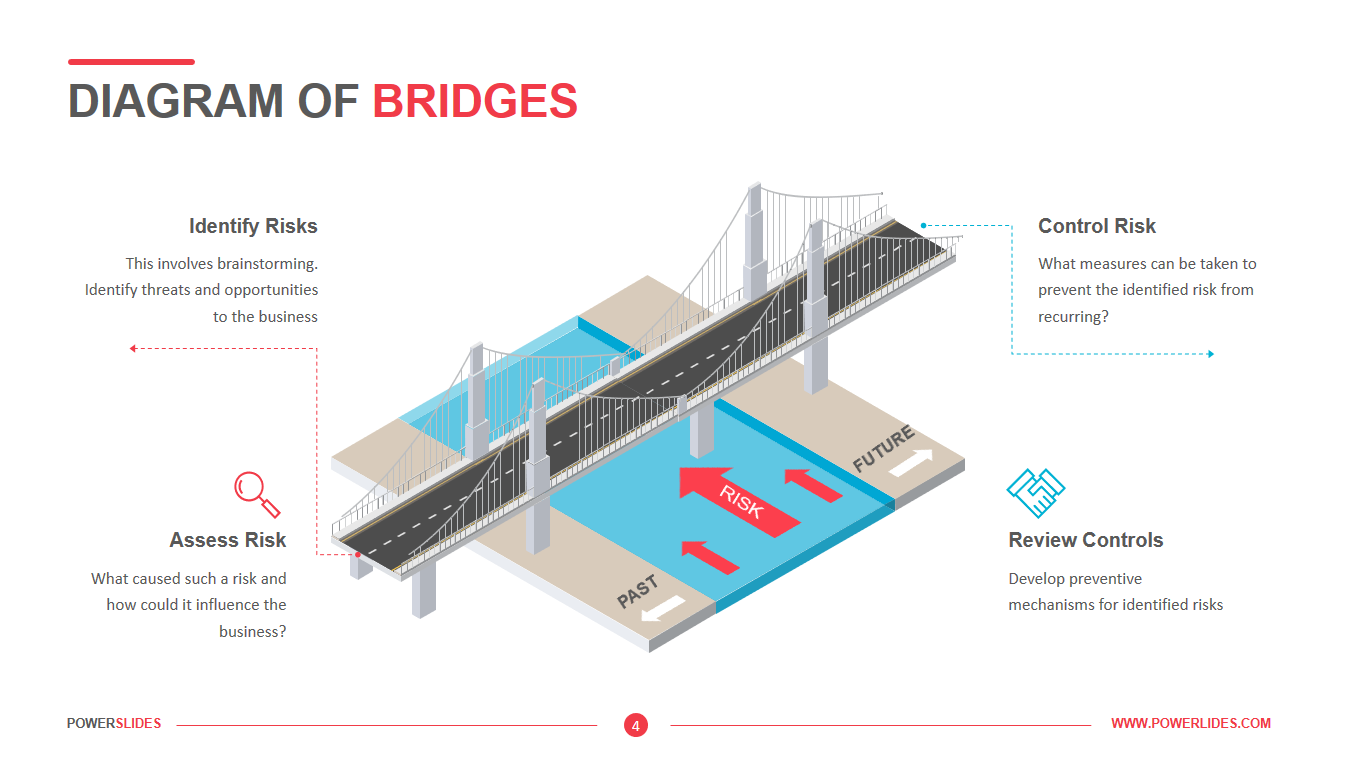
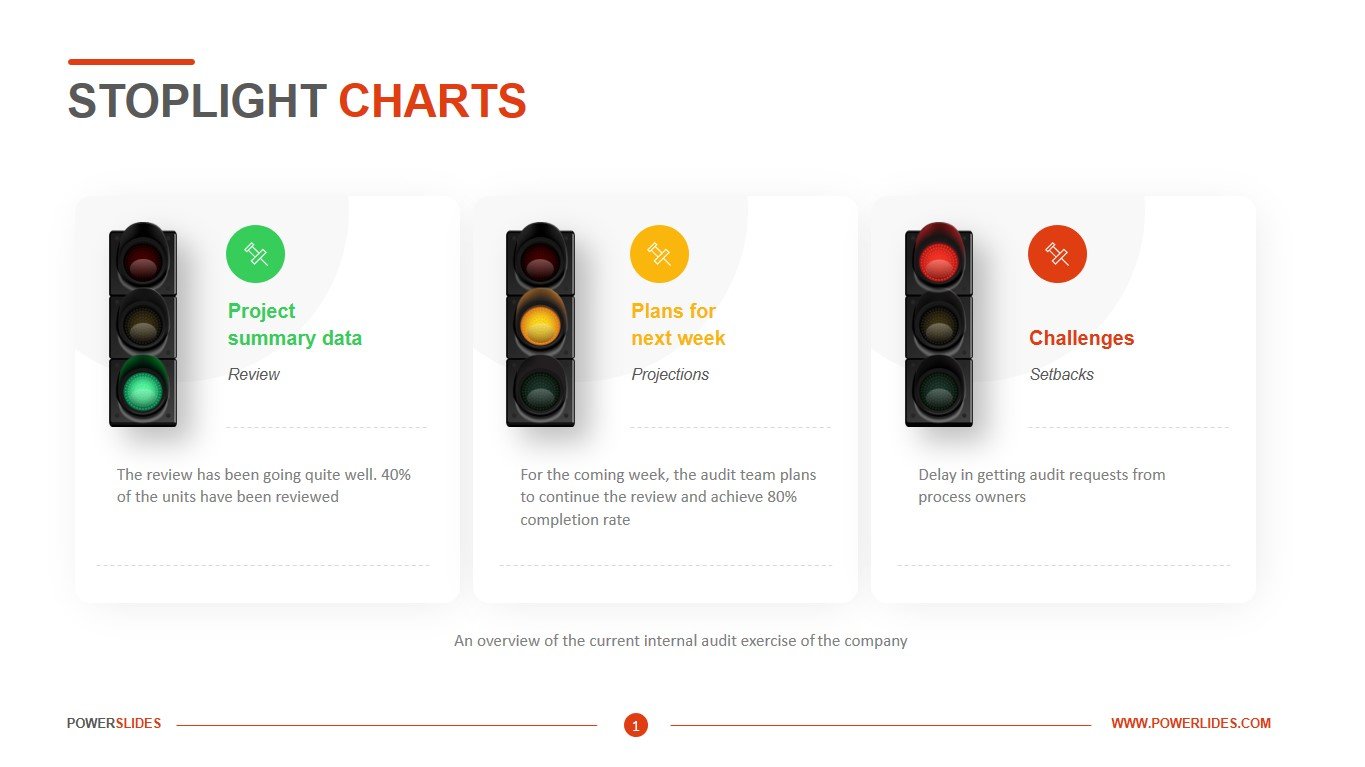
Sometimes it becomes necessary to immediately draw the attention of the audience to the problem. But how to do this if you have a lot of numbers and complex data? One solution to this problem could be using a stoplight chart. These diagrams allow you to display the status of risks using color displays. Typically, red, green, and yellow (traffic light) colors are used to indicate the status of mitigation actions or risk exposure, depending on the elements identified by the project. Green color – everything is fine, there are no failures in the project. Yellow color – there are some difficulties and problems, but they are controllable and will be fixed soon. Red color – urgent need for intervention and outside help. Use this tool to provide decision-makers with an overview of how plans work and whether additional action is required. You can also use this tool to add information to any risk management status tracking chart. The advantages of this tool are simplicity and speed of customization. It also allows you to focus on important elements of risk or plans that are not working. If used with an indicator of its progress, will illustrate the plan’s history and immediate progress if an item has gotten better or worse. A good indicator is an upward arrow or downward arrow to indicate stoplight status has gotten better or gotten worse since last report.
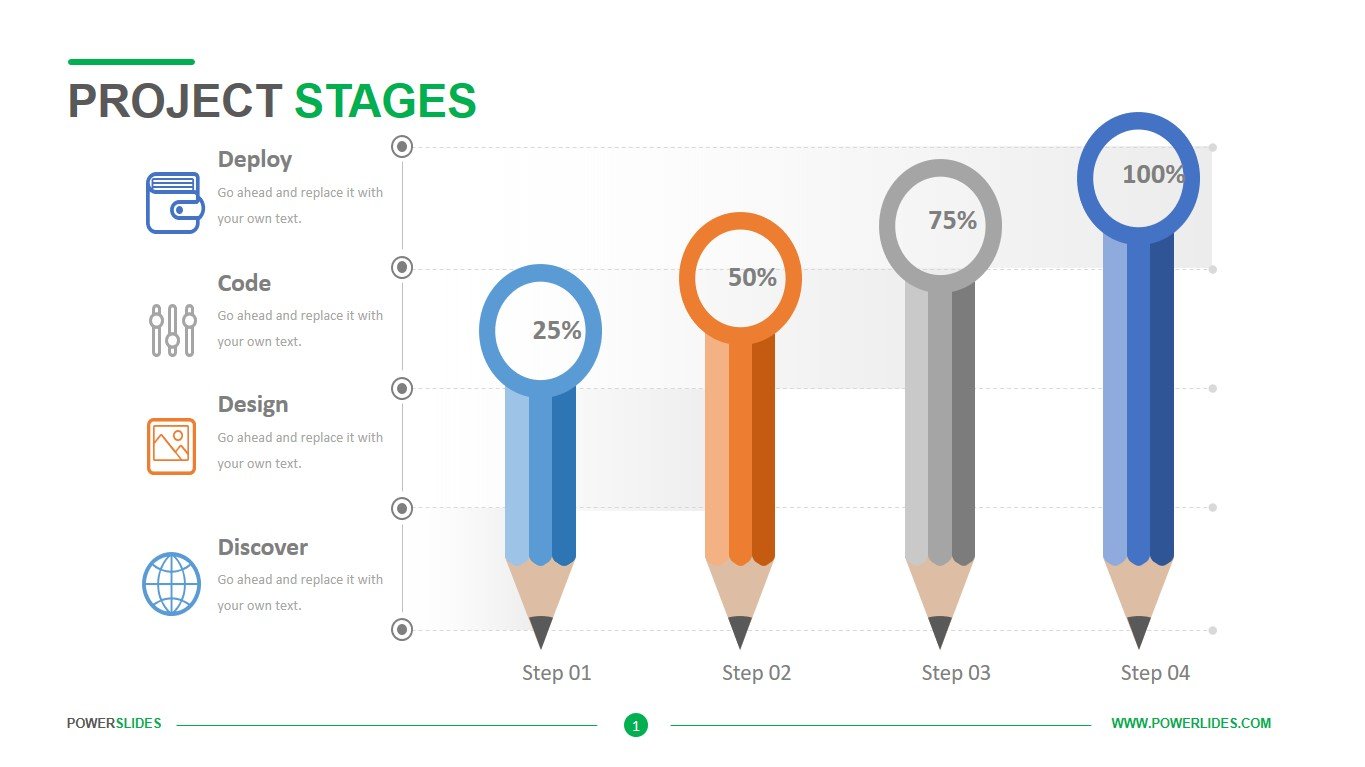
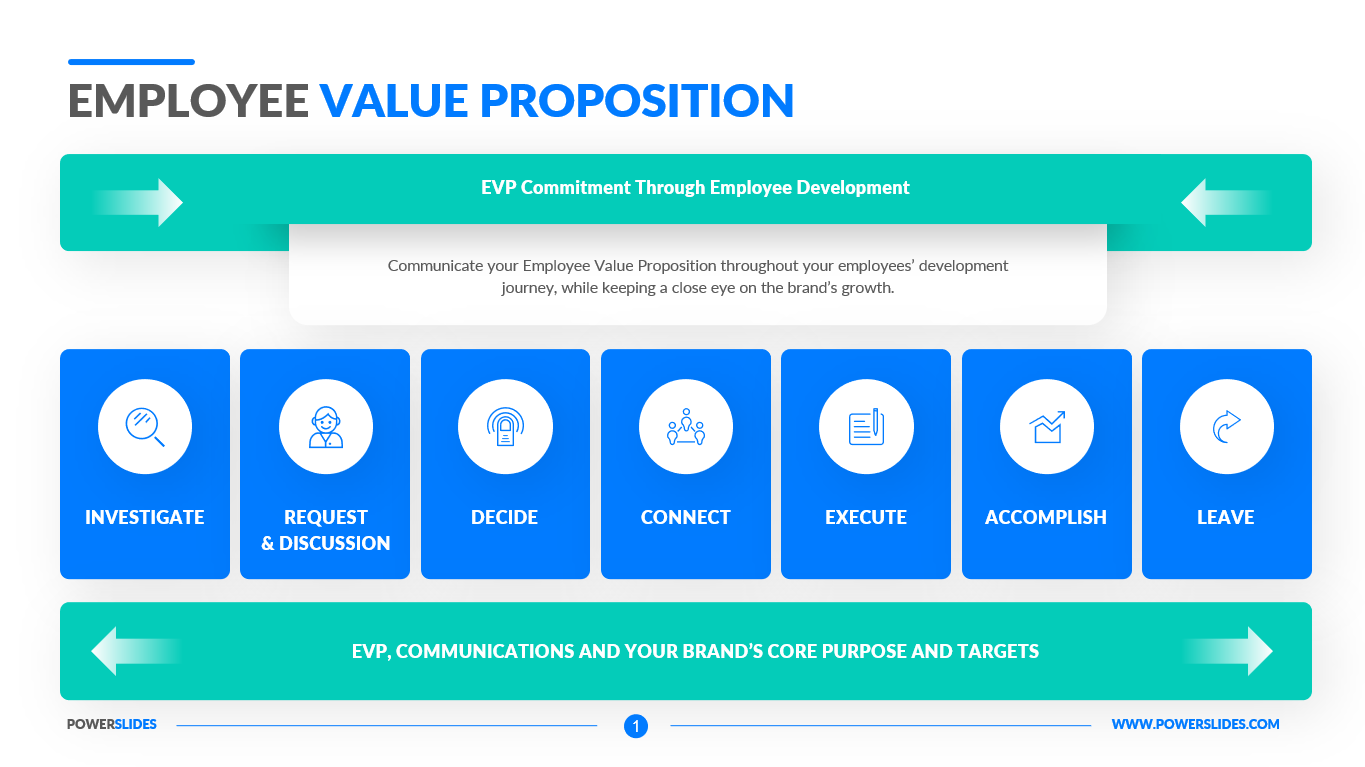
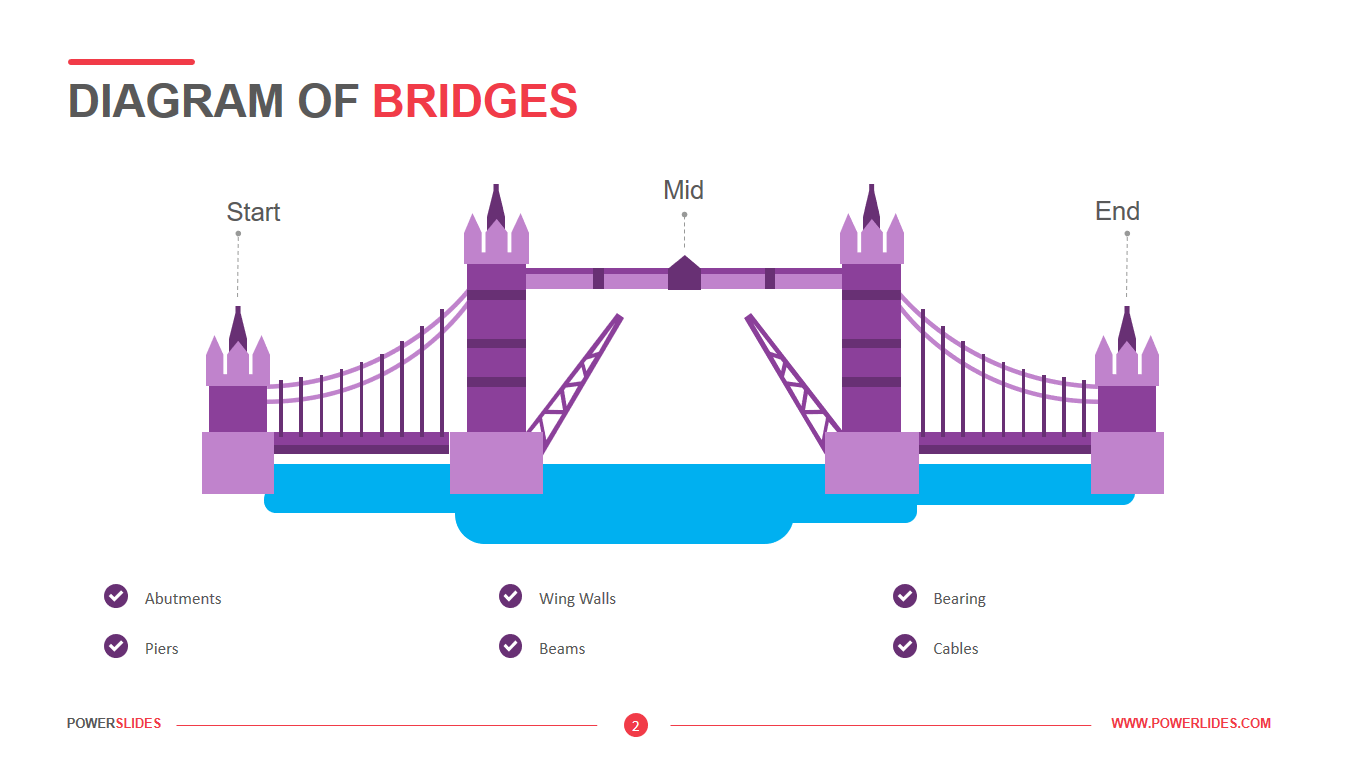
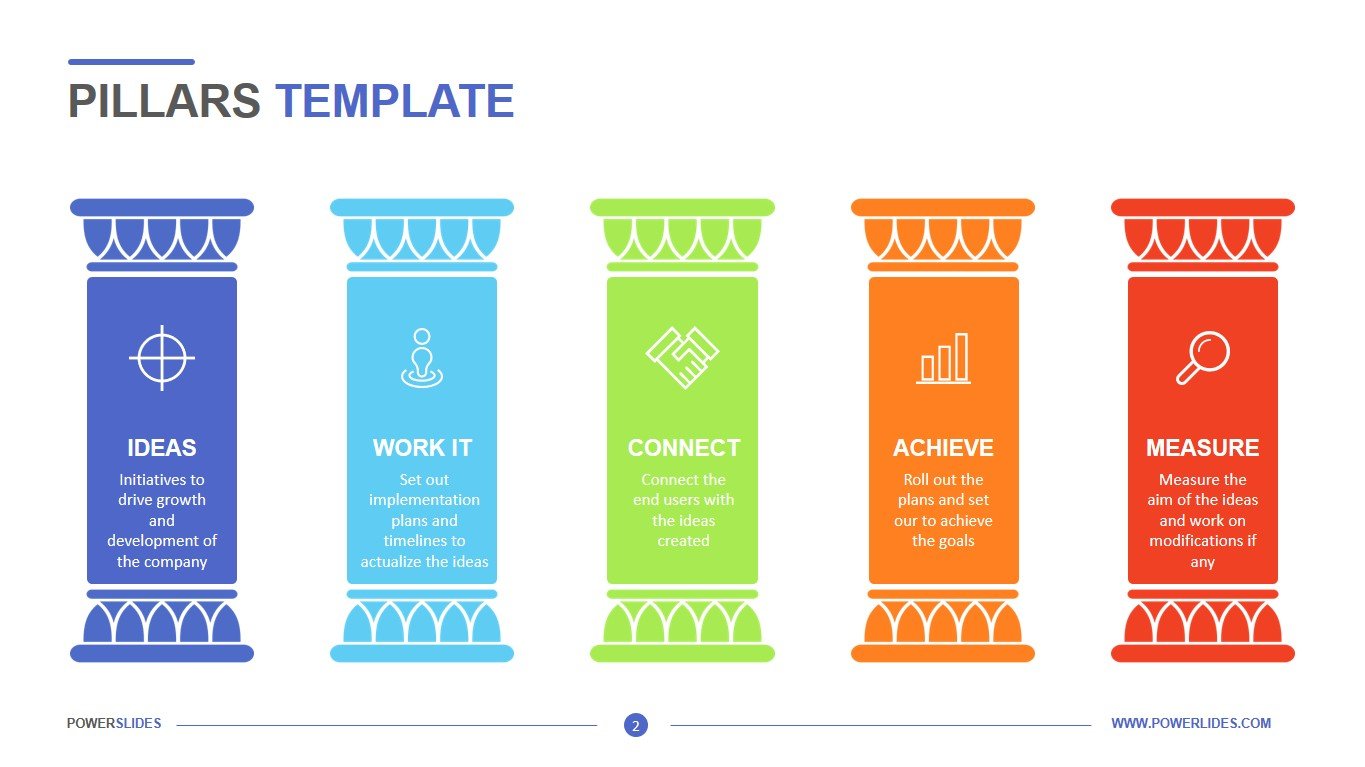
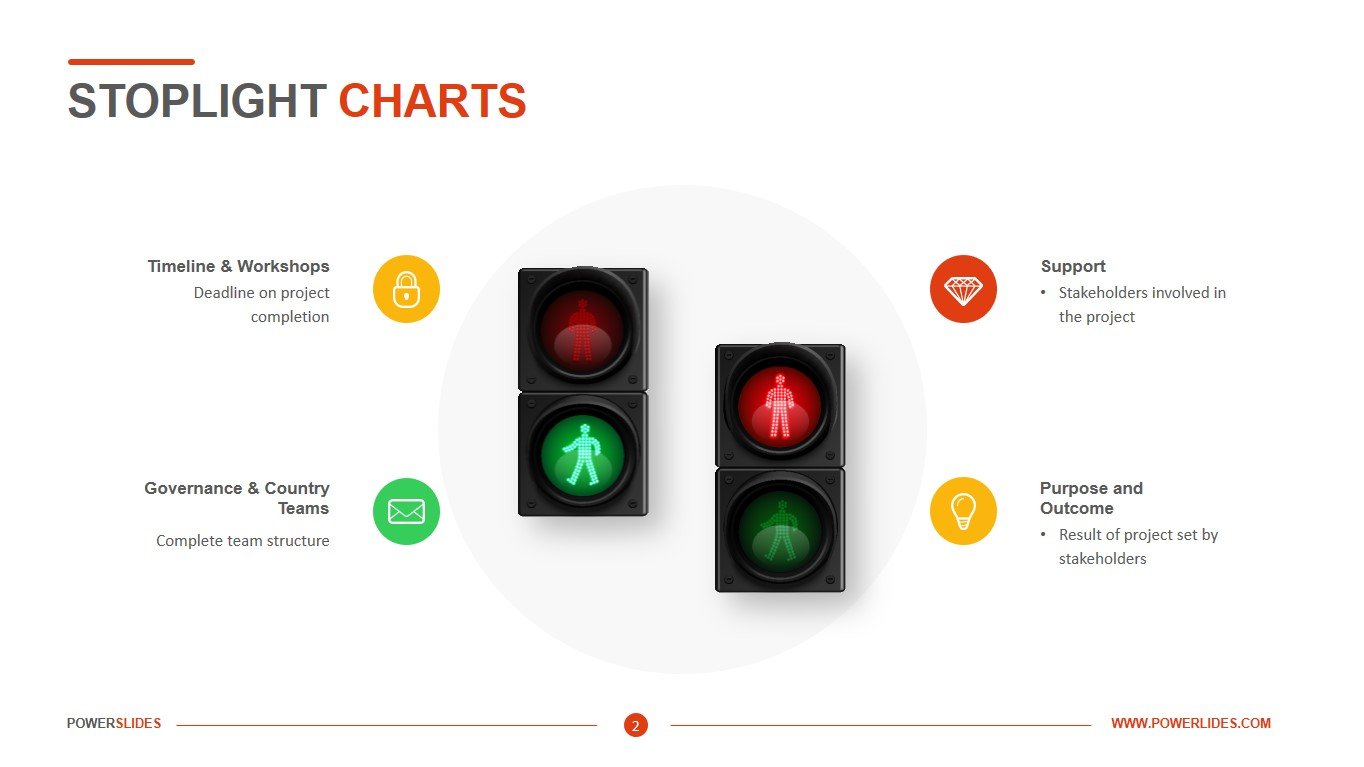
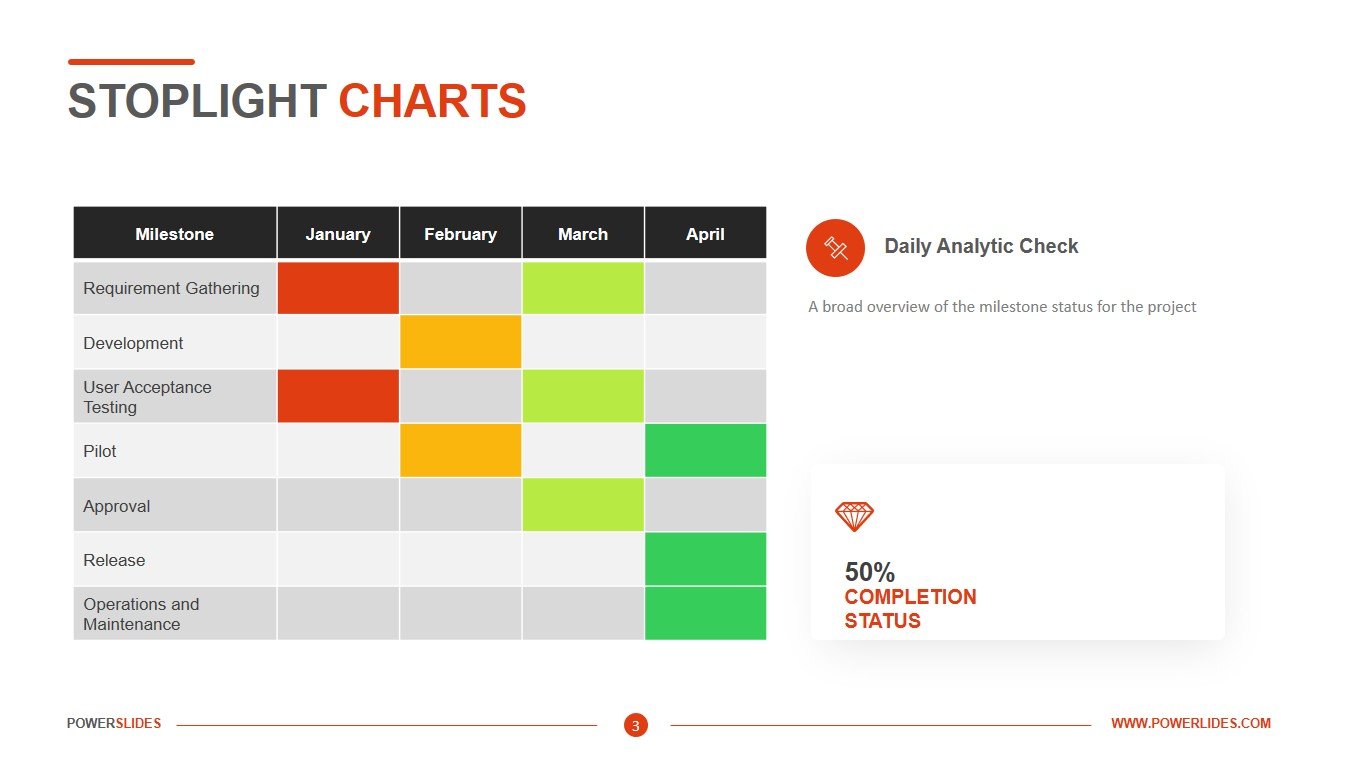
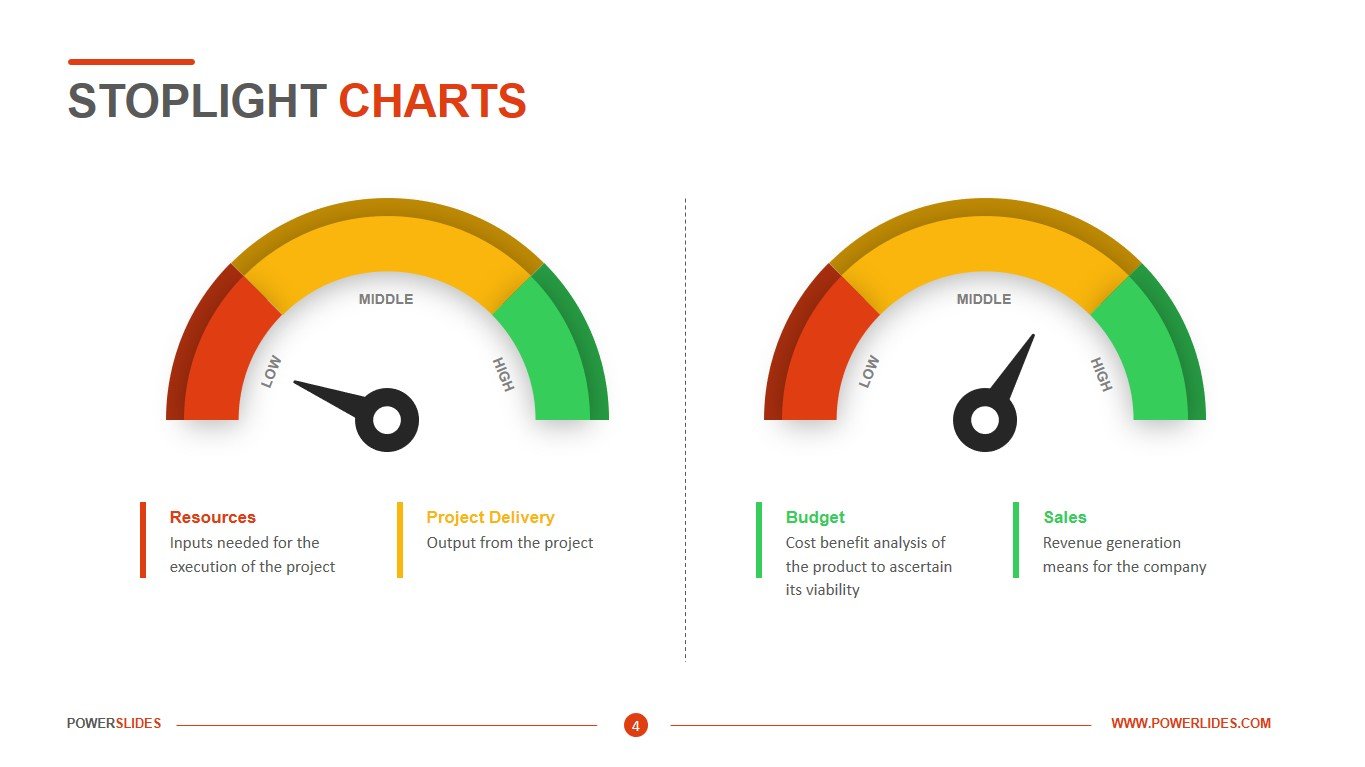
Stoplight Charts consists of four slides that have the modern tools you need to build a professional presentation. The first slide is represented by three traffic lights. Each of these traffic lights has a different color. This slide will be useful for project managers and department heads. You can show the status of the project and describe the progress in more detail on the following slides. The next slide is presented in the form of pedestrian traffic lights. The slide will be useful for marketers and advertising specialists. For example, you can show the launch status for each stage of your advertising campaign. Also, this slide will be useful in drawing up various safety instructions. For example, use red at the beginning of the instruction – not all steps of the instruction have been completed. After checking all the steps of the instructions, place the traffic light green – you can start working. The third slide is presented in the form of a table. This slide will be useful when displaying a large project with many stages. For example, you can display in a table the stages of plan execution by different departments. The audience will immediately understand the general state of the project. If the color is green, then the project is going according to plan. The last slide is made in the form of a speedometer and will immediately attract the attention of the audience with its non-standard shape.
Stoplight Charts template will be useful for financiers and economists when drawing up a report on the implementation of the company’s budget. Also, this slide will be useful for logisticians and specialists of the purchasing department when preparing a report on the supply of goods for a large project. Business trainers and university professors can use this template when preparing their courses.


