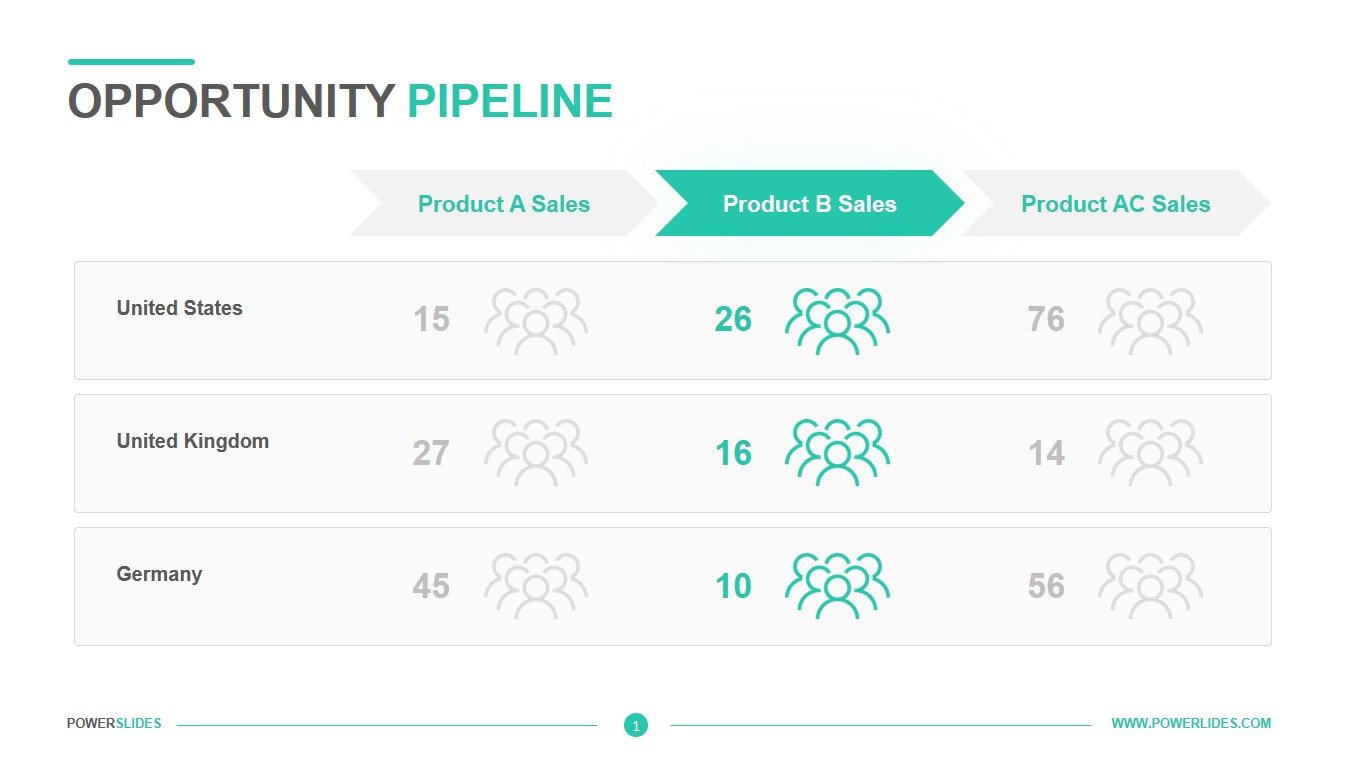
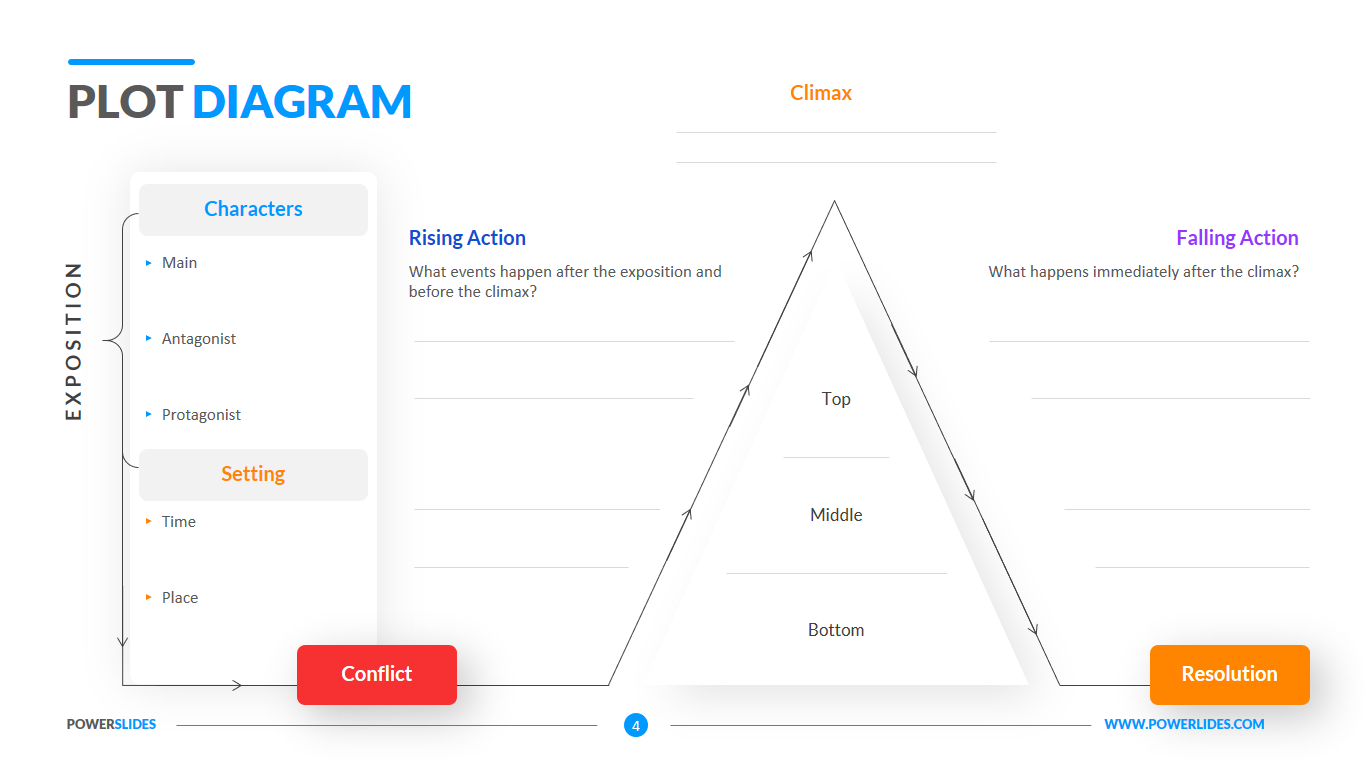
Diagram of Bridges
What do you think of this template?
 (5.00/ 5)
10 ratings

 4 Slides
 File size: 16:9
 Fonts: Lato, Calibri
 Supported version
PPT 2010, PPT 2013, PPT 2016
Supported version
PPT 2010, PPT 2013, PPT 2016

Product details
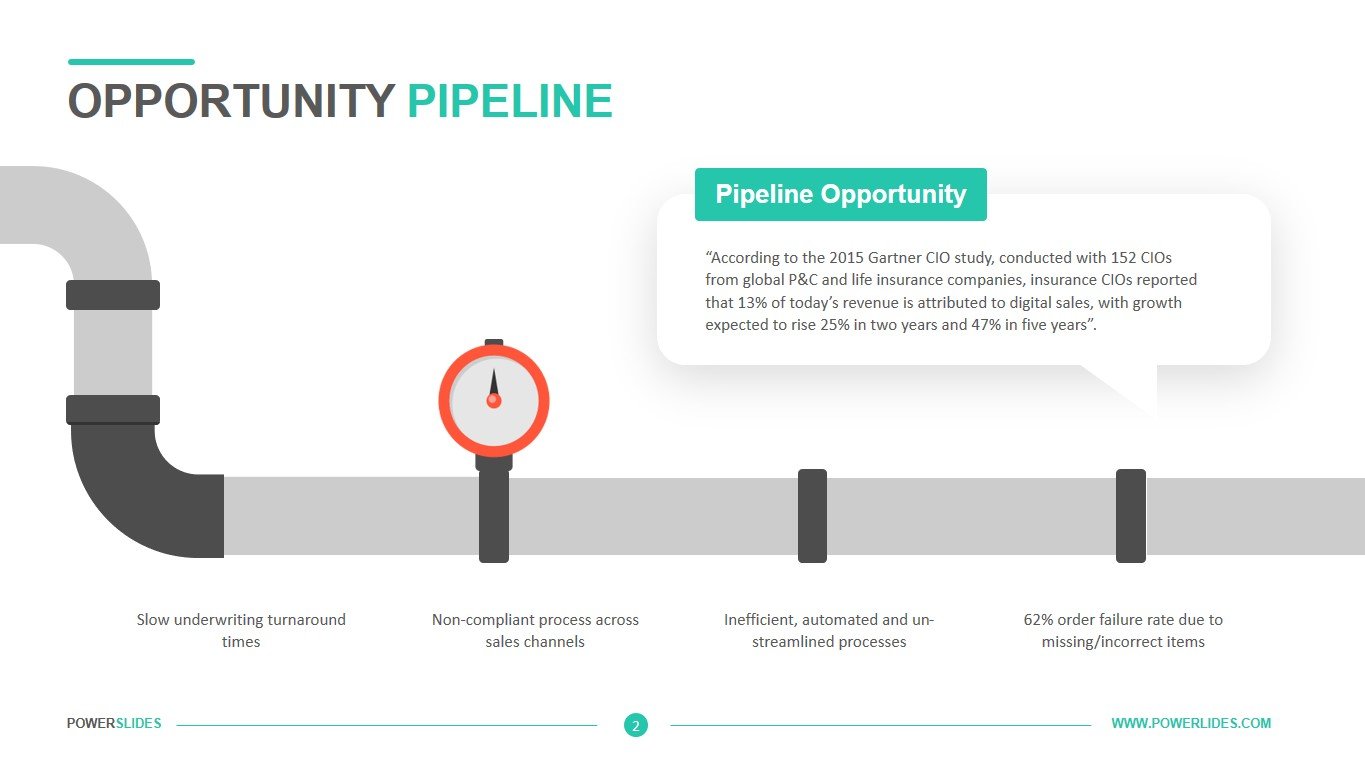
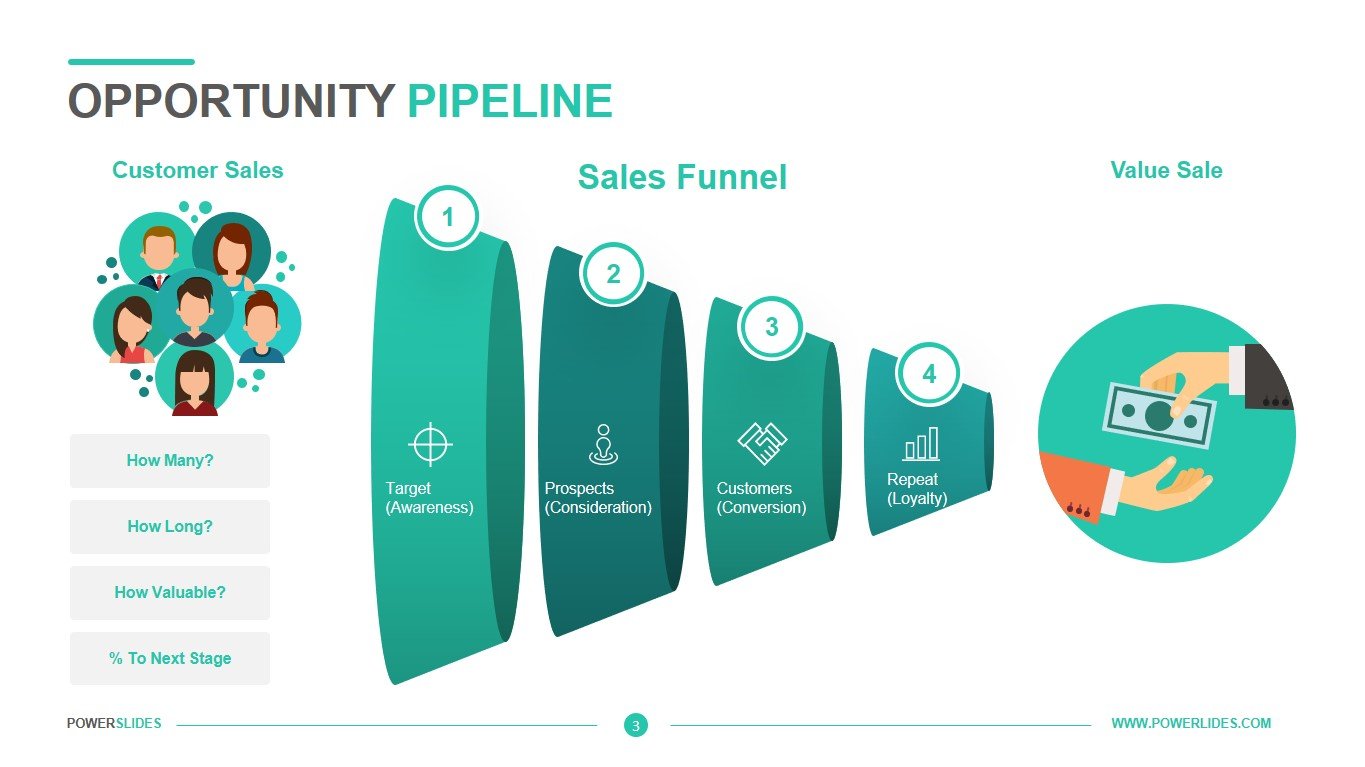
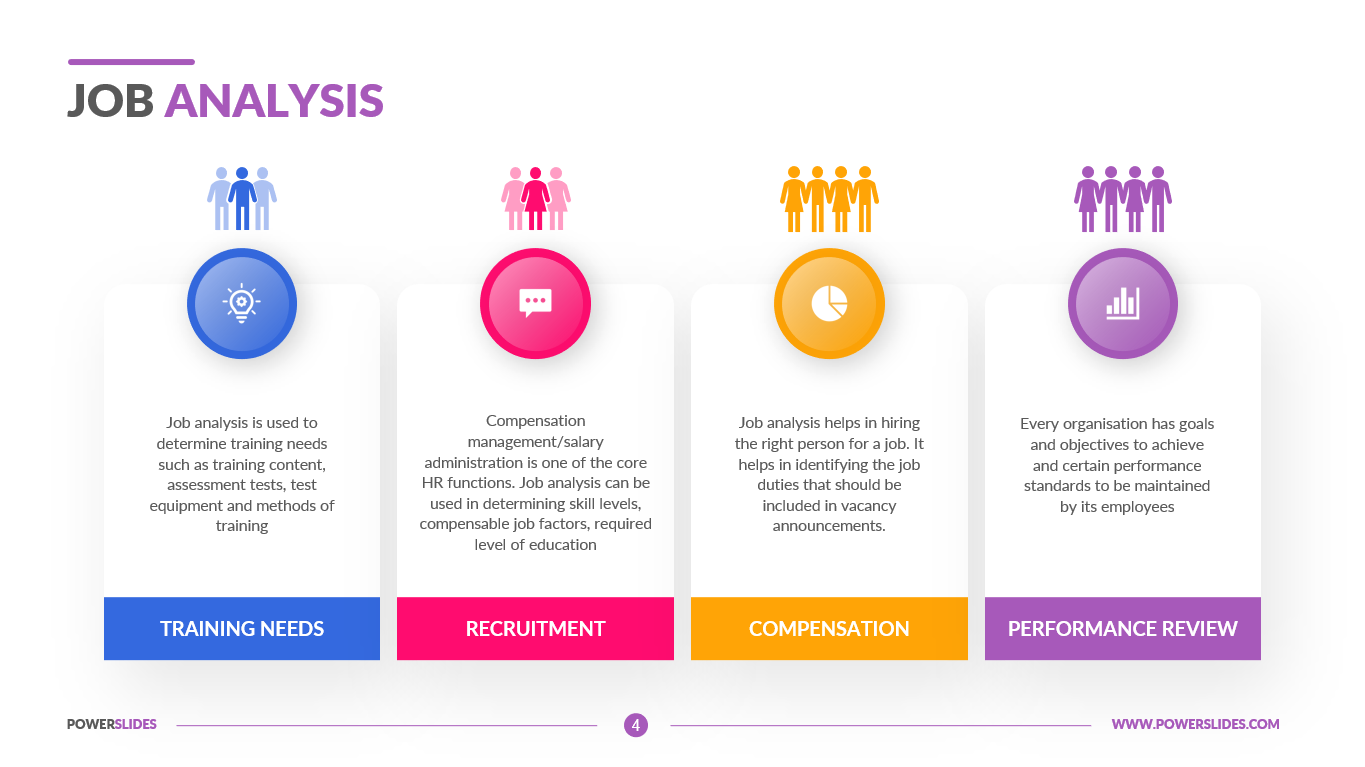
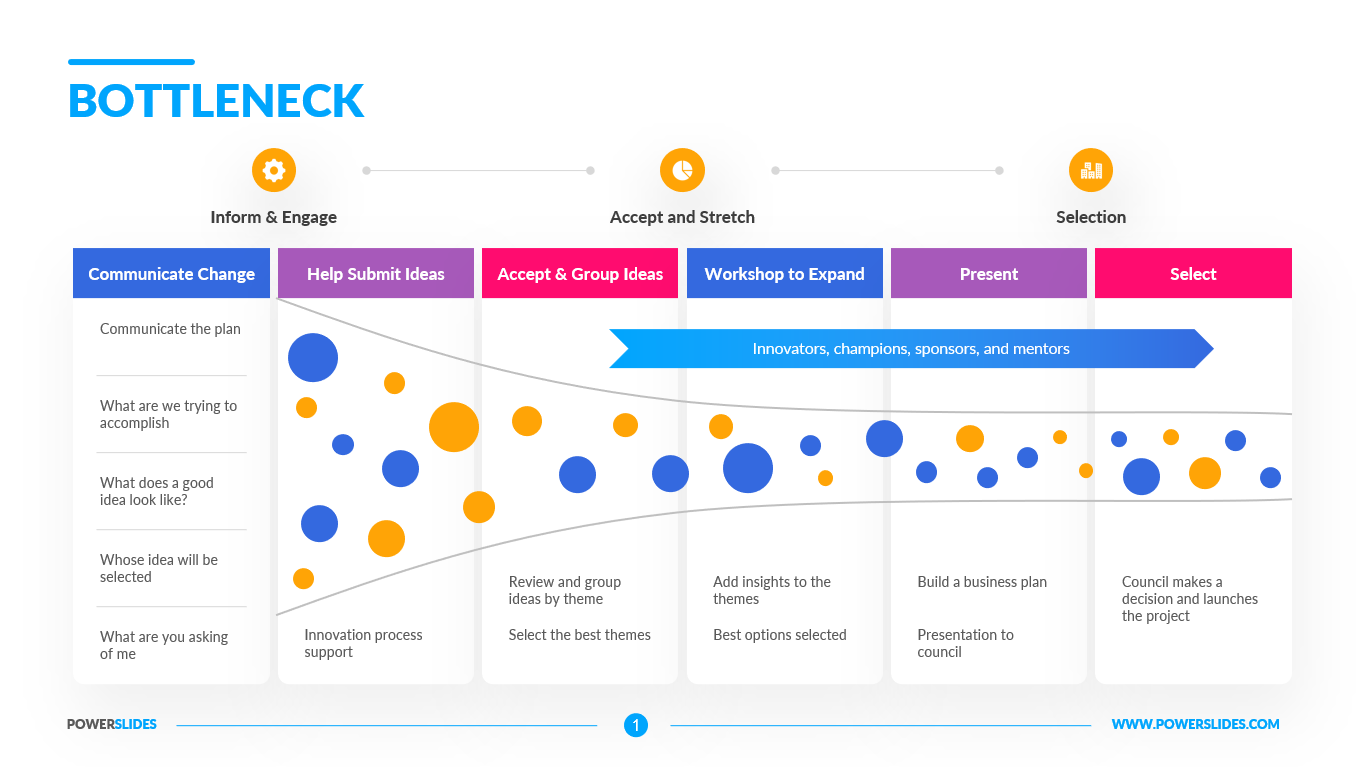
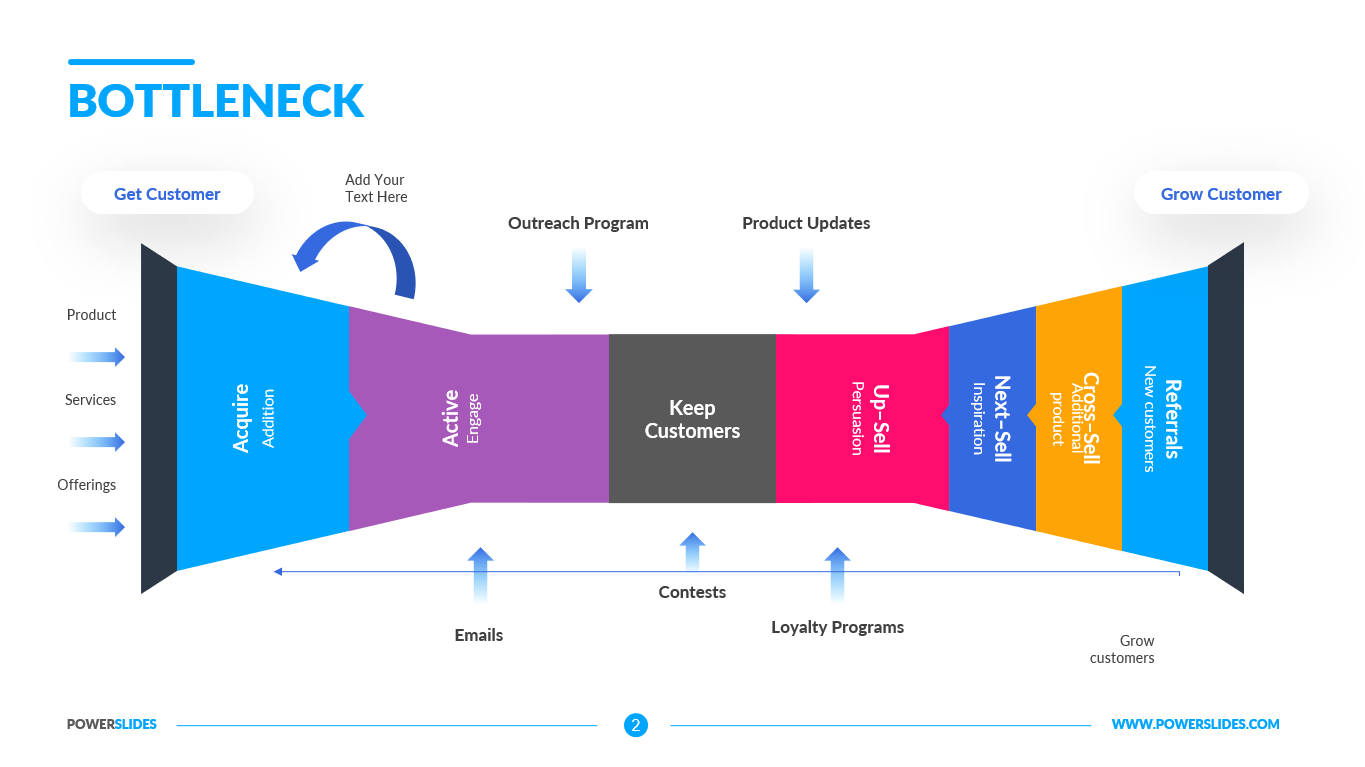
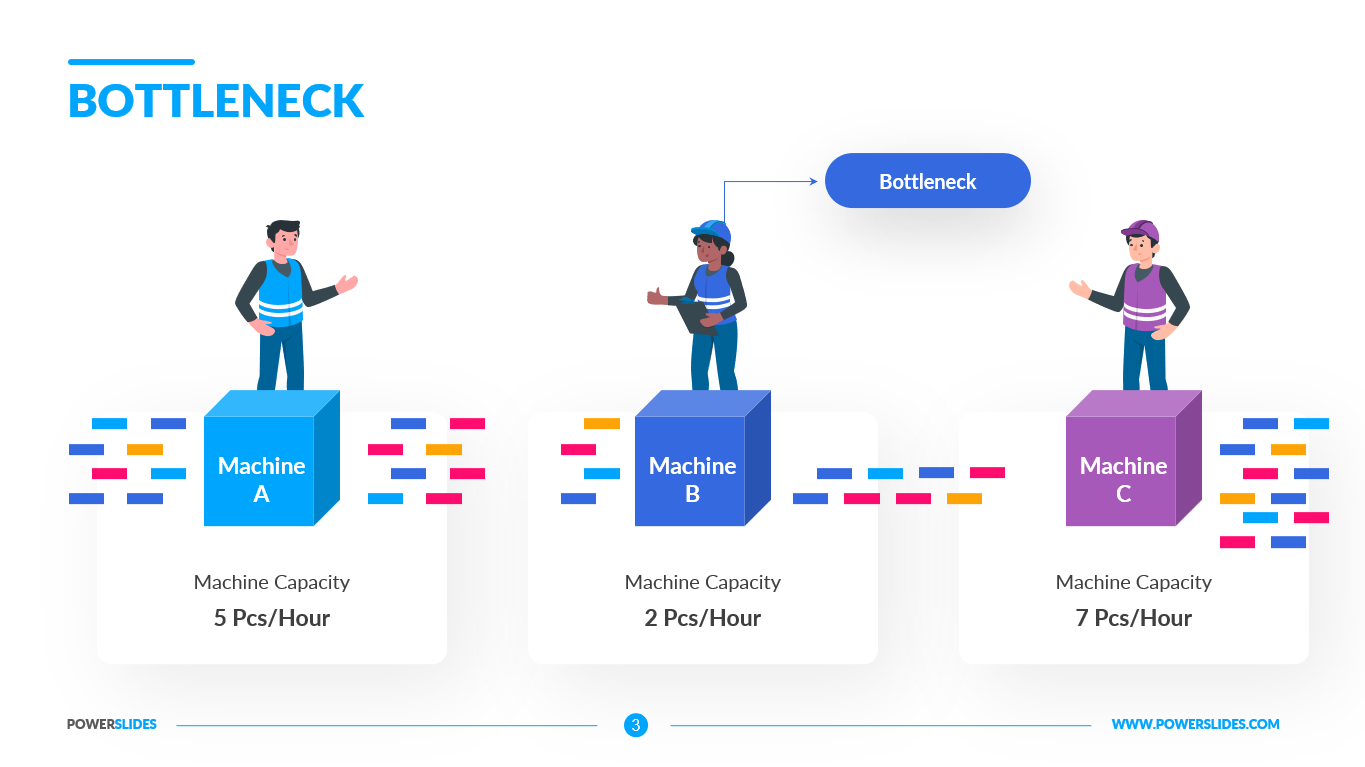
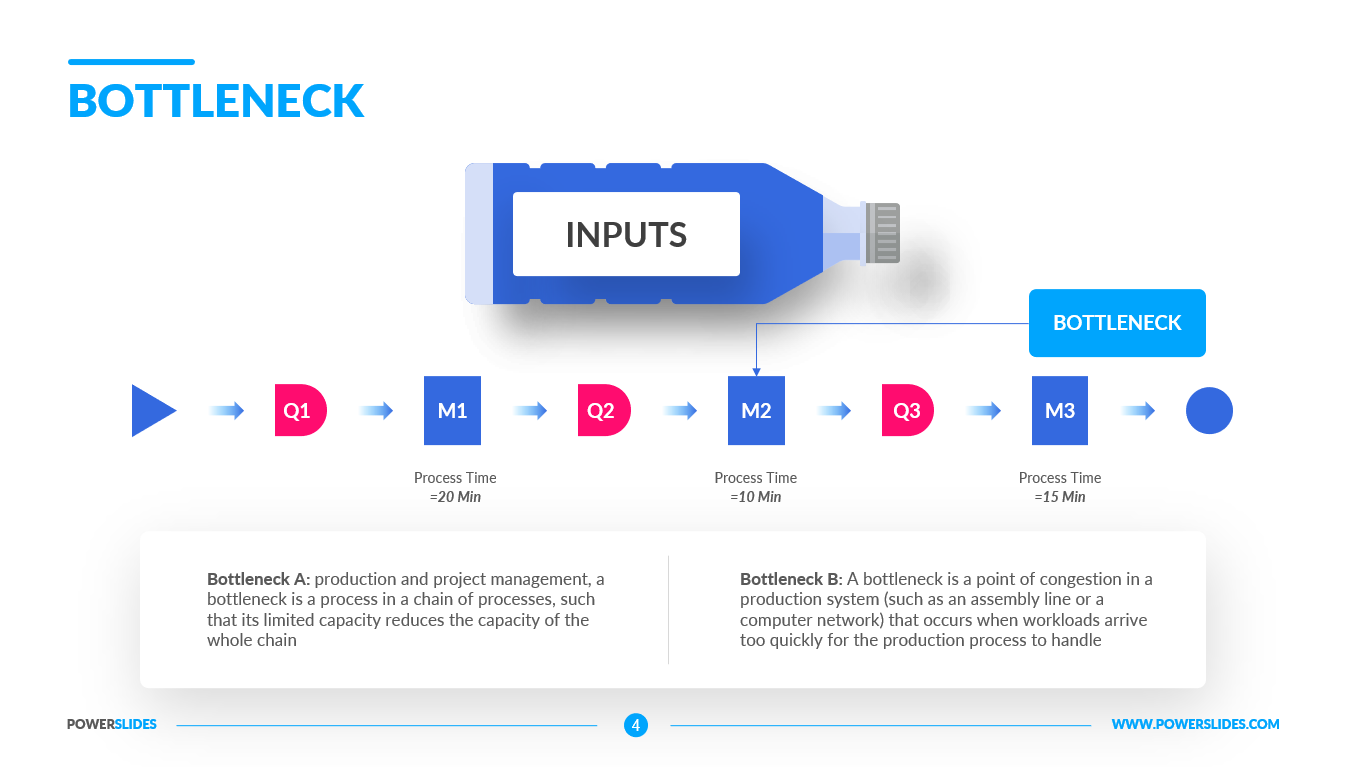
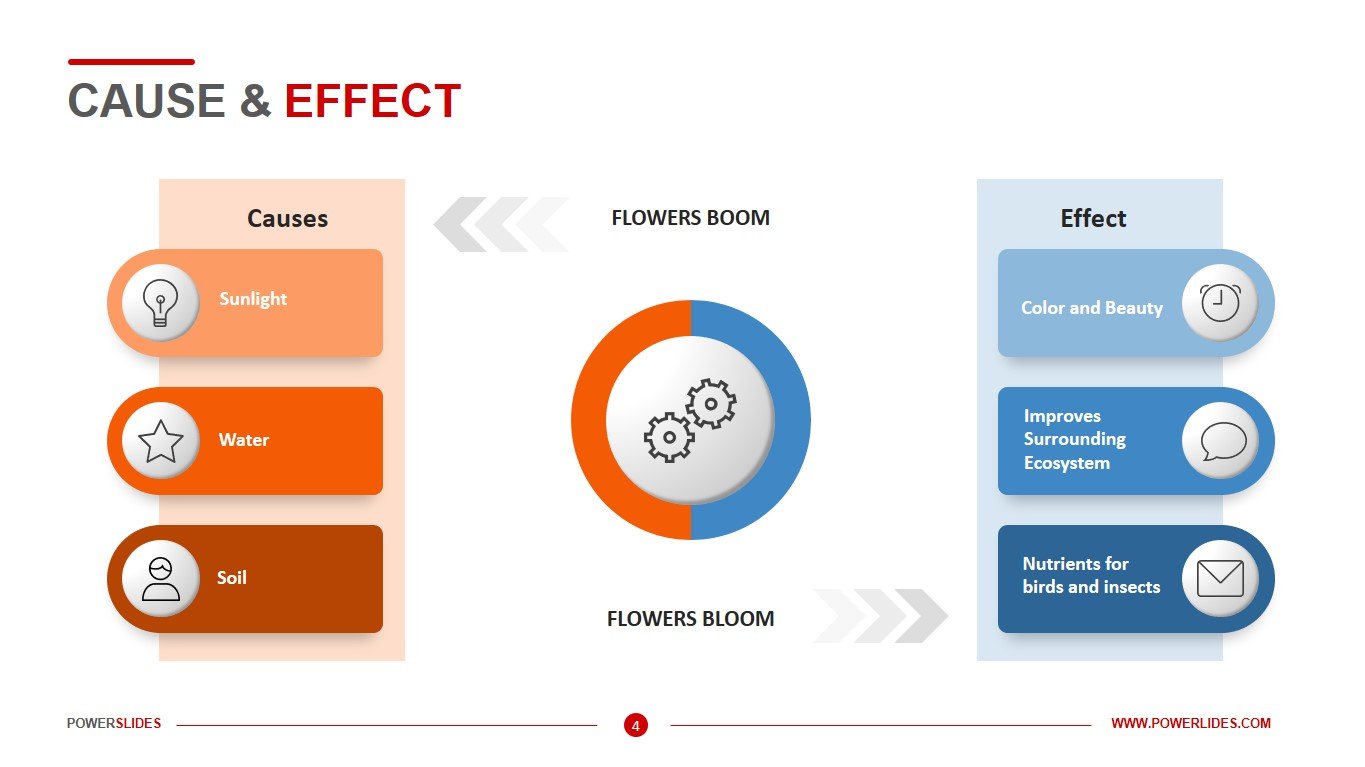
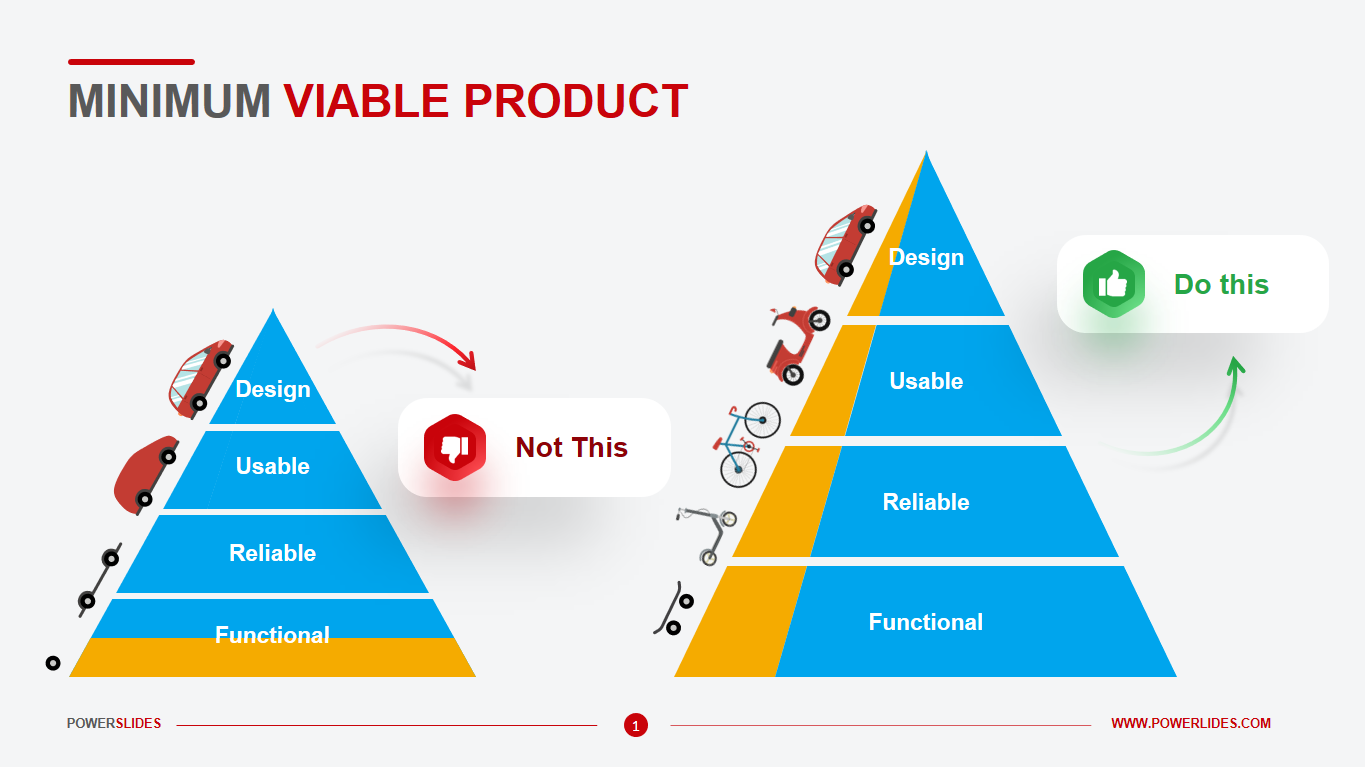
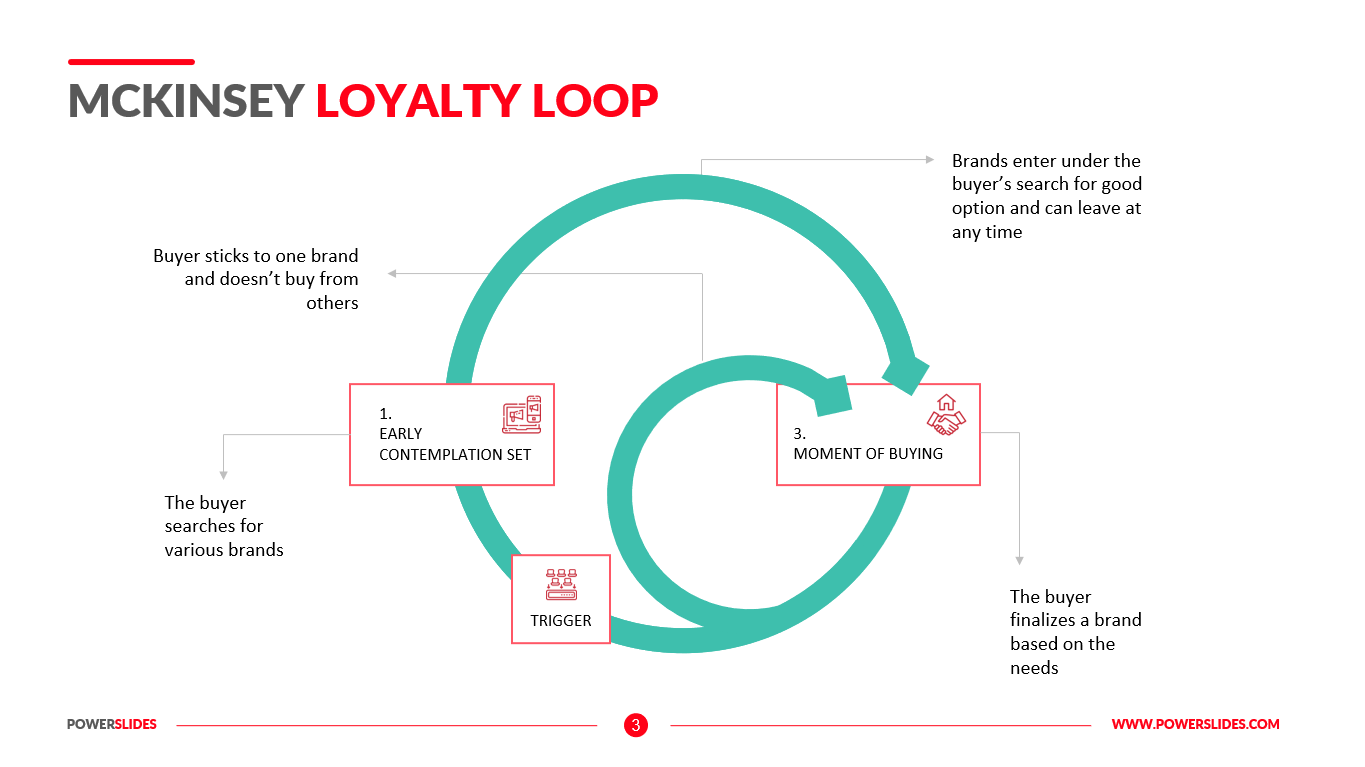
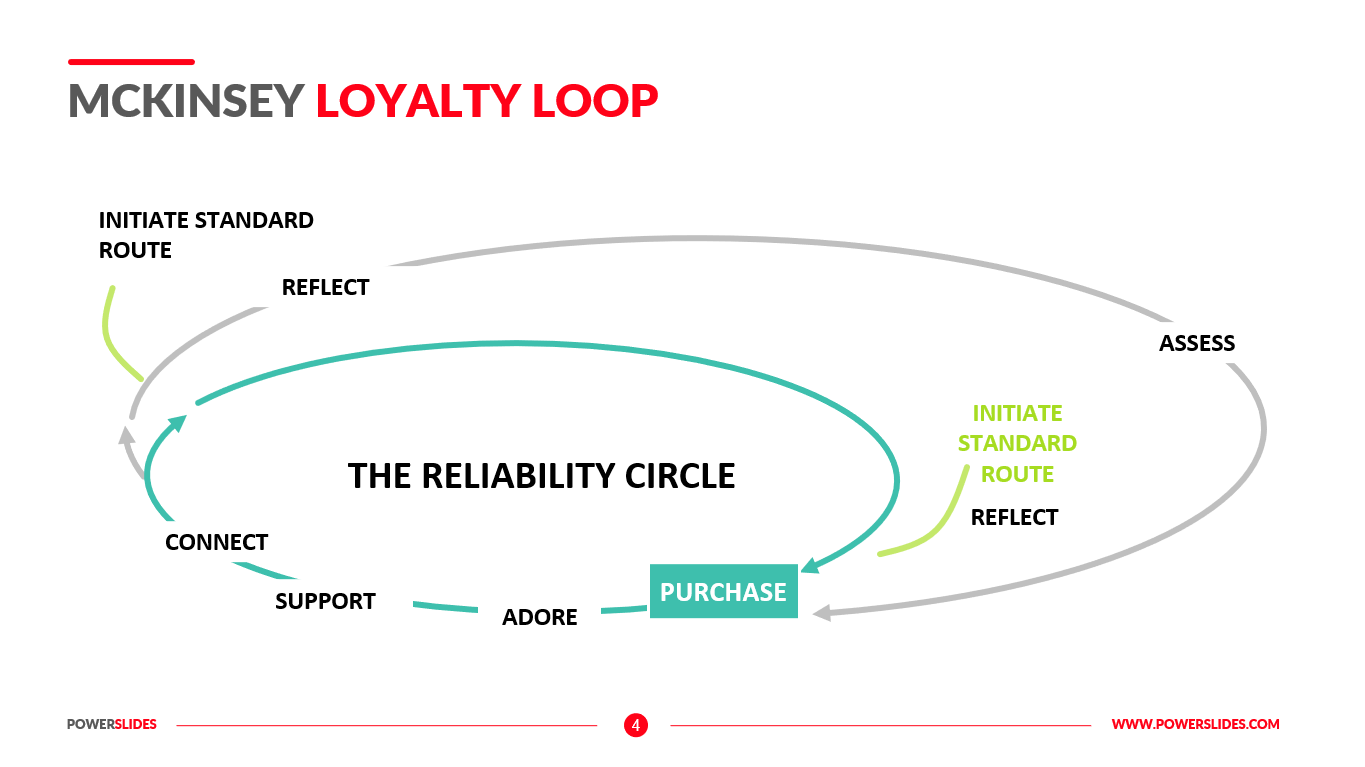
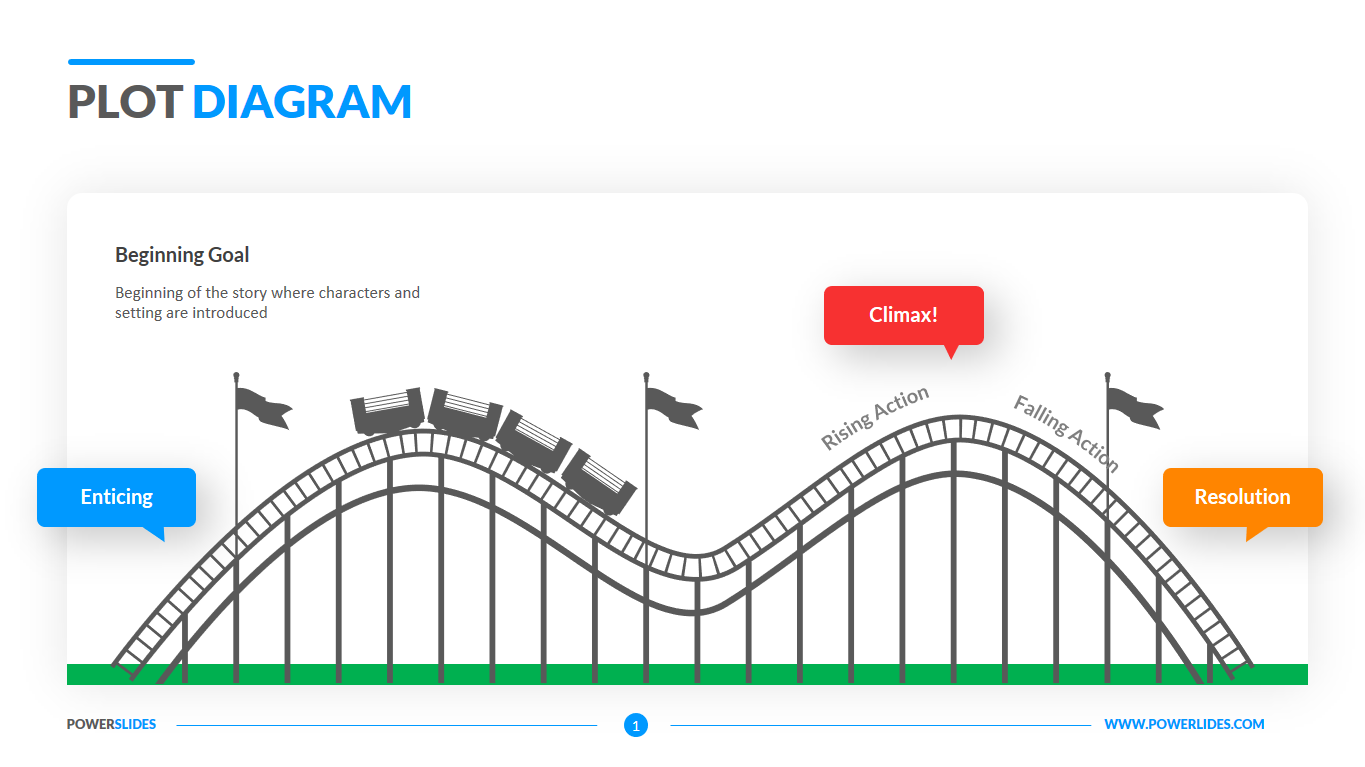
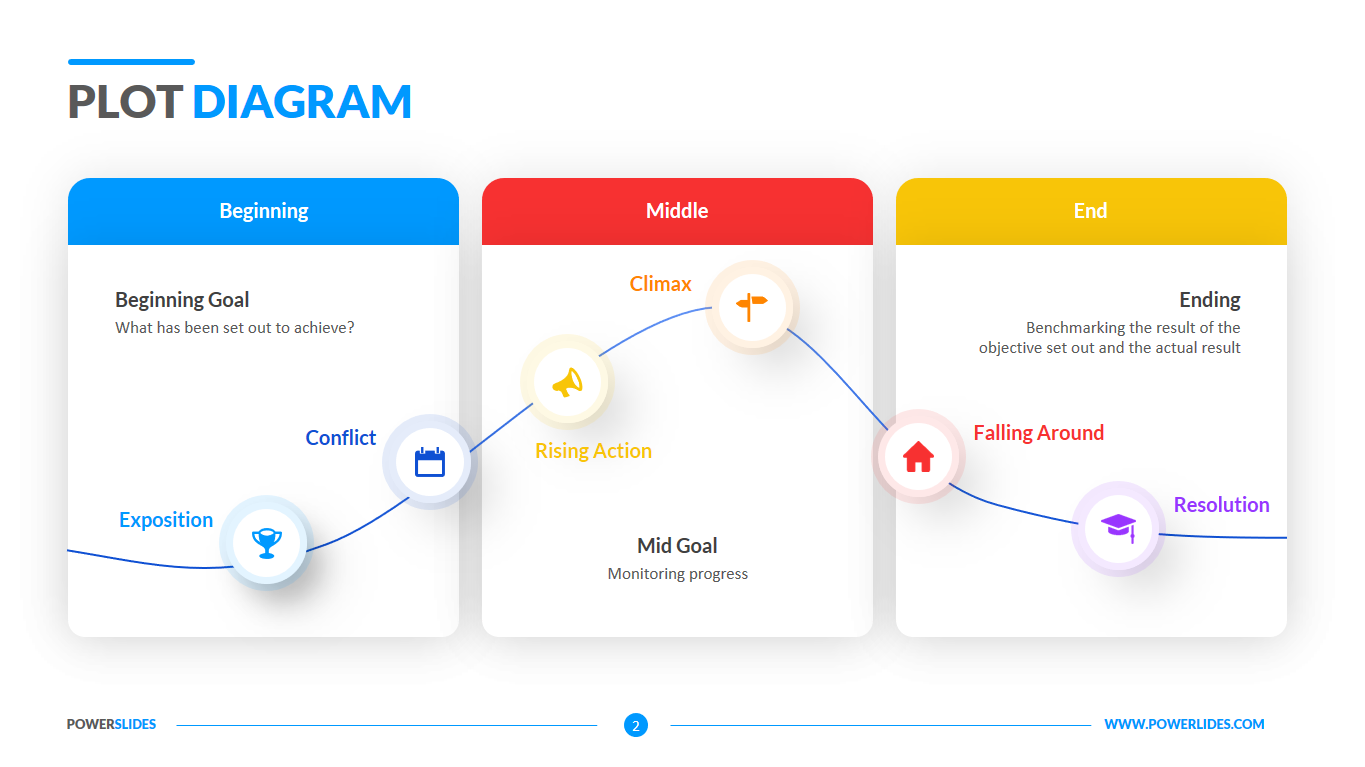
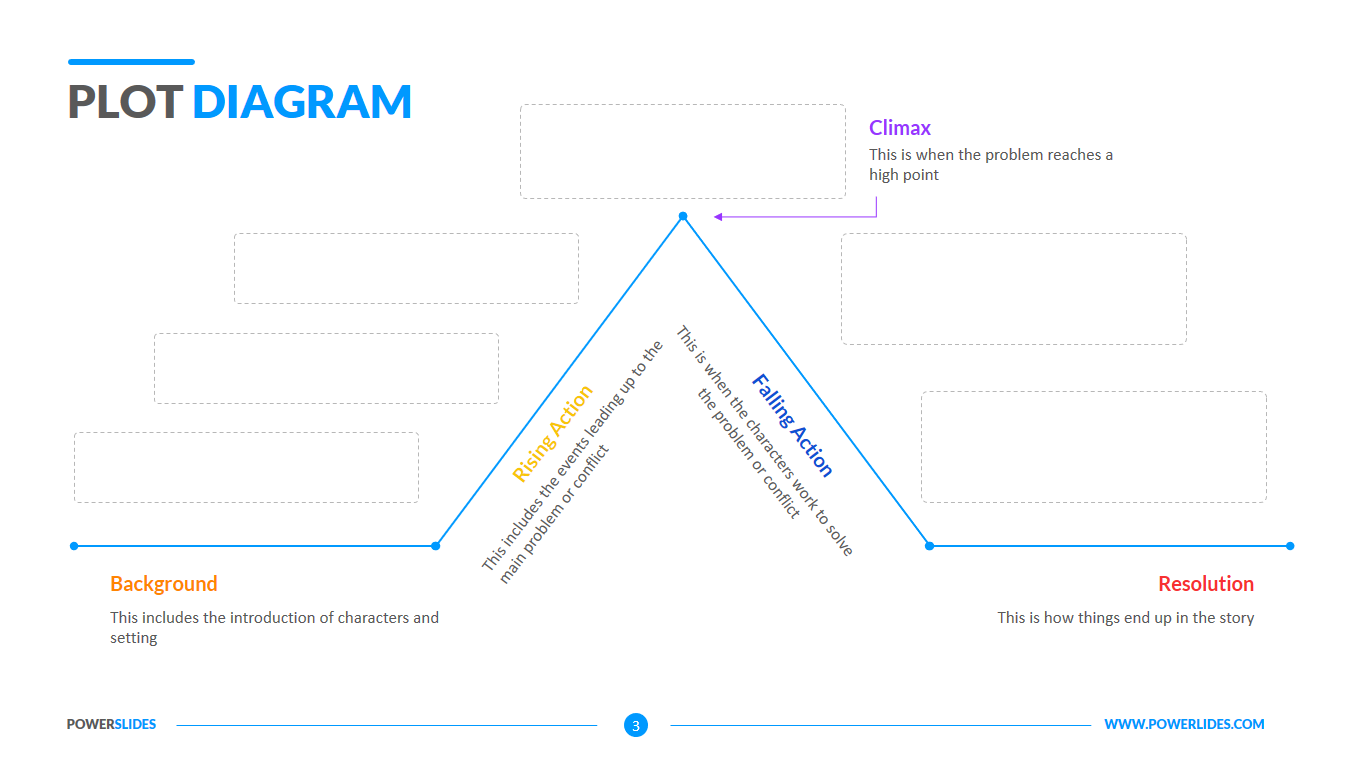
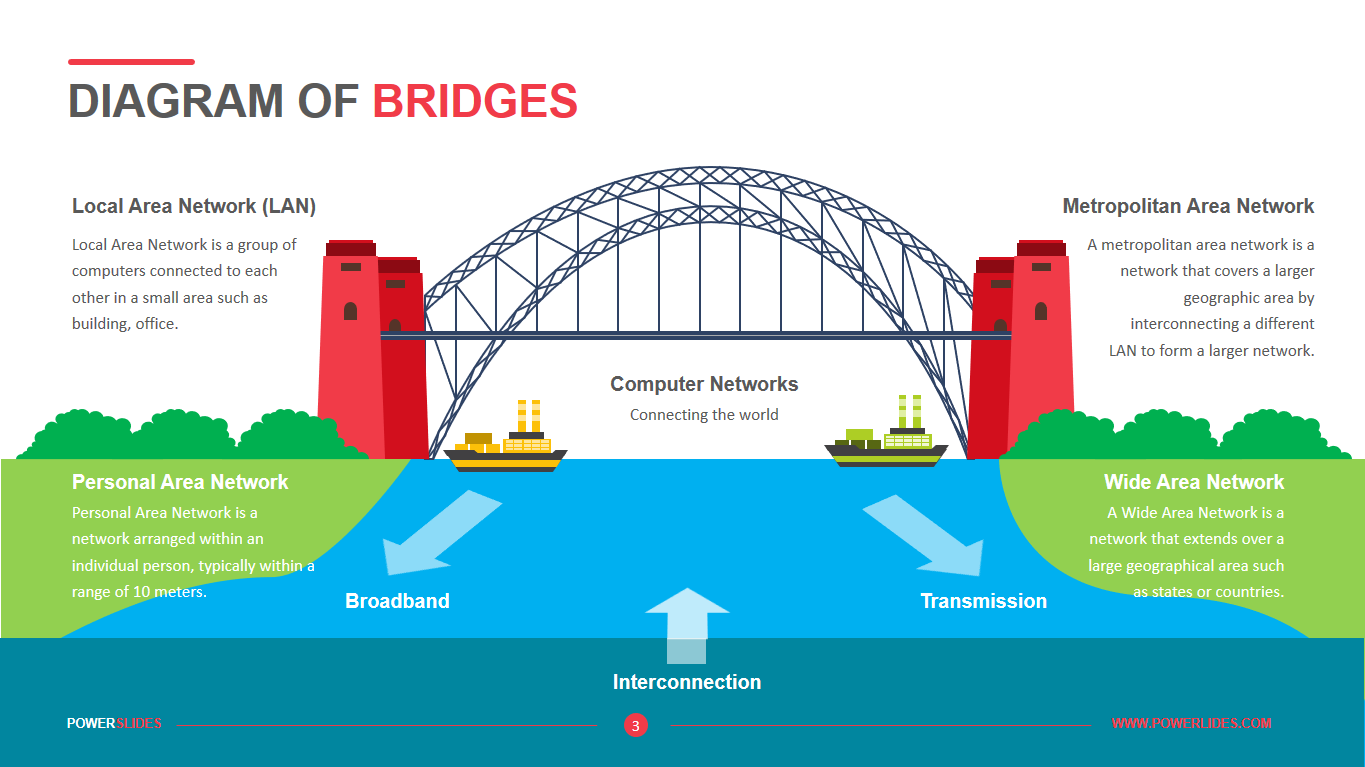
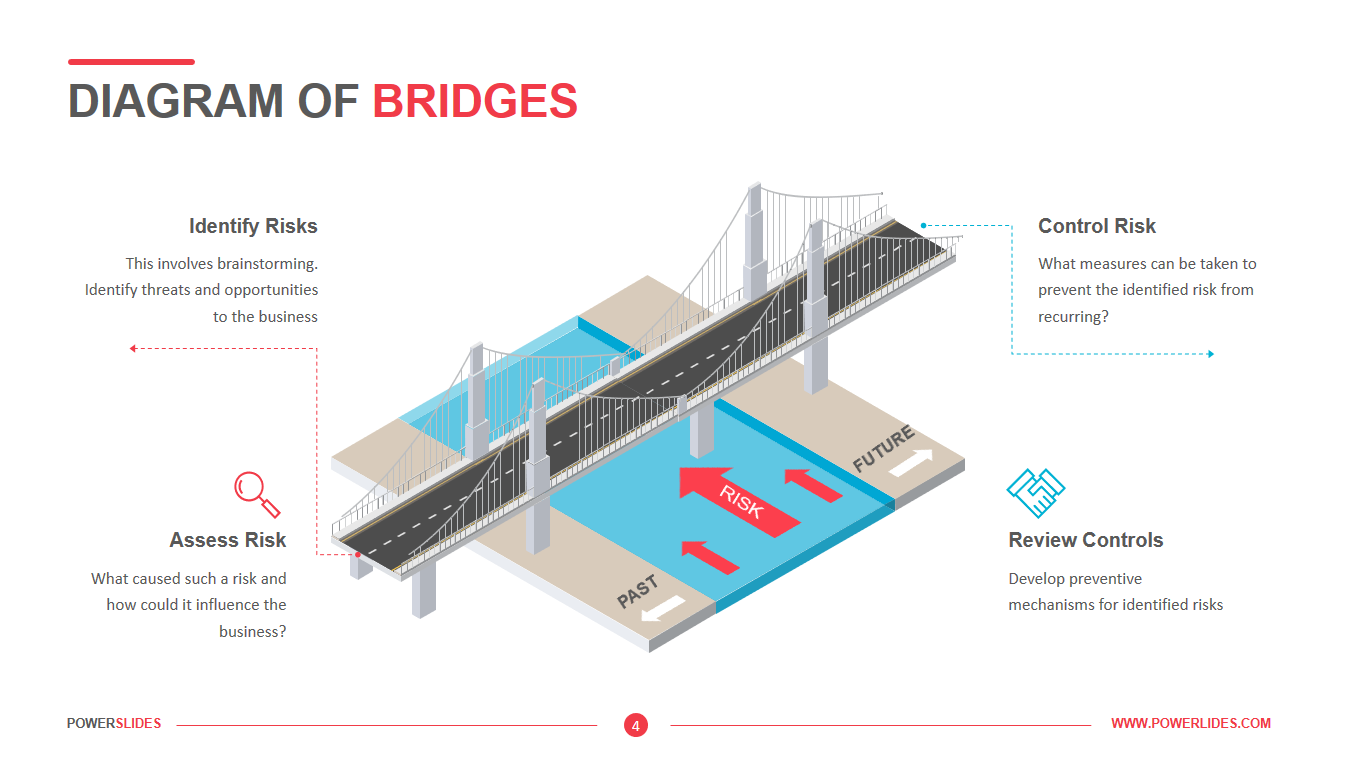
Represent your business concept in a creative and engaging way. Diagram of bridges is often used in presentations as a connection metaphor between two actions or concepts. You can use bridge diagram to describe a plan with associated risk or a multi-step concept. The infographic in the slides highlight forces at work and picture the past and the future.
The Diagram of bridges PowerPoint template is suitable to present logistic movements and supply chain procedures, involving long-term targets or long-distance deliveries. Use this bridge diagram slide template to convey complex business concepts in a simplified manner.
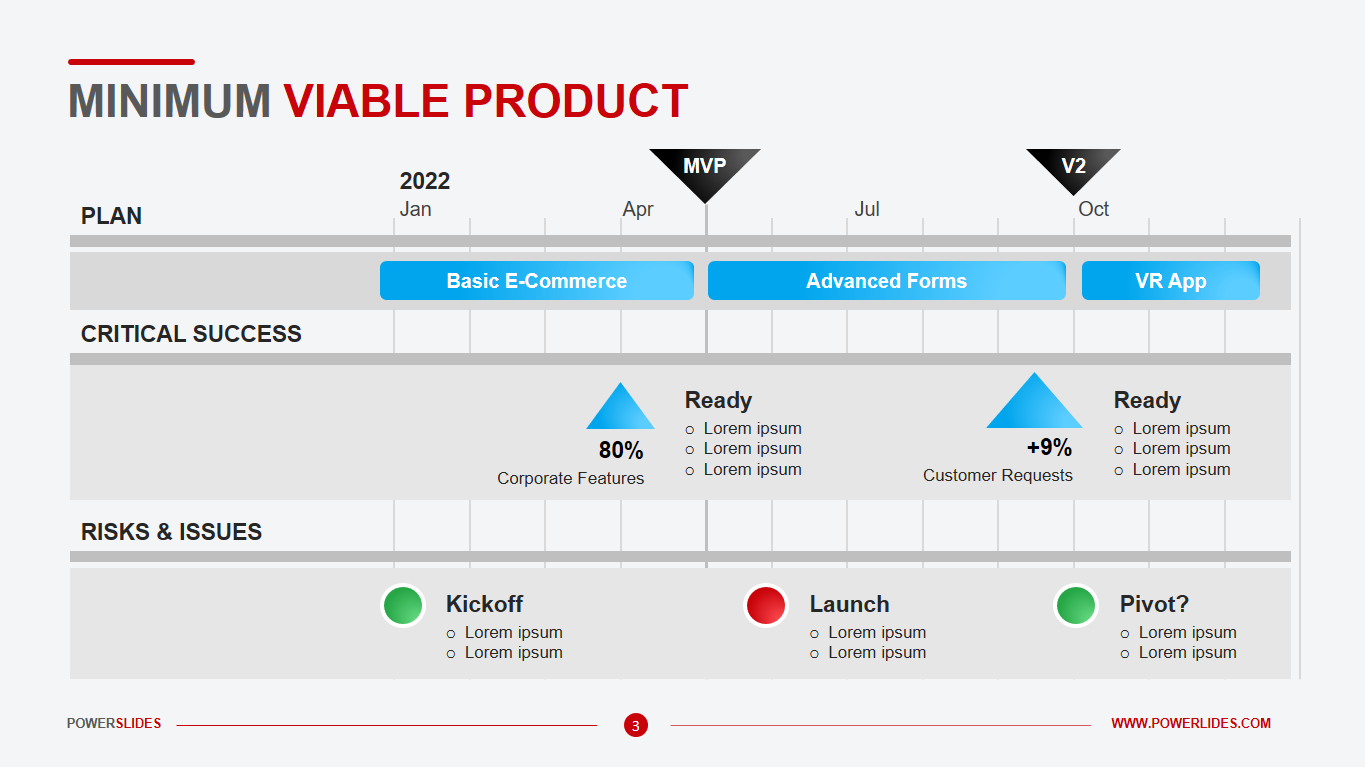
This template will be useful for startups when preparing for a meeting with potential investors. You can imagine your current position on one side of the bridge and the future state that is planning to achieve after the end of the project implementation, on the other side of the bridge. Also, this pattern will be useful to the heads of enterprises in the preparation of the company’s development strategy for the long-term perspective.
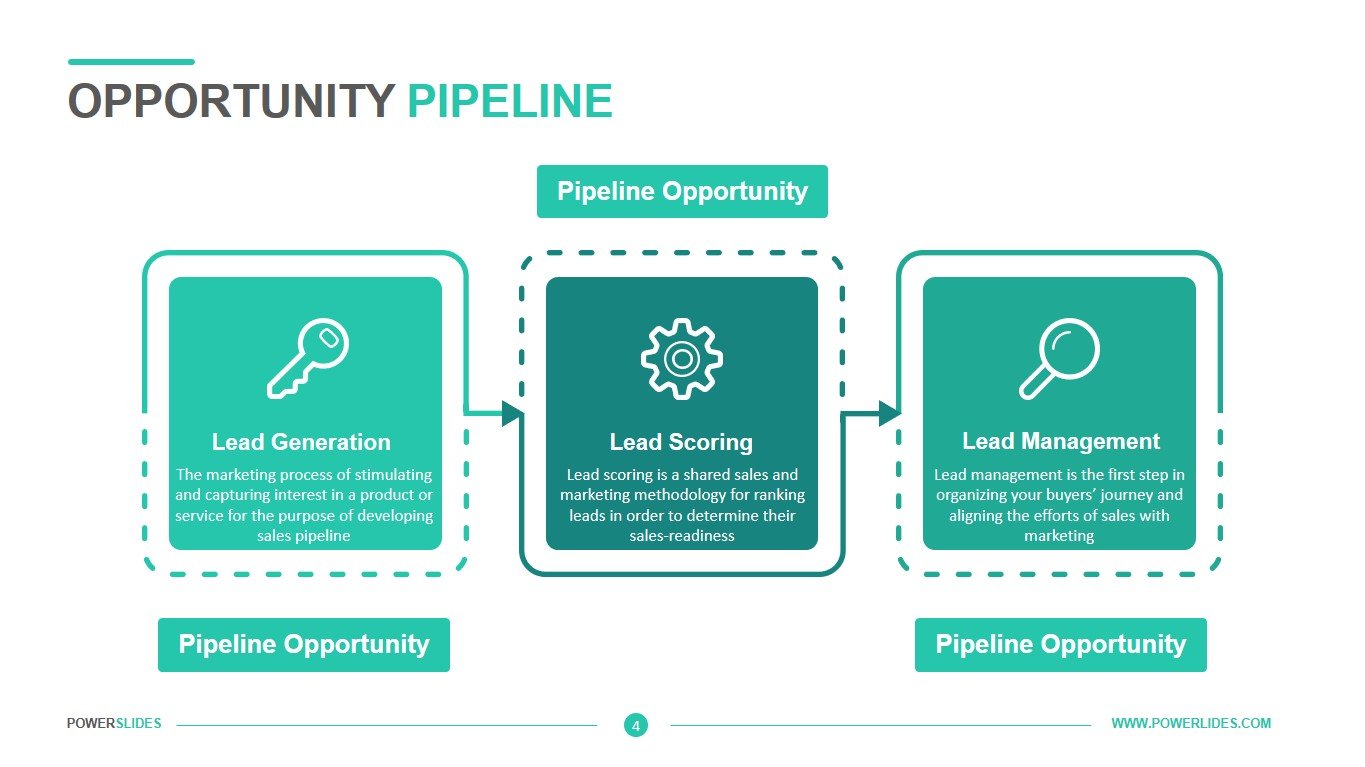
Marketers can use this pattern when preparing the company’s marketing strategy. You can also use the slides of this template when preparing a campaign to promote a new product to the market. Also, this template will be useful for advertising specialists when preparing the client’s advertising campaign. You can specify which product promotion tools you will use and what results will be achieved at the end of the campaign – sales, number of new customers, the share of market coverage.
Logistics managers can use the slides of this template in preparing information on new logistics supply chains using various types of transport. For example, you can specify the current state for the delivery of products and raw materials – to indicate the total logistics costs, the amount of transport used, the cost of transporting 1t for various types of transport. After that, to indicate a number of activities that will be aimed at reducing the cost of transportation of 1 ton and increasing transport turnover. On the other side of the bridge, to specify which logistics indicators you plan to achieve and what positive effect it will have on the overall supply chain. Also, this template can use university teachers when preparing courses on planning or developing an effective company’s effective strategy.
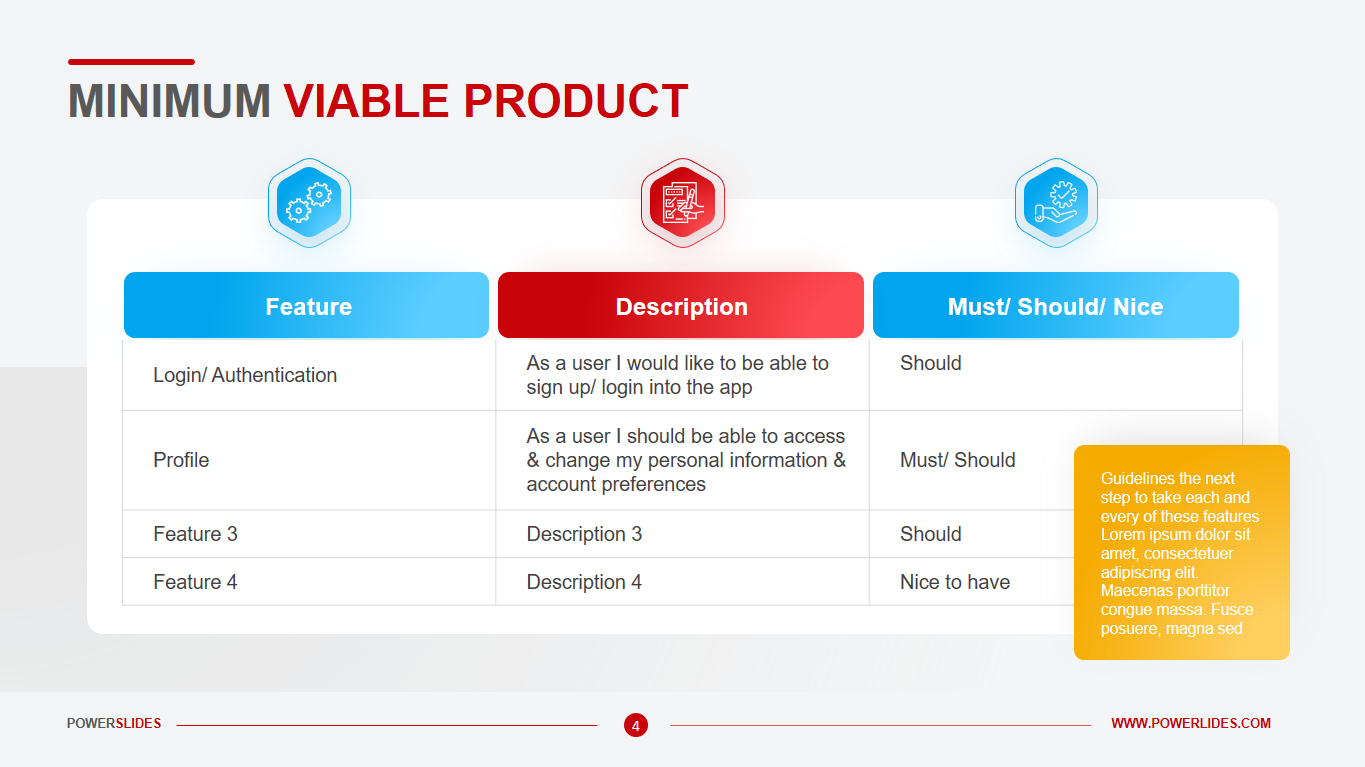
The diagram of bridges template is 100% editable and customizable. You can change colors, text and scale icons to meet your requirements. You save time and effort with our pre-designed bridge diagram PowerPoint template.
The bridge template uses high definition visual graphics that will impressively engages the attention of your audience to the end. The bridge diagram can be used in your business and consulting presentations. Ideal for business owners, strategic planners, and business analysts.
Diagram of Bridgees template contains all the necessary tools for building a professional and modern presentation. The slides of this template will organically complement your old presentations on the topic of planning and will be excellent replenishment of your collection of professional presentations.


