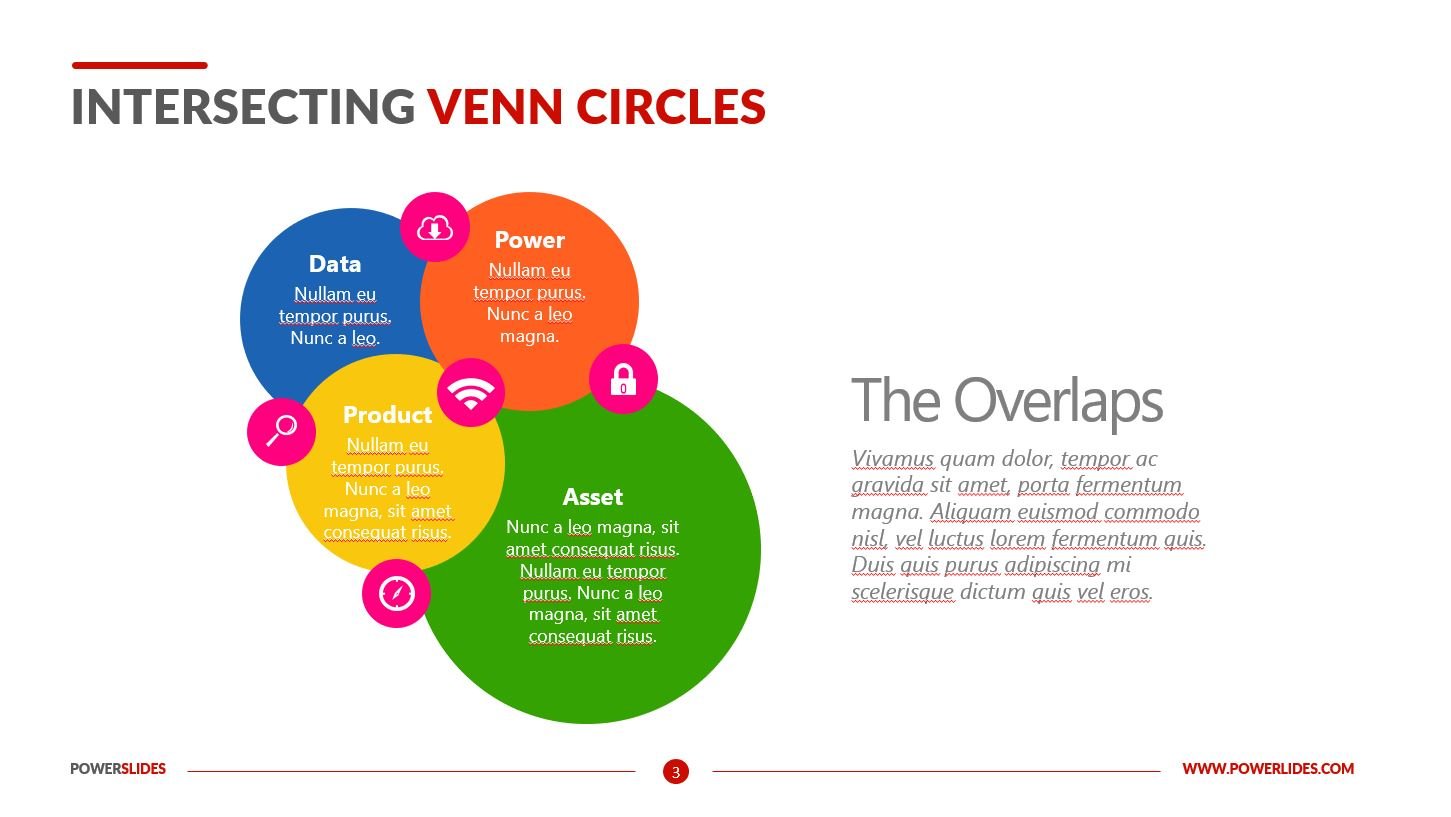
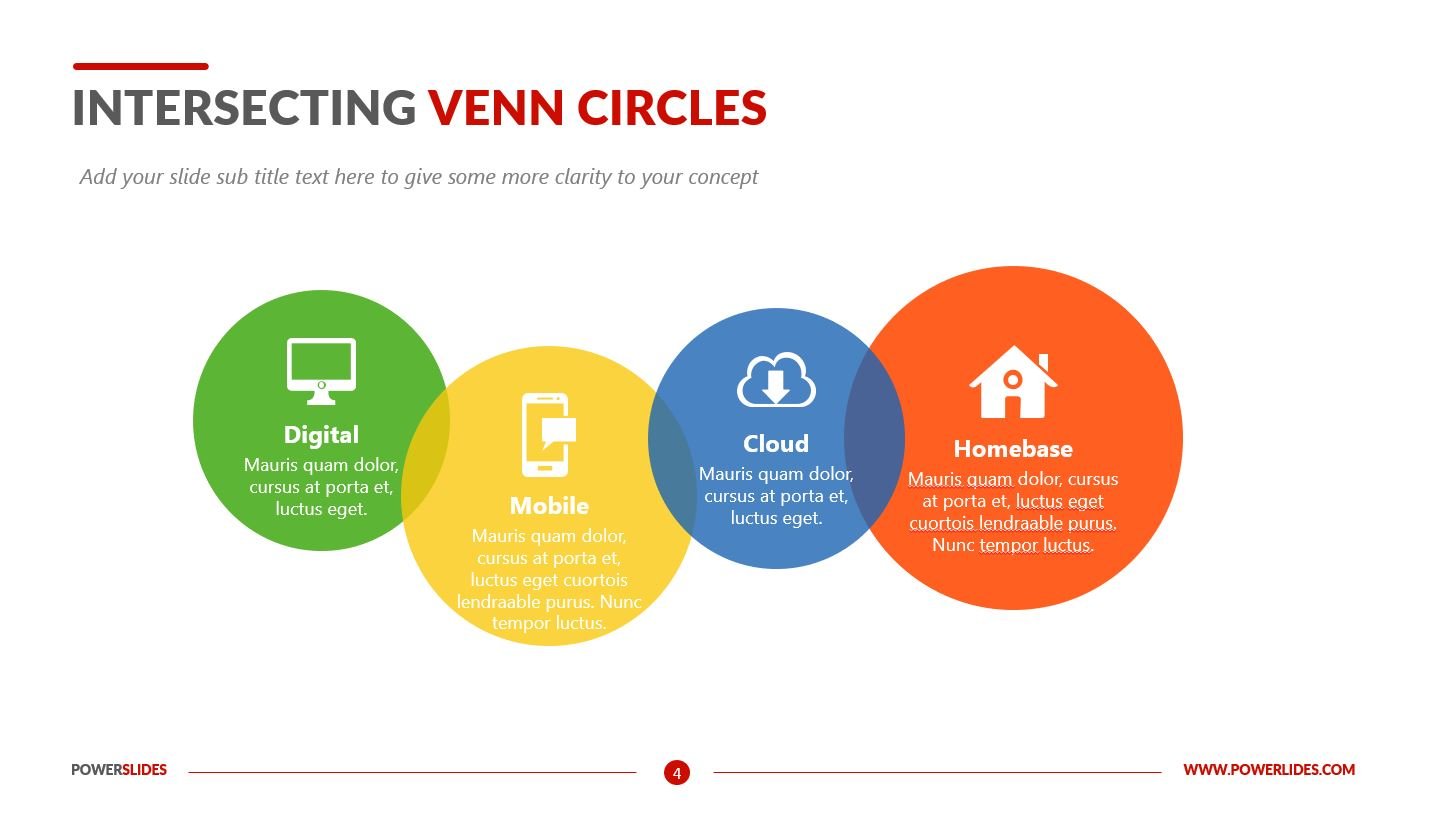
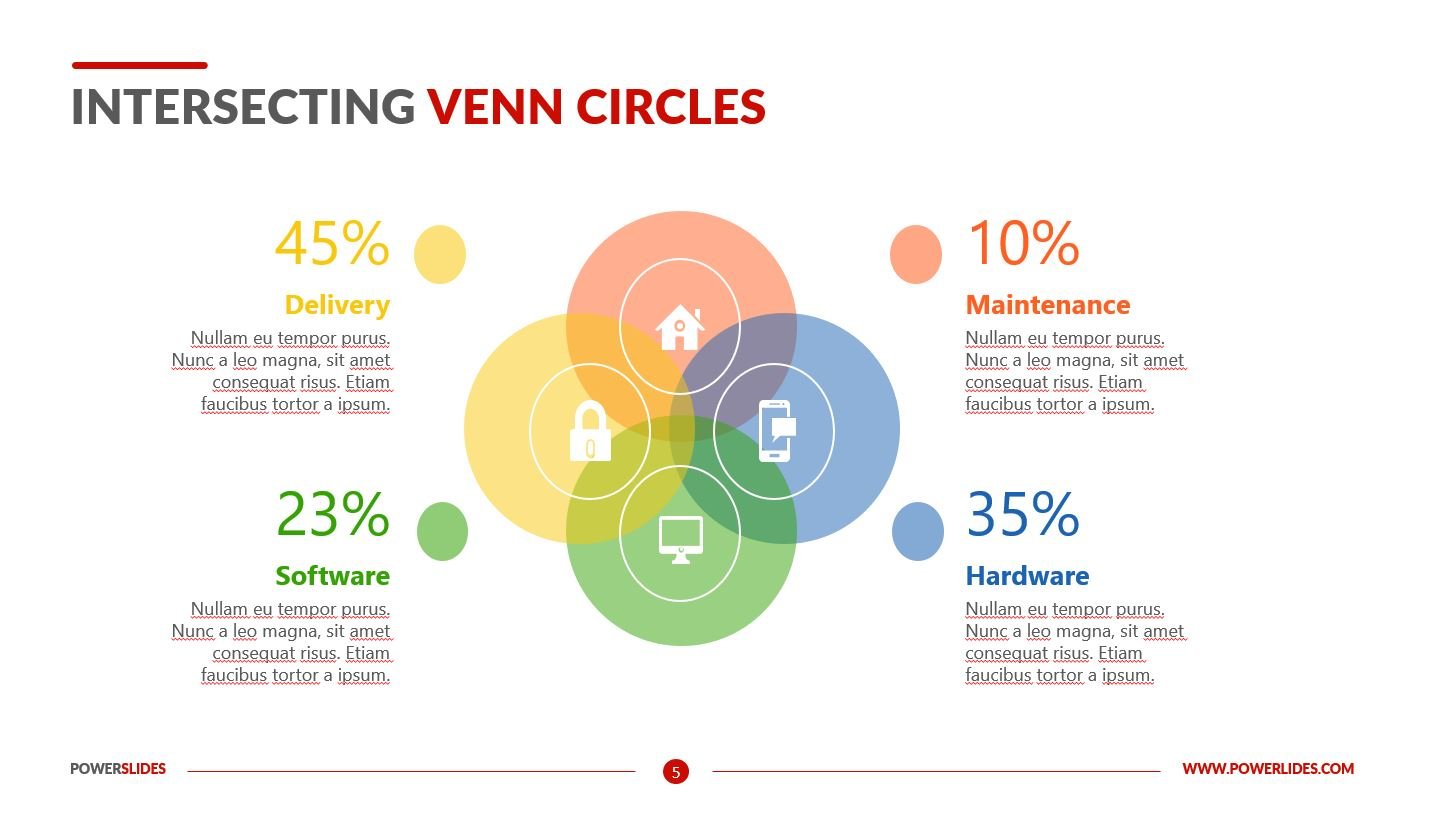
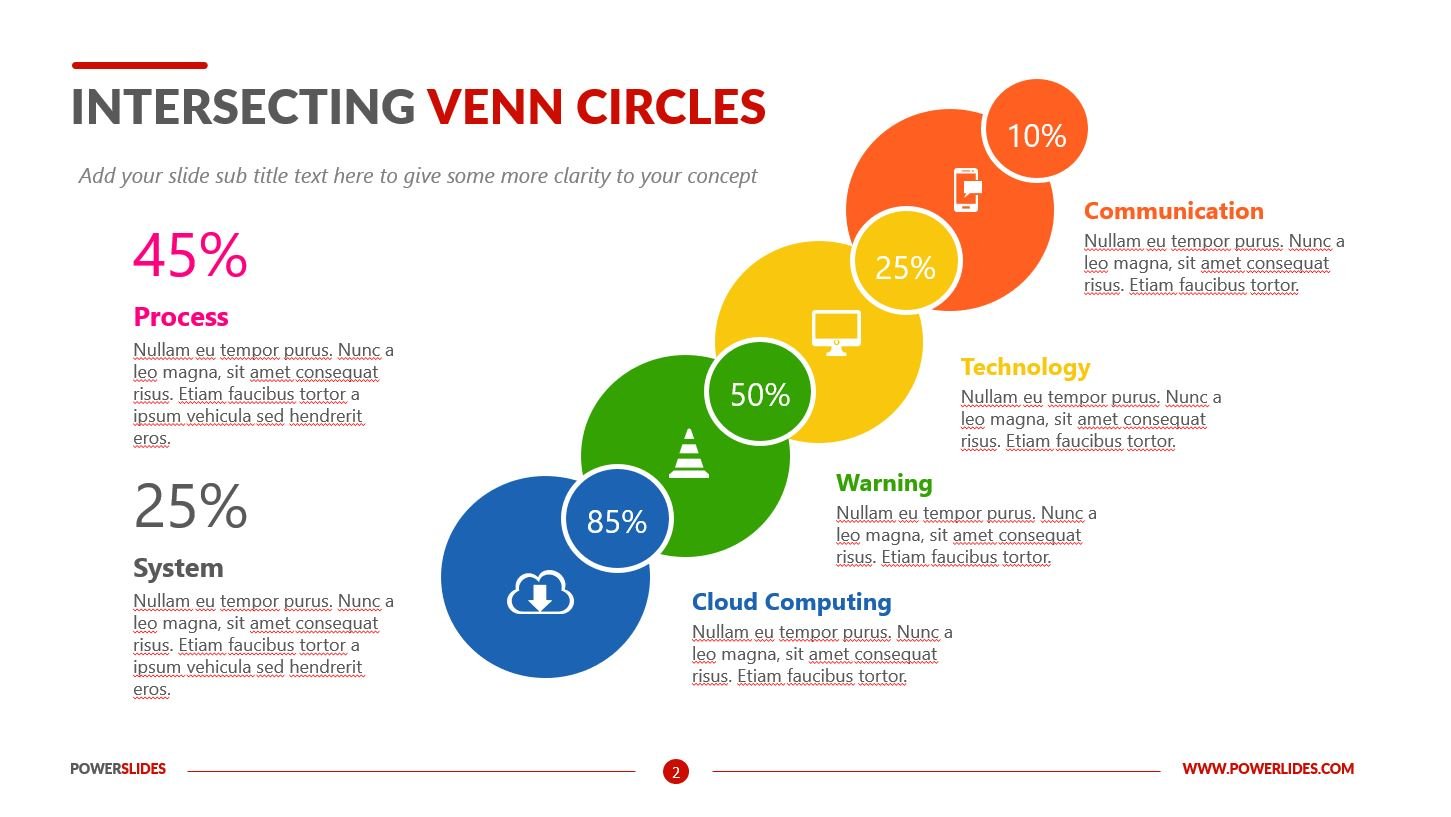
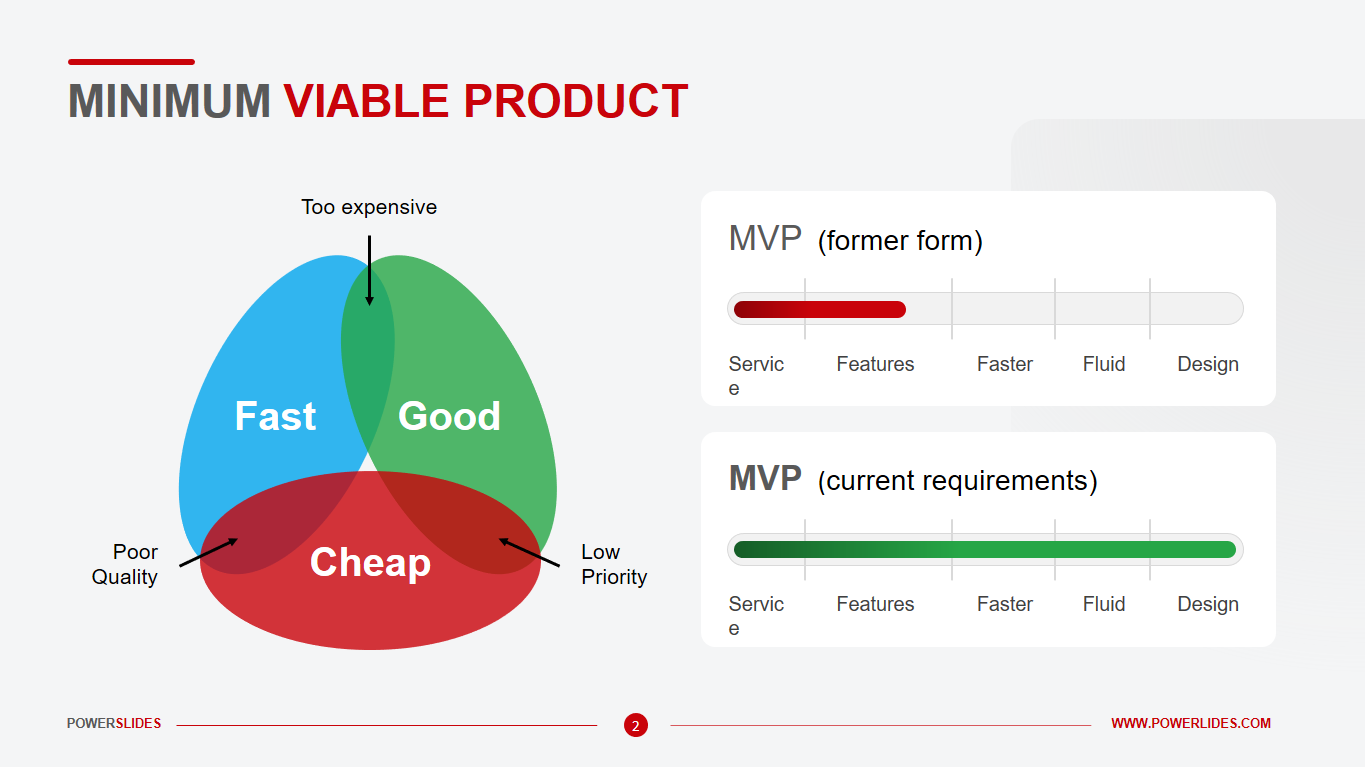
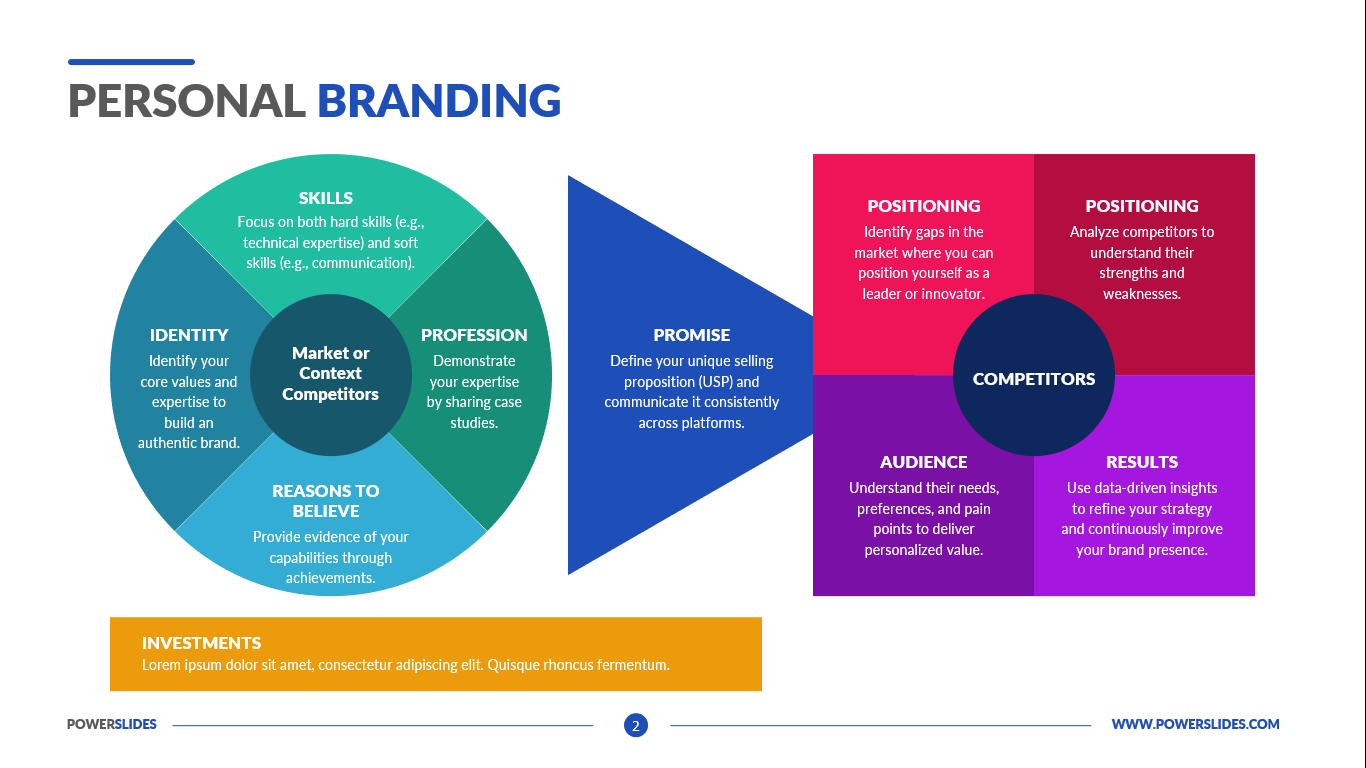
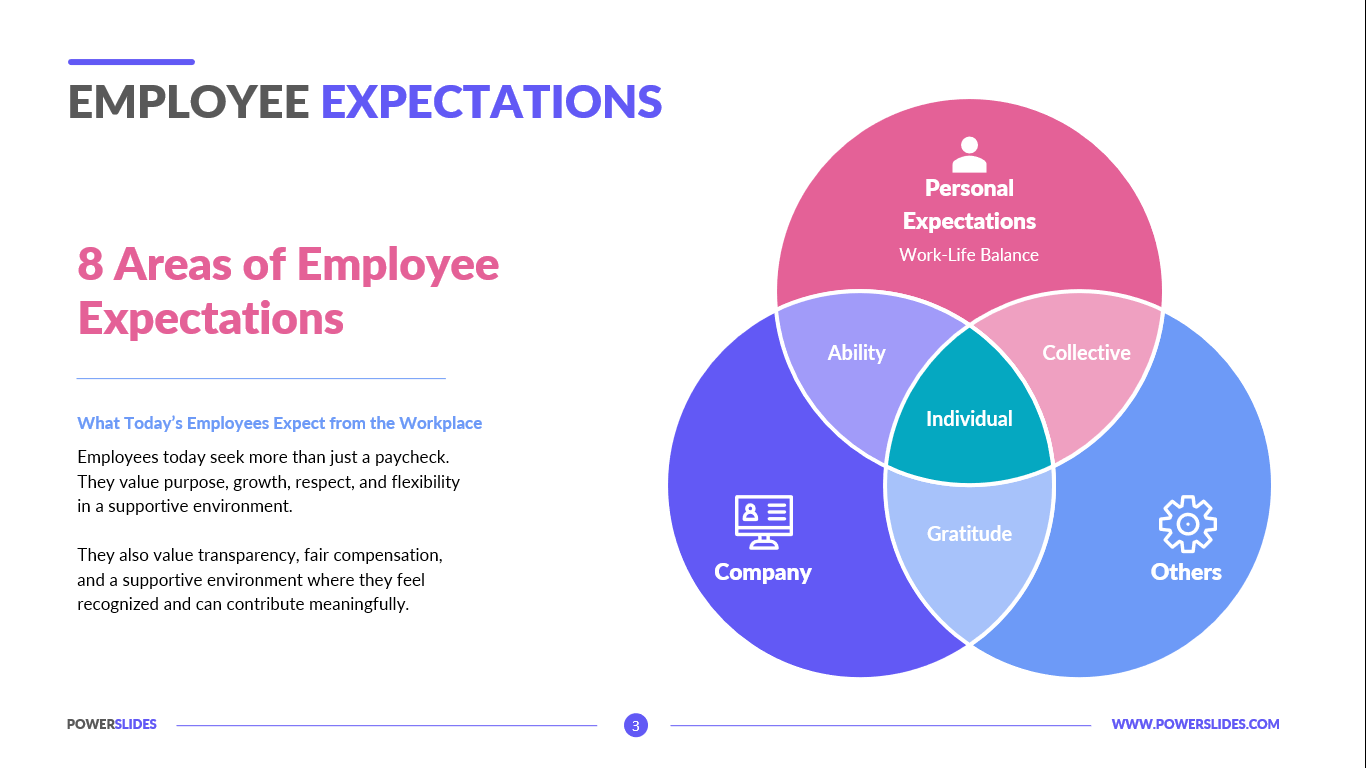
4 Circle Venn Diagram
What do you think of this template?
 (5.00/ 5)
10 ratings

 4 Slides
 File size: 16:9
 Fonts: Lato Black, Calibri
 Supported version
PPT 2010, PPT 2013, PPT 2016
Supported version
PPT 2010, PPT 2013, PPT 2016

Product details
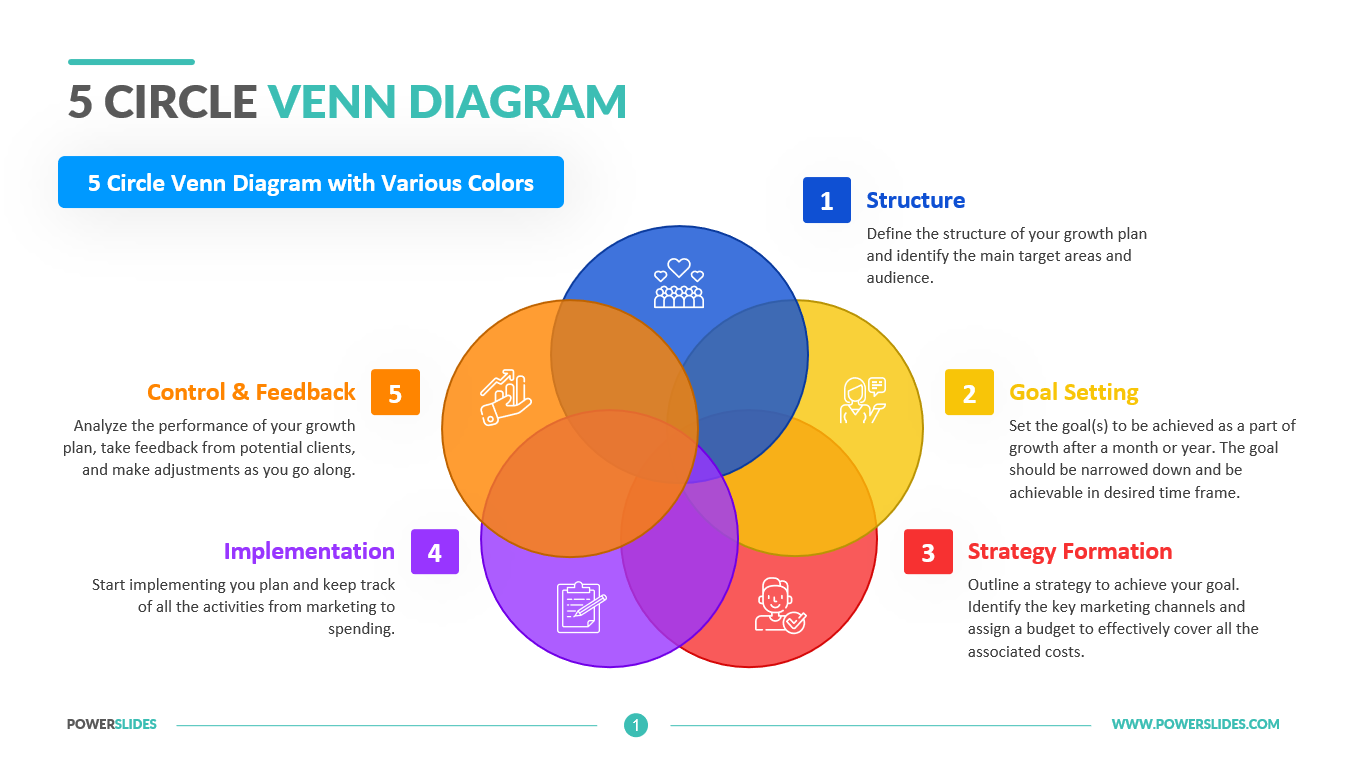
A Flowchart is a graphically representation of the structure of process or system, algorithm or the step-by-step solution of the problem. The Flowchart describes the flow of data through an information processing systems and the parts of the flows. The flow is a set of the logic operations that meet the certain requirements.
Flowchart Symbols and Meaning – Provides a visual representation of basic flowchart symbols and their proposed use in professional workflow diagram, standard process flow diagram and communicating the structure of a well-developed web site, as well as their correlation in developing on-line instructional projects.
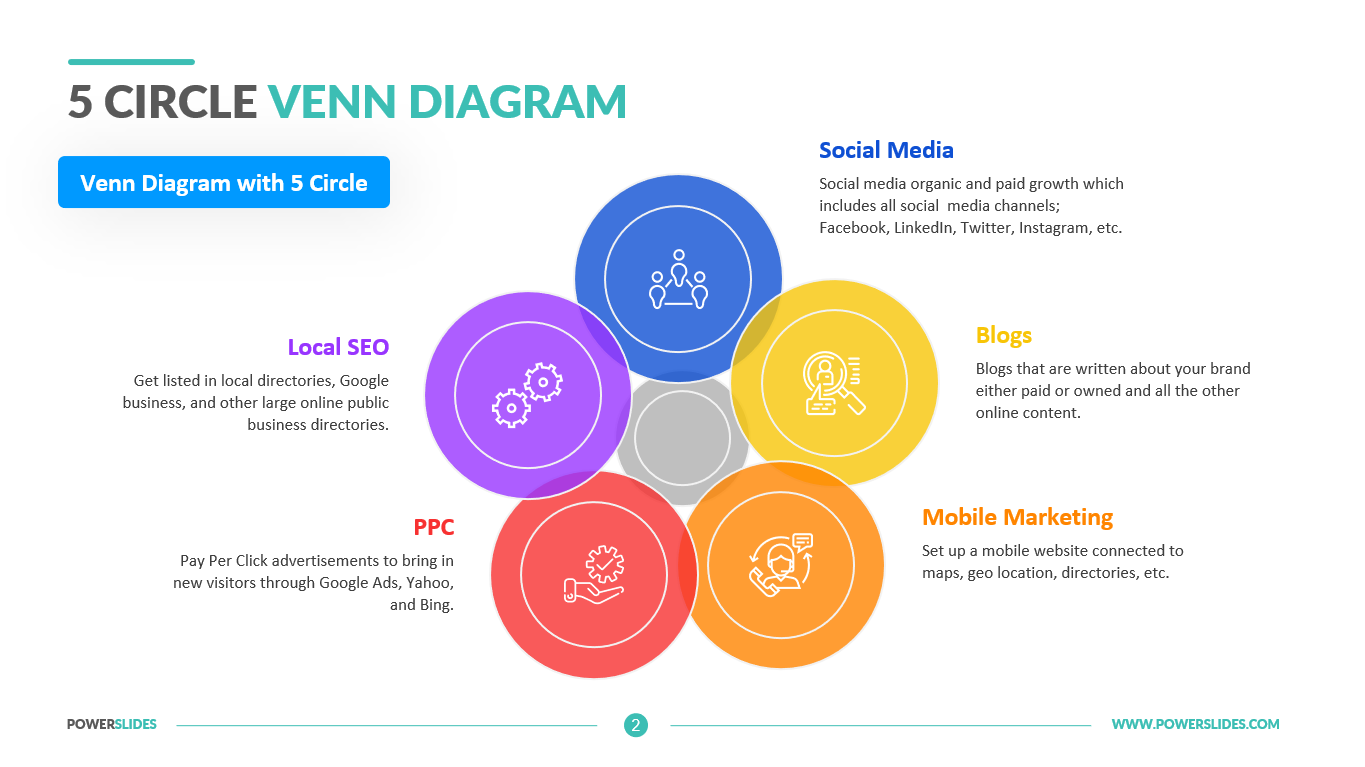
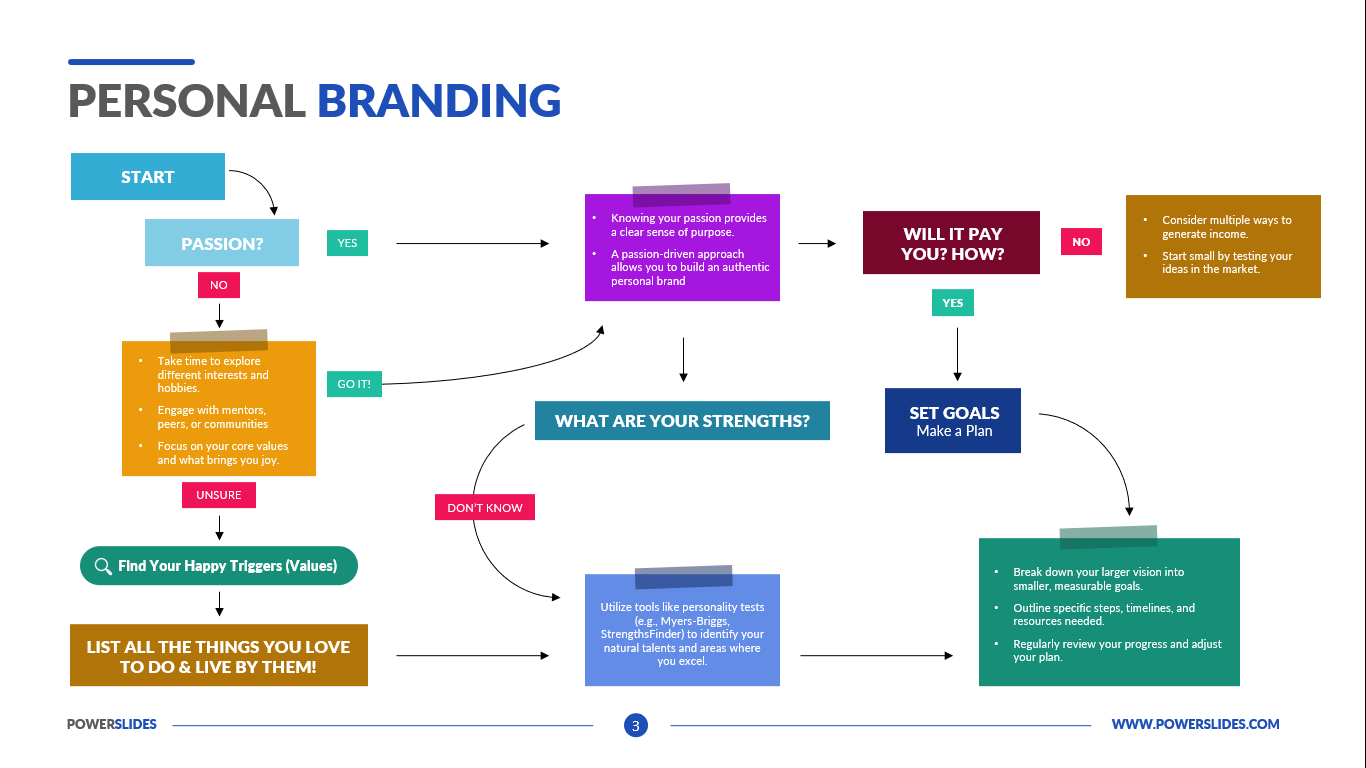
A flowchart is a type of diagram that represents an algorithm, workflow or process, showing the steps as boxes of various kinds – flowchart symbols, and their order by connecting them with arrows.
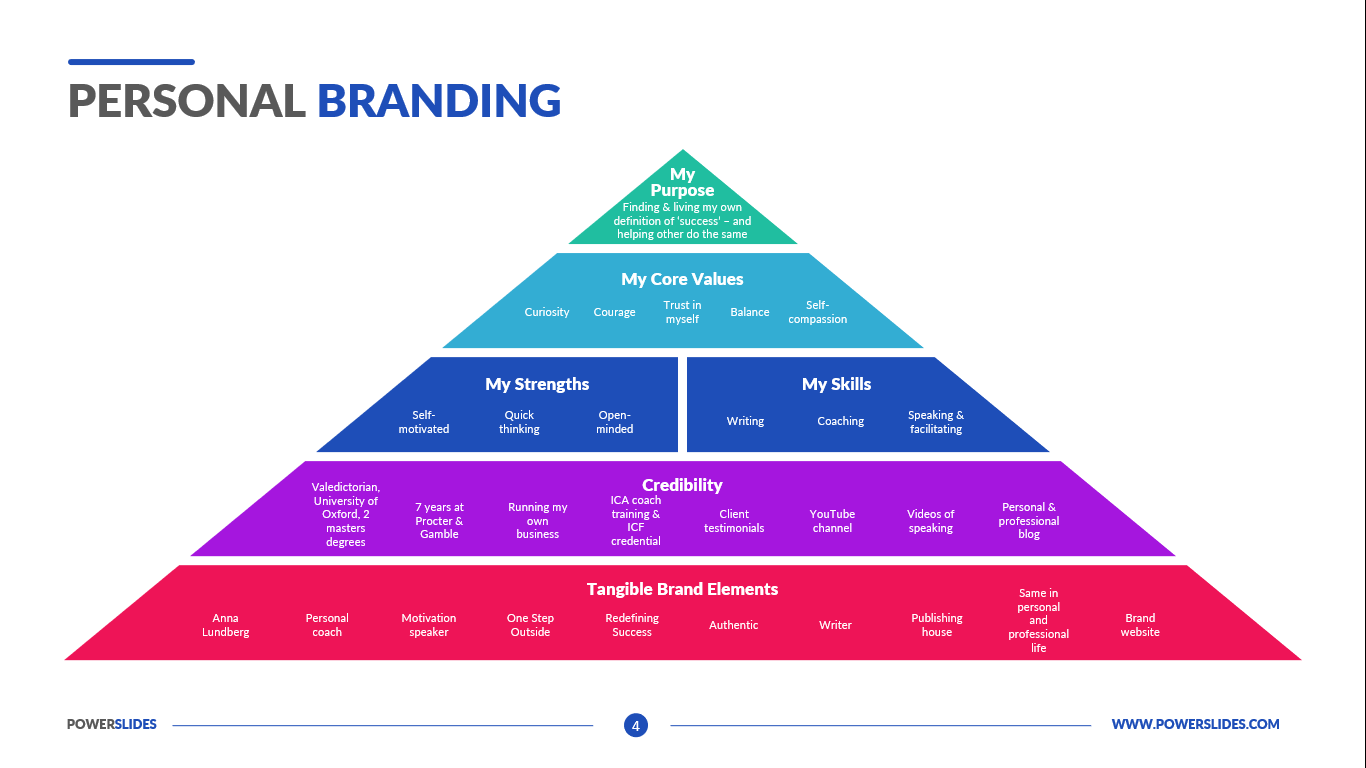
Any business graphic document will be more understandable if will use an expository color scheme for their parts. Flowchart design makes versatile presenting and explaining of the process and gives a fresh view that distinguishes it from black and white flowcharts on a paper. Workflow diagram or process flow diagrams become more understandable to ordinary people when it use minimum symbols and special signs.
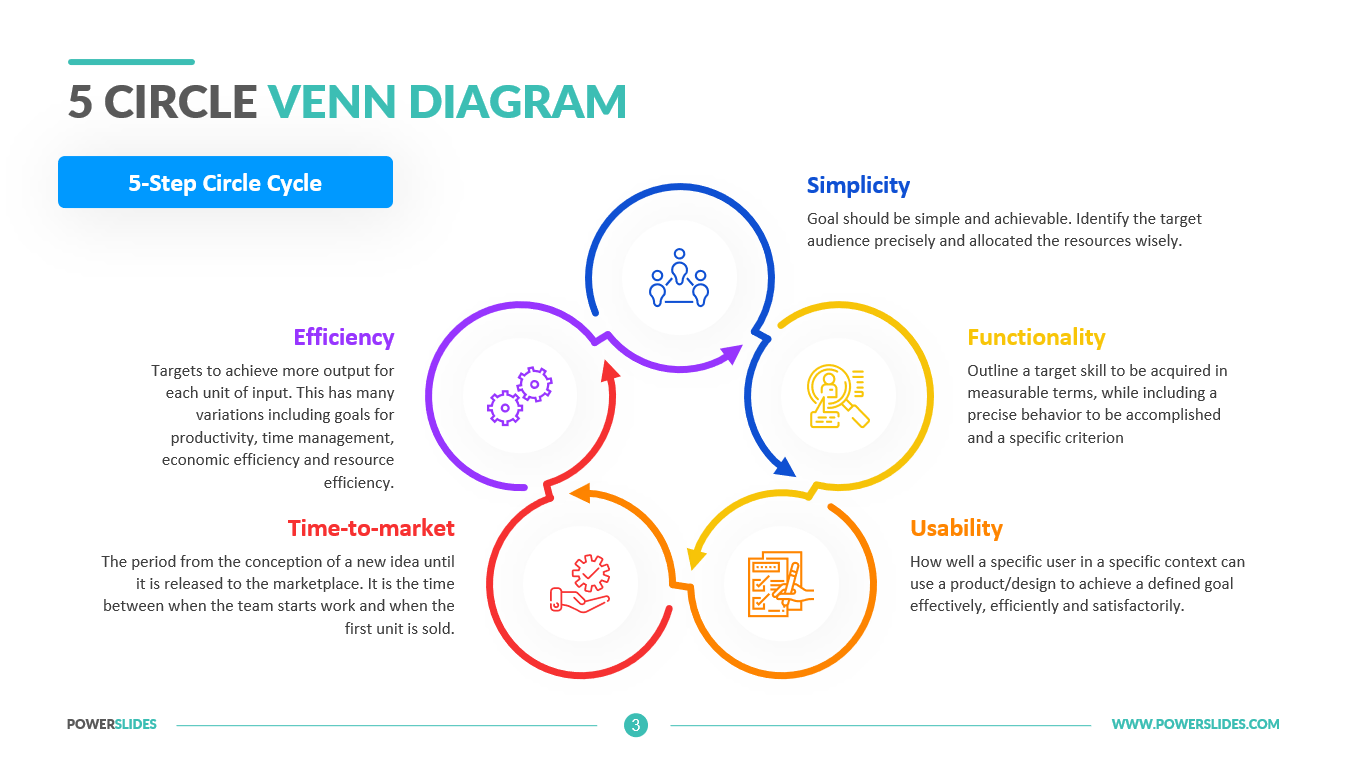
Pick one of them and begin to input proper text into each Flowchart symbols and shapes. Apply less colors in the document and don’t turn into rainbow your diagram, three or four will be enough, also note that business process flowchart may not contain bright color hues. Use identical colors for same flowchart shape types.
To draw cross functional process maps is by starting with a cross-functional flowchart samples and templates. Using a Cross-Functional flowchart is a clear way of showing each team member’s responsibilities and how processes get shared or transferred between different teams and departments.
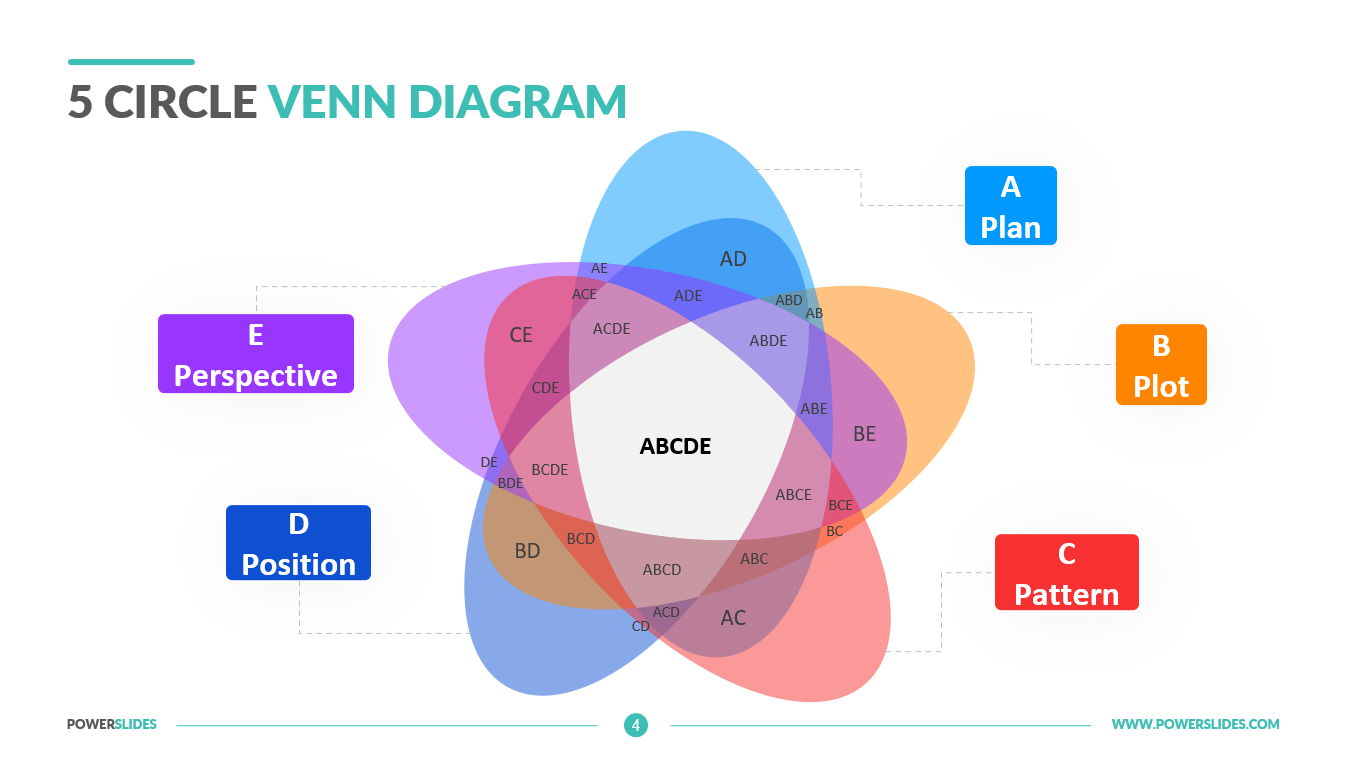
For creating the yes-no flowchart special object blocks are used, each block has its own way to represent an activity. A rectangle or box block used to represent an activity or a step, a rounded box or an oval box to depict Start / End, a diamond-shaped box to represent the yes-no decision point, a circle is used to represent the point of connection, a parallelogram is used to represent the Input / Output.
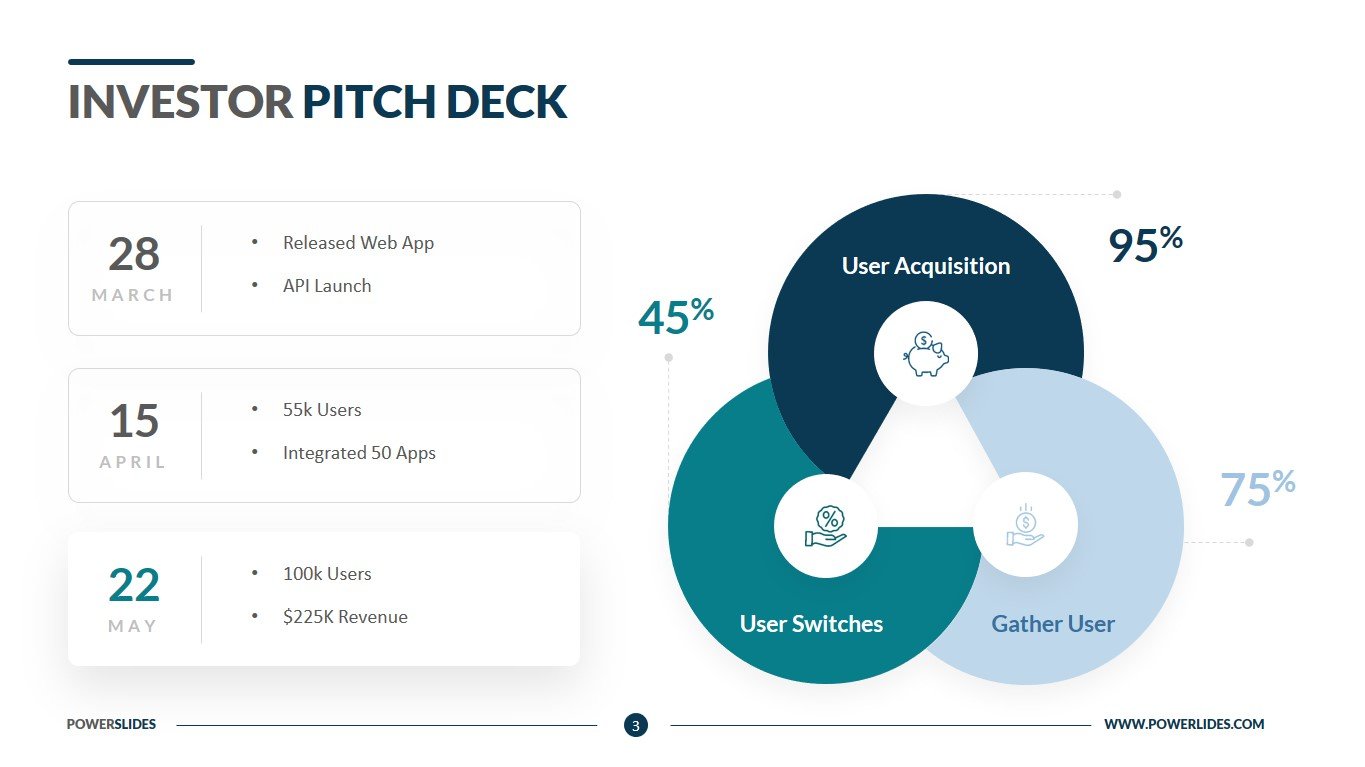
Software developers can use the slides in this template when preparing for a customer meeting or introducing their new software product. For example, you can describe in detail the algorithms for a program or explain the relationships between different processes in an application.
This template will also be useful to engineers when explaining how new equipment works. Startup executives can use the slides from this template in preparation for their investor meeting.
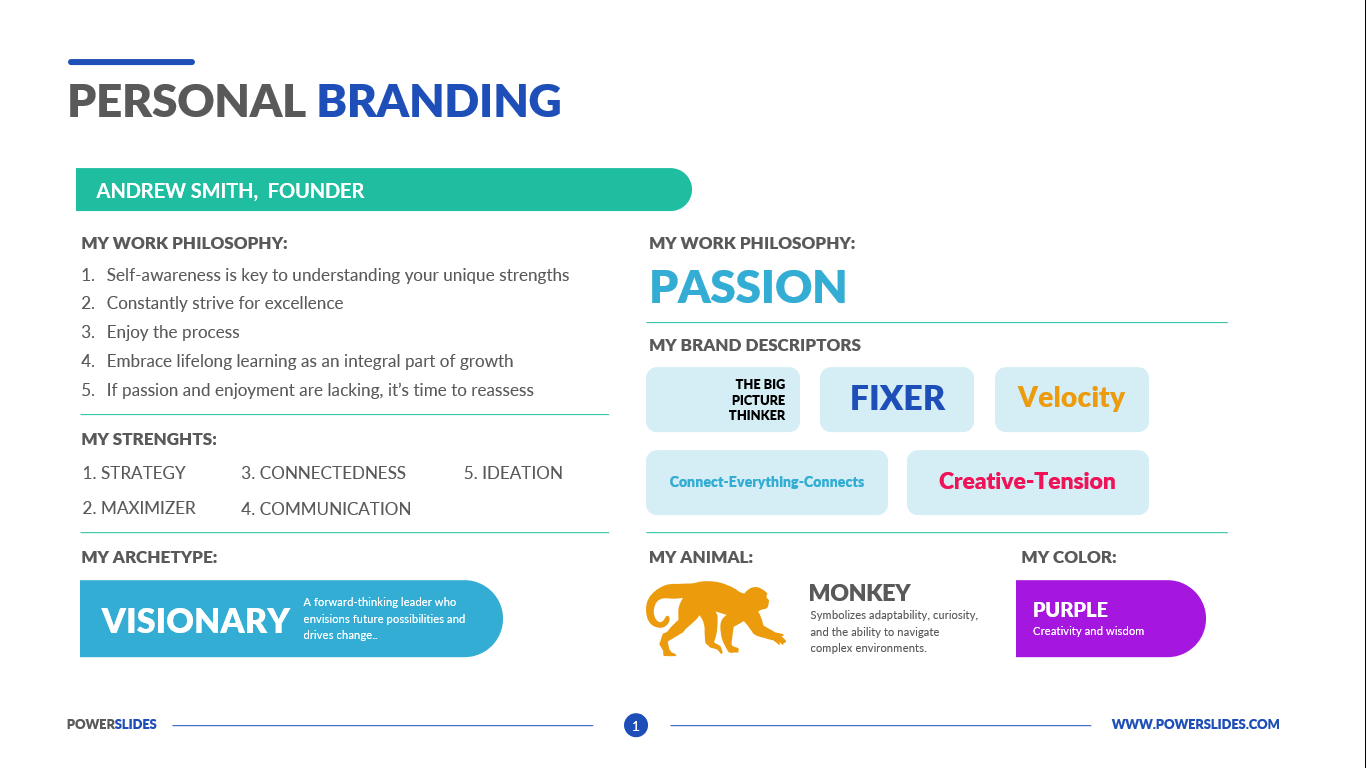
Yes No Flowchart is a professional and modern template that contains four stylish and fully editable slides. If necessary, you can change all the elements of the slide in accordance with your corporate requirements. This template will be useful for startups, IT executives, engineers and team leaders. Yes No Flowchart Template will organically complement your presentations and will be a great addition to your collection of professional presentations.


