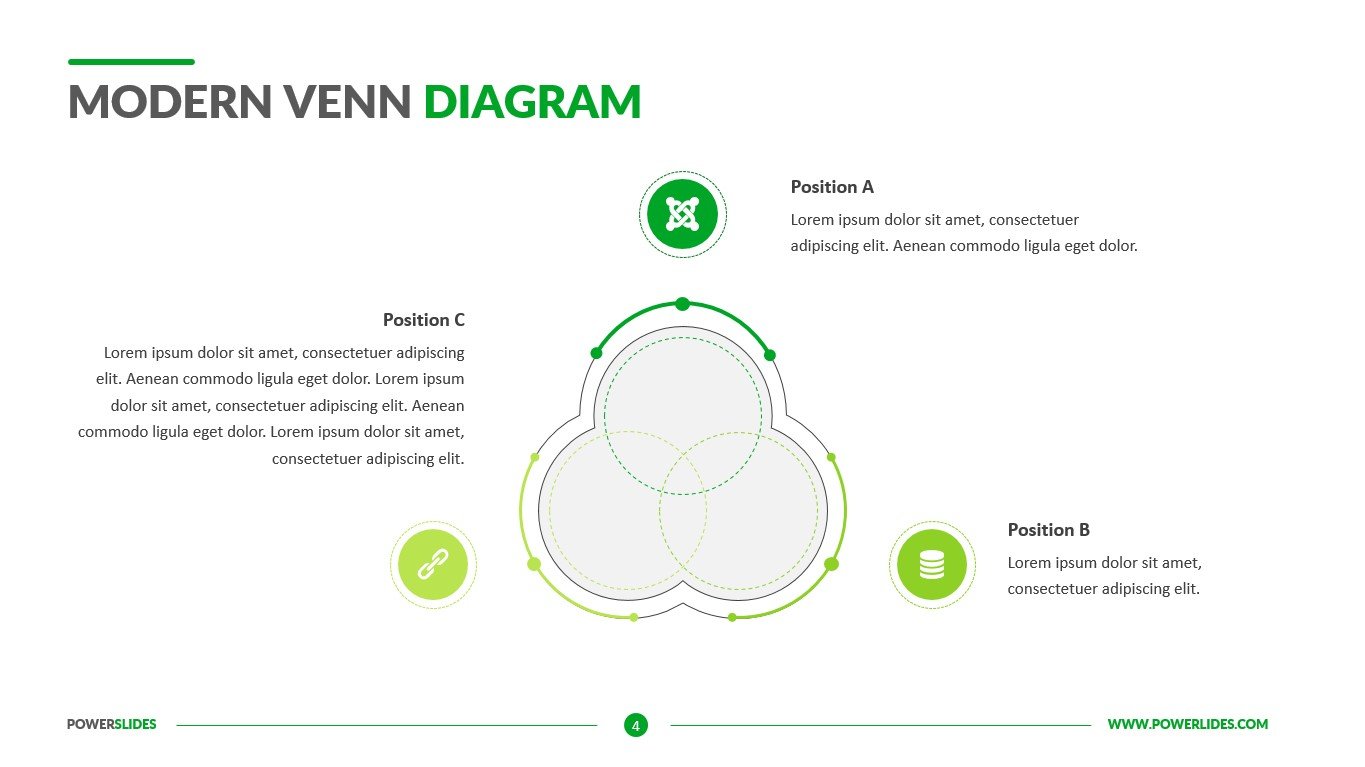
Overlapping Circle Chart
What do you think of this template?

 (3.00/ 5)
6 ratings

 4 Slides
 File size: 16:9
 Fonts: Lato Black, Calibri
 Supported version
PPT 2010, PPT 2013, PPT 2016
Supported version
PPT 2010, PPT 2013, PPT 2016

Product details
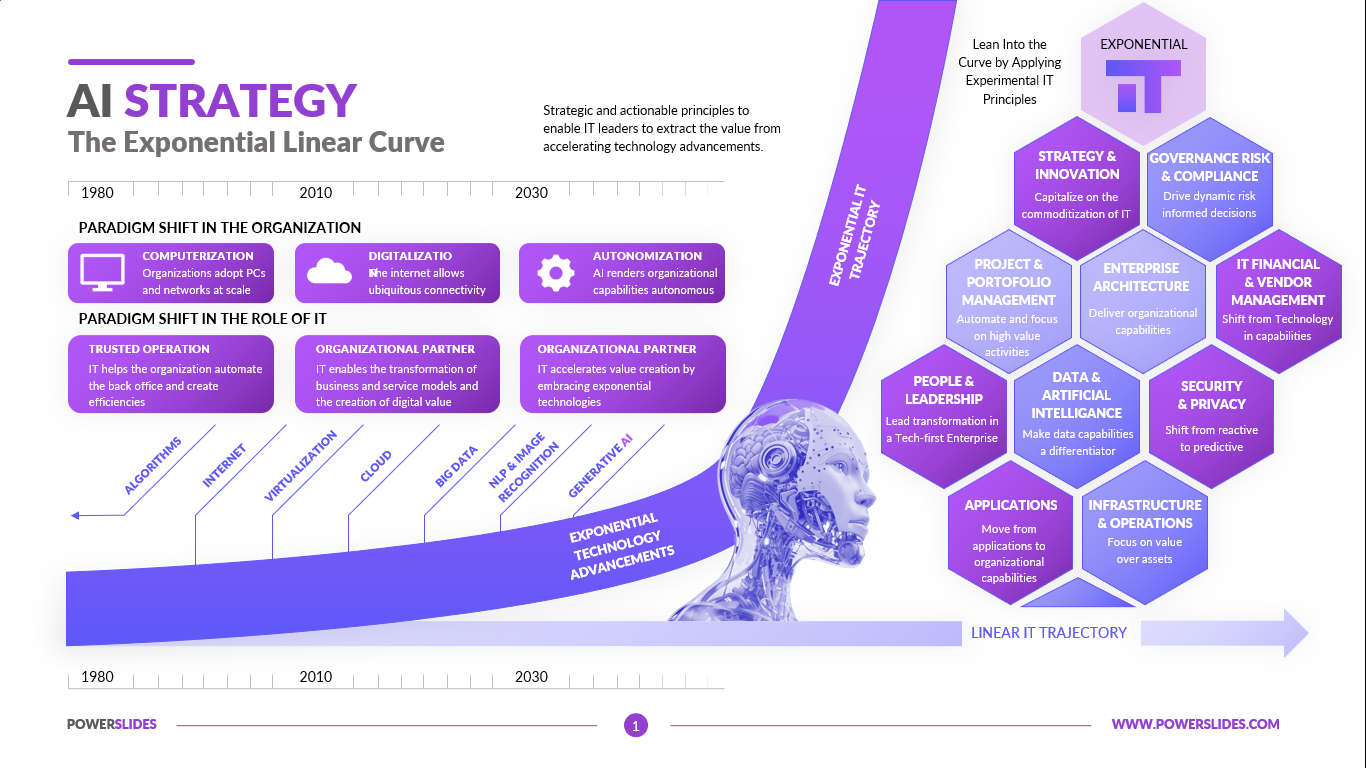
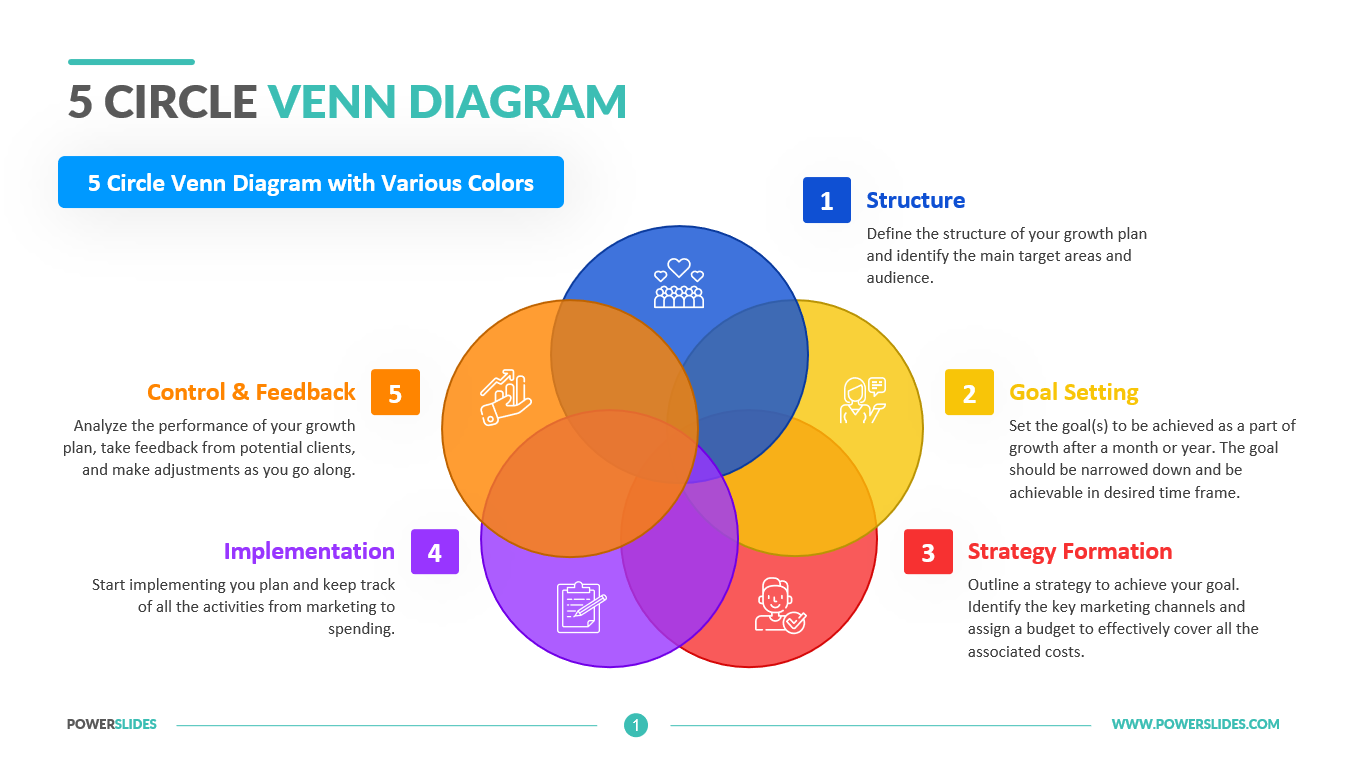
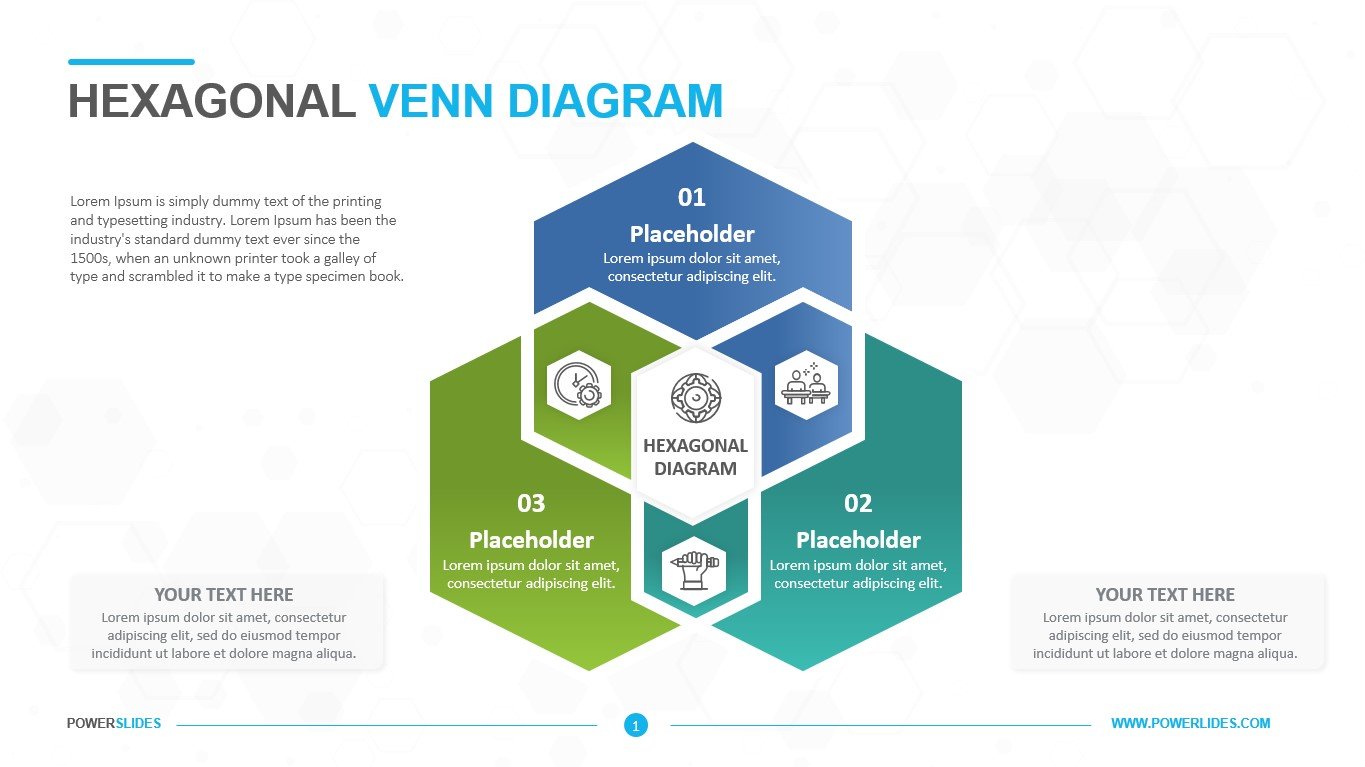
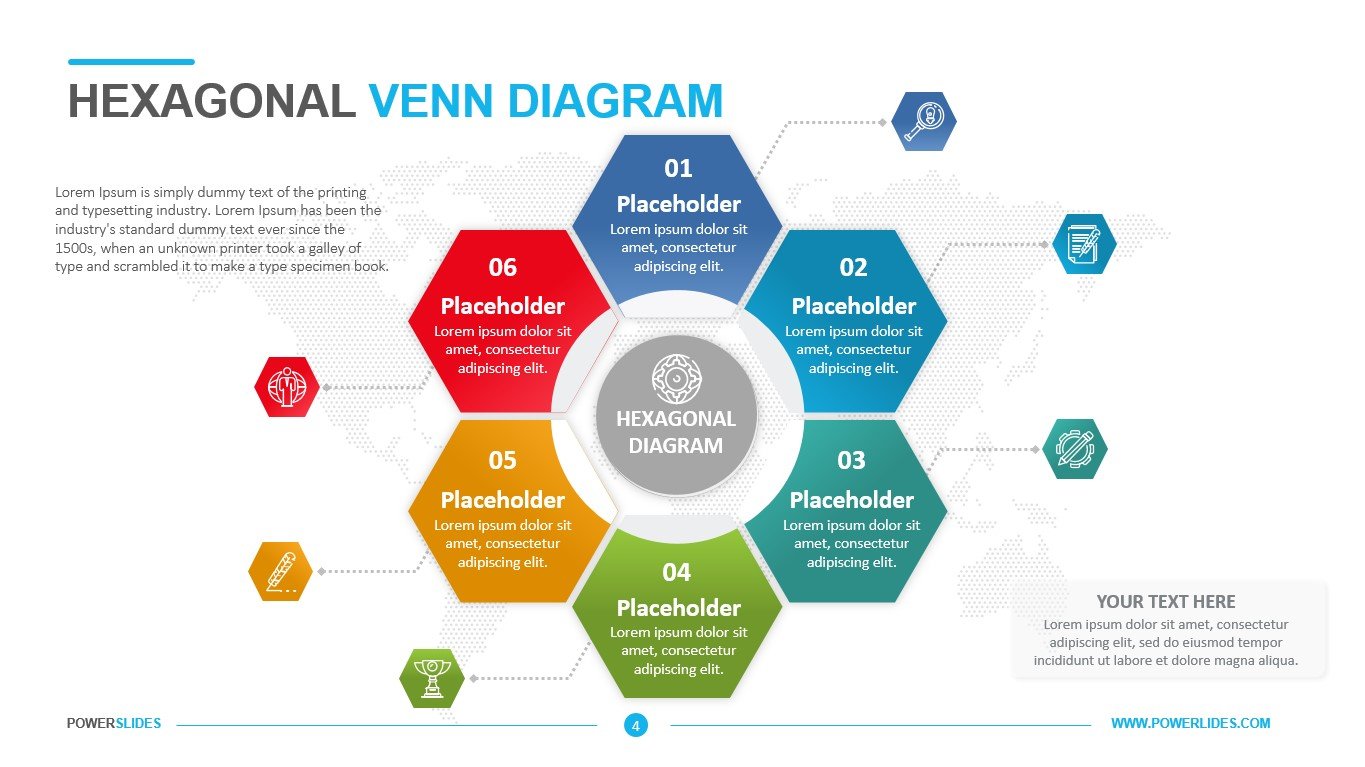
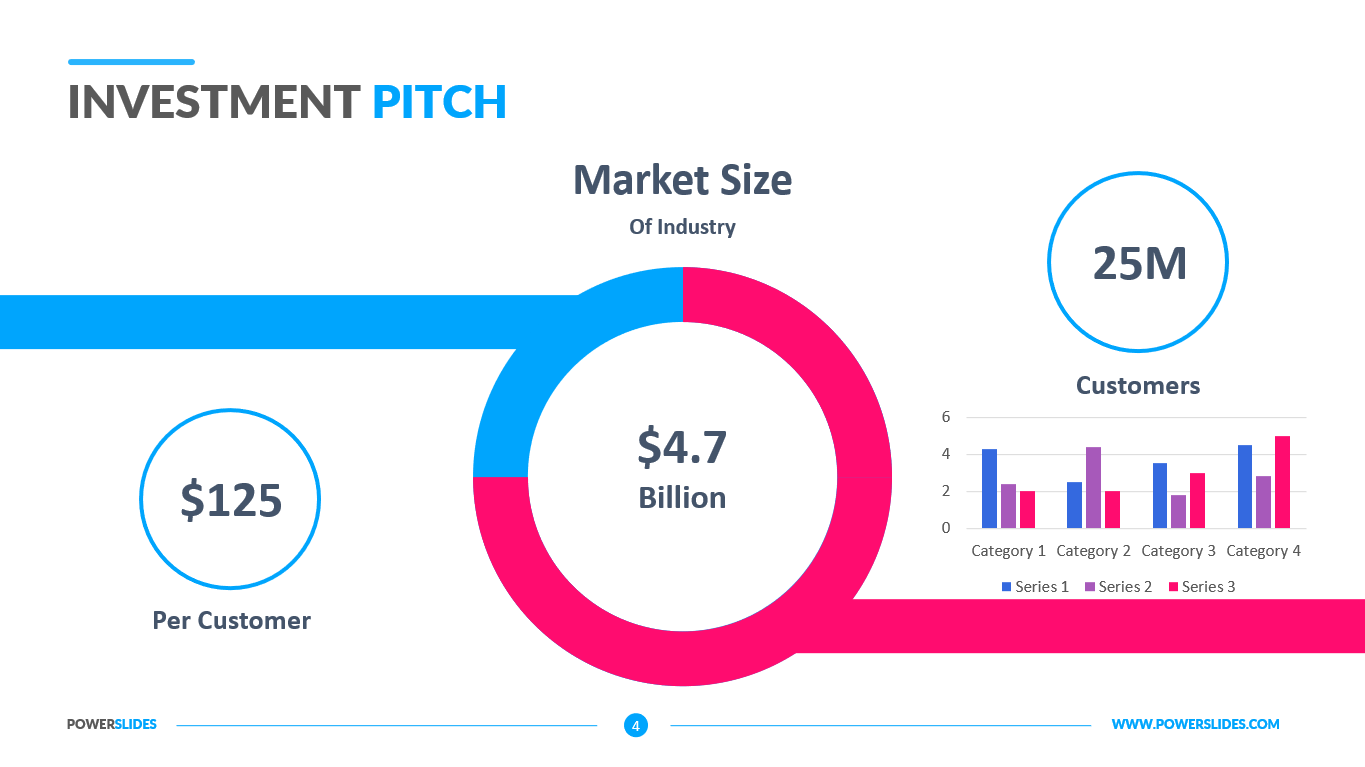
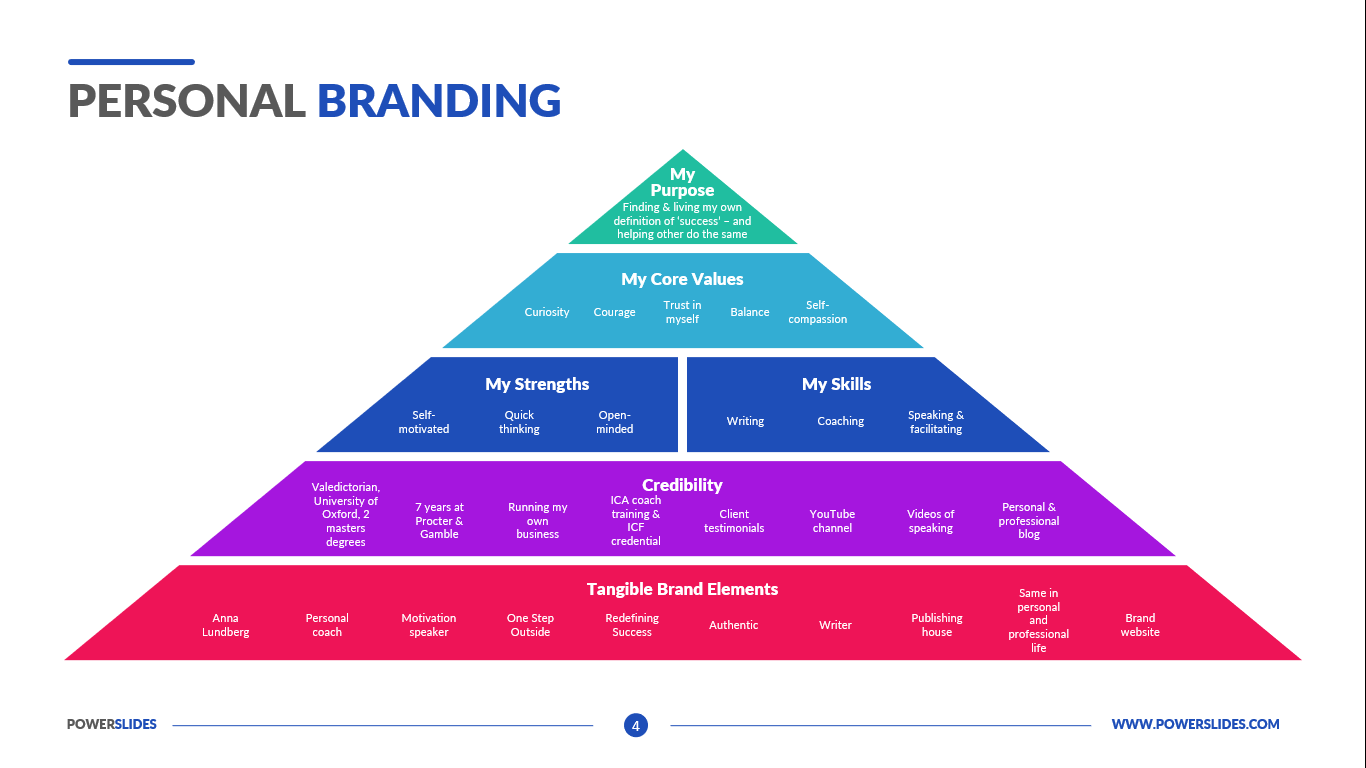
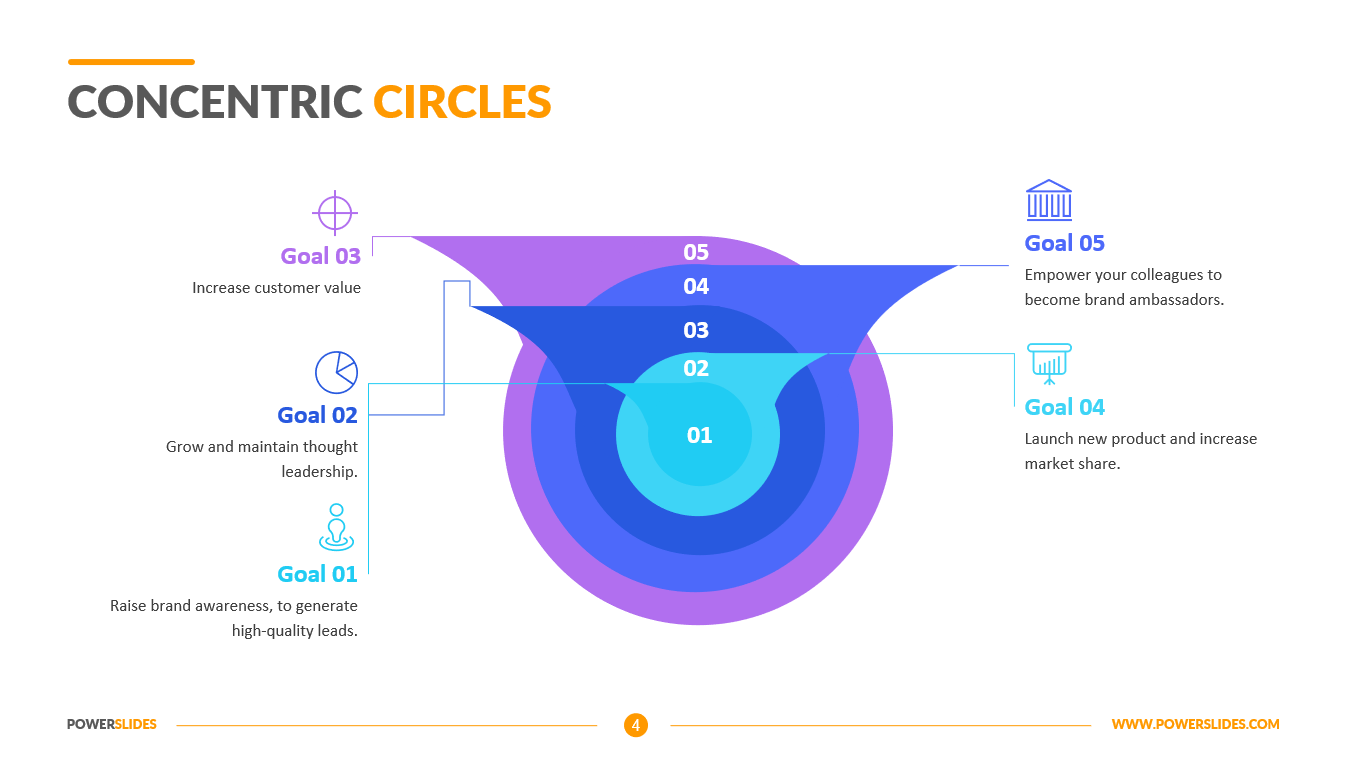
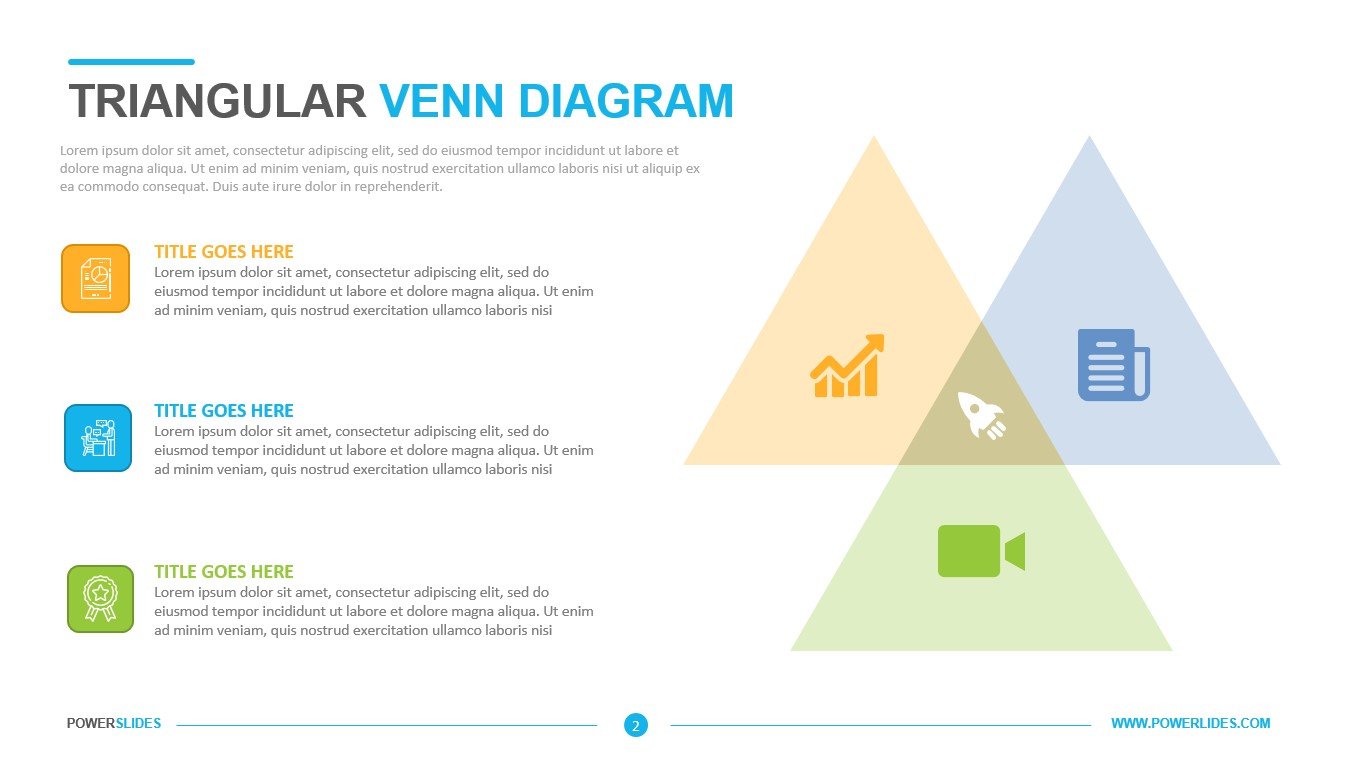
A Overlapping Circle Chart is an illustration that uses circles to show the relationships among things or finite groups of things. Circles that overlap have a commonality while circles that do not overlap do not share those traits.
Overlapping Circle Chart help to visually represent the similarities and differences between two concepts. They have long been recognized for their usefulness as educational tools.
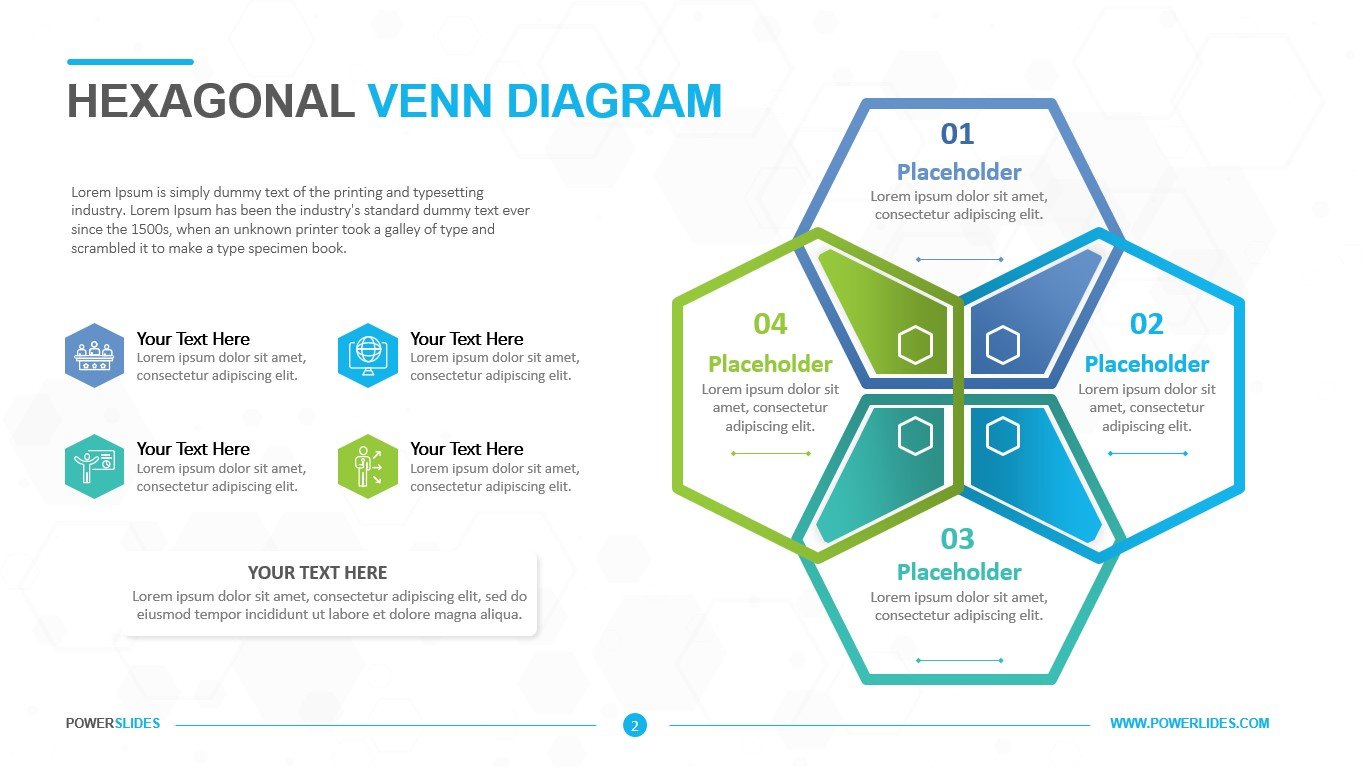
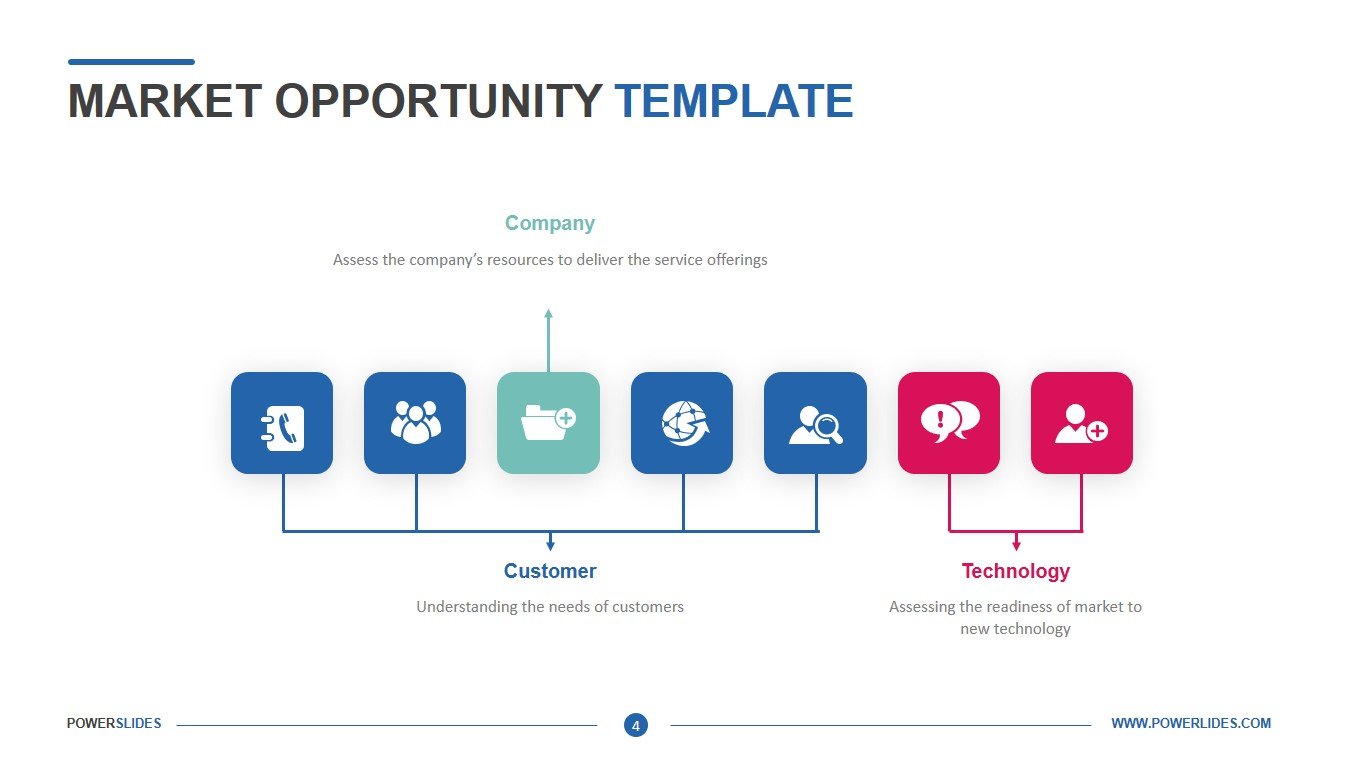
Overlapping Circle Chart are used to depict how items relate to each other against an overall backdrop, universe, data set, or environment. Overlapping Circle Chart could be used, for example, to compare two companies within the same industry by illustrating the products both companies offer (where circles overlap) and the products that are exclusive to each company (outer circles).
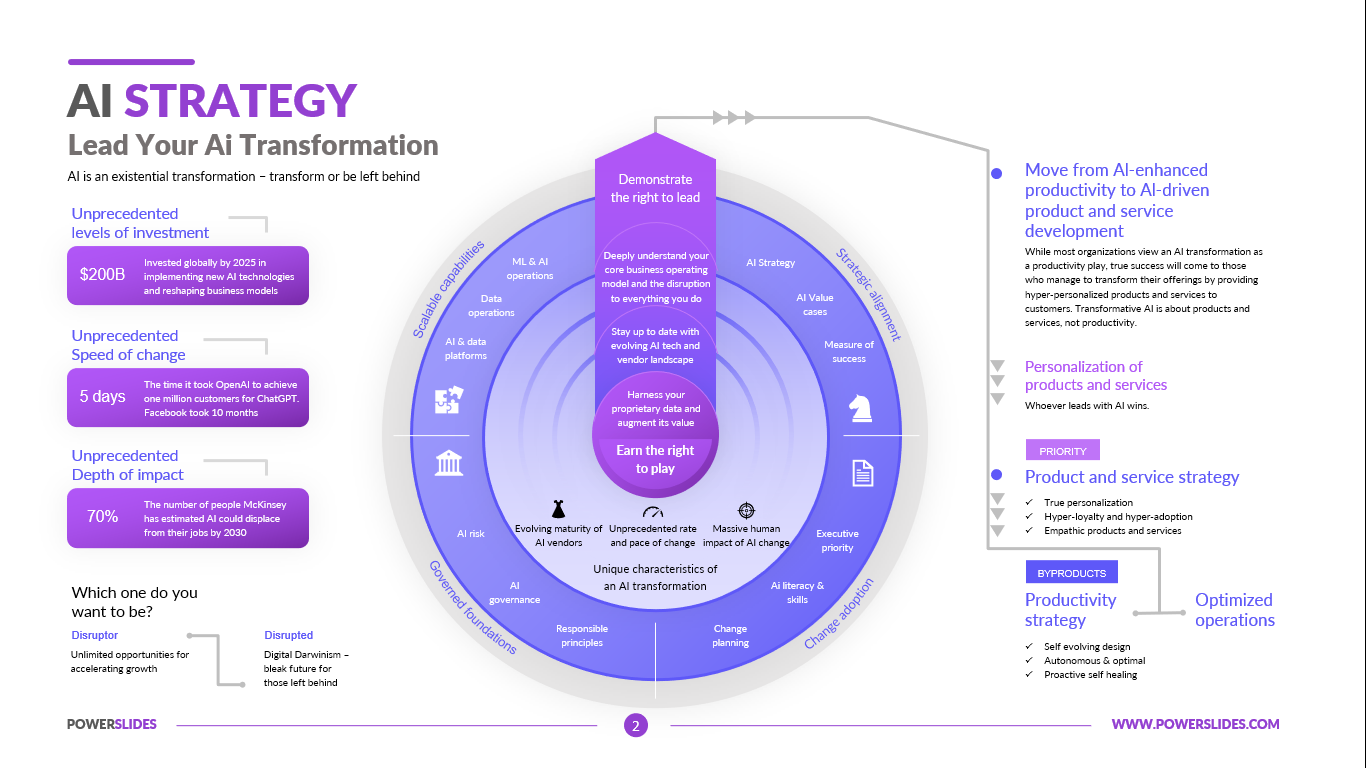
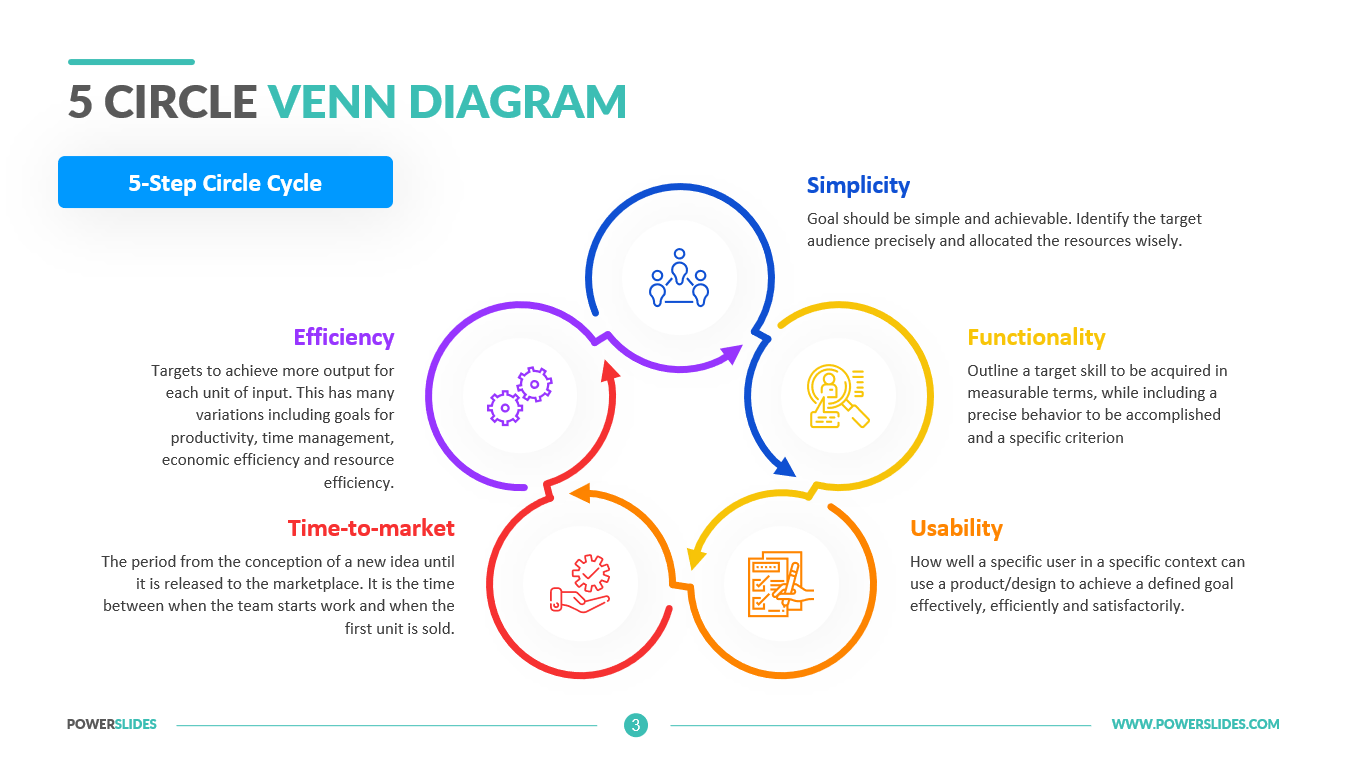
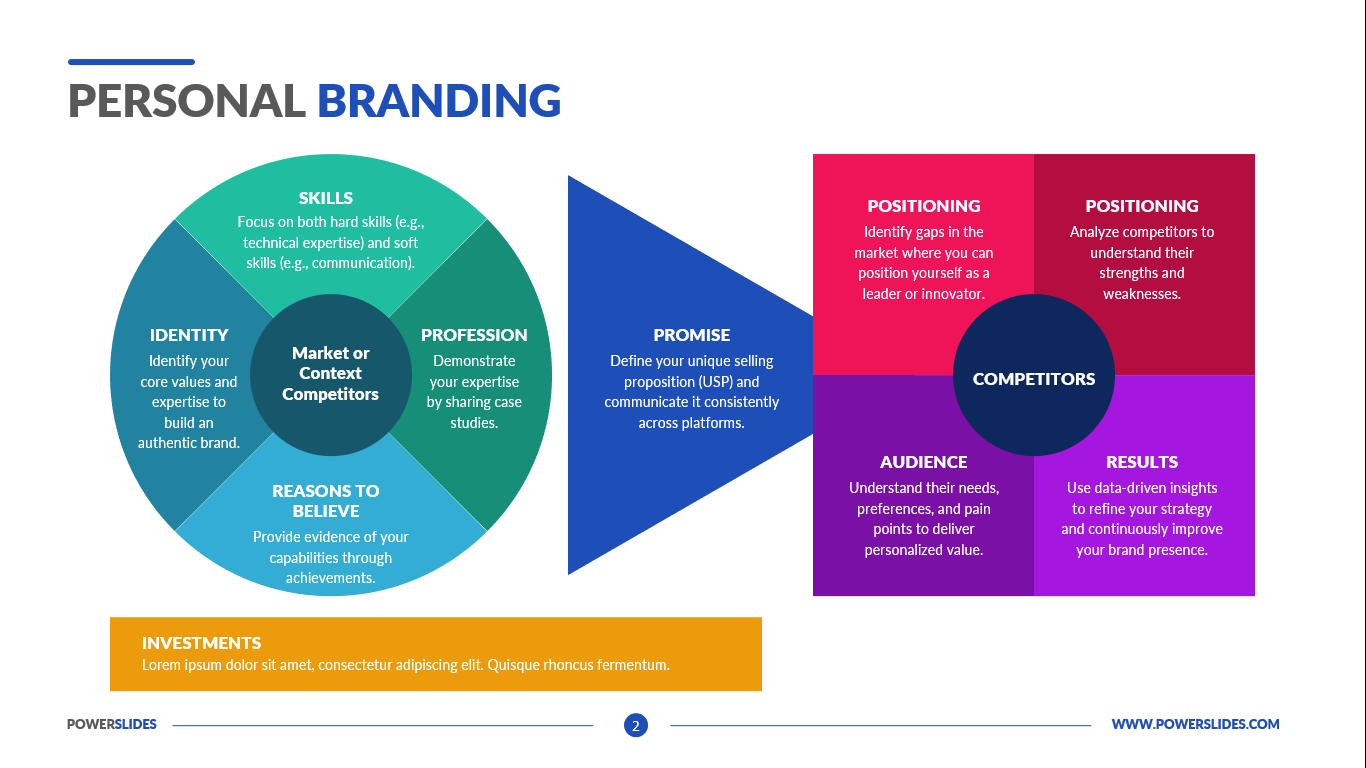
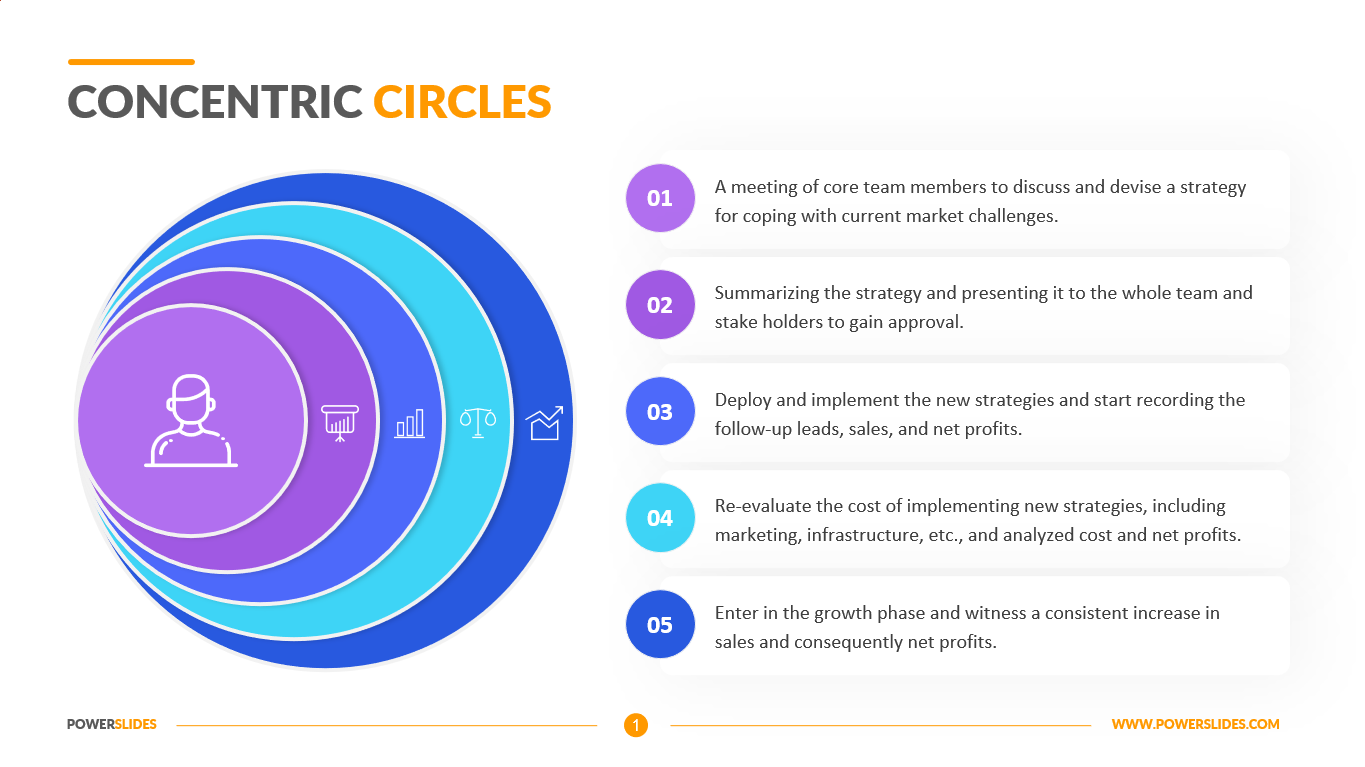
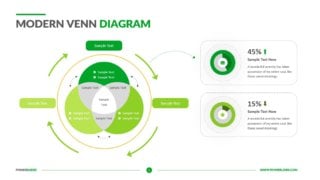
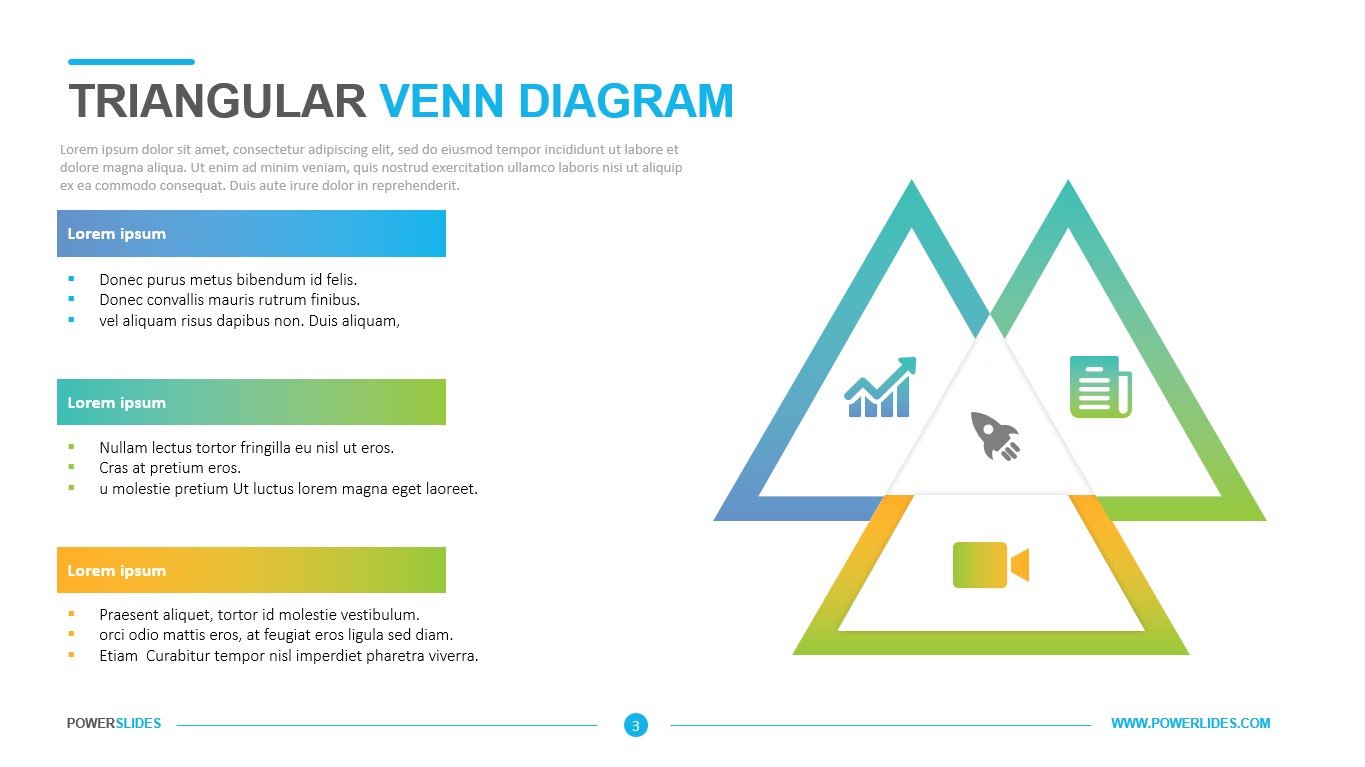
Overlapping Circle Charts are, at a basic level, simple pictorial representations of the relationship that exists between two sets of things. However, they can be much more complex.
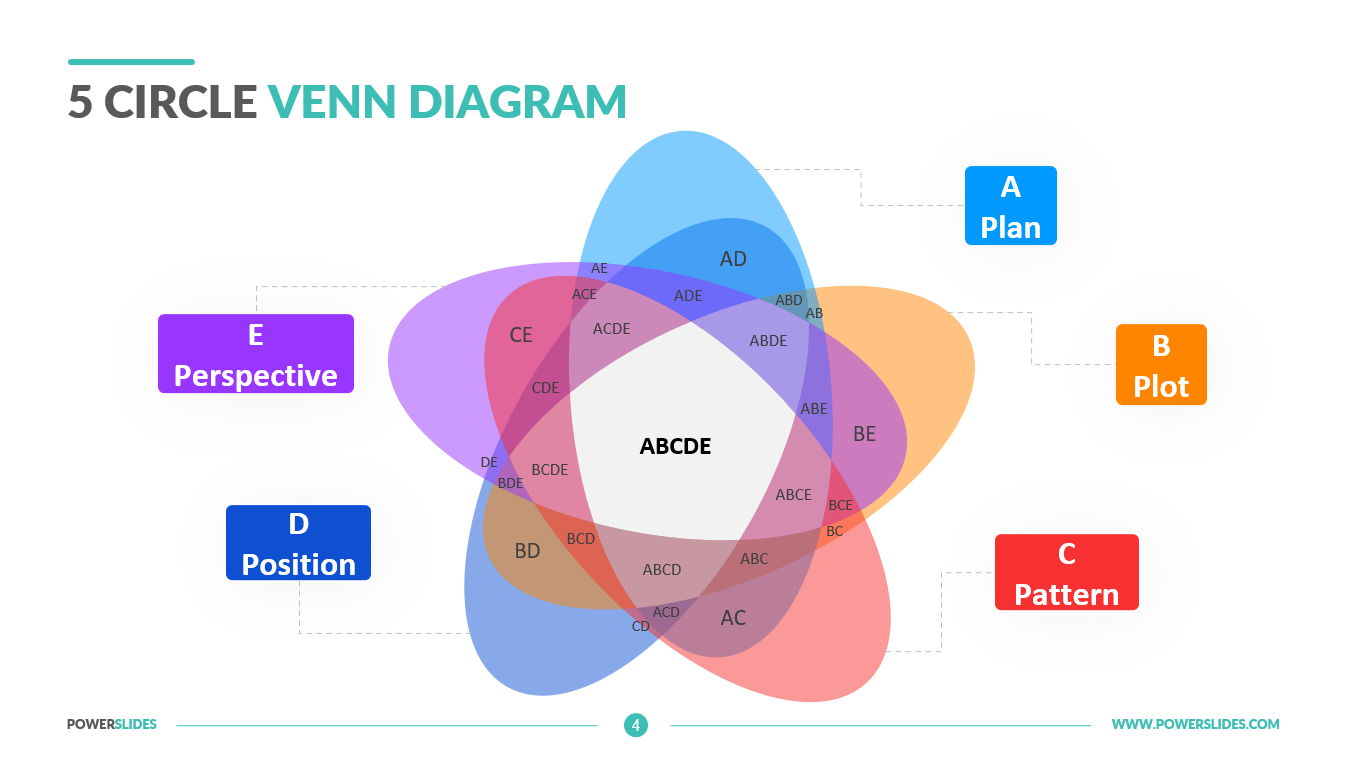
Overlapping Circle Chart is read by observing all of the circles that make up the entire diagram. Each circle is its own item or data set. The portions of the circles that overlap indicate the areas that are in common amongst the different items whereas the parts that do not overlap indicate unique traits among the item or data set represented by the circle.
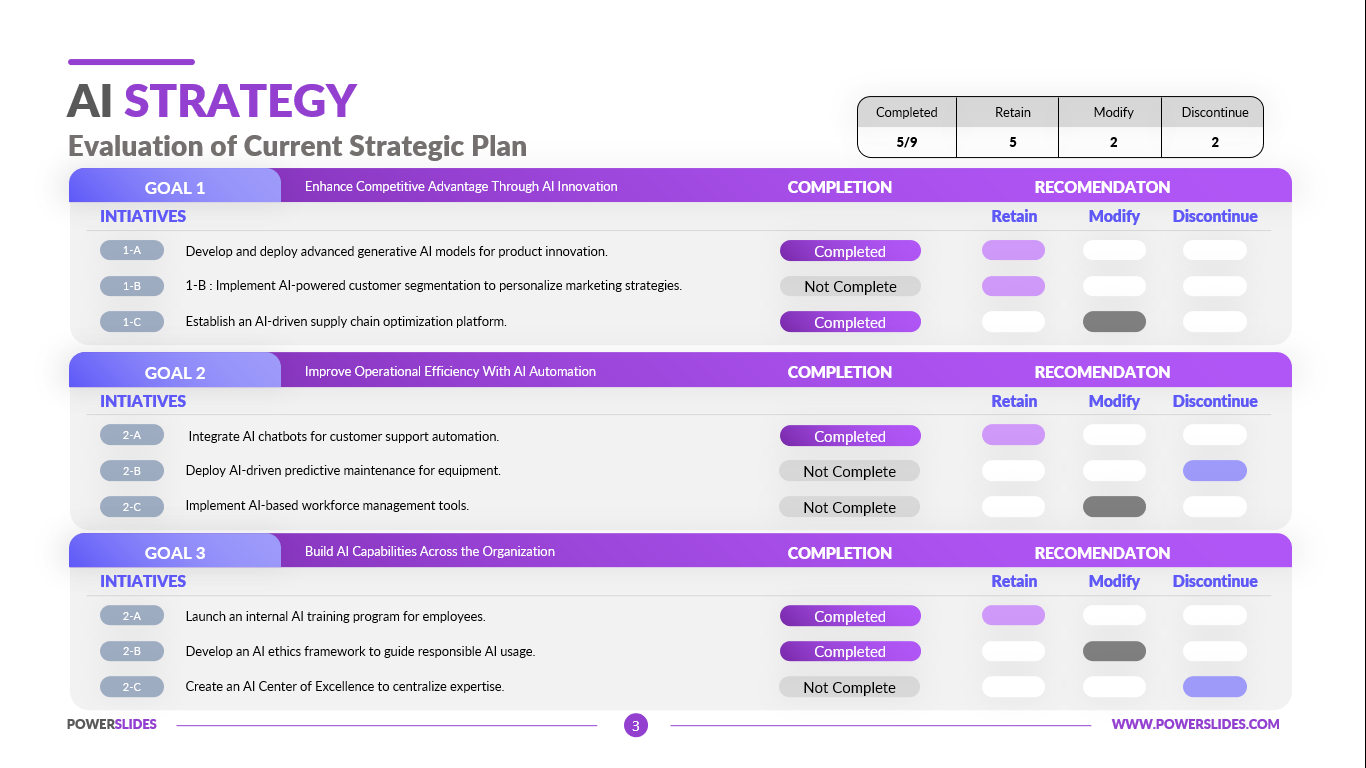
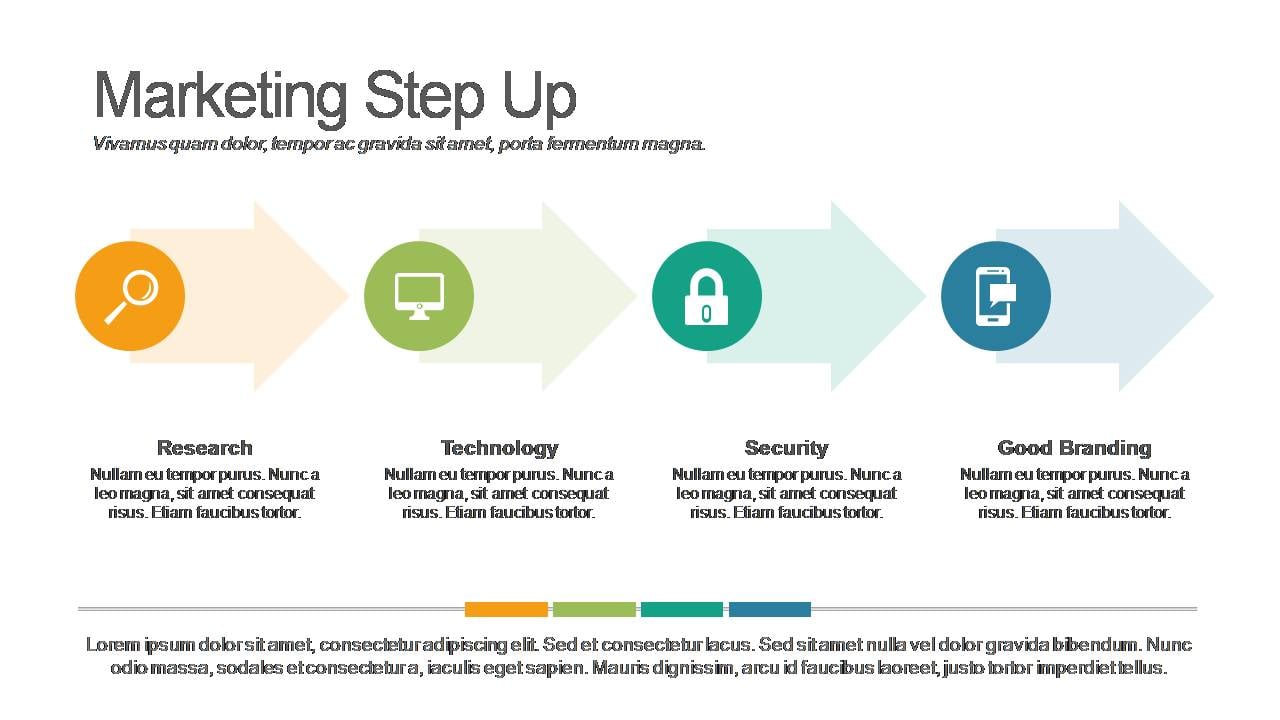
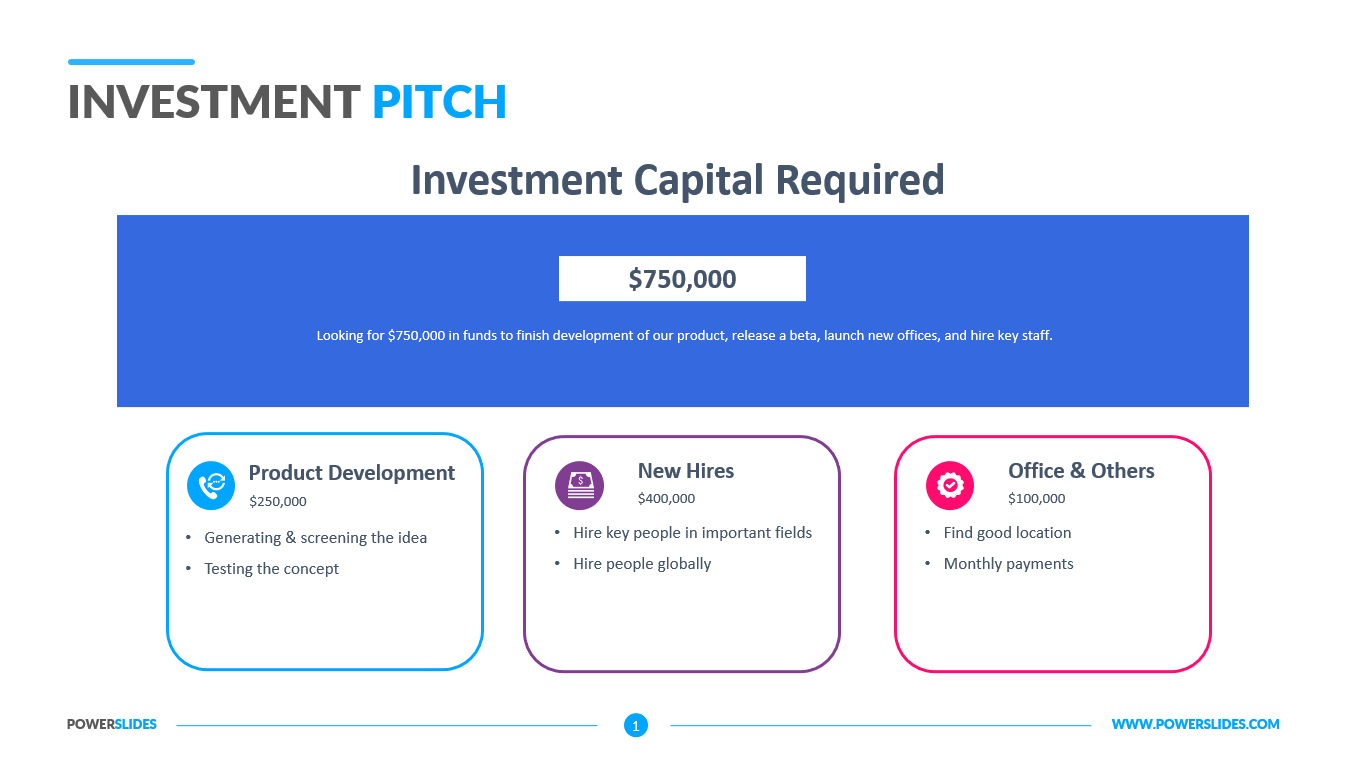
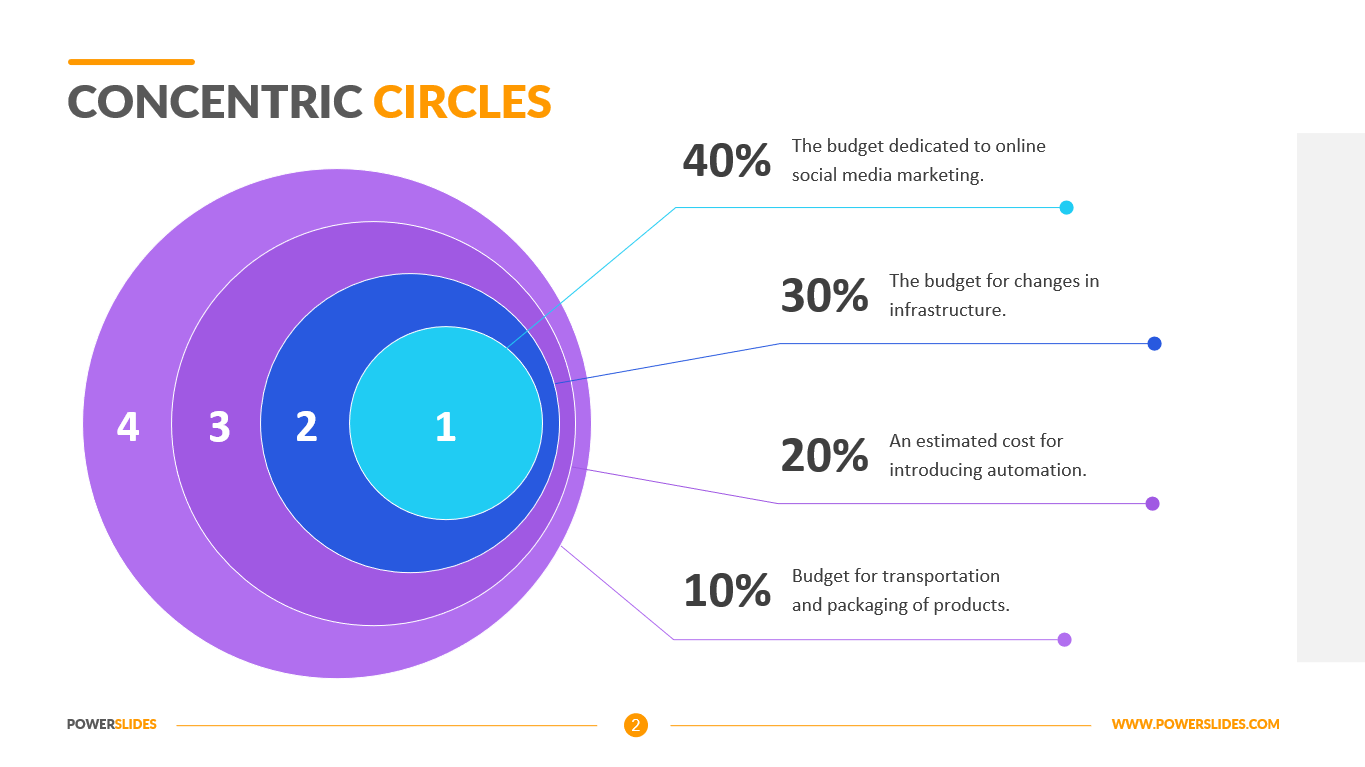
Marketers can use the slides from this template when preparing their marketing strategy. For example, you can specify which advertising promotion channels will be involved and what joint goals will be solved by each of these channels. The slides in this template will be useful for analysts when preparing policy briefs and reports. You can imagine dependencies between different factors and imagine the same parameters for each investigated component.
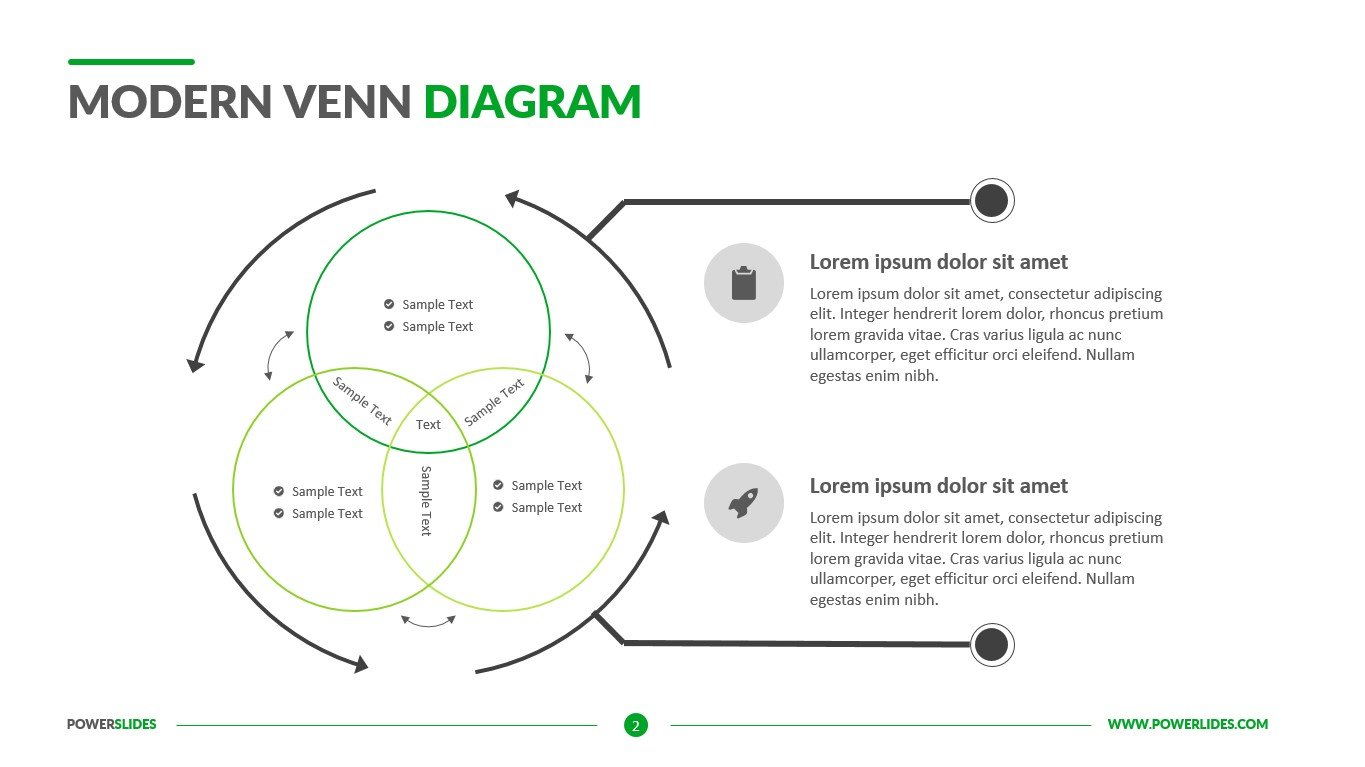
University professors can use the slides in this template when preparing their courses on logic or determining the cumulative effect of factors. Also, this template can be used by financiers when preparing an analysis of the company’s performance and their joint impact on the company’s profit.
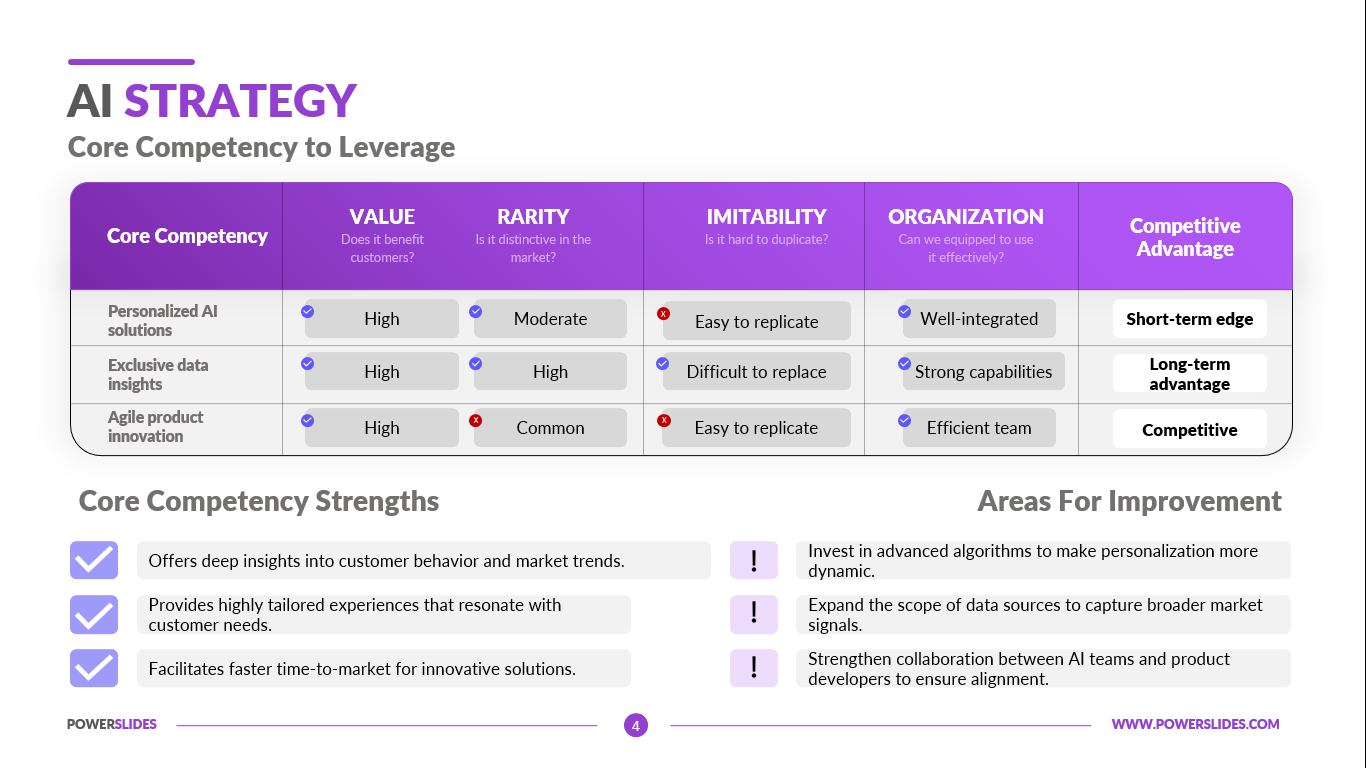
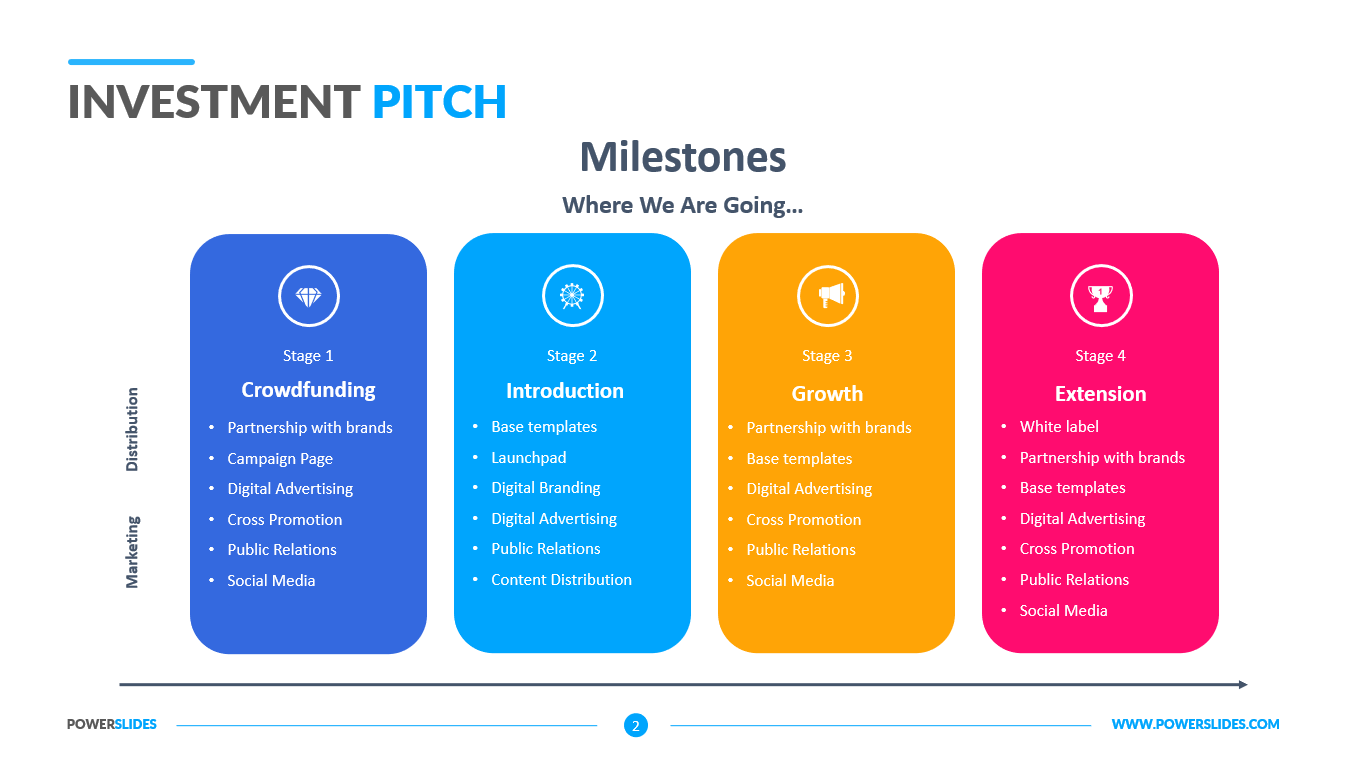
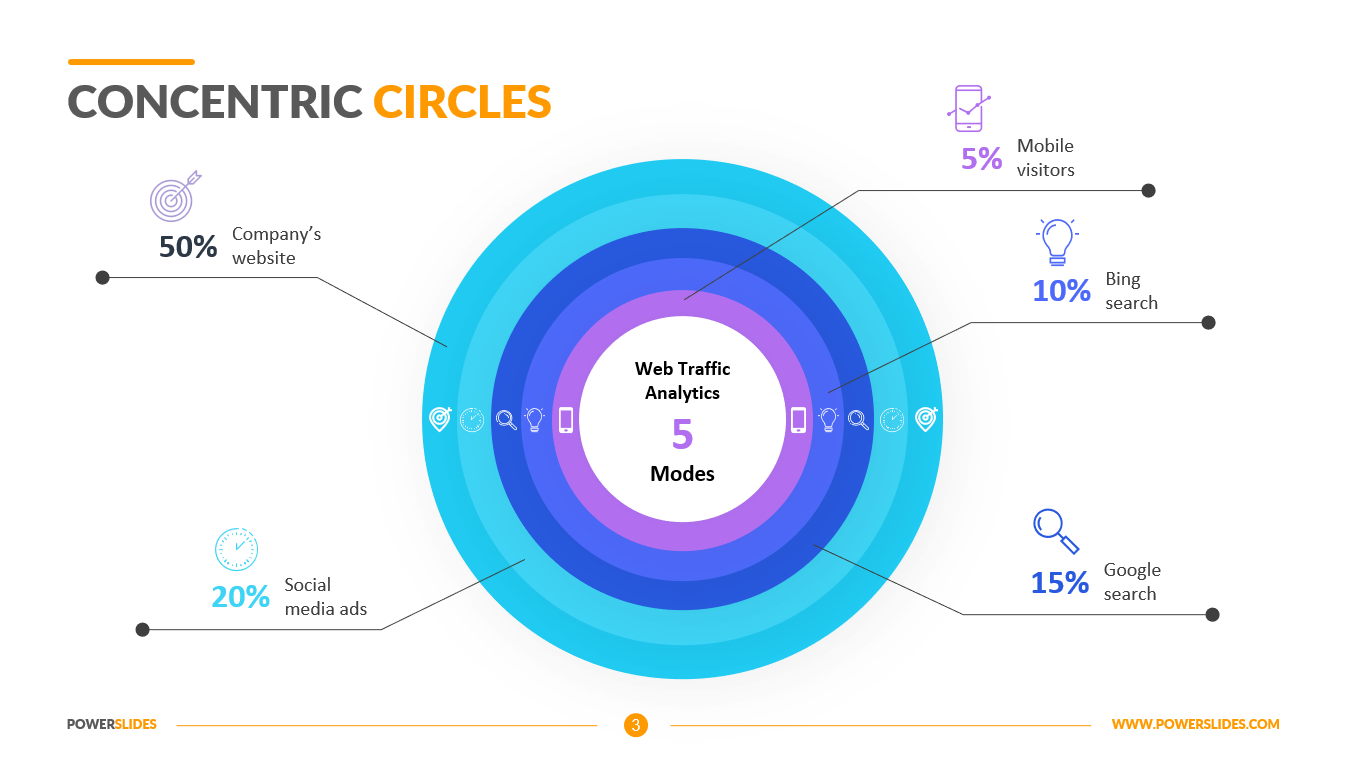
You can also use this template when comparing your products to those of your competitors. You can describe in detail the general properties of the product and what properties distinguish your product from competitors’ products.
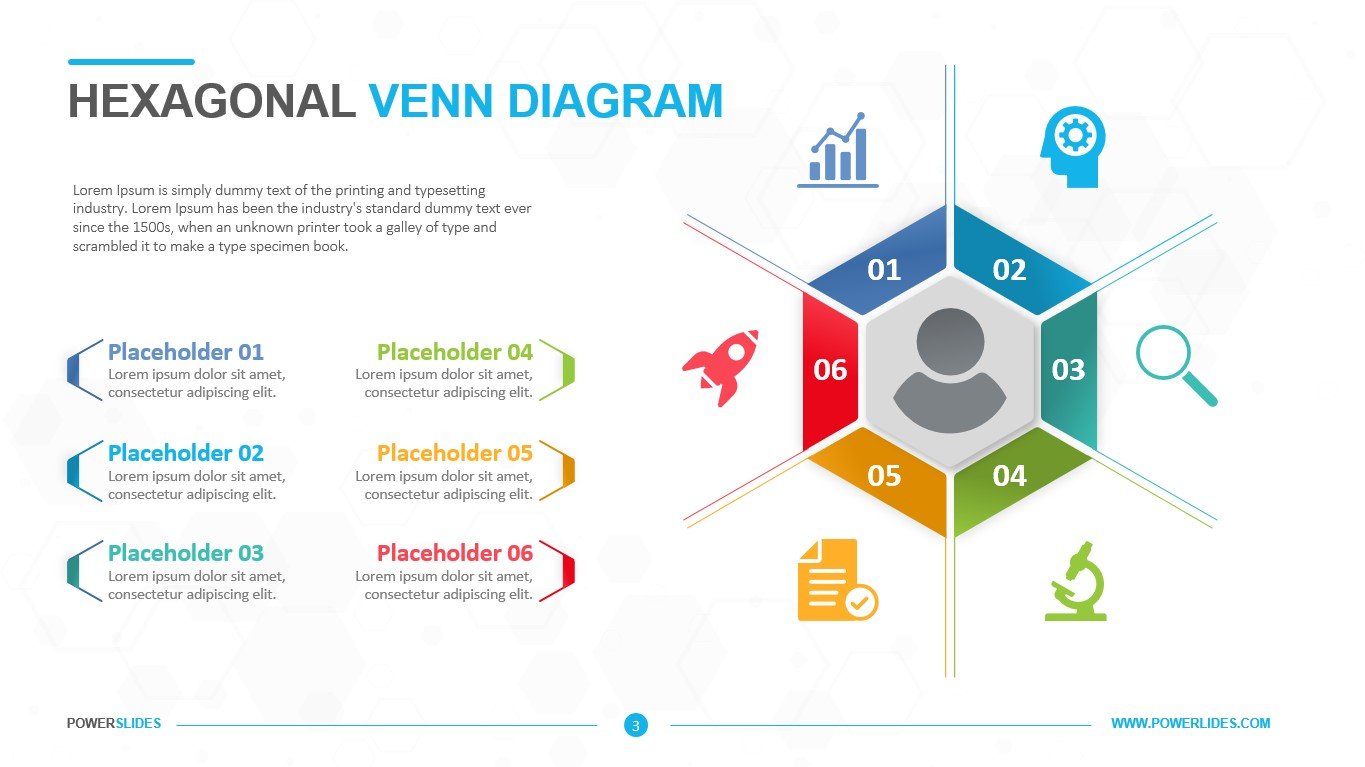
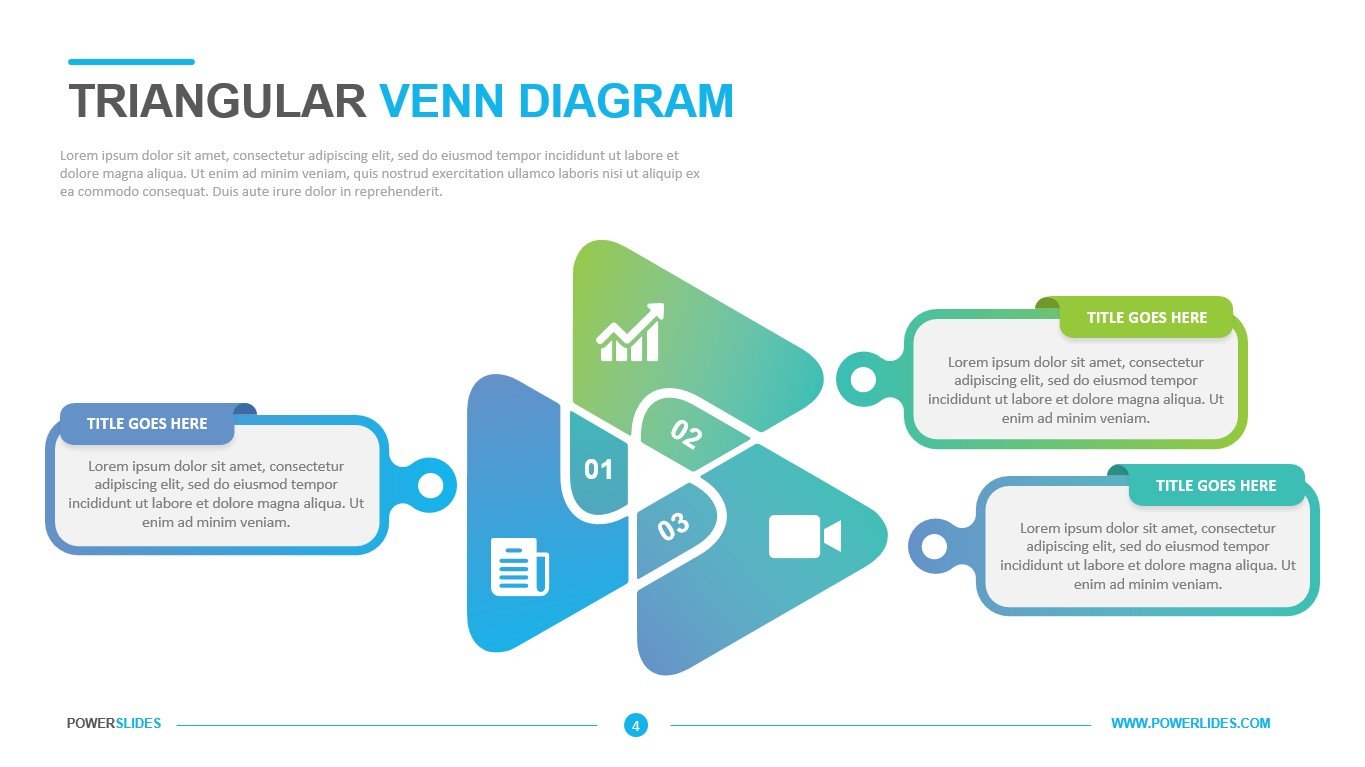
Financial brokers can use this template when preparing an analysis of stock or bond quotes. You can prepare an analysis in several categories – liquidity, profitability, capital turnover. Using Overlapping Circle Chart will help you present complex data in a simple and understandable way for your audience.
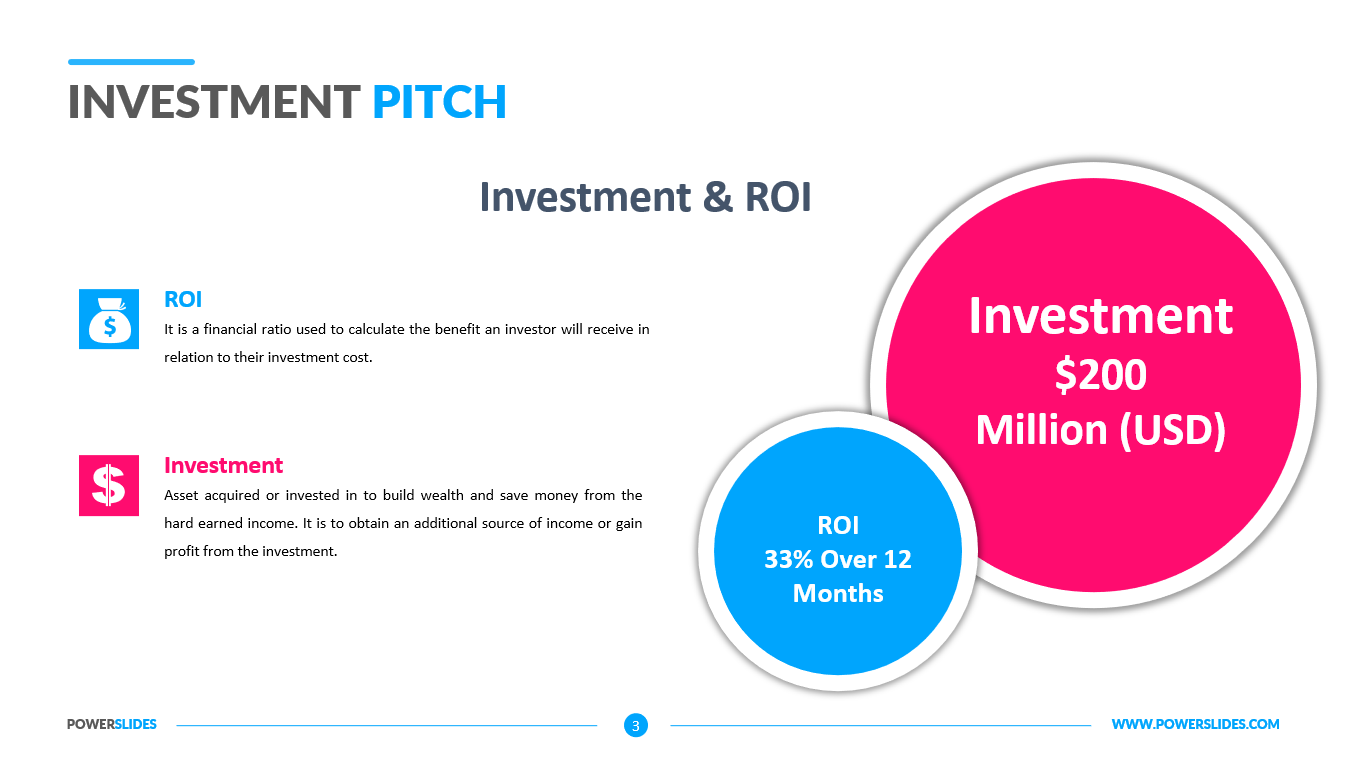
Overlapping Circle Chart is a professional and modern template that contains four stylish and fully editable slides. You can independently change the size and type of fonts, position and size of infographics according to your corporate requirements. This template will be useful for teachers of foreign languages, specialists in teaching platforms. Overlapping Circle Chart Template will be a worthy addition to your collection of professional presentations.


