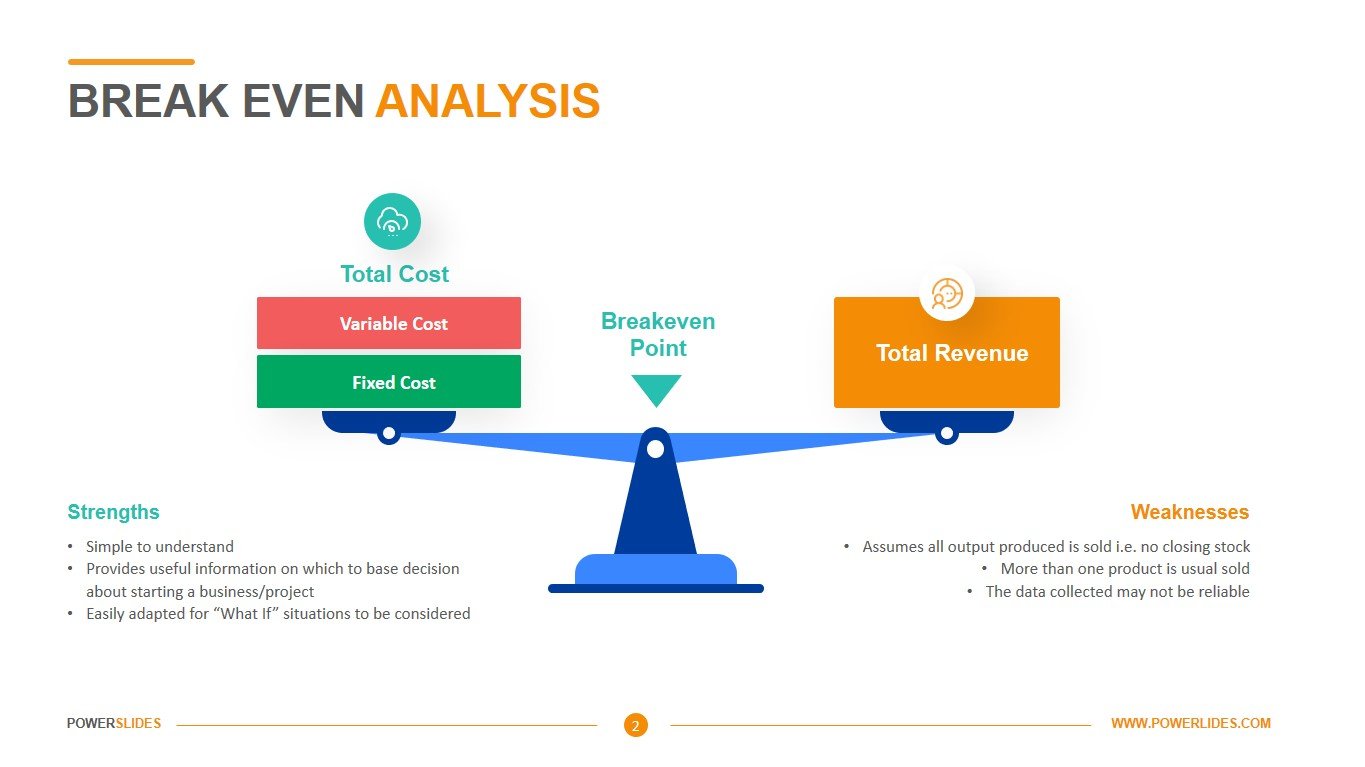
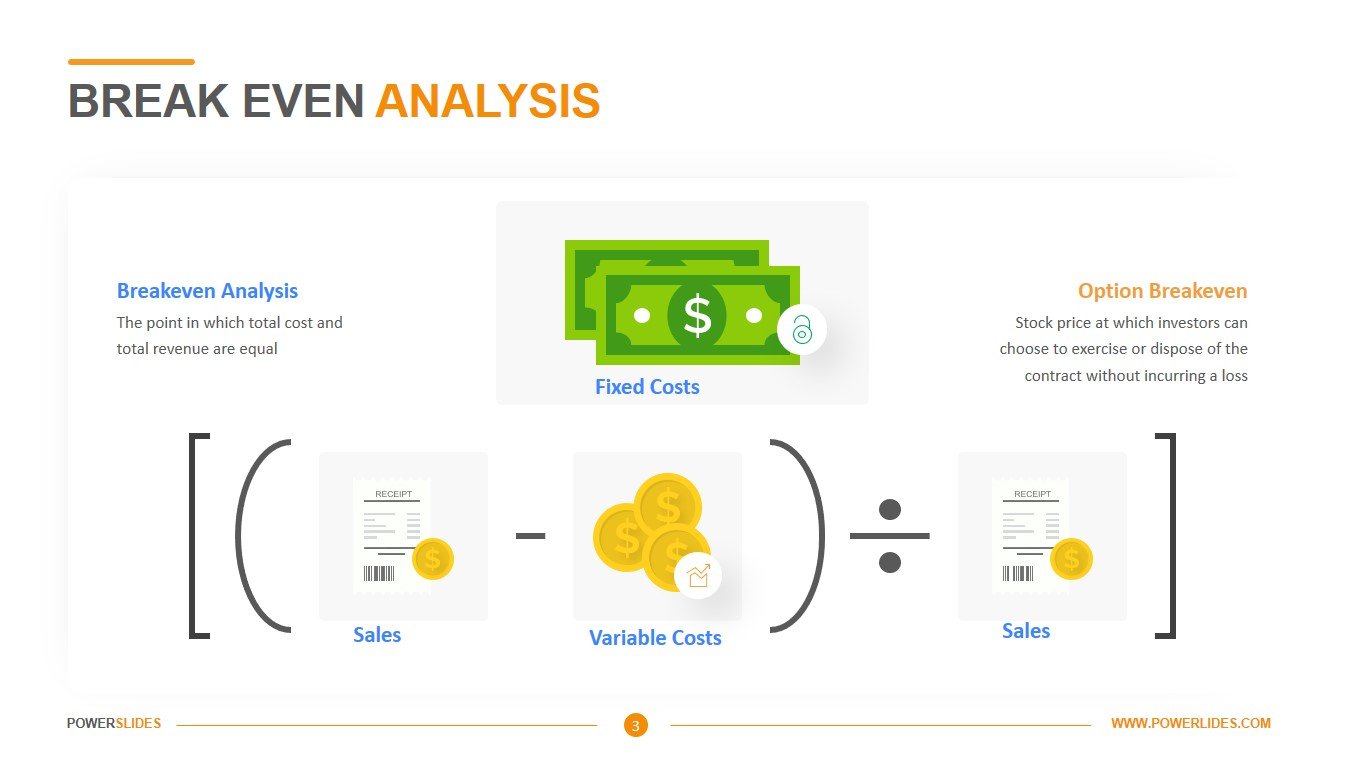
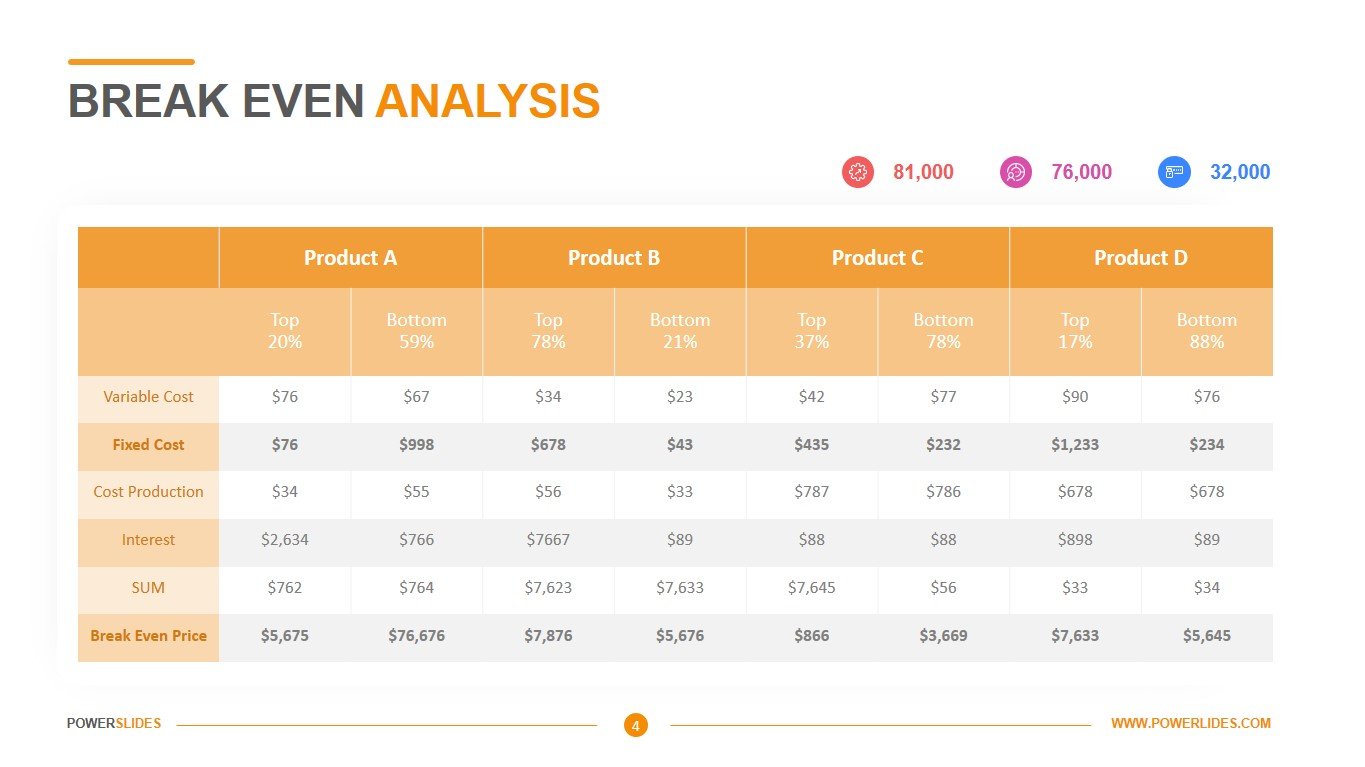
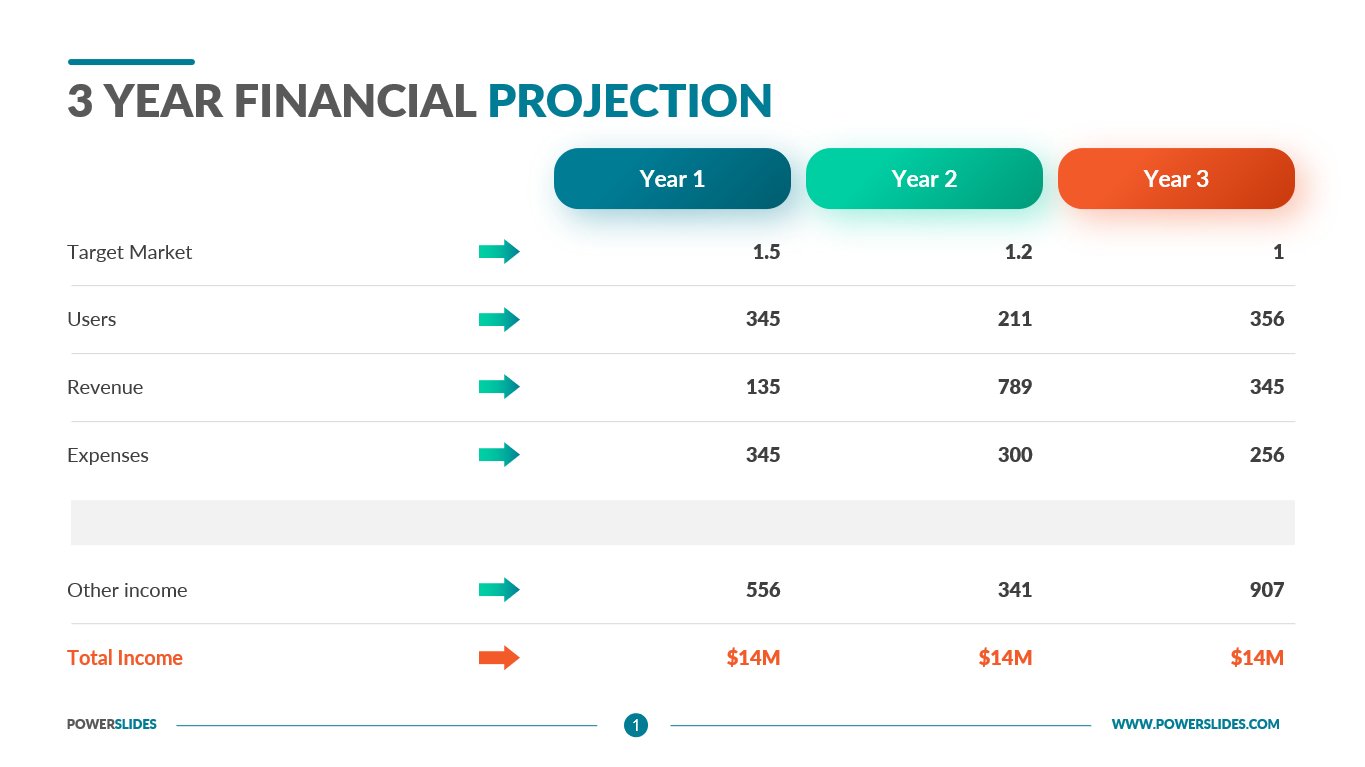
Economic Indicators
What do you think of this template?

 (4.50/ 5)
9 ratings

 4 Slides
 File size: 16:9
 Fonts: Lato Black, Calibri
 Supported version
PPT 2010, PPT 2013, PPT 2016
Supported version
PPT 2010, PPT 2013, PPT 2016

Product details
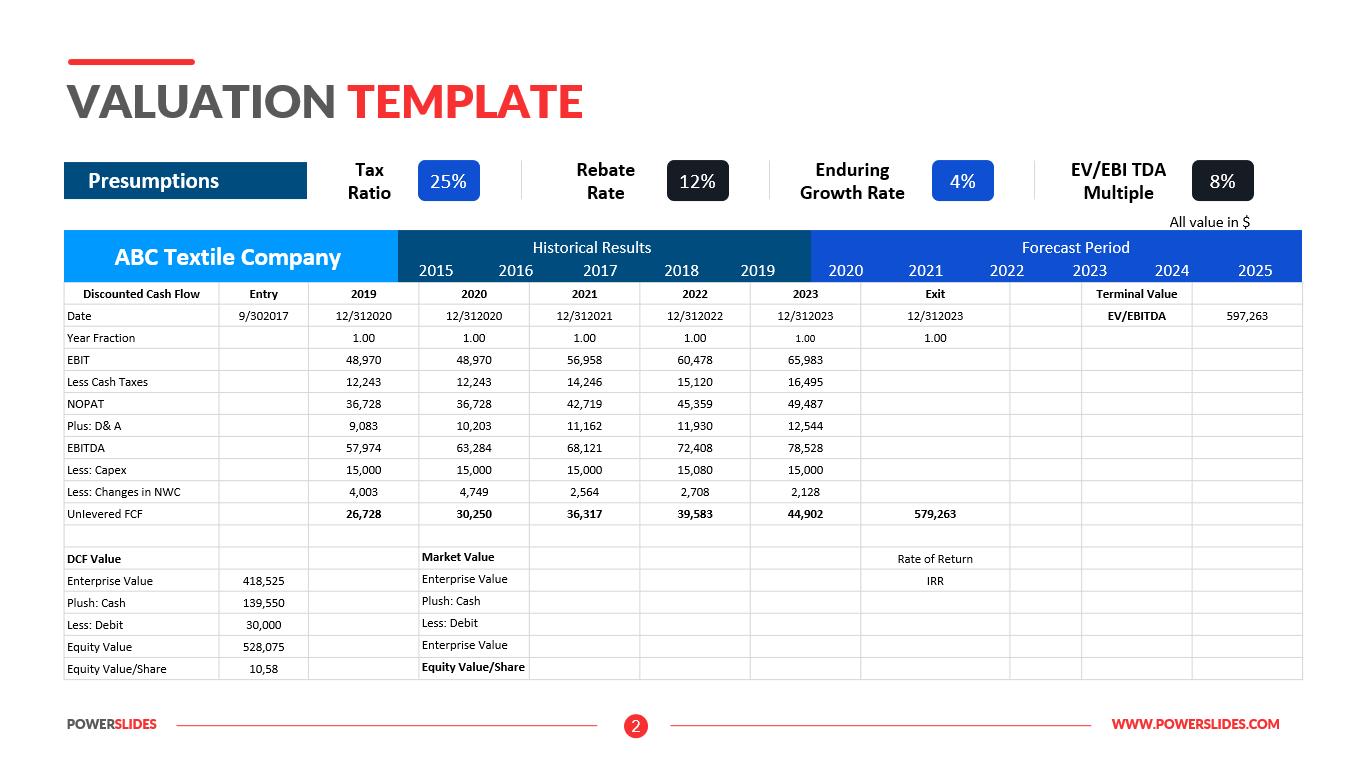
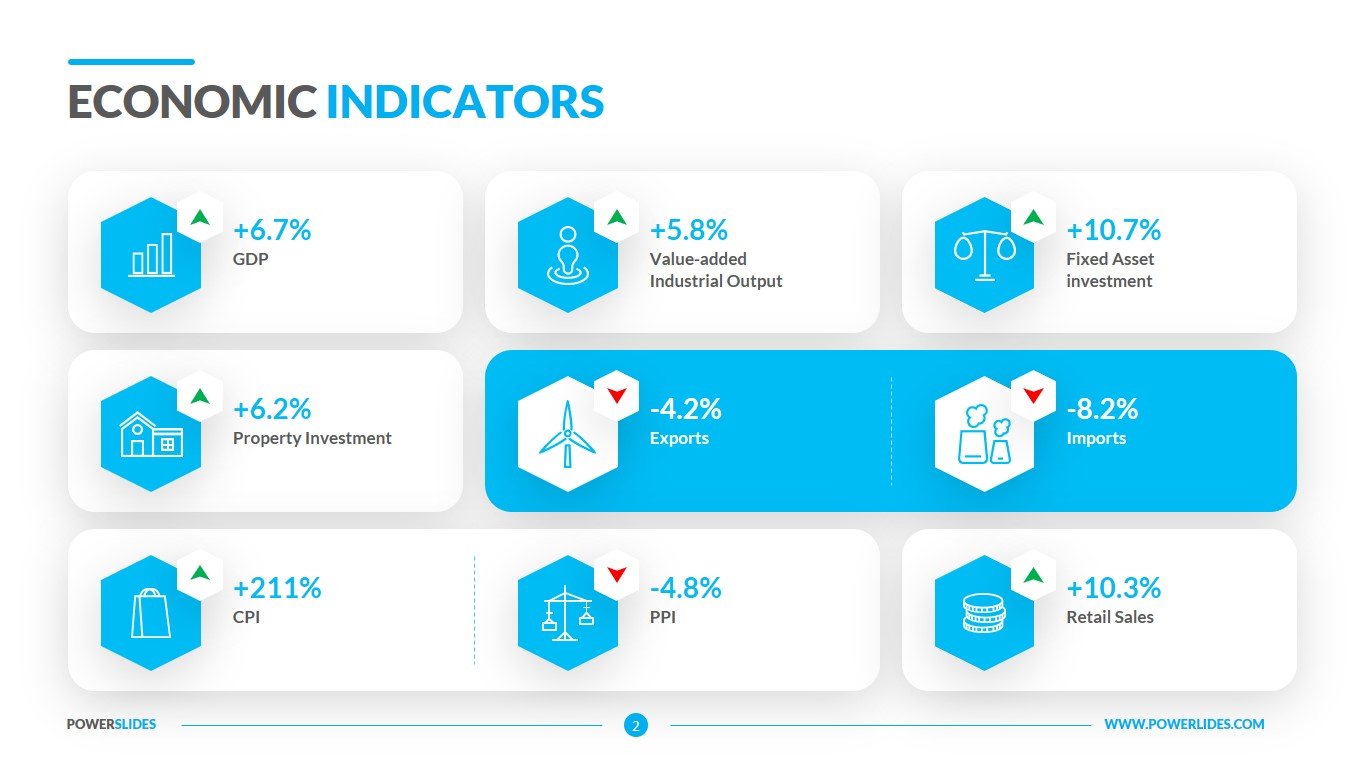
An economic indicator is a piece of economic data, usually of a macroeconomic scale, that is used by analysts to interpret current or future investment possibilities. These indicators also help to judge the overall health of an economy. Economic indicators can be anything the investor chooses, but specific pieces of data released by the government and non-profit organizations have become widely followed. Such indicators include but aren’t limited to The Consumer Price Index (CPI), Gross domestic product (GDP), Unemployment figures, Price of crude oil. Leading indicators, such as the yield curve, consumer durables, net business formations, and share prices, are used to predict the future movements of the economy. The numbers or data on these financial guideposts will move or change before the economy, thus their category’s name. Coincident indicators, which include such things as GDP, employment levels, and retail sales, are seen with the occurrence of specific economic activities. This class of metrics shows the activity of a particular area or region. Lagging indicators, such as gross national product (GNP), CPI, unemployment rates, and interest rates, are only seen after a specific economic activity occurs. One of the top leading indicators is the stock market itself. Though not the most critical leading indicator, it’s the one that most people look at. Because stock prices factor in forward-looking performance, the market can indicate the economy’s direction, if earnings estimates are accurate.
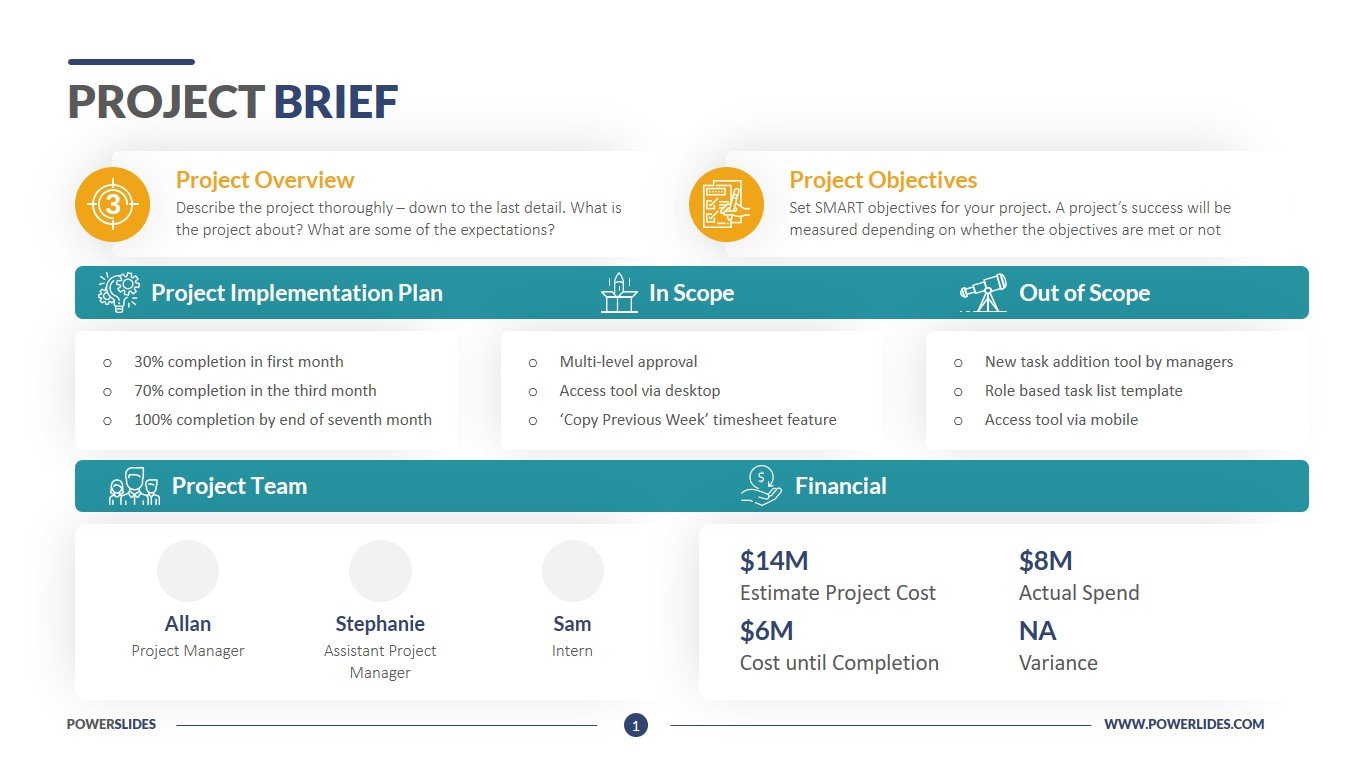
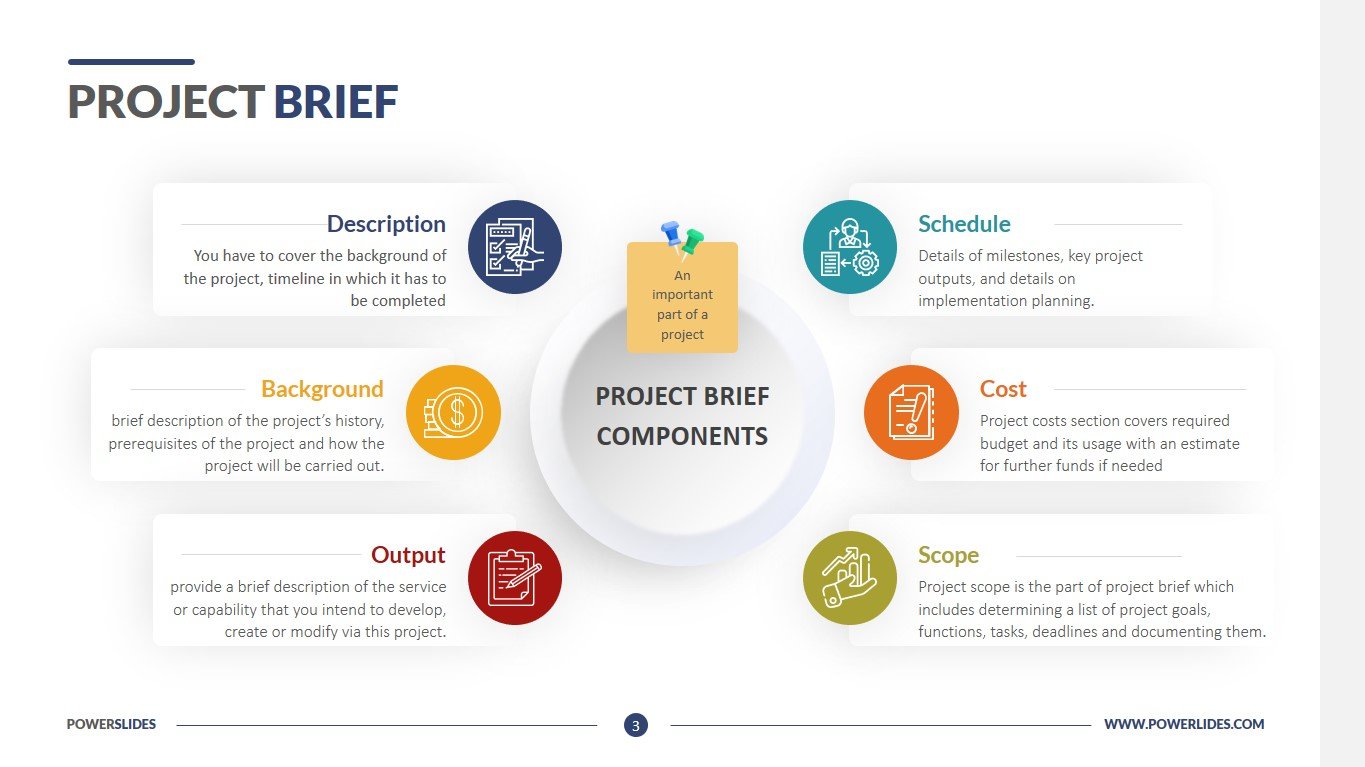
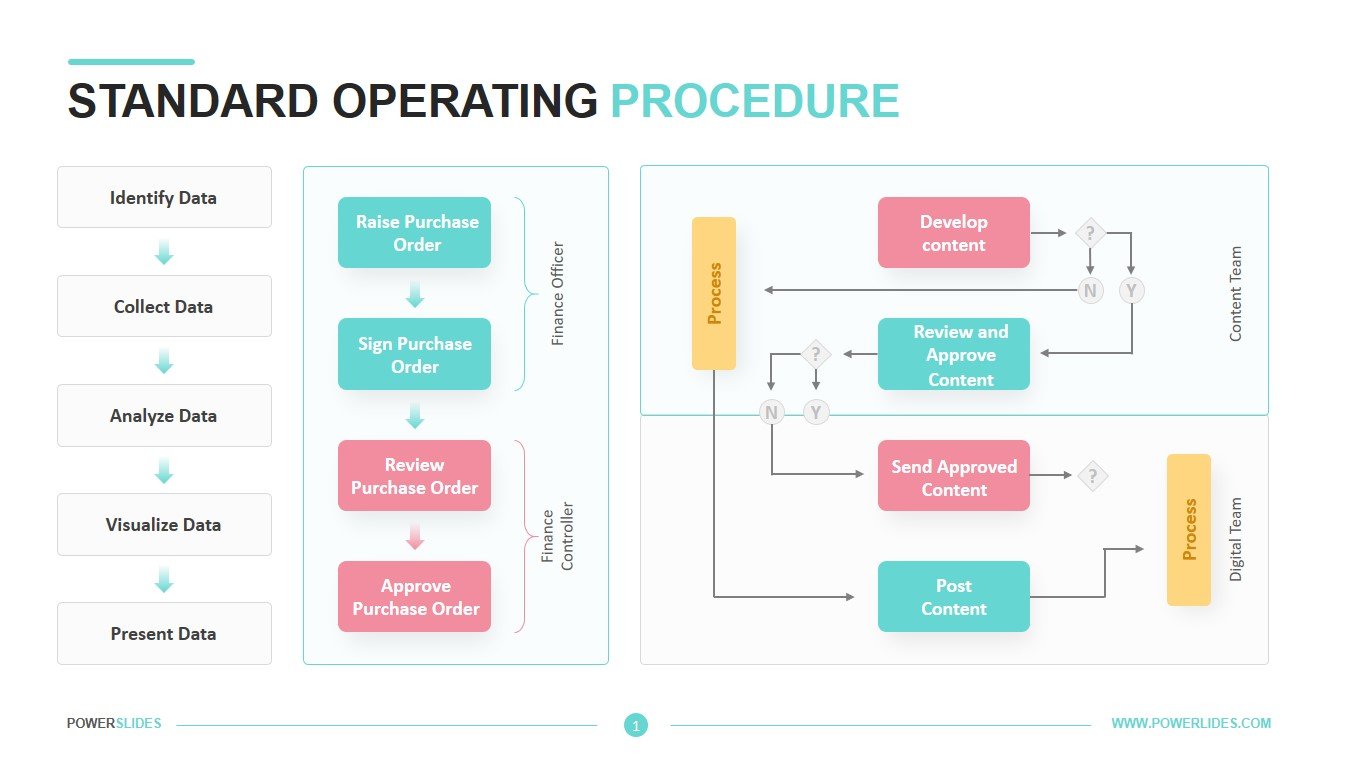
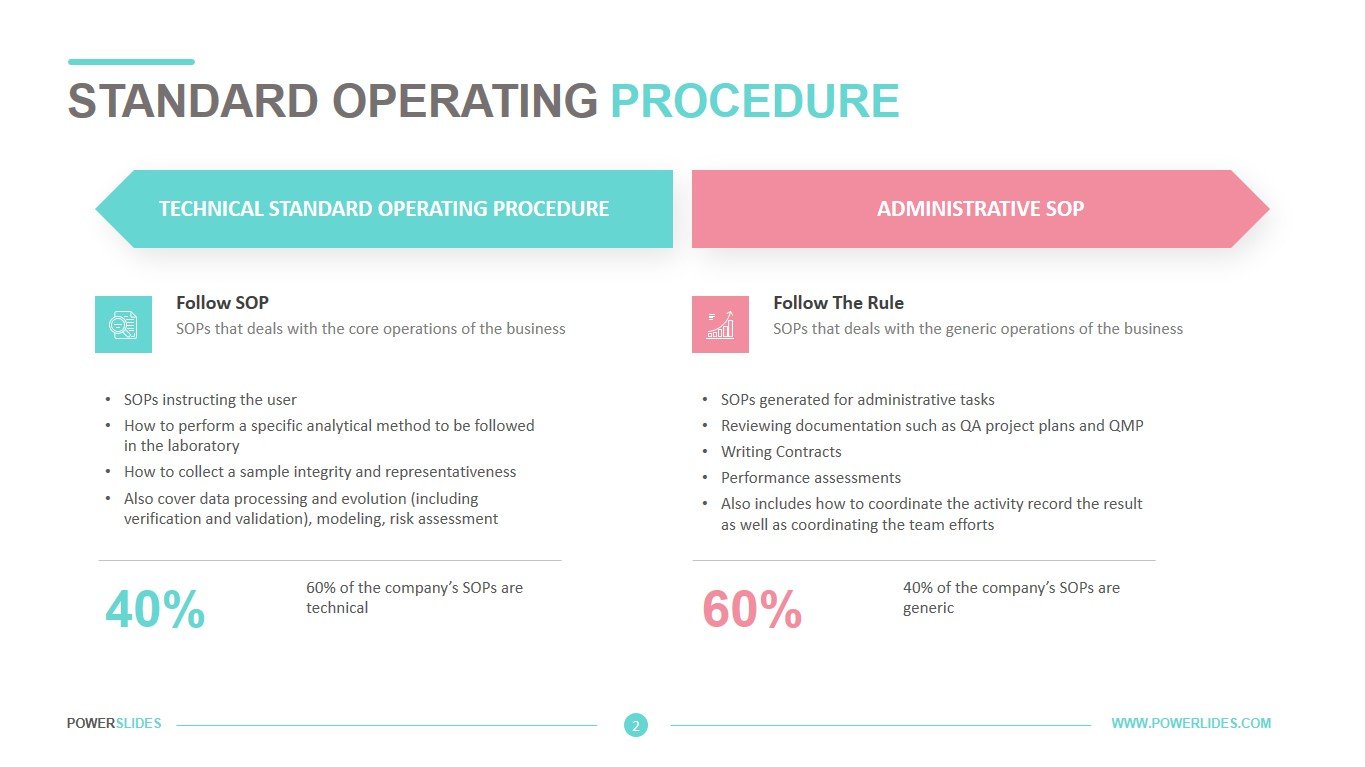
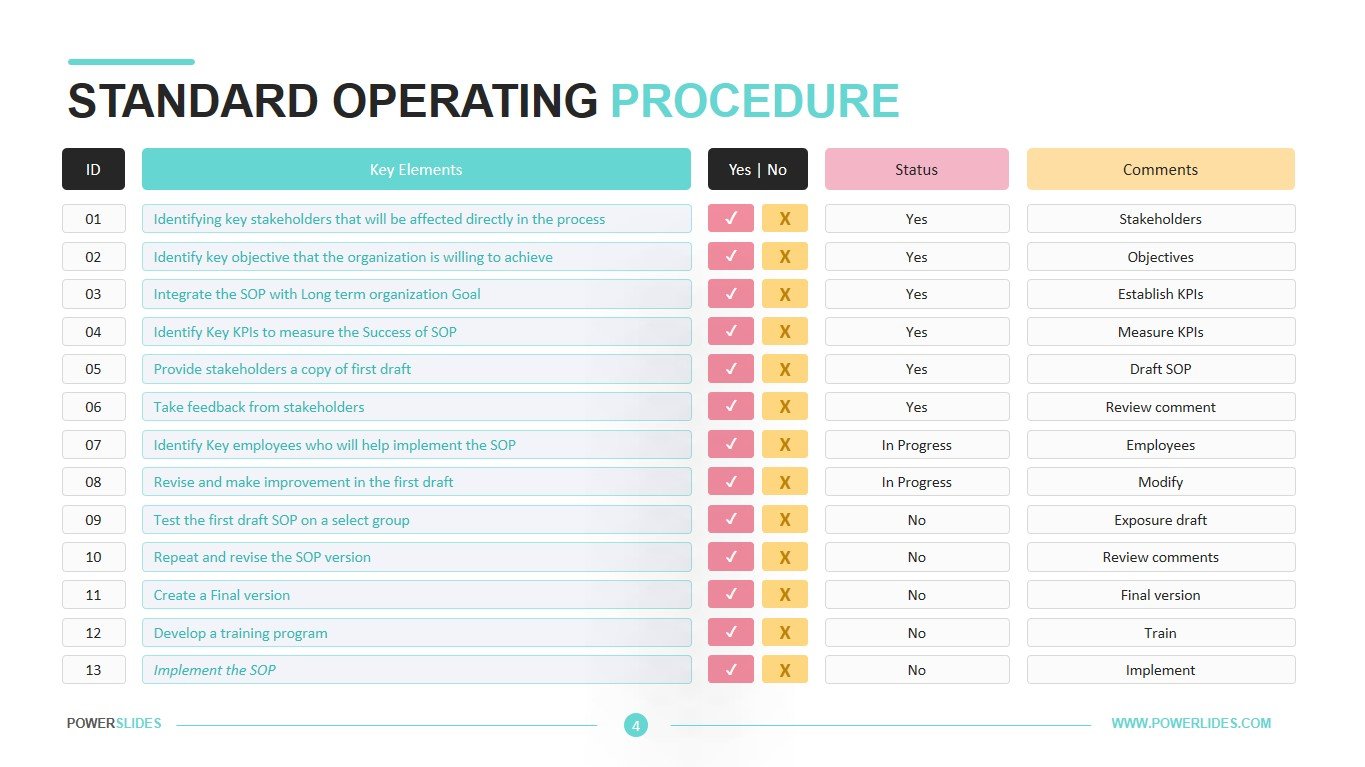
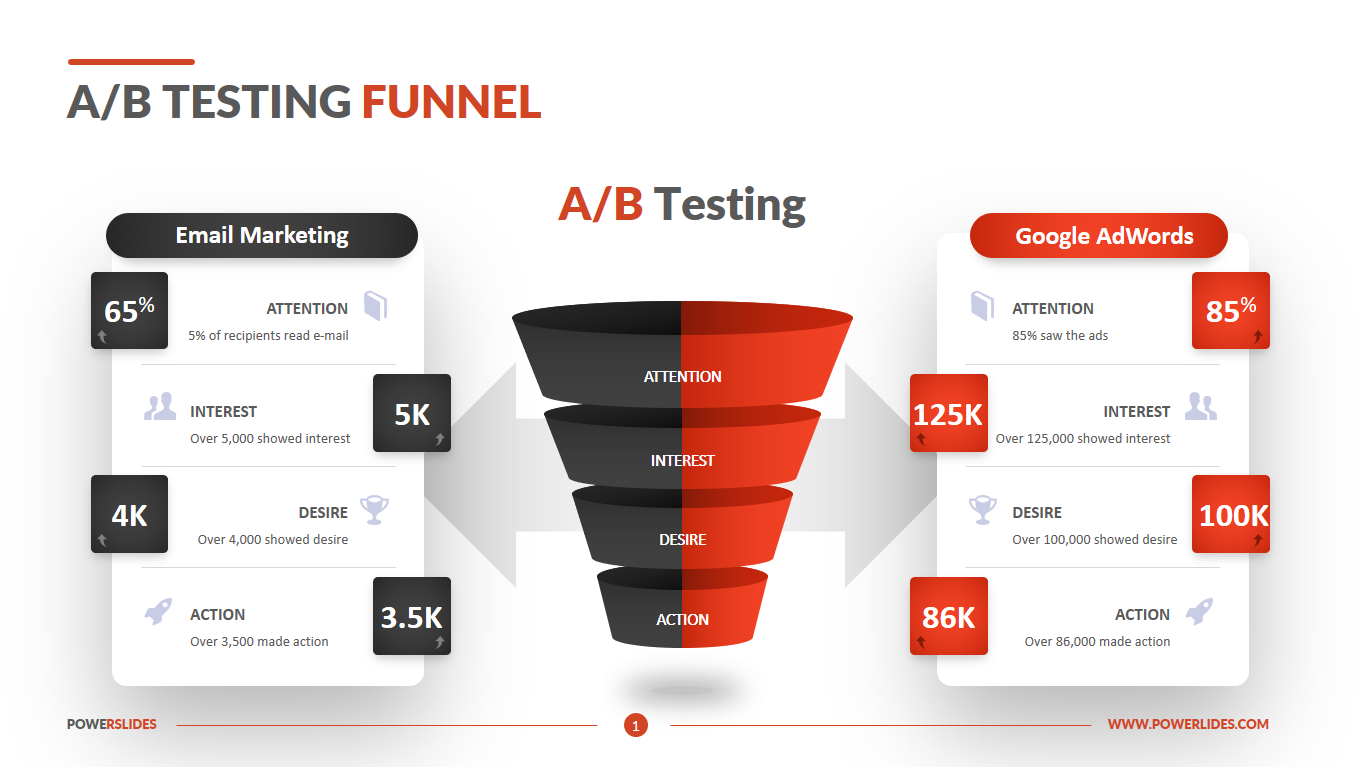
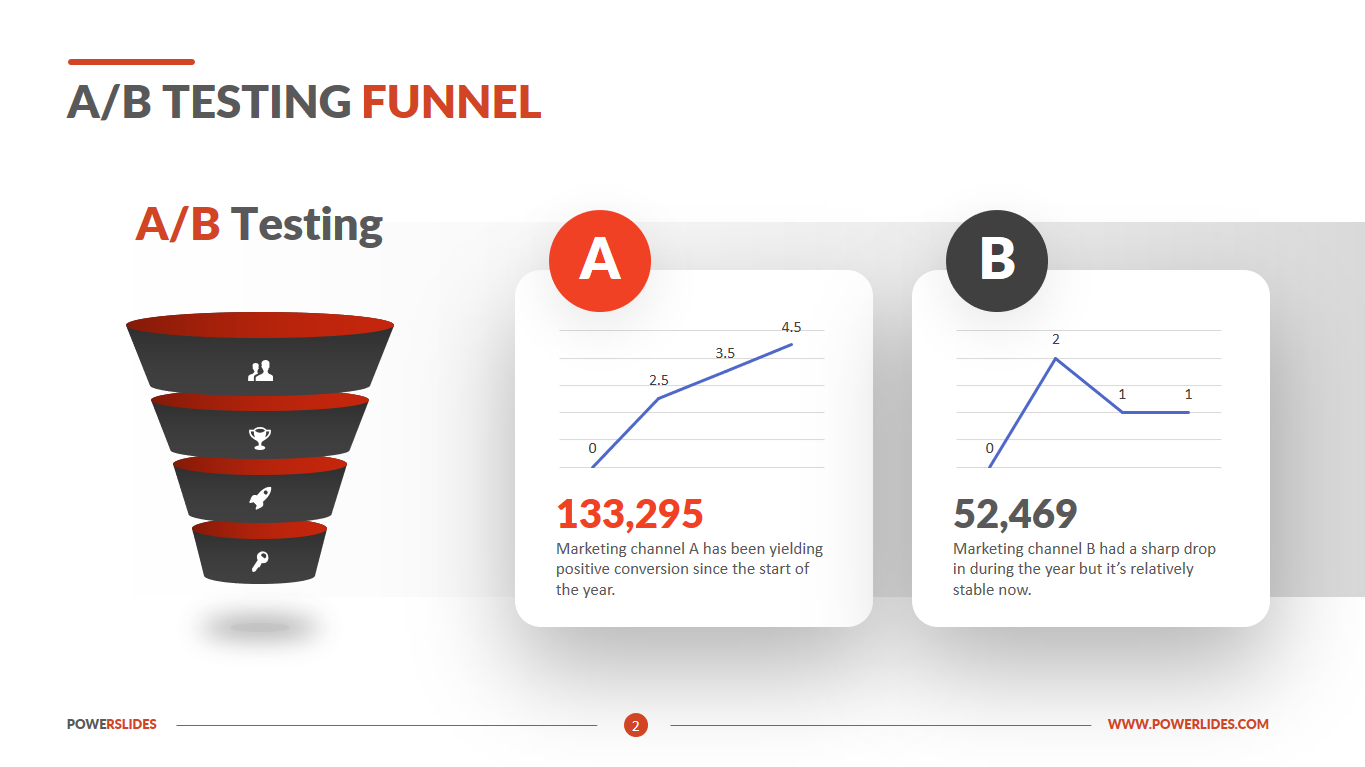
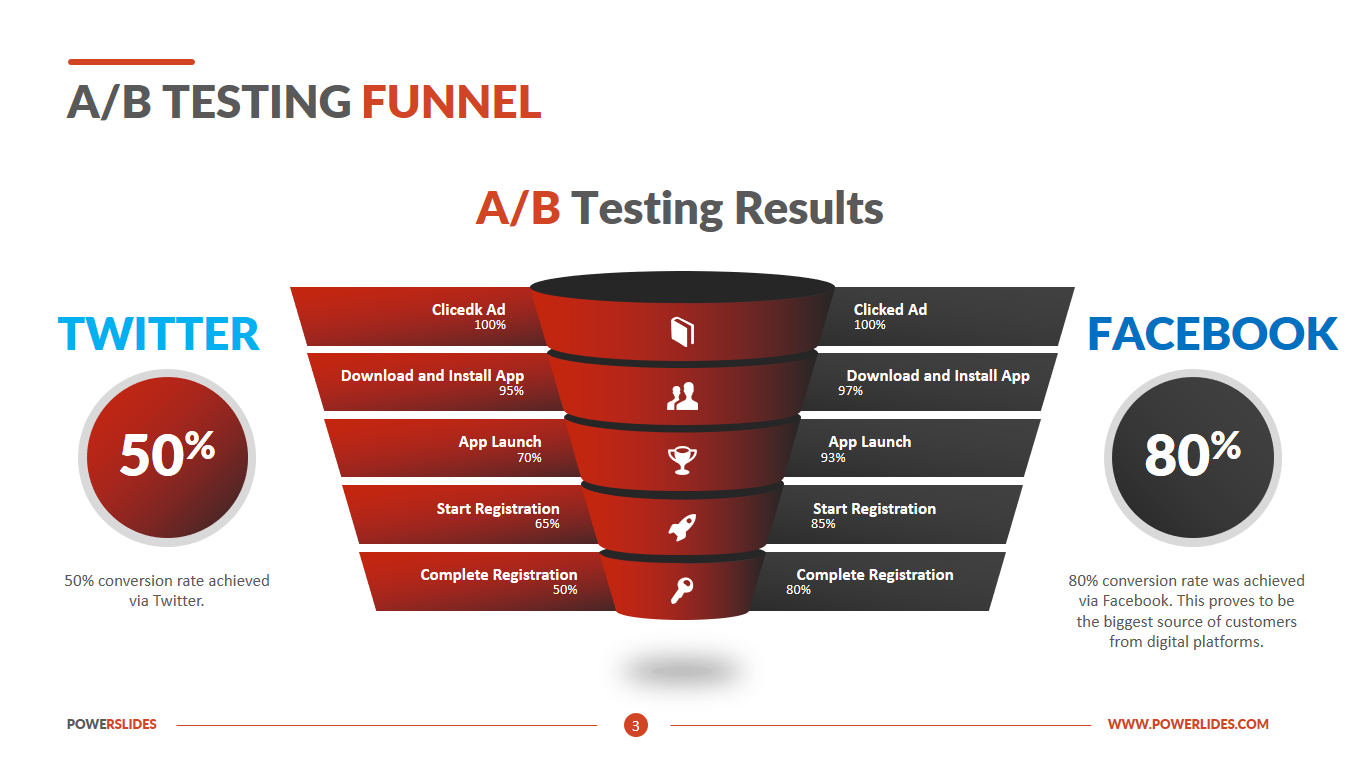
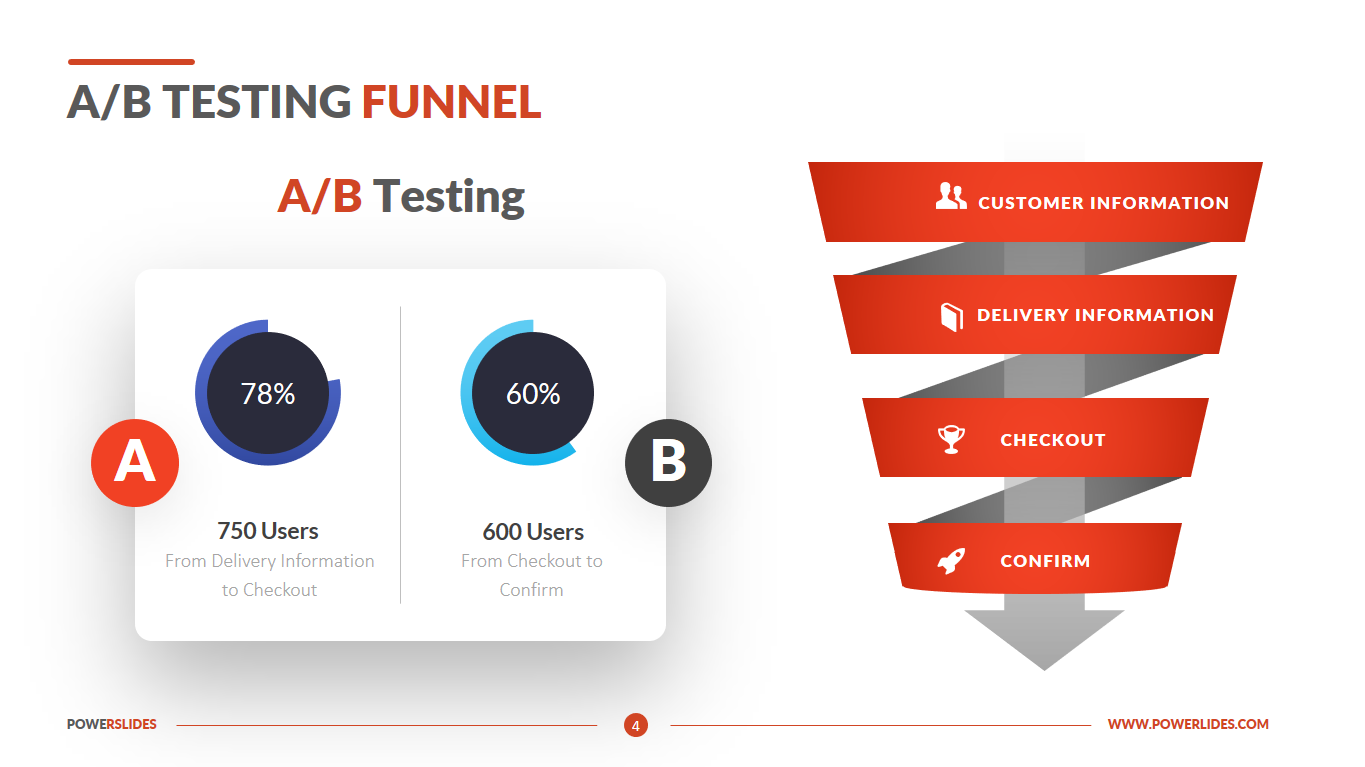
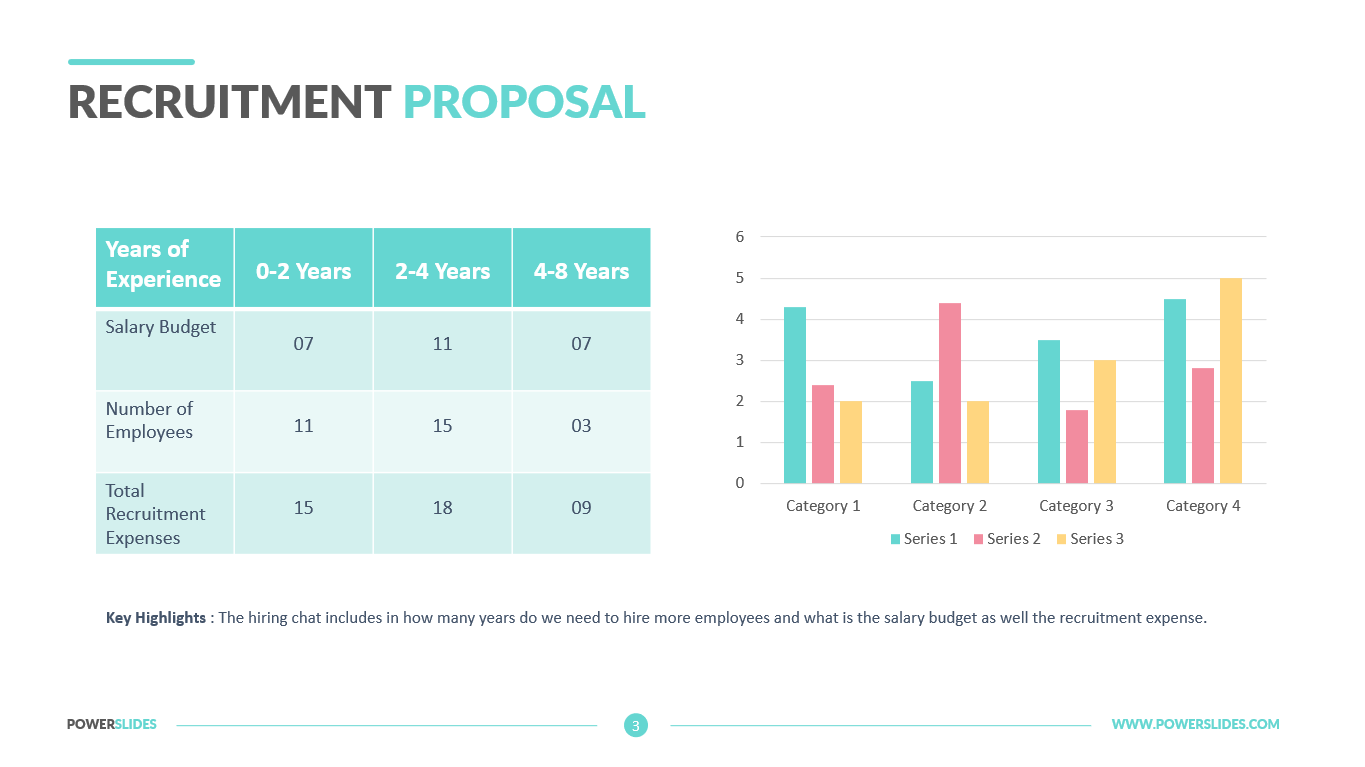
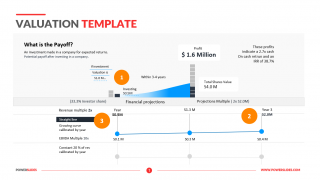
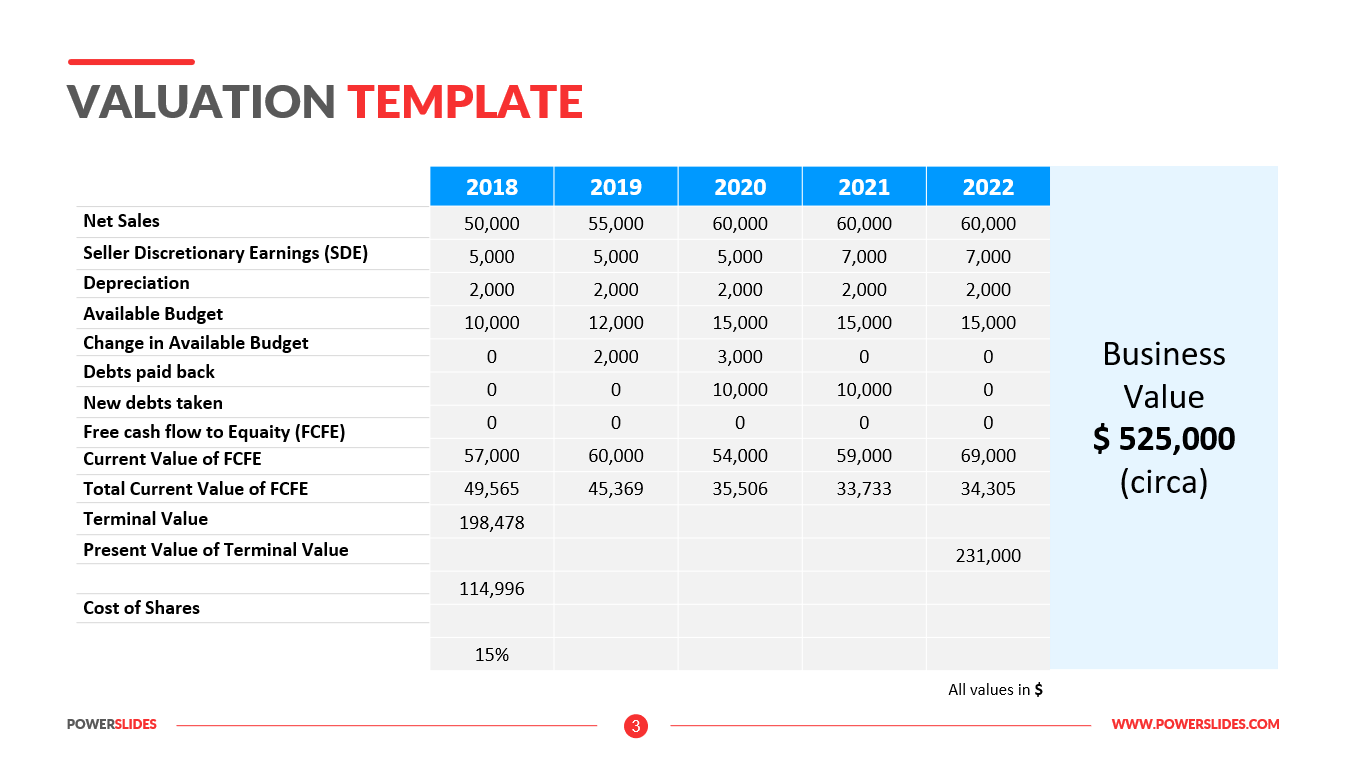
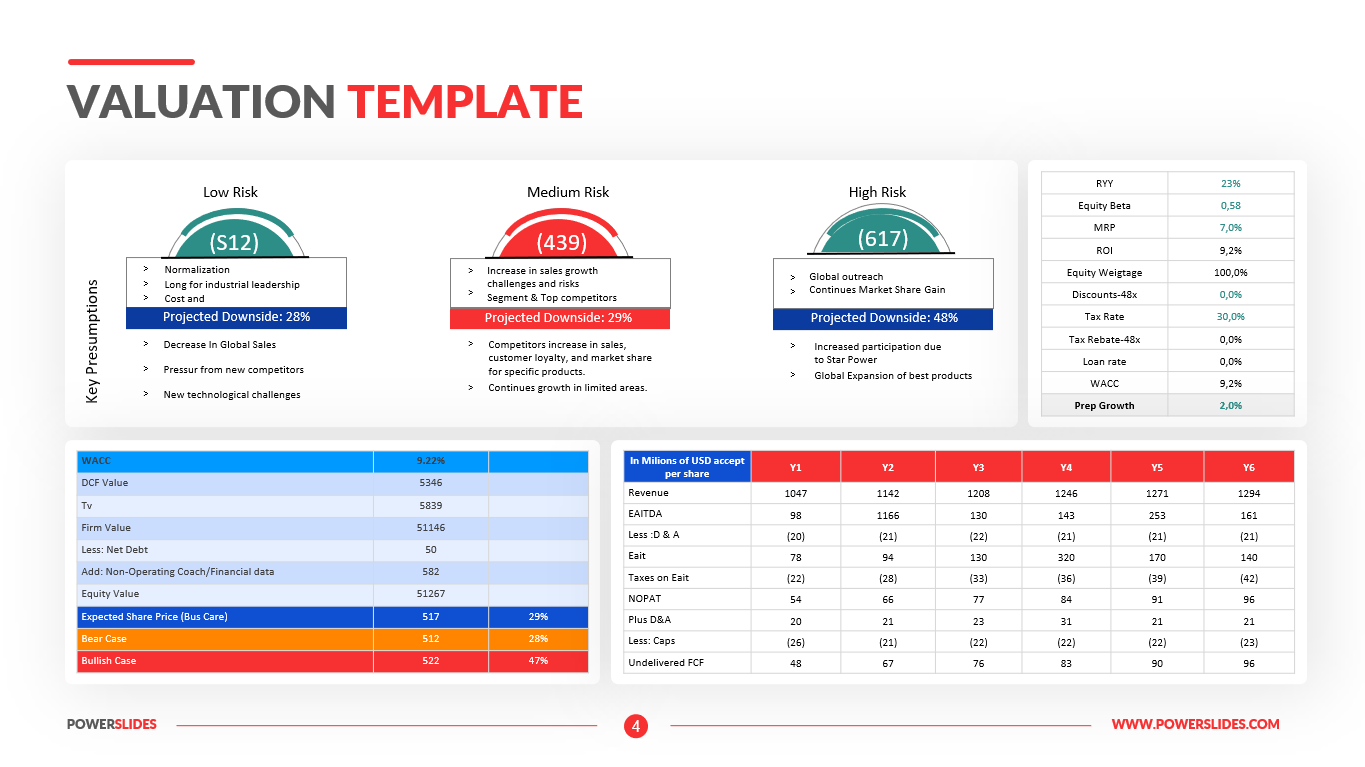
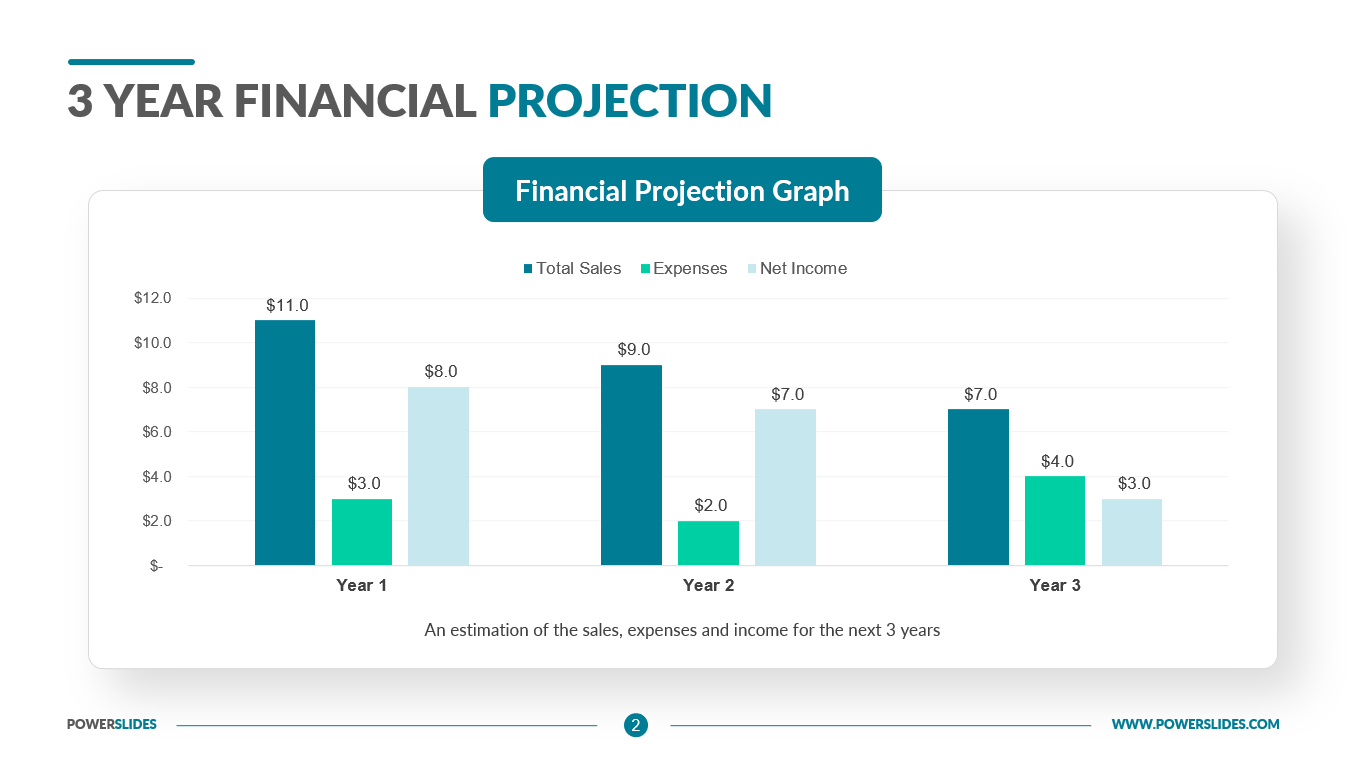
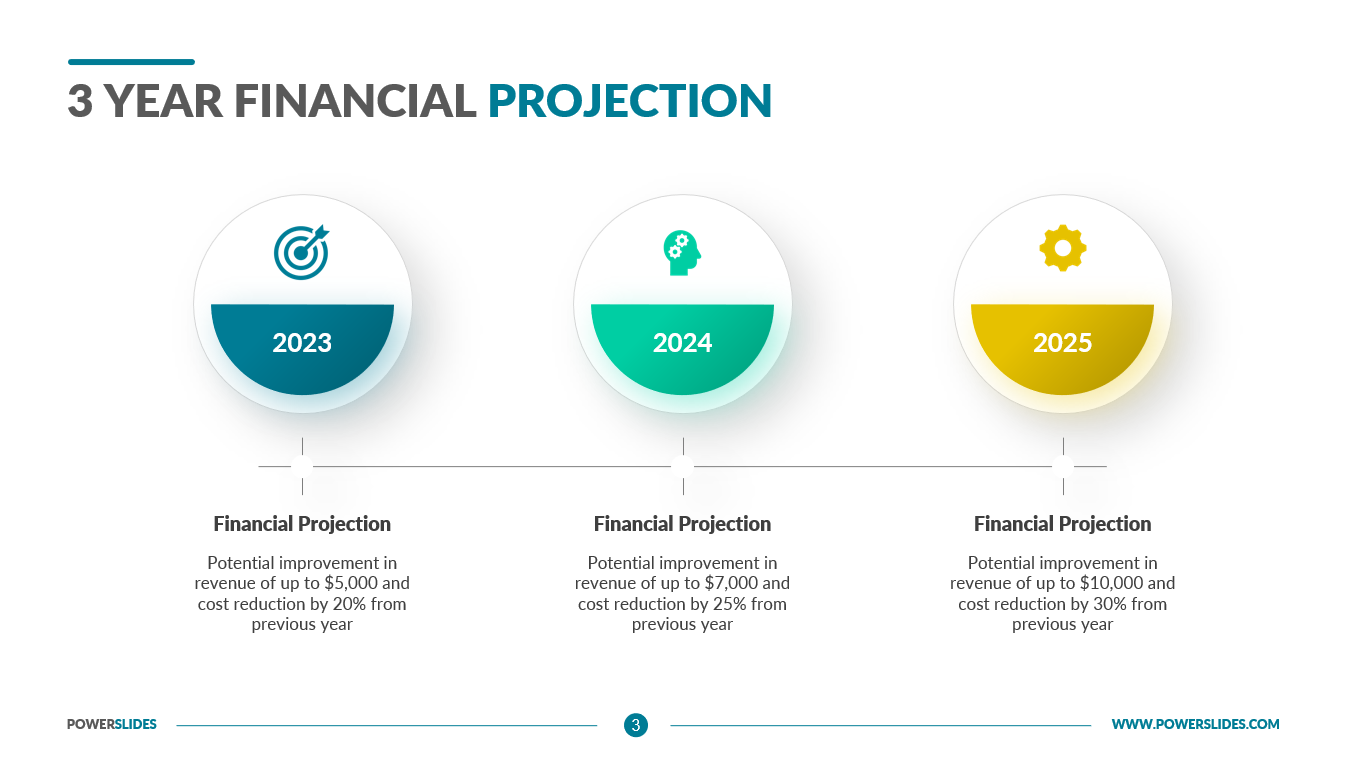
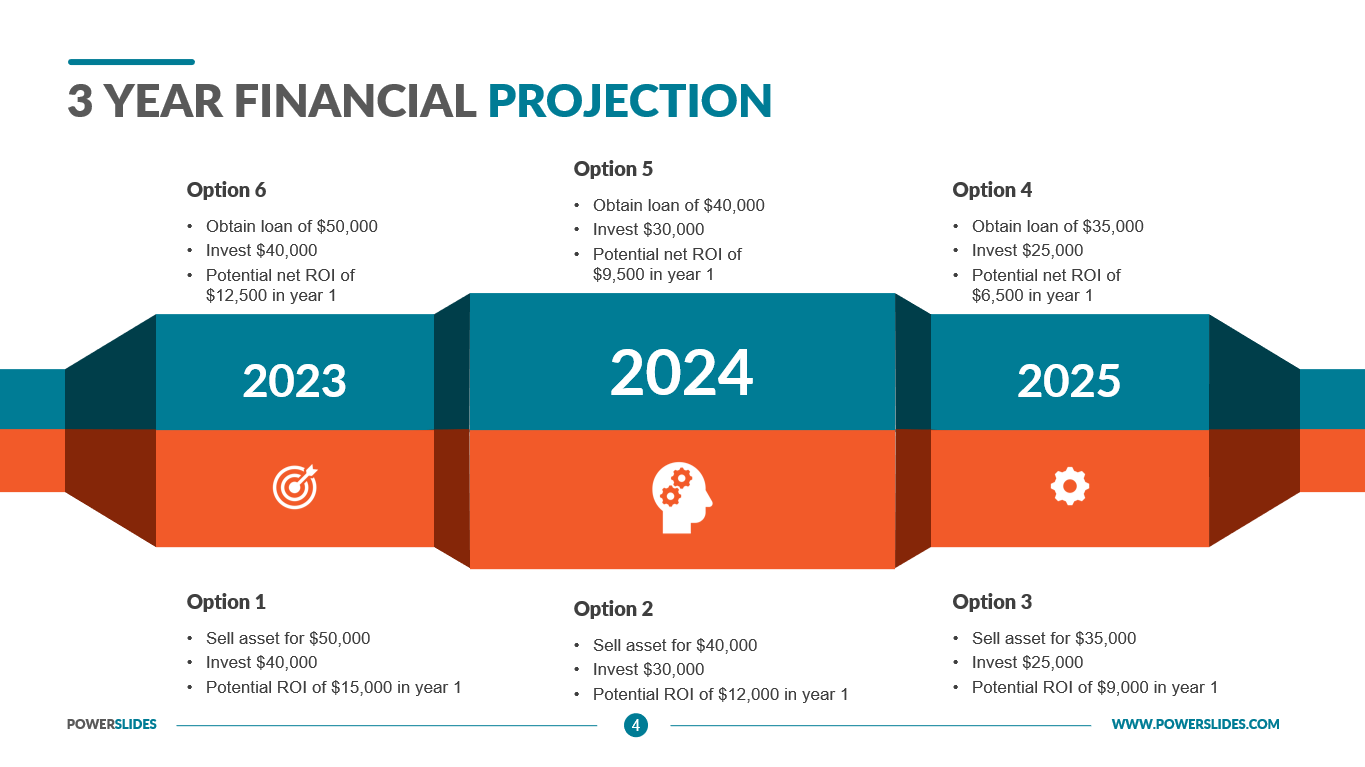
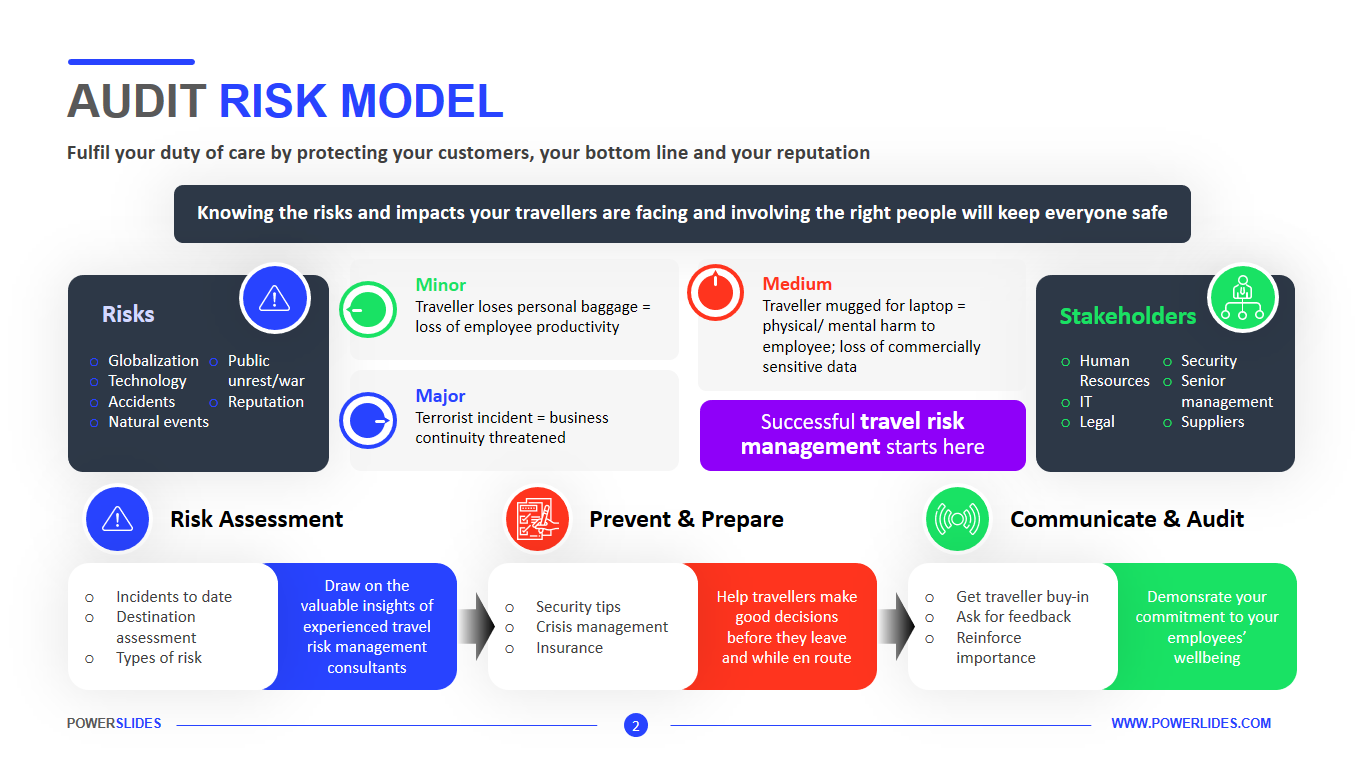
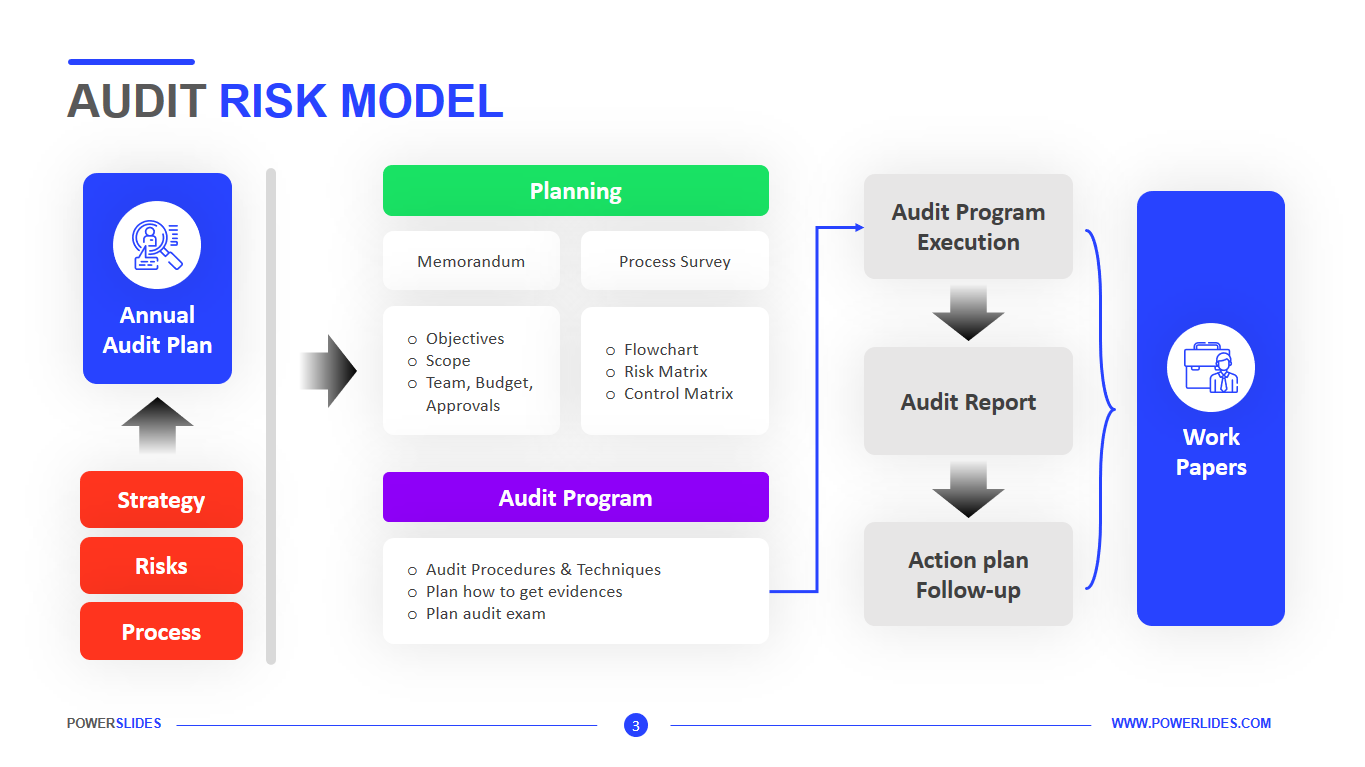
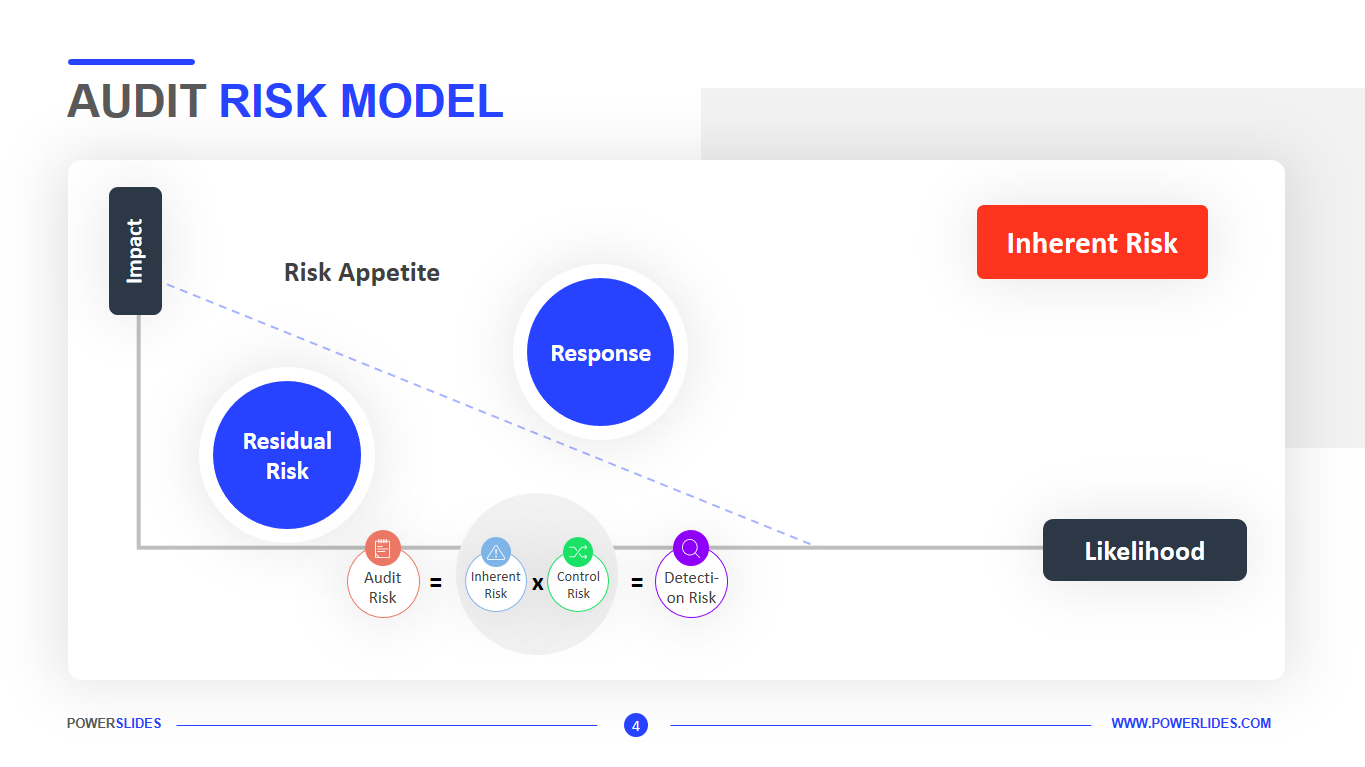
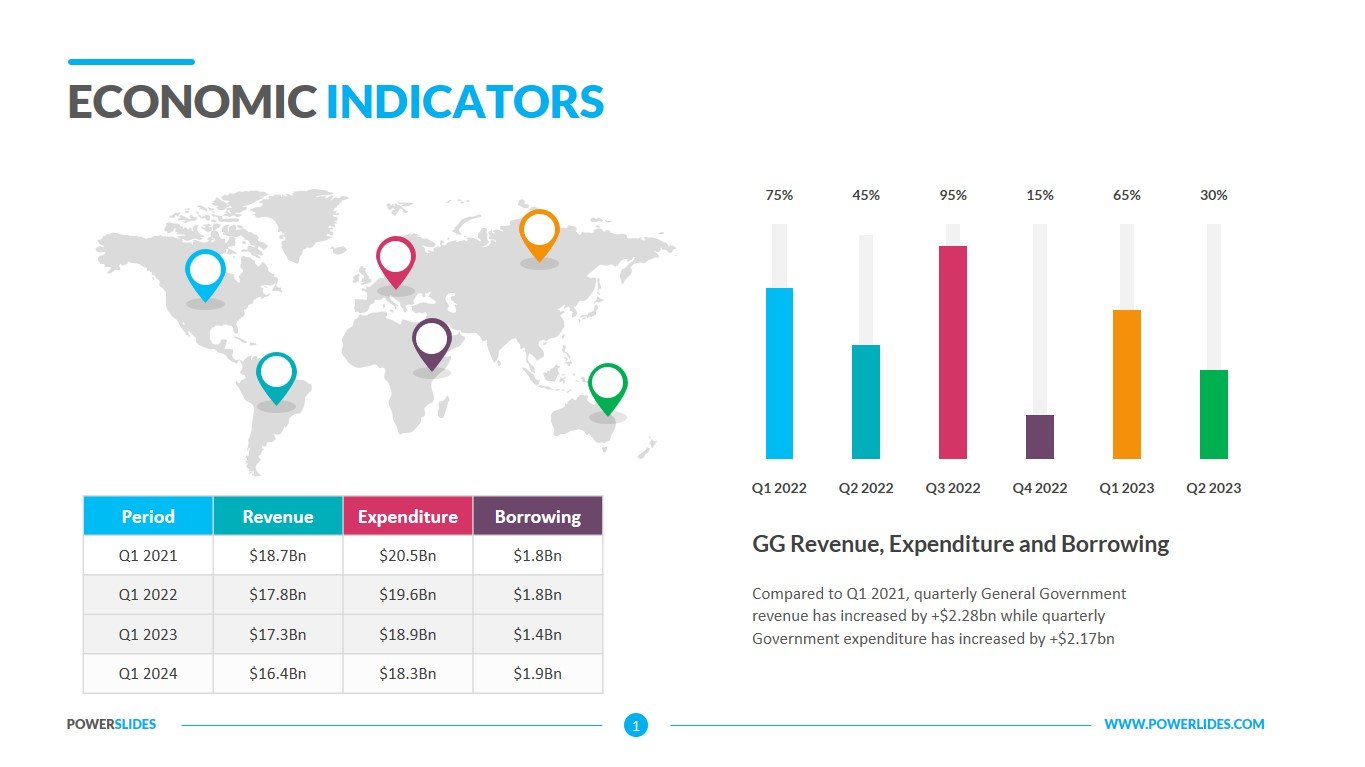
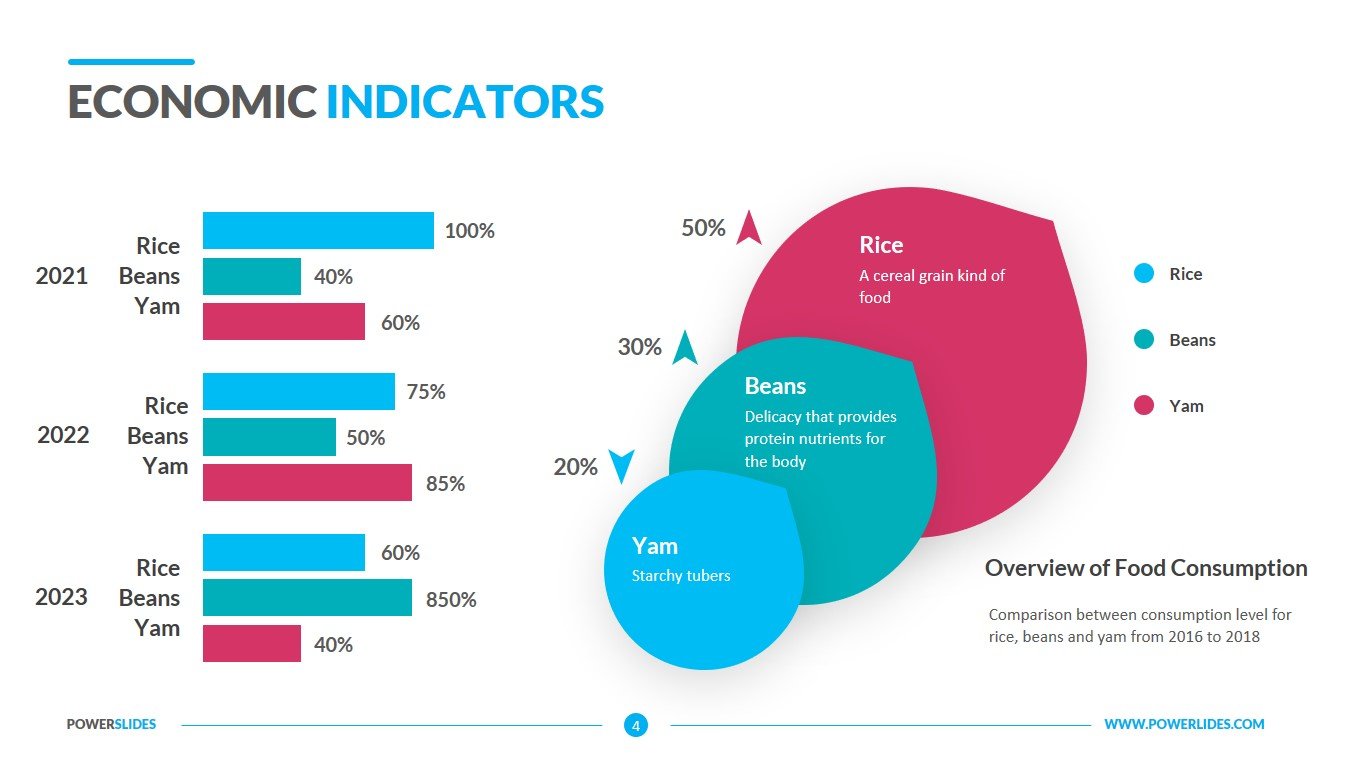
The first slide of the Economic Indicators template gives you the ability to present various economic indicators on a world map, using a table and a bar chart. You can use this slide when preparing a sales report for your international subsidiaries. The next slide is presented in a stylish infographic. You can use the slide elements to provide various indicators by industry. The third slide presents a set of pie charts and infographics in the form of a population of people. You can use it when building a consumption model of your product between men and women, depending on certain characteristics of the product. The last slide gives you the opportunity to create predictive models of profit, expenses, investment for the company. For example, you can indicate on the slide the sources of funds and the amount of CAPEX and OPEX expenses.
The Economic Indicators template has a modern design and a wealth of infographics. You can use the ready-made infographic when creating other slides and customize the colors and font to match your corporate colors. Business trainers and university professors can use this template to create courses on the global economy and macroeconomic indicators of the economy. Also, this template will be useful for startups when preparing a presentation for a meeting with investors. Entrepreneurs can use this template when designing their business plans. This template is a must have for all financiers, economists, and investment firm workers in their collection of presentation templates.


