Virus Diagram
What do you think of this template?

 (4.00/ 5)
12 ratings

 4 Slides
 File size: 16:9
 Fonts: Lato, Calibri
 Supported version
PPT 2010, PPT 2013, PPT 2016
Supported version
PPT 2010, PPT 2013, PPT 2016

Product details
The recent outbreak of the Coronavirus has once again emphasized man’s vulnerability concerning the natural world. For most of us, contracting a ‘virus’, meant little more than getting a head cold or the flu. However, the historians among us will know that these microscopic parasites, completely unseen by the naked eye, can have devastating effects on the human body. It can alter the course of nature as we know it.
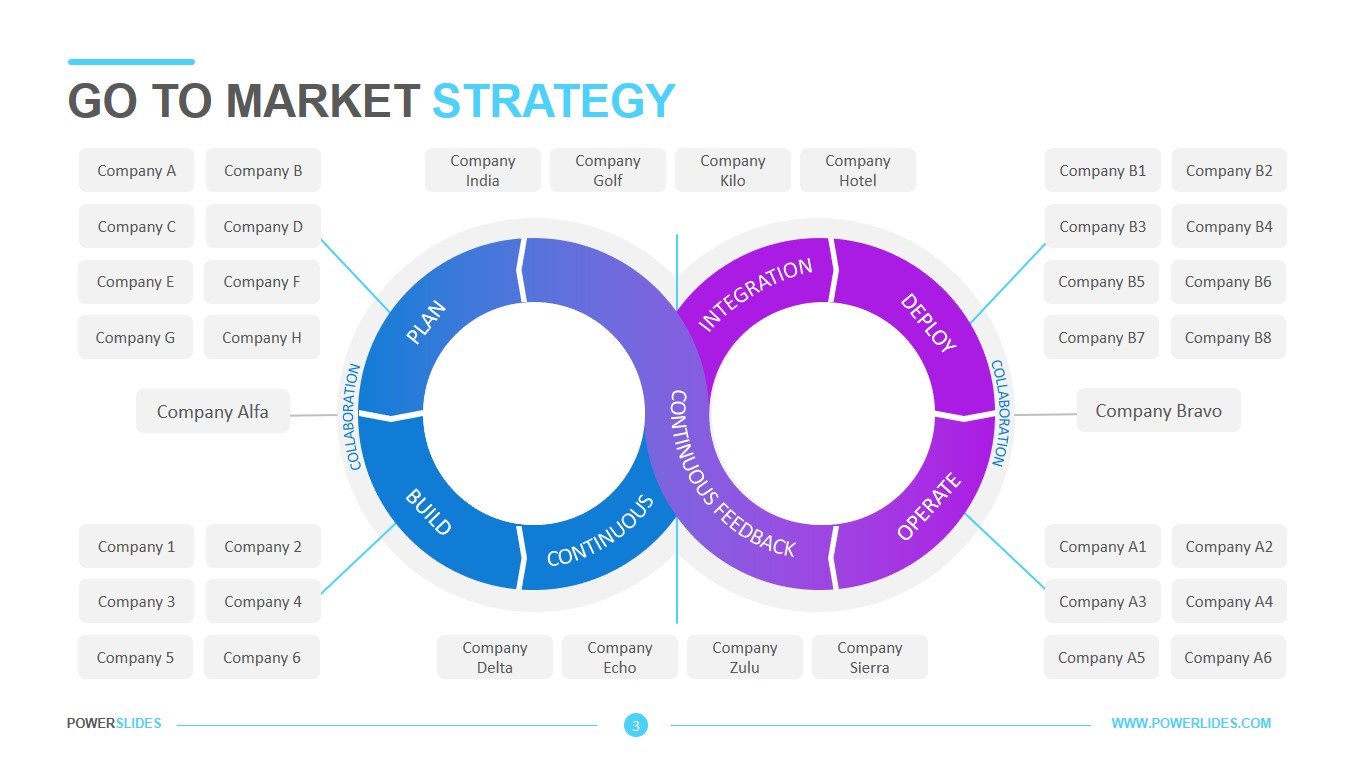
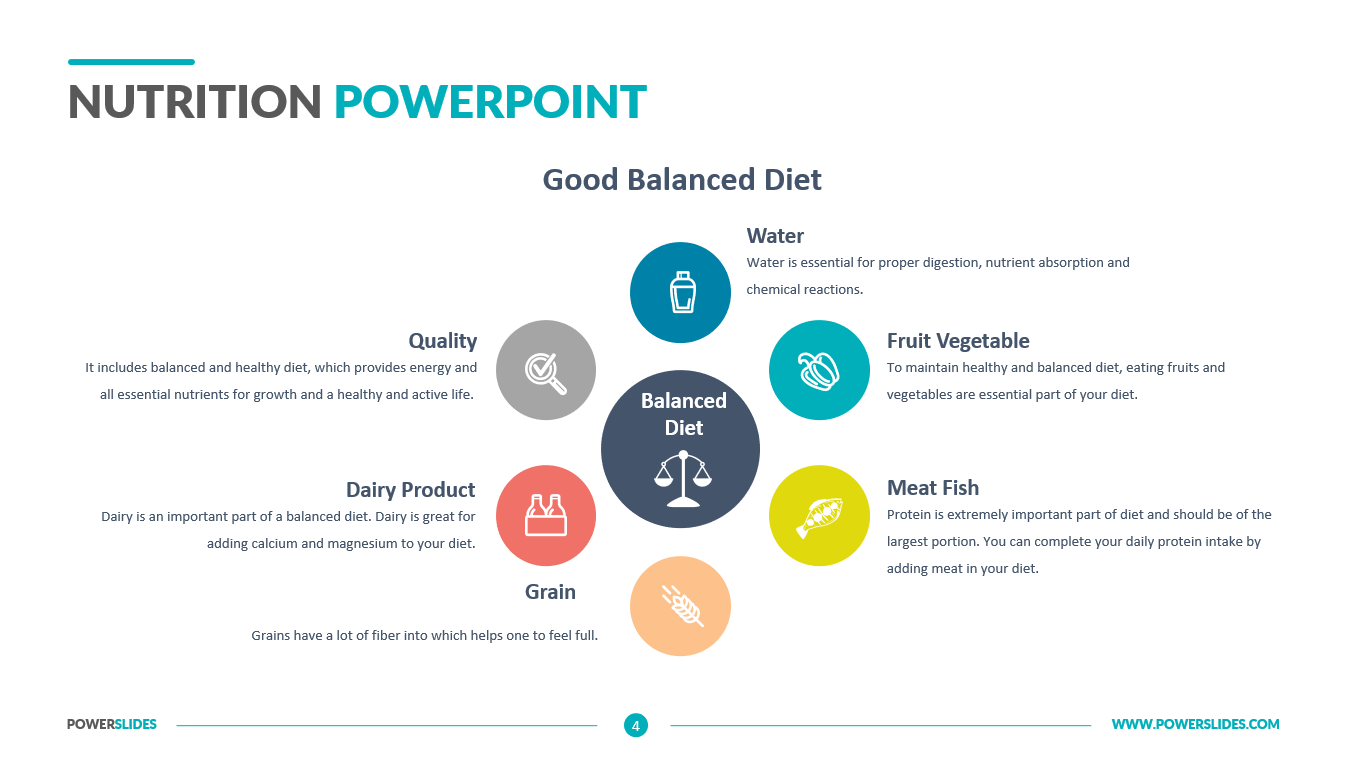
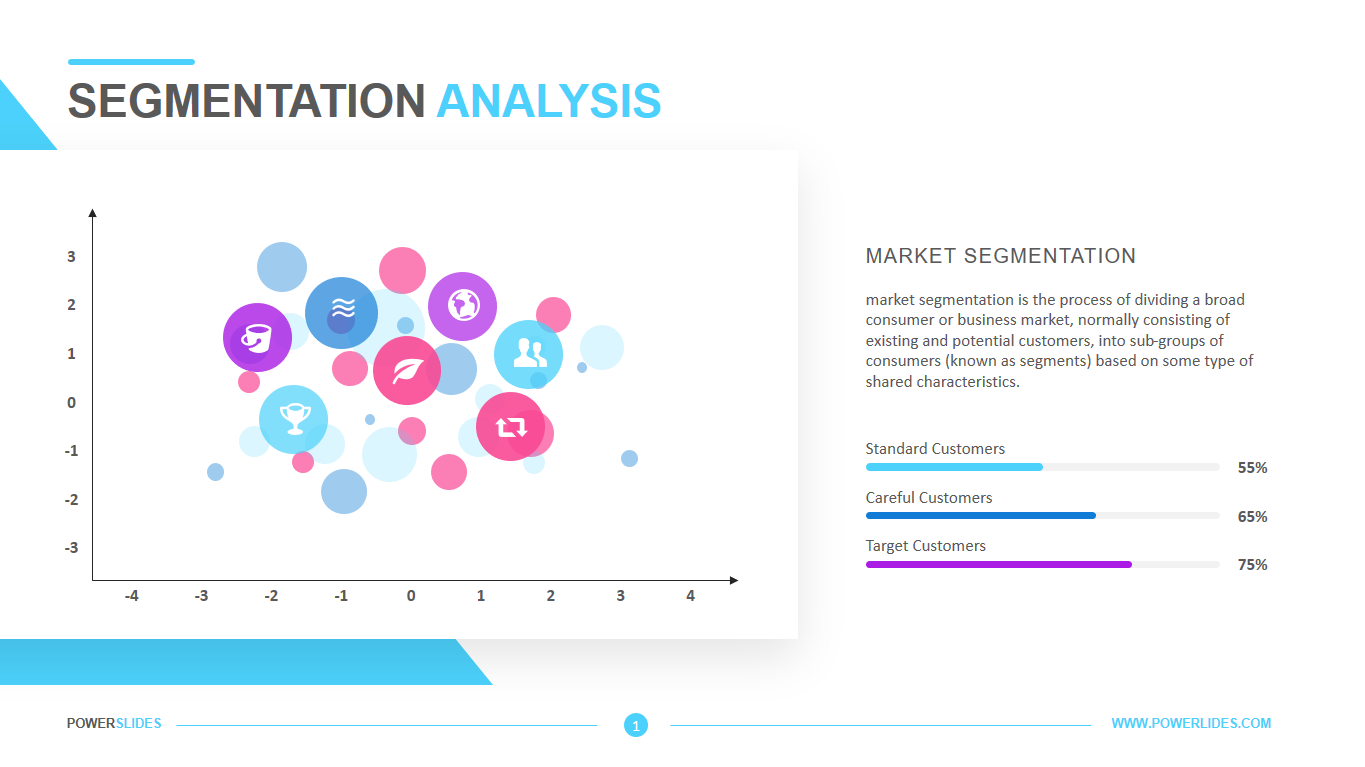
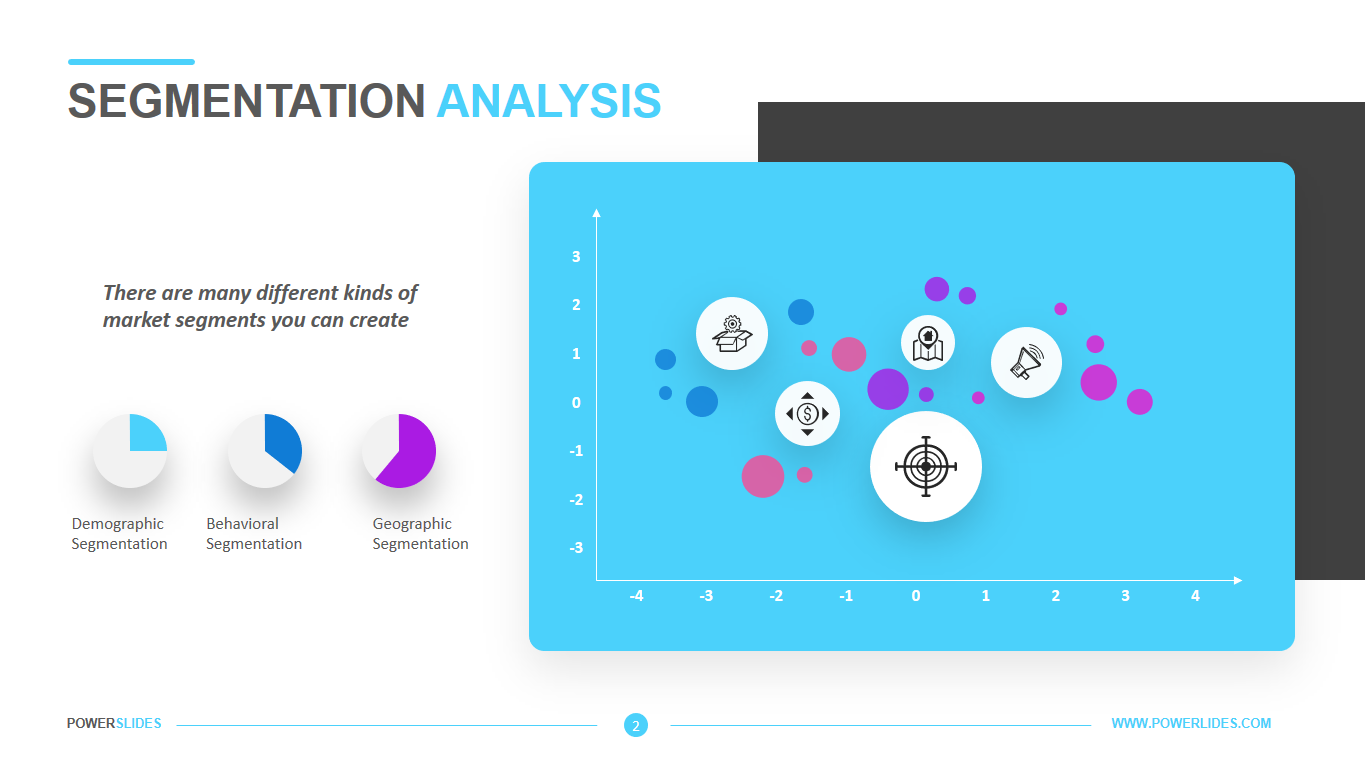
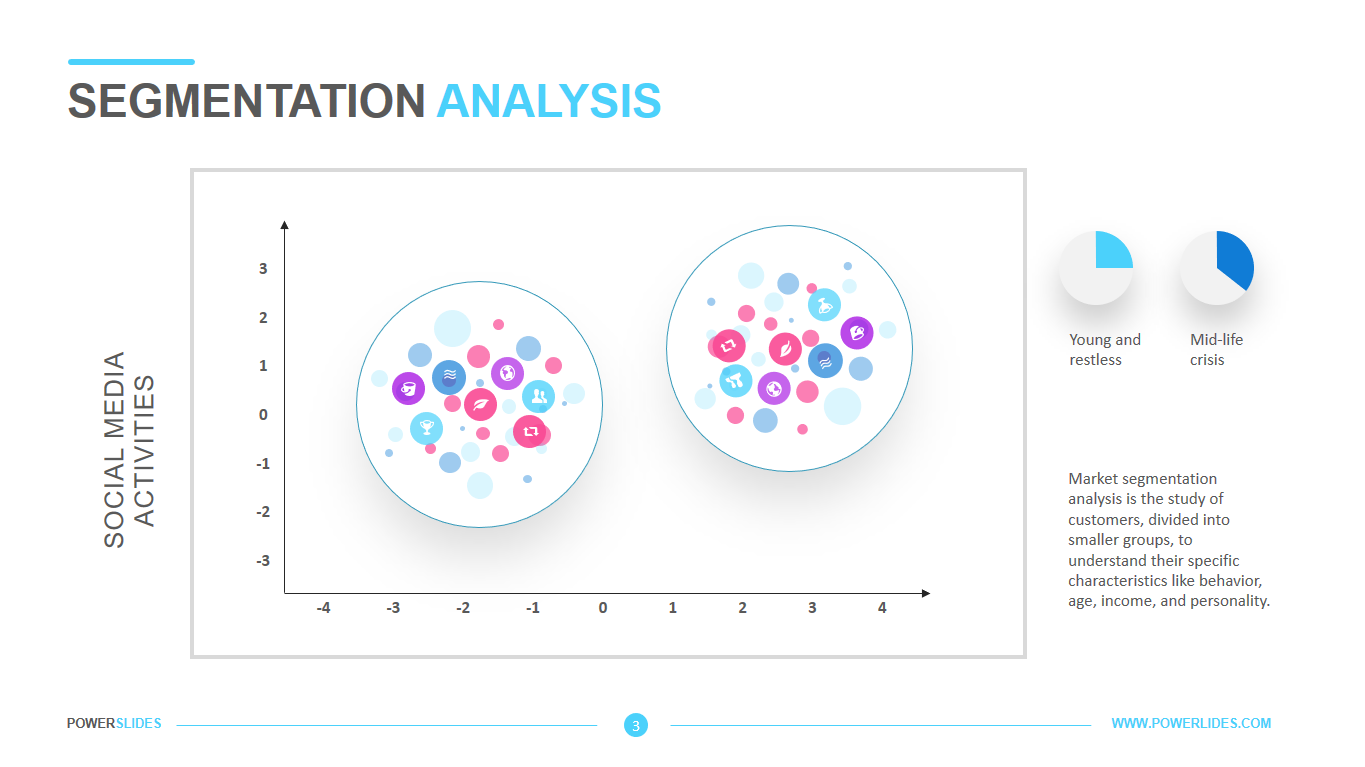
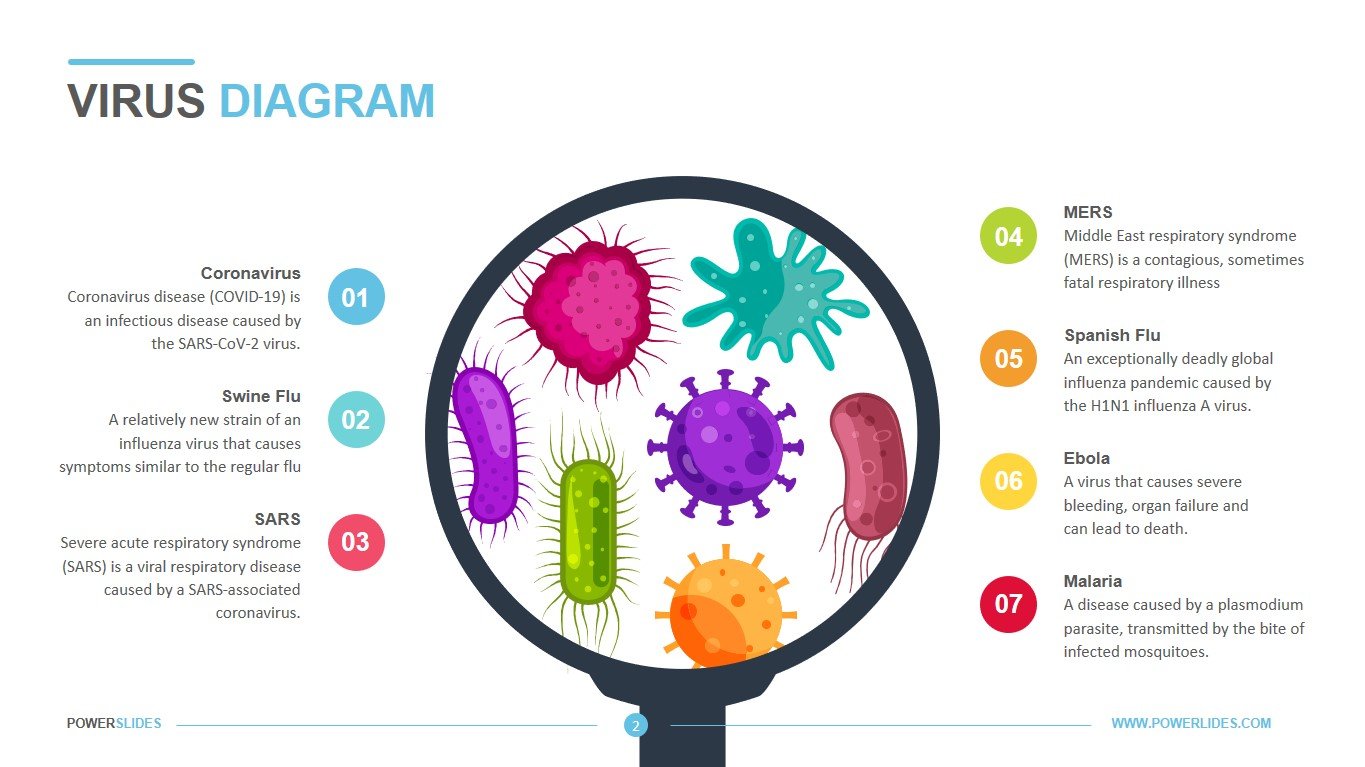
This brings us back to the question: What is a virus? The 4 slides in the Virus Diagram Template were designed to answer just that! These colorful slides will definitely ignite the interest of your audience, be it students, healthcare professionals, or the general public. The composition of the Virus Diagram Template was created to start by introducing the topic using a colorful illustration that depicts viruses in their different shapes and sizes. It furthermore identifies and lists the most commonly-known diseases caused by viruses, i.e. the Coronavirus, Swine Flu, SARS, MERS, Spanish Flu, Ebola, and Malaria. These diseases are examples only, and the titles can easily be cut and replaced by your own headings. Each heading leaves ample space for more information about the particular disease of your choice.
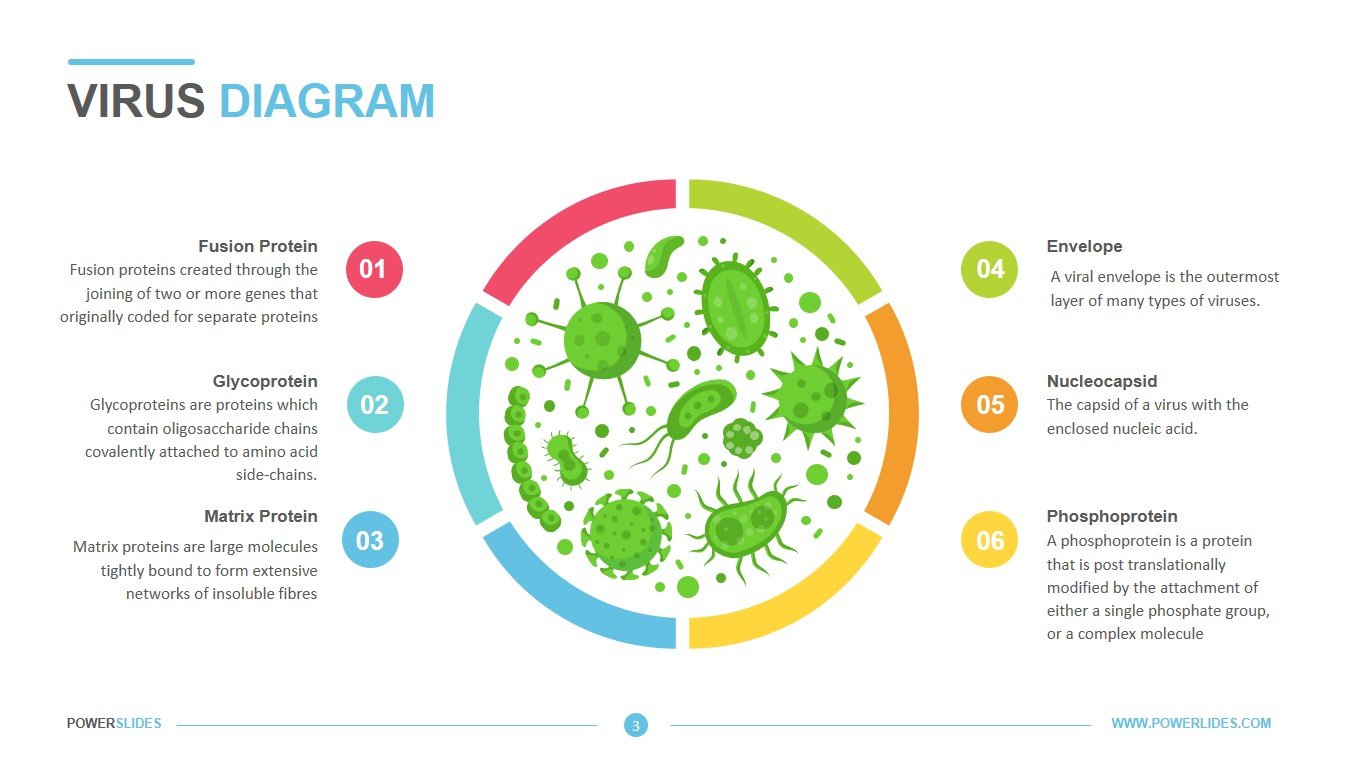
So now we know what a virus potentially ‘looks like’ under a magnifying glass. Viruses are either helical, polyhedral, spherical, or complex. The ‘sphere’ shape is consistently used in all the graphics in the Virus Diagram Template, which really pulls the theme through. Similar colors are also repeated in each slide and follow a consistent palette, which makes for easy-on-the-eye and professional-looking slides.
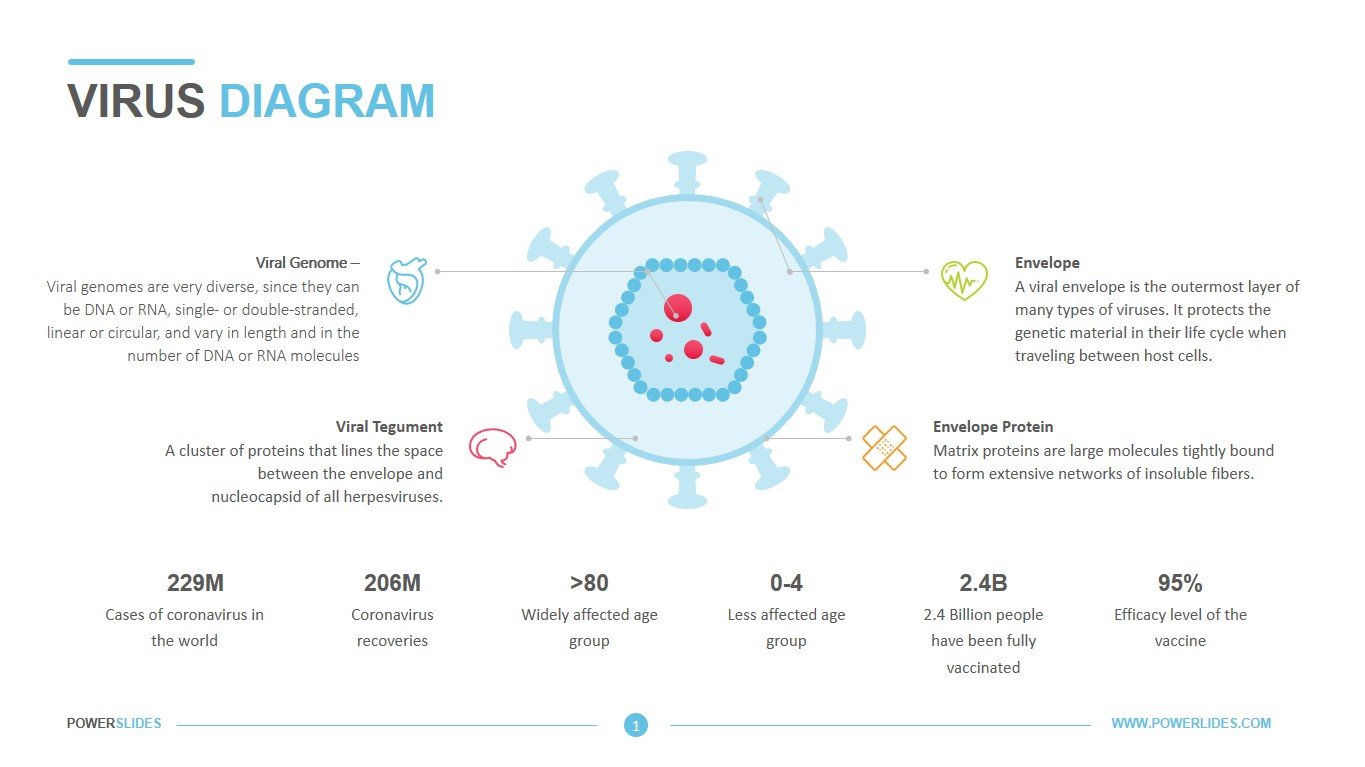
Slide 2 of the Virus Diagram Template introduces the physical components of a virus and notably, the different proteins that coat the infectious virus particle. Headings and colors in this slide can also be changed to represent your own information about viruses.
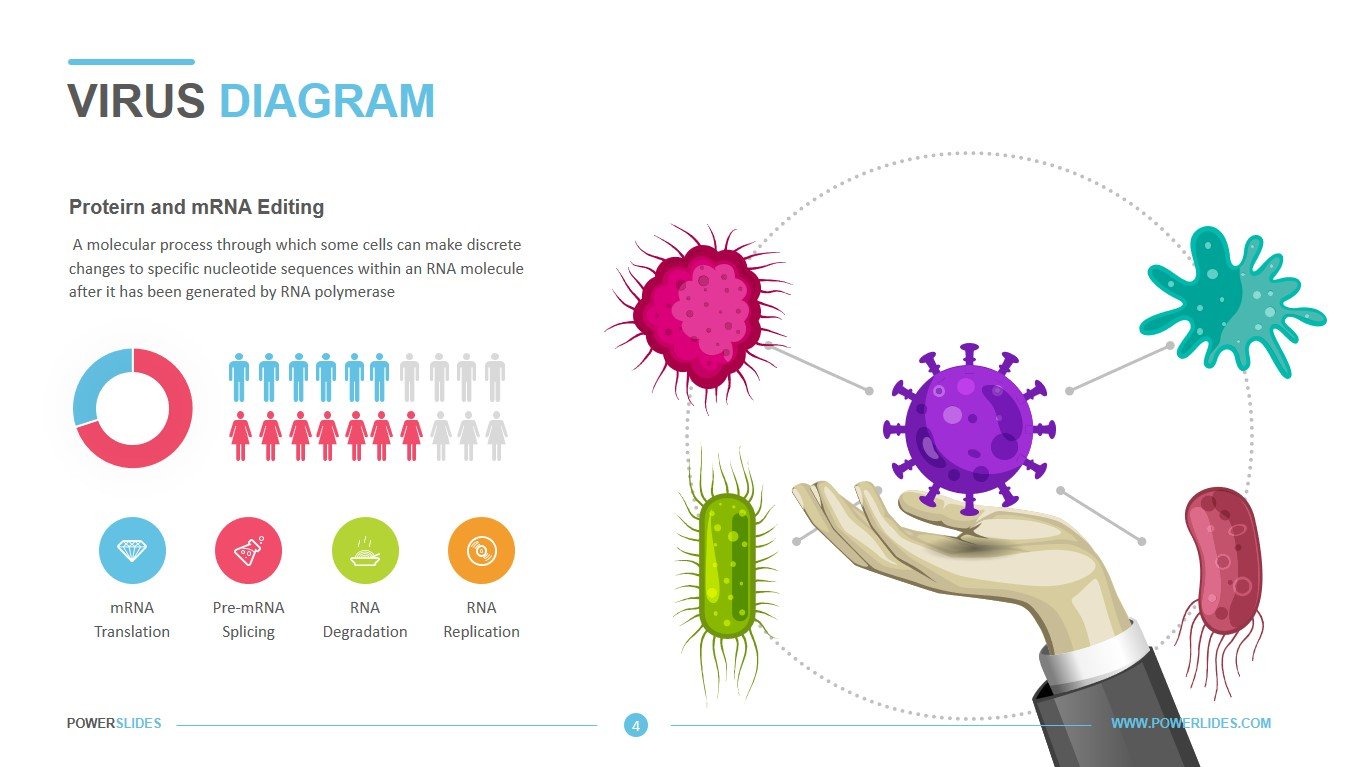
Slide 3 illustrates a visual of the spherical structure of a virus which can be interpreted to include data and statistical analysis information. The slide contains a set of icons that can be used to visually enhance your content. The virus graphic in this slide is simple but effective enough to provide the necessary information. The final slide of the Virus Diagram Template potentially gives information about Protein and mRNA Editing. It contains visuals which can be interpreted to illustrate the results of RNA editing and processes whereby the response to infections and viruses can be altered. The value of the Virus Diagram Template lies in that it can be used as a stand-alone presentation, or to form part of any other content which talks about viruses. Finally, the design and colors are simple and practical enough for the youngest of your target-group!


