Capex vs Opex
What do you think of this template?
 (No Ratings Yet)
 4 Slides
 File size: 16:9
 Fonts: Lato Black, Calibri
  Supported version
PPT 2010, PPT 2013, PPT 2016
Supported version
PPT 2010, PPT 2013, PPT 2016

Product details
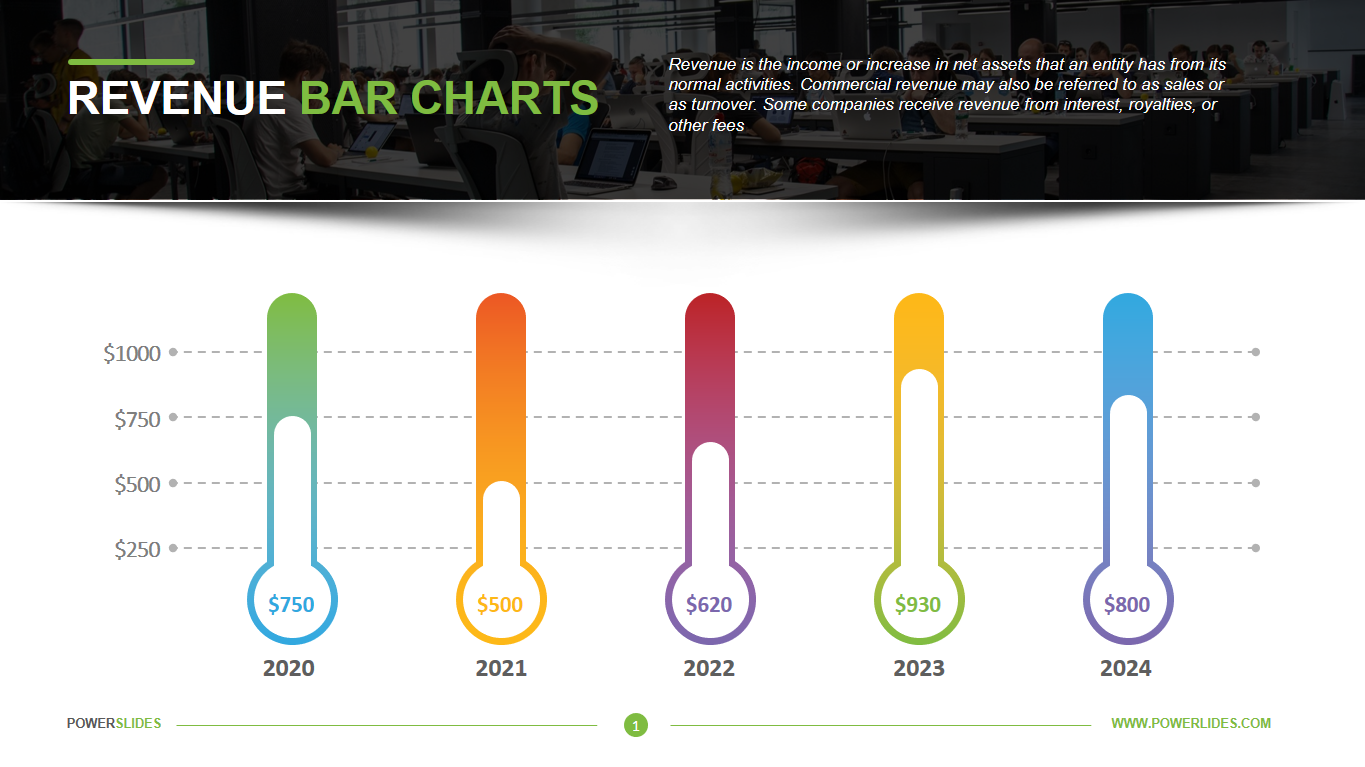
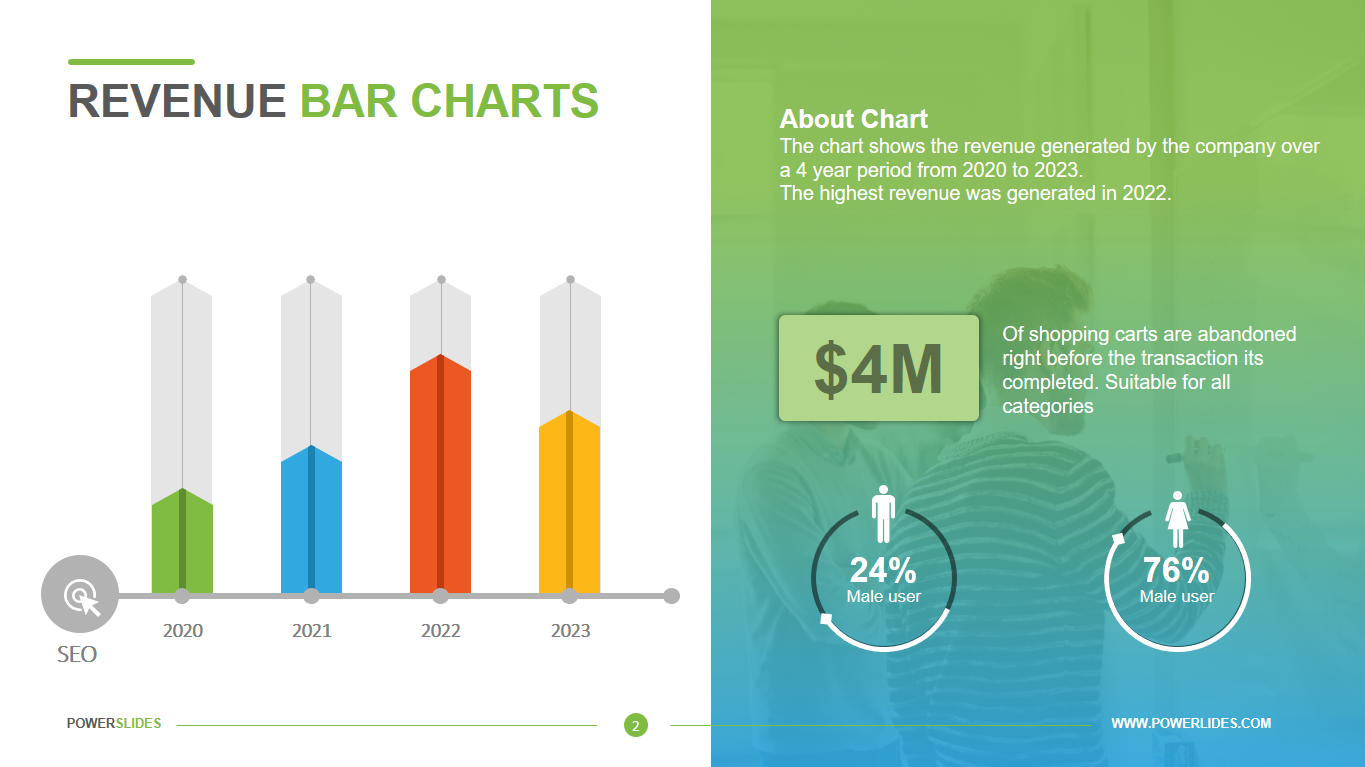
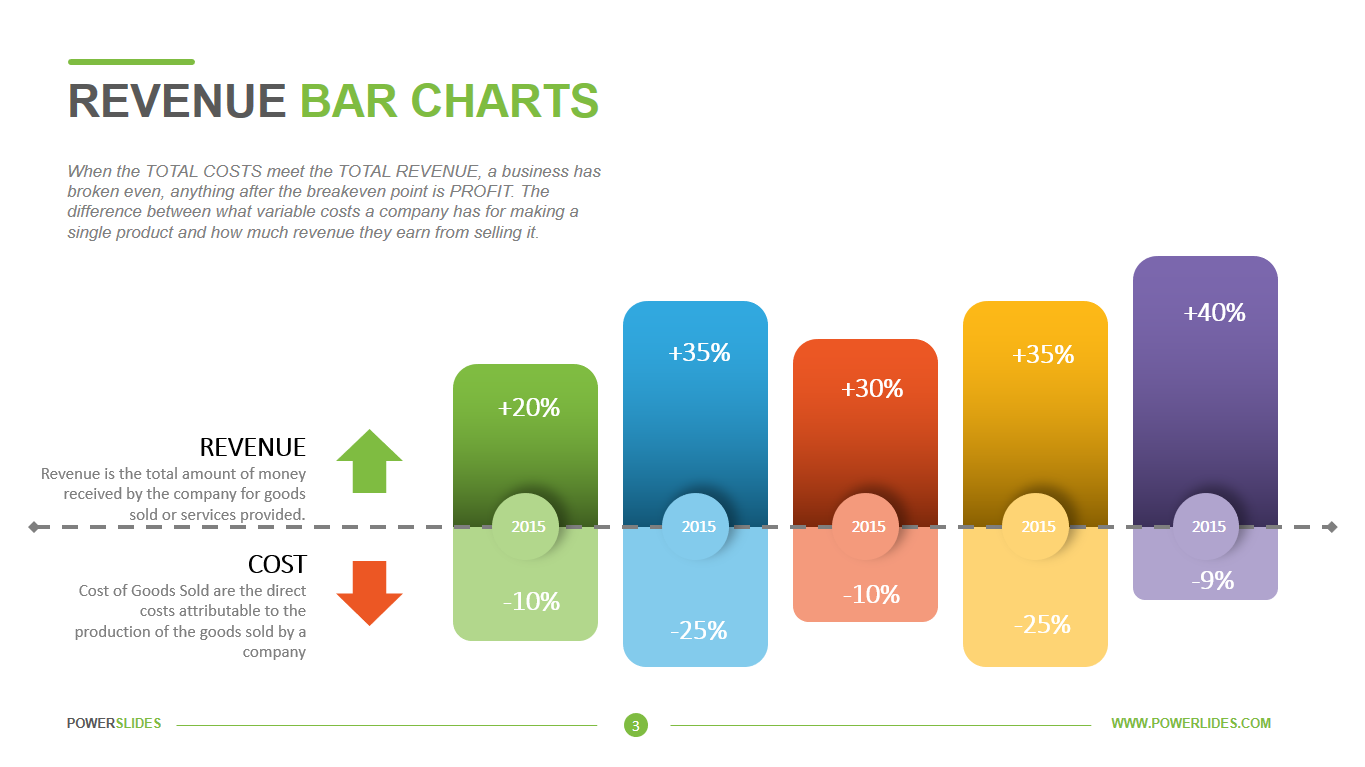
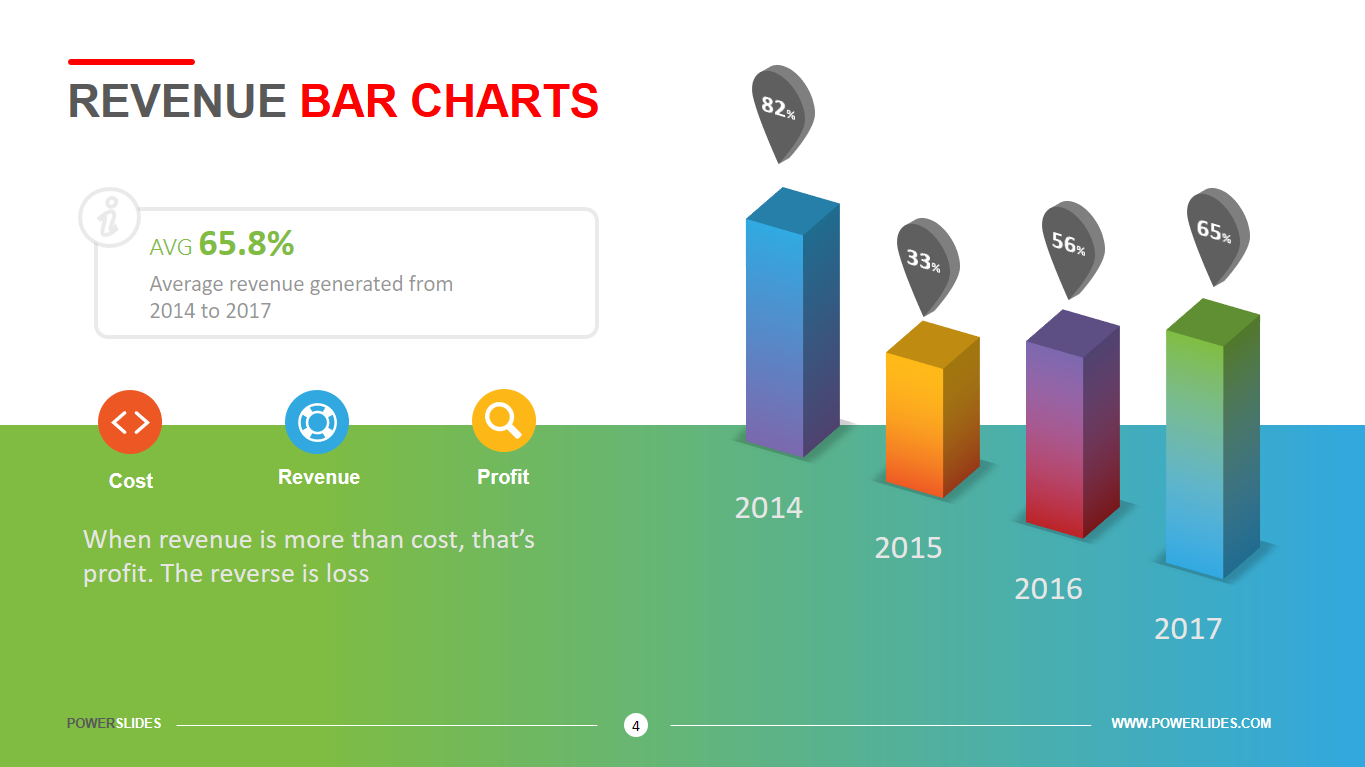
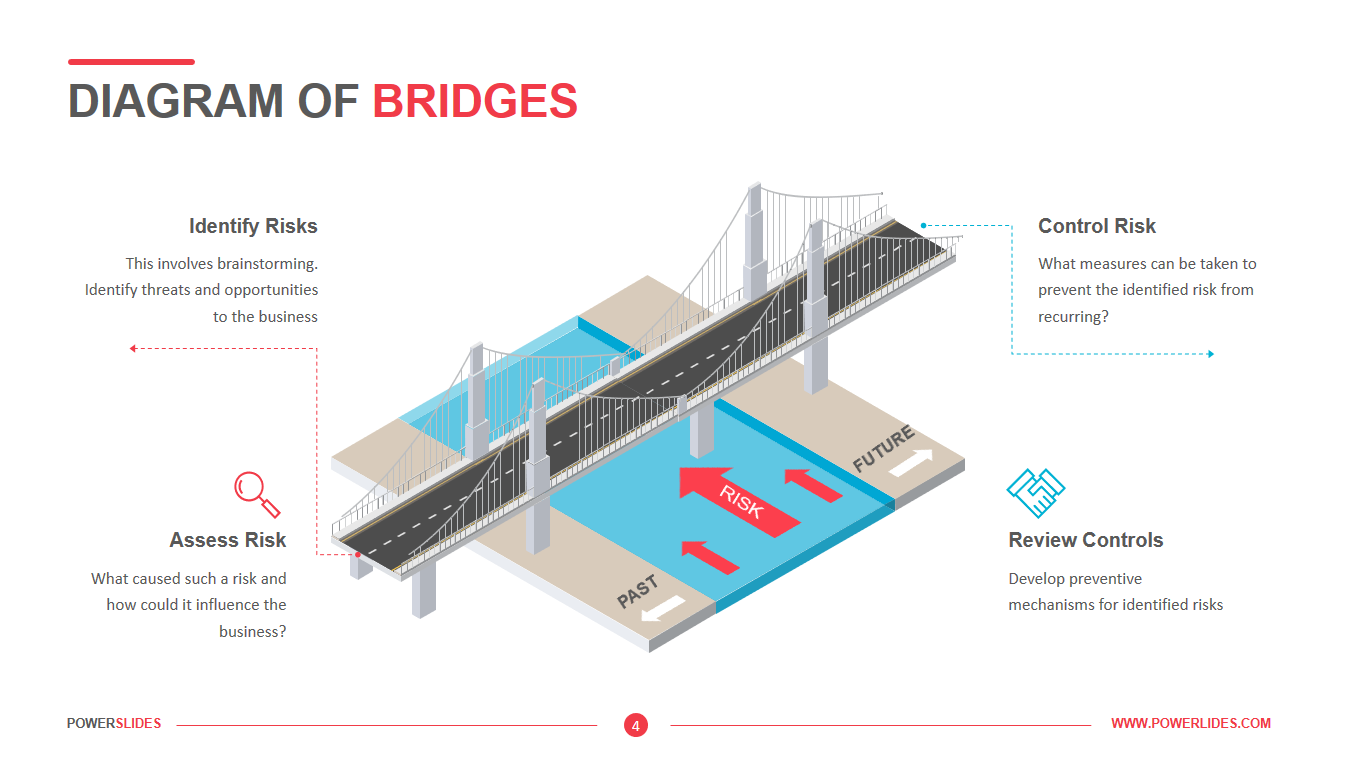
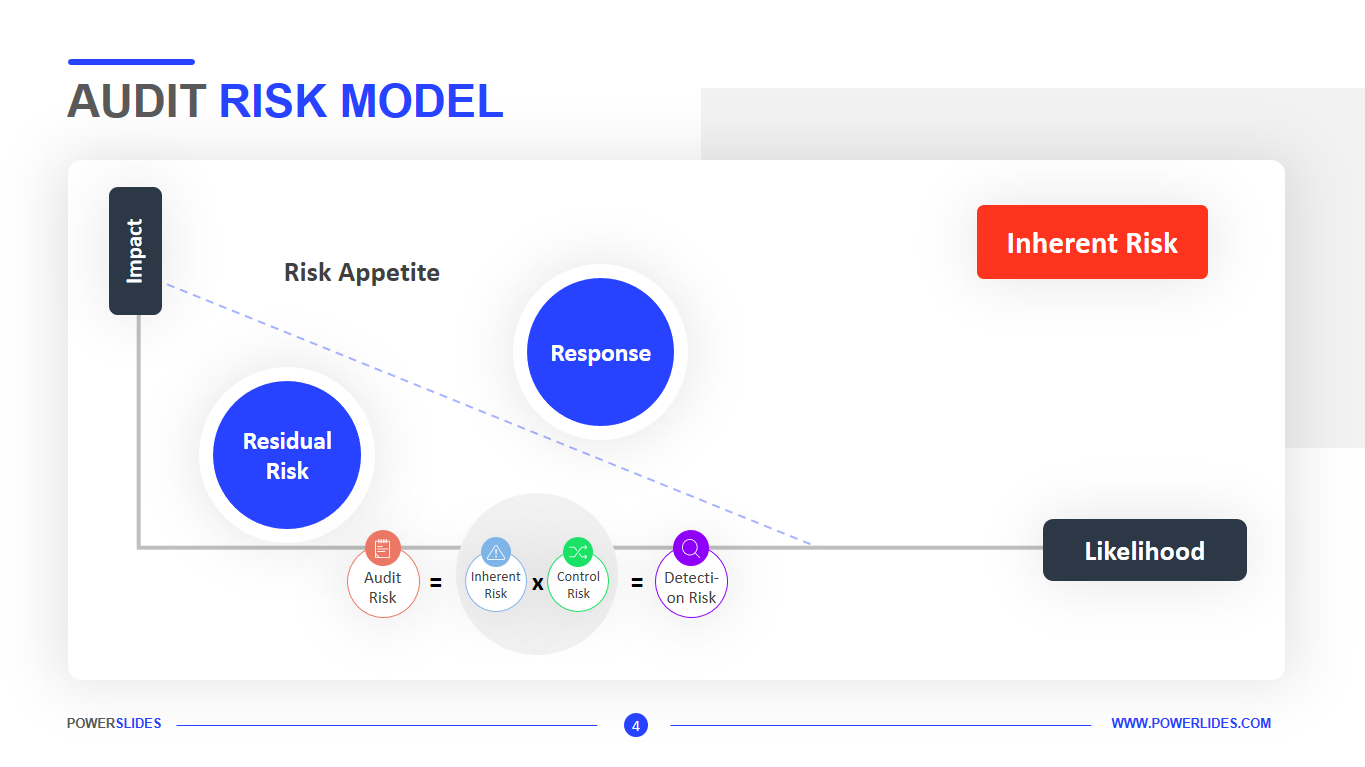
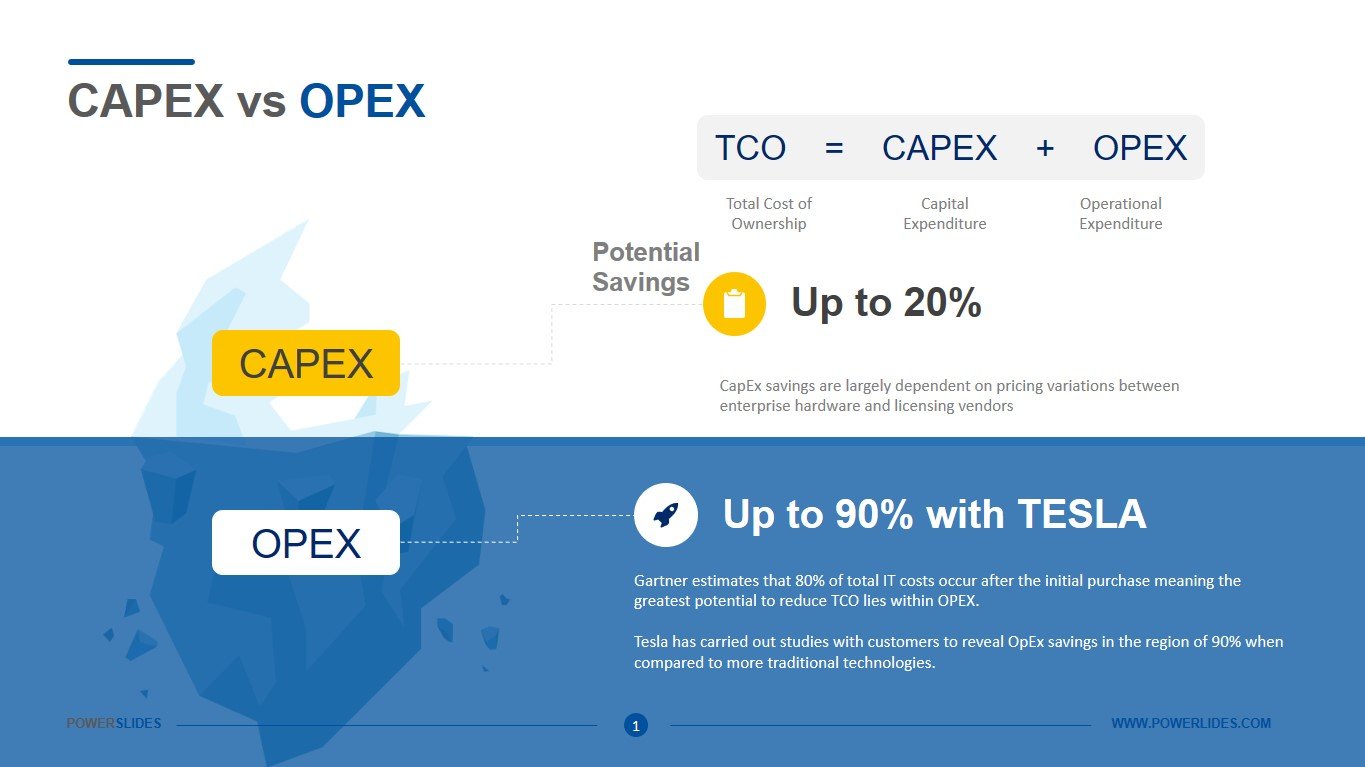
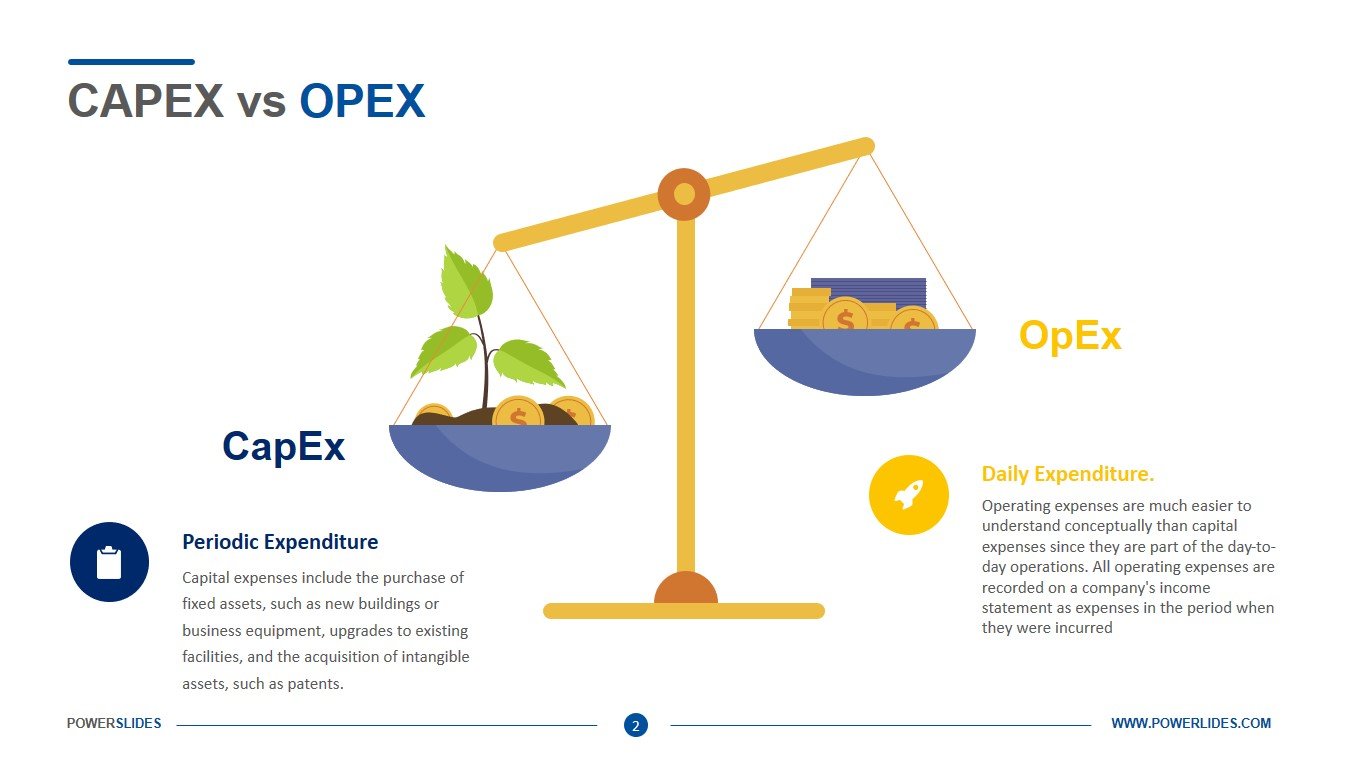
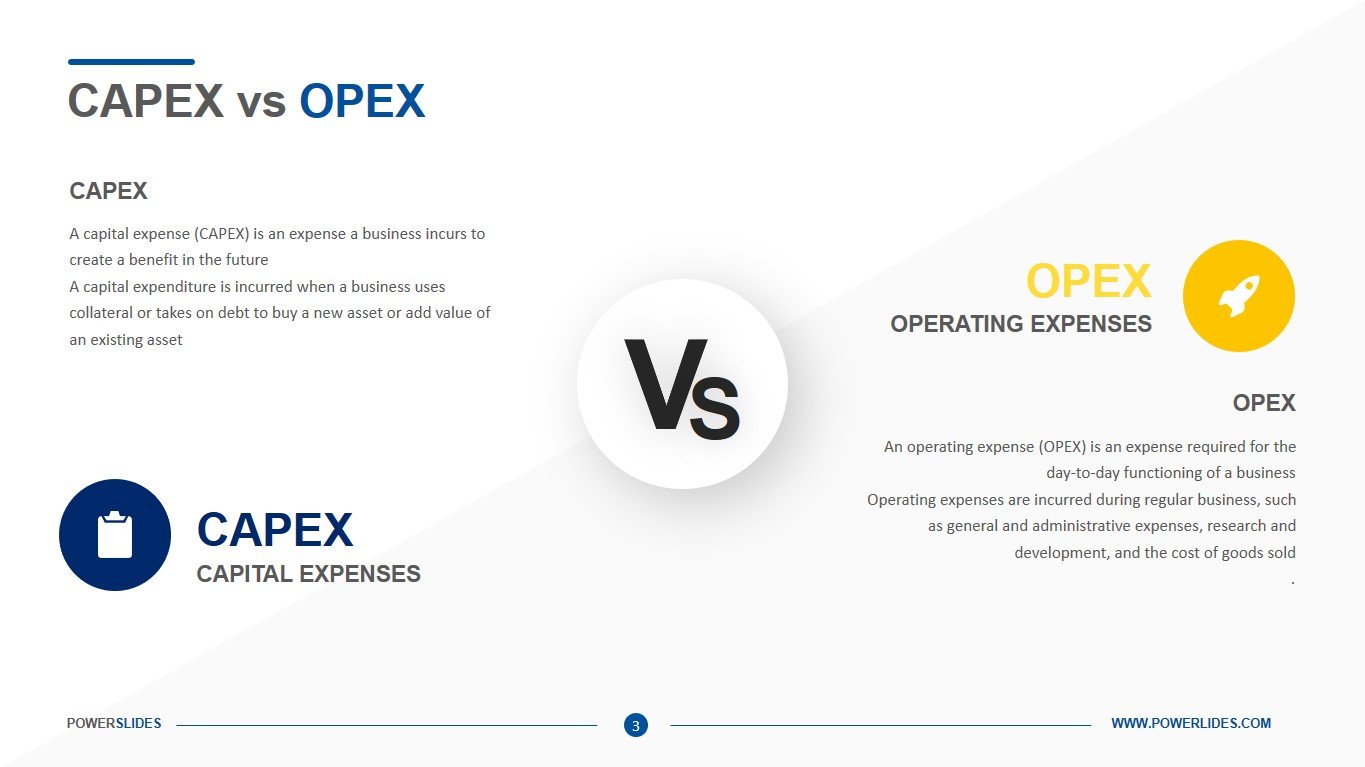
Accounting for company expenses is one of the most important areas of business management and finance. It is impossible to build a long-term business without cost control. In its day-to-day work, any company takes into account capital and operating expenses. Capital expenditures (CAPEX) are purchases of significant goods or services that will be used to improve a company’s performance in the future. One of the defining features of capital expenditures is longevity, meaning the purchases benefit the company for longer than one tax year. For example, capital costs include improving buildings, purchasing computers, trucks, manufacturing equipment. Fixed assets are depreciated over time to spread out the cost of the asset over its useful life. Depreciation is helpful for capital expenditures because it allows the company to avoid a significant hit to its bottom line in the year the asset was purchased. CAPEX can be externally financed, which is usually done through collateral or debt financing. Companies issue bonds, take out loans, or use other debt instruments to increase their capital investment. Shareholders who receive dividend payments pay close attention to CAPEX numbers, looking for a company that pays out income while continuing to improve prospects for future profit.
Operating expenses (OPEX) include rent, utility bills, employee salaries, travel and other running costs. Accounting for operating expenses allows you to control the flow of funds. Operating expenses consist of small payments. However, these payments are made on an ongoing basis. That is why such payments add up to more than capital expenditures. Continuous control of accounting of operating expenses allows you to significantly reduce the costs of the enterprise.
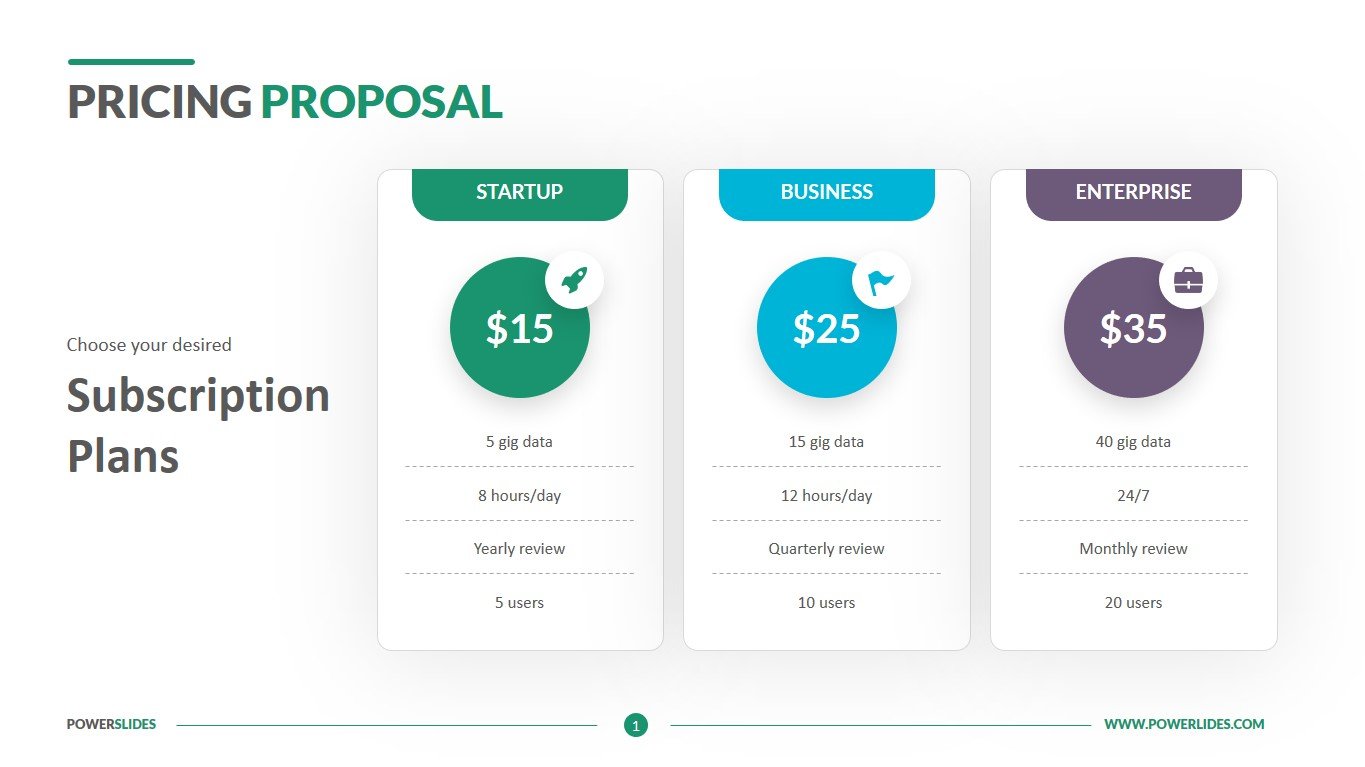
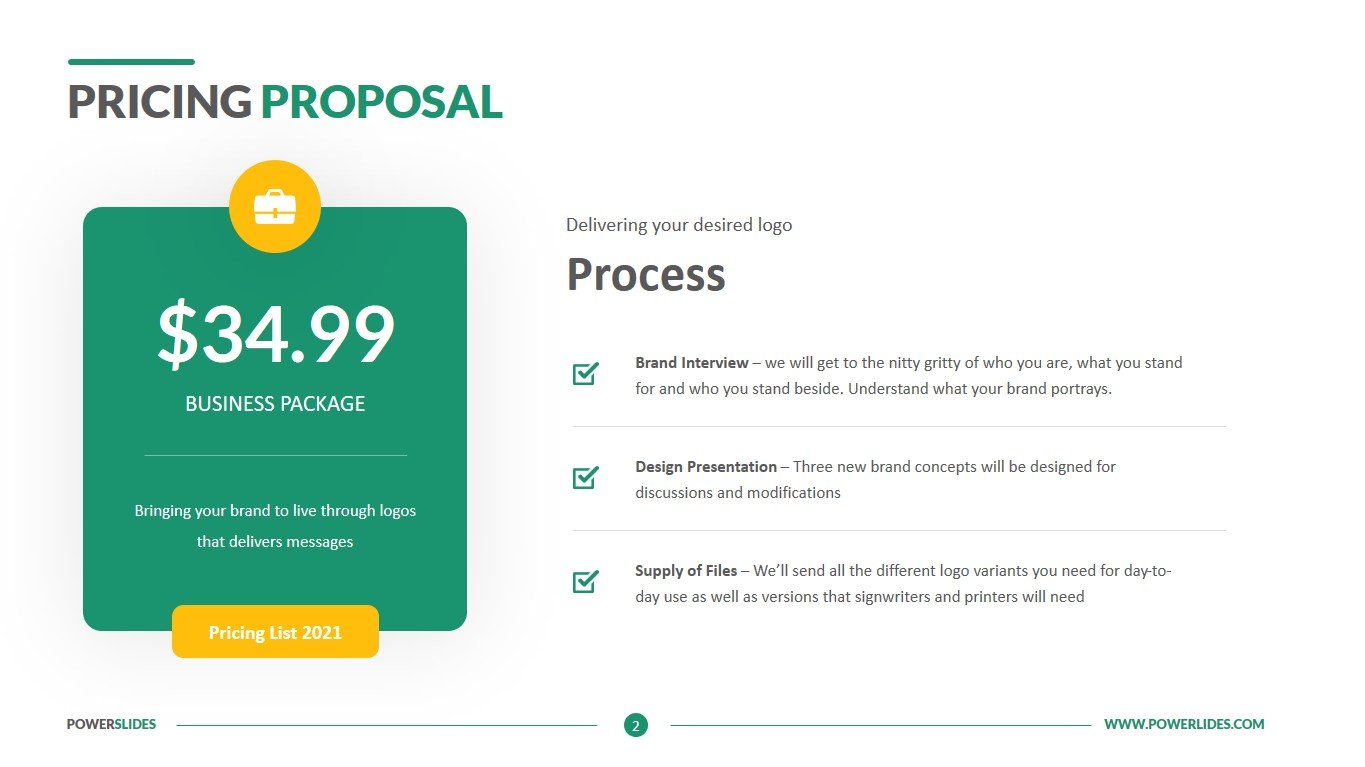
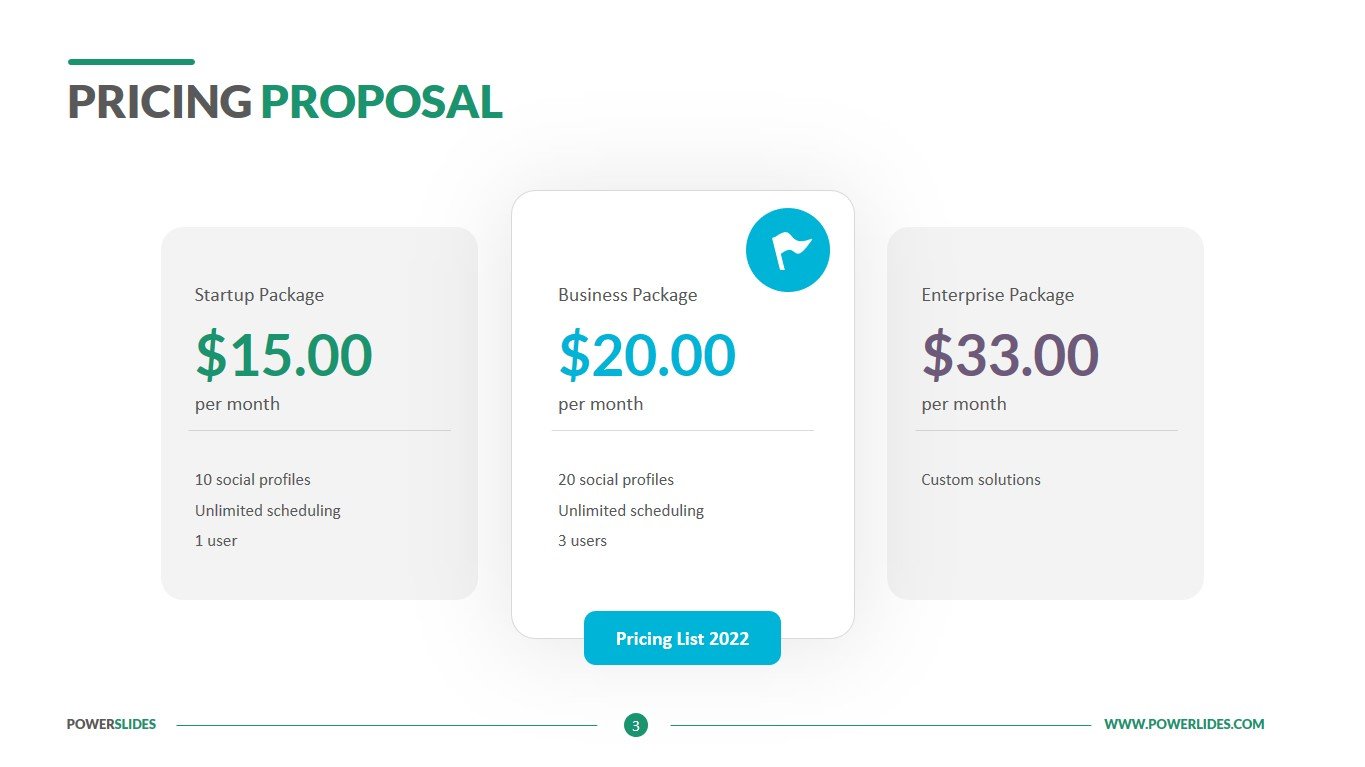
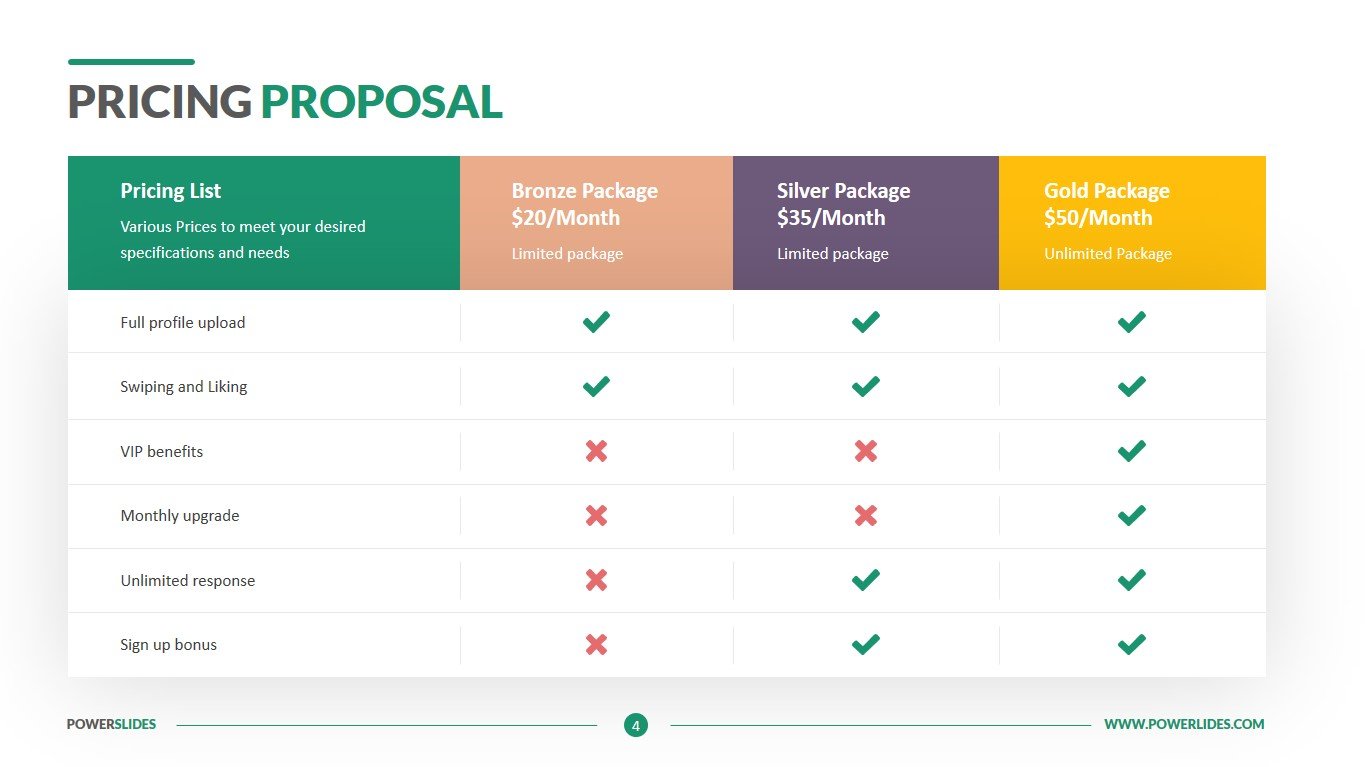
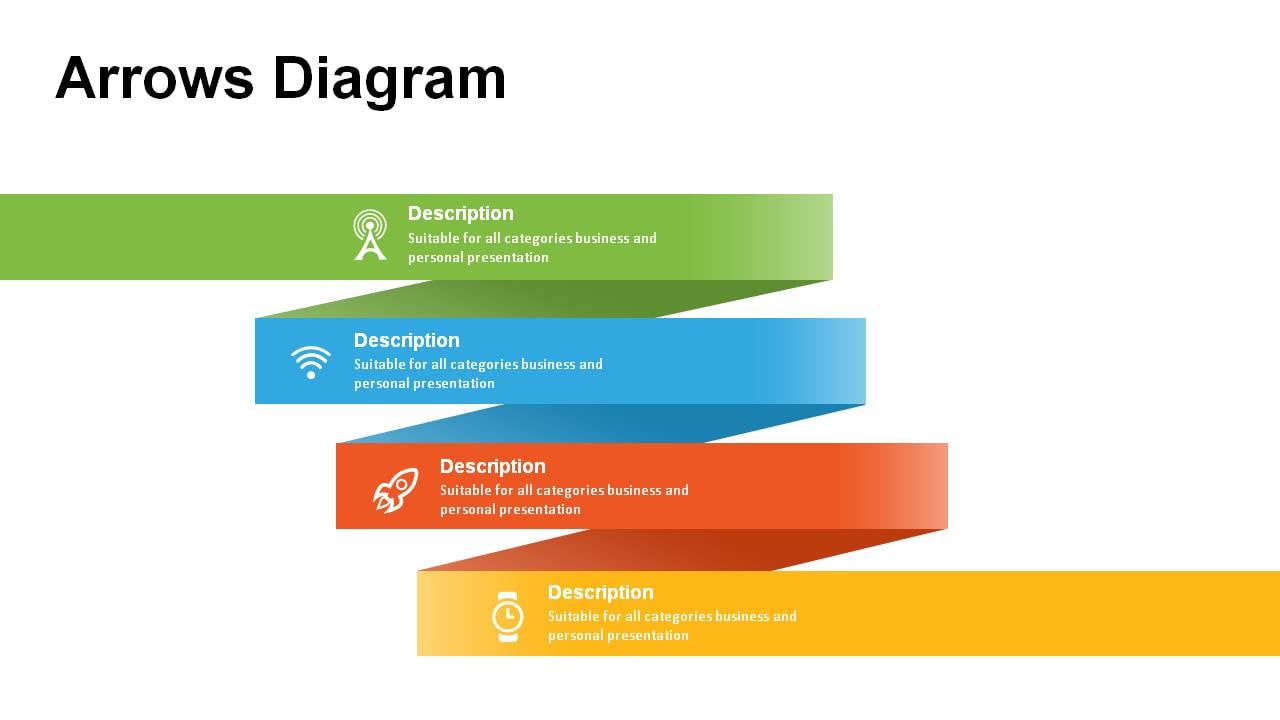
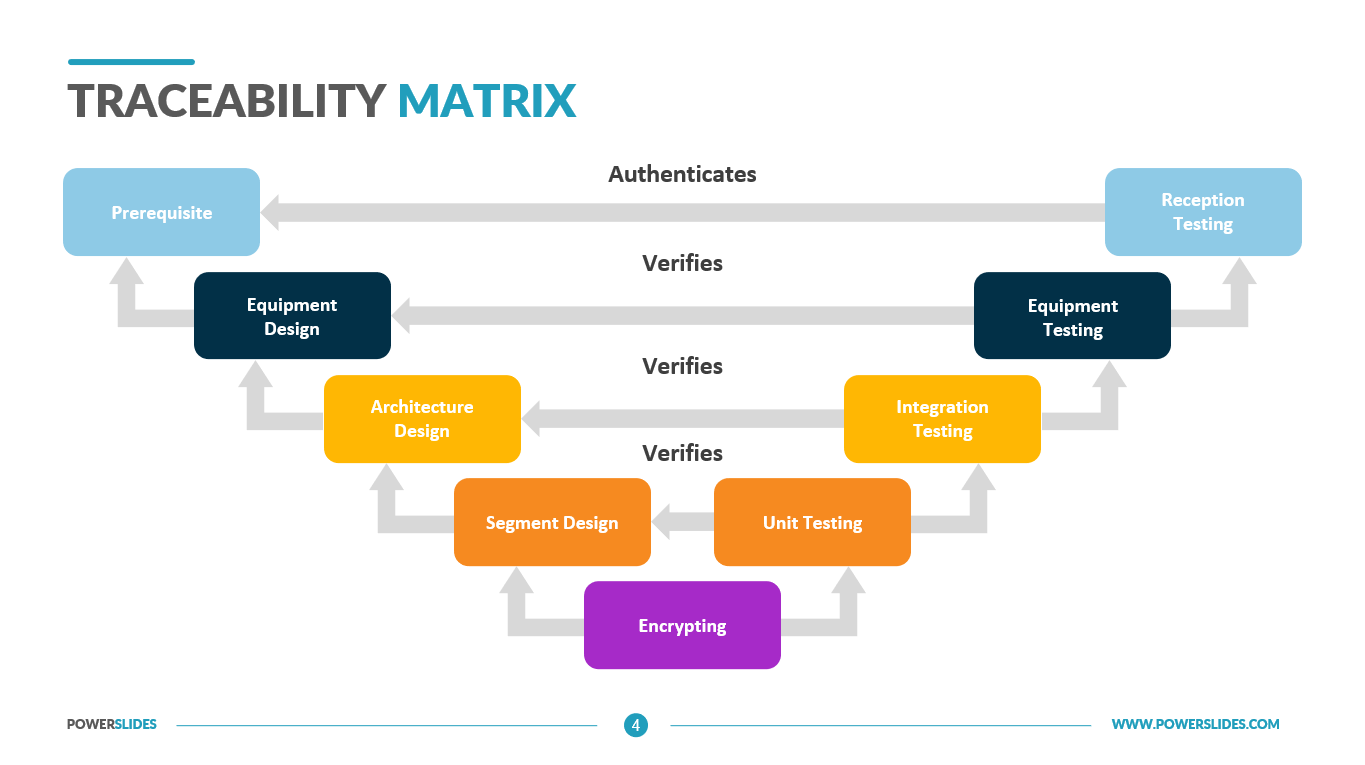
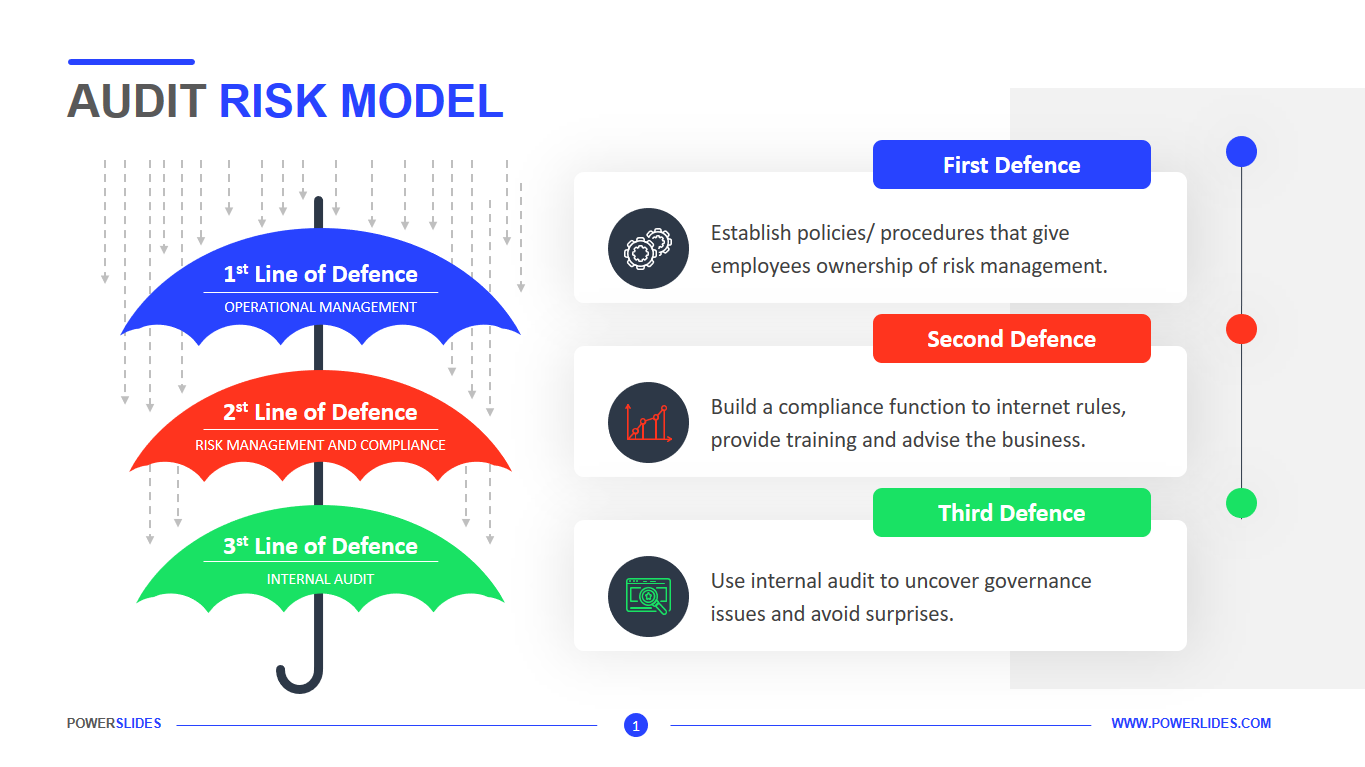
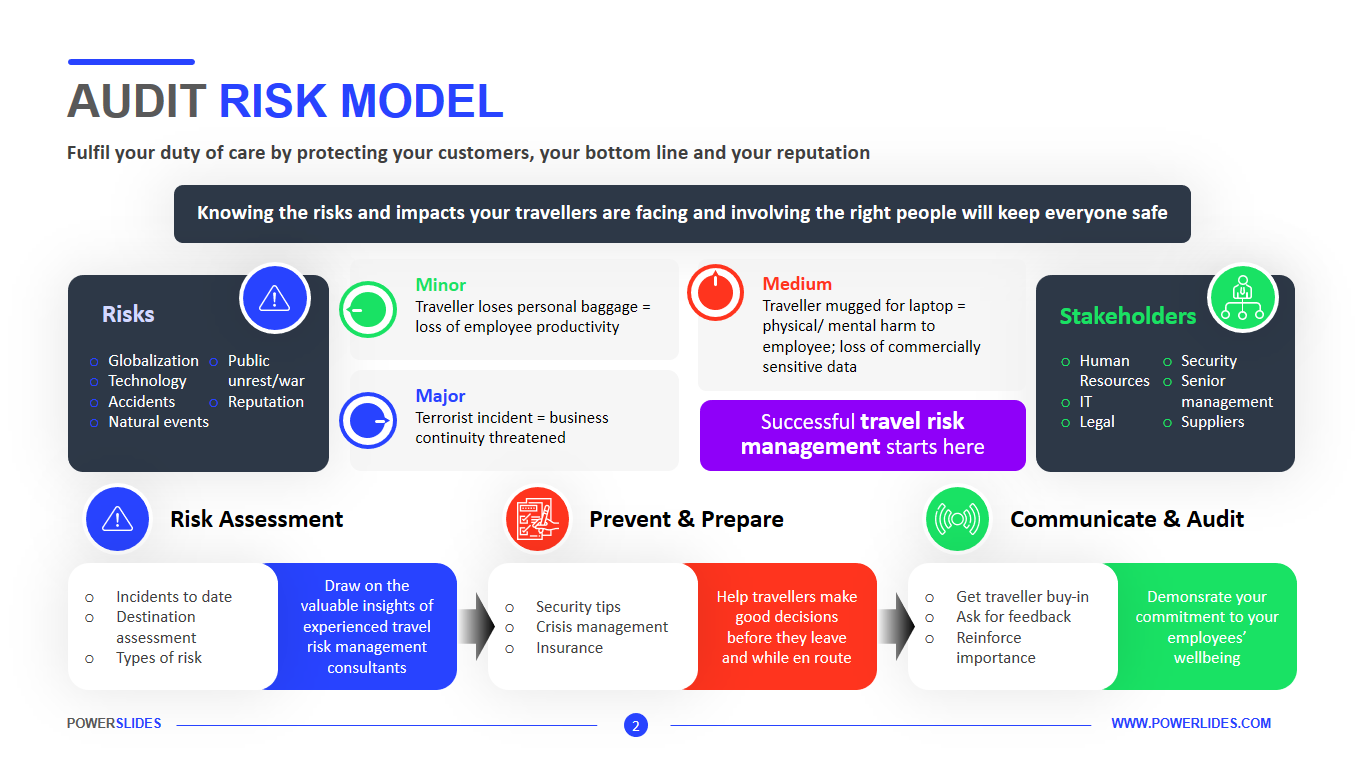
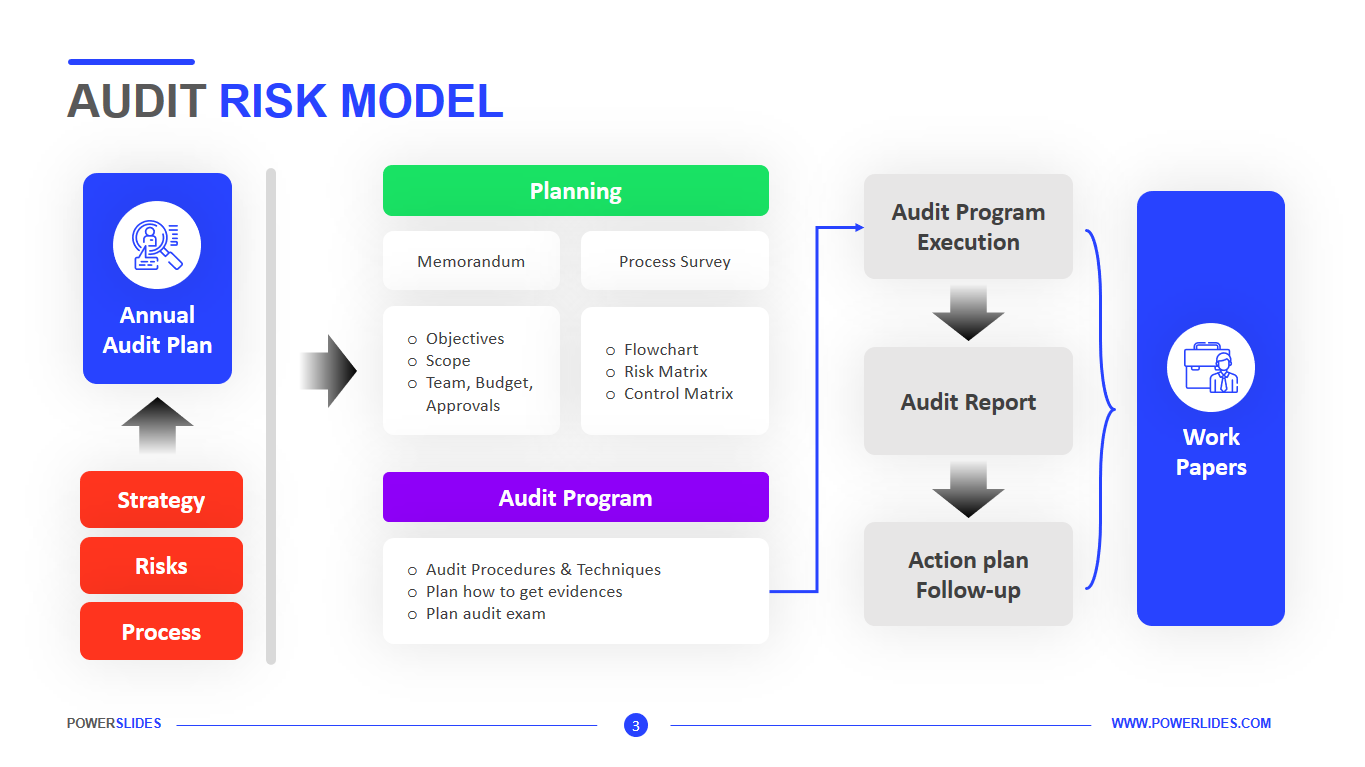
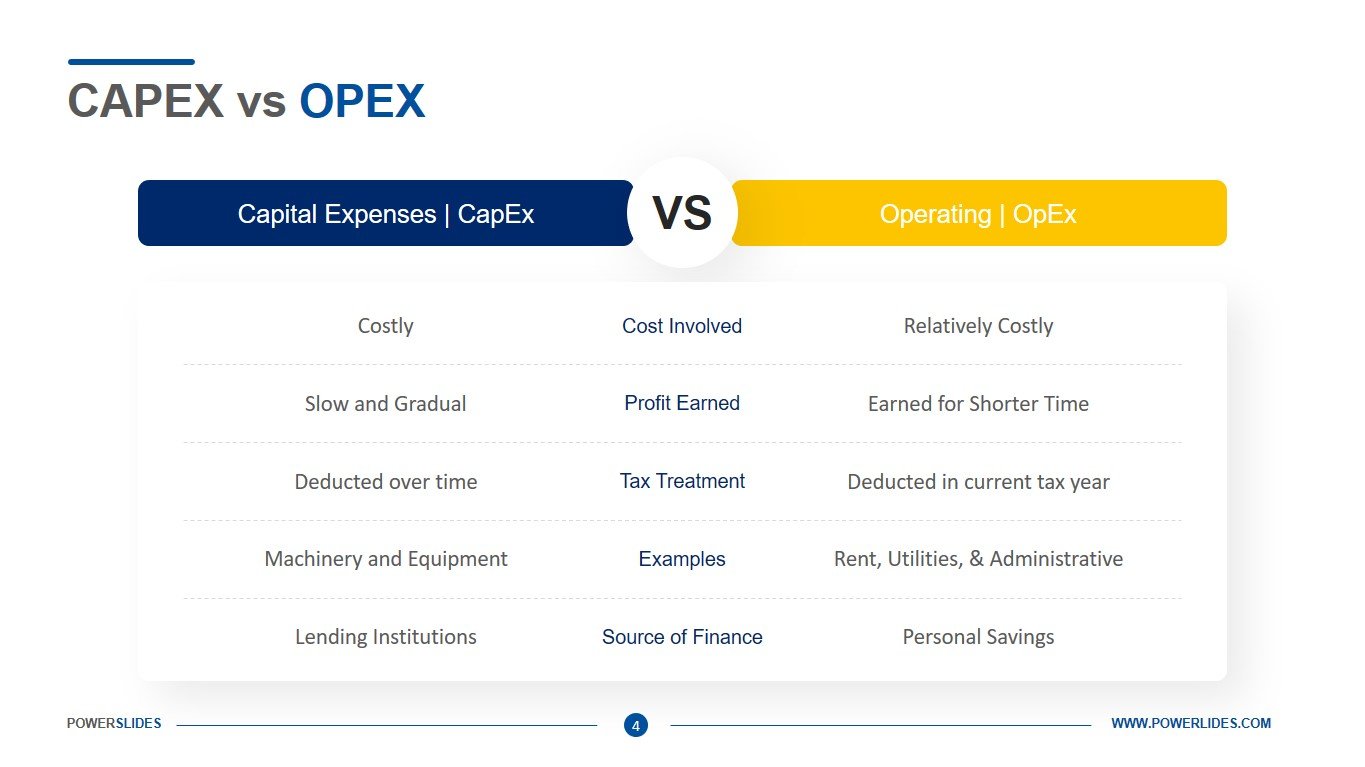
Capex vs Opex template consists of four slides that have a professional design and modern style. You can change the color, position, size of blocks and fonts according to your corporate brand book. The slides contain modern infographics that visually represent the comparison between capital and operating costs. Financiers, economists and accountants can use the slides of this template in their daily work. For example, you can use the slides in this template when comparing company cost percentages. A correct understanding of the financial situation allows you to determine the future sources of financing for capital investments. The fourth slide is presented as a comparison table between cost types. This slide can be used when comparing the characteristics of a company’s product and its competitors. Business and startup executives can use this template when preparing financial statements for investors and shareholders. Also, this template can be used when preparing a business plan. The slides of this template can be used by business trainers or university educators when preparing their courses on enterprise finance or cost management. Investment company staff can also use the slides of this template when comparing the investment attractiveness of different businesses. This template will organically complement your presentation collection. You can also use this template when updating your old financial and investment presentations.


