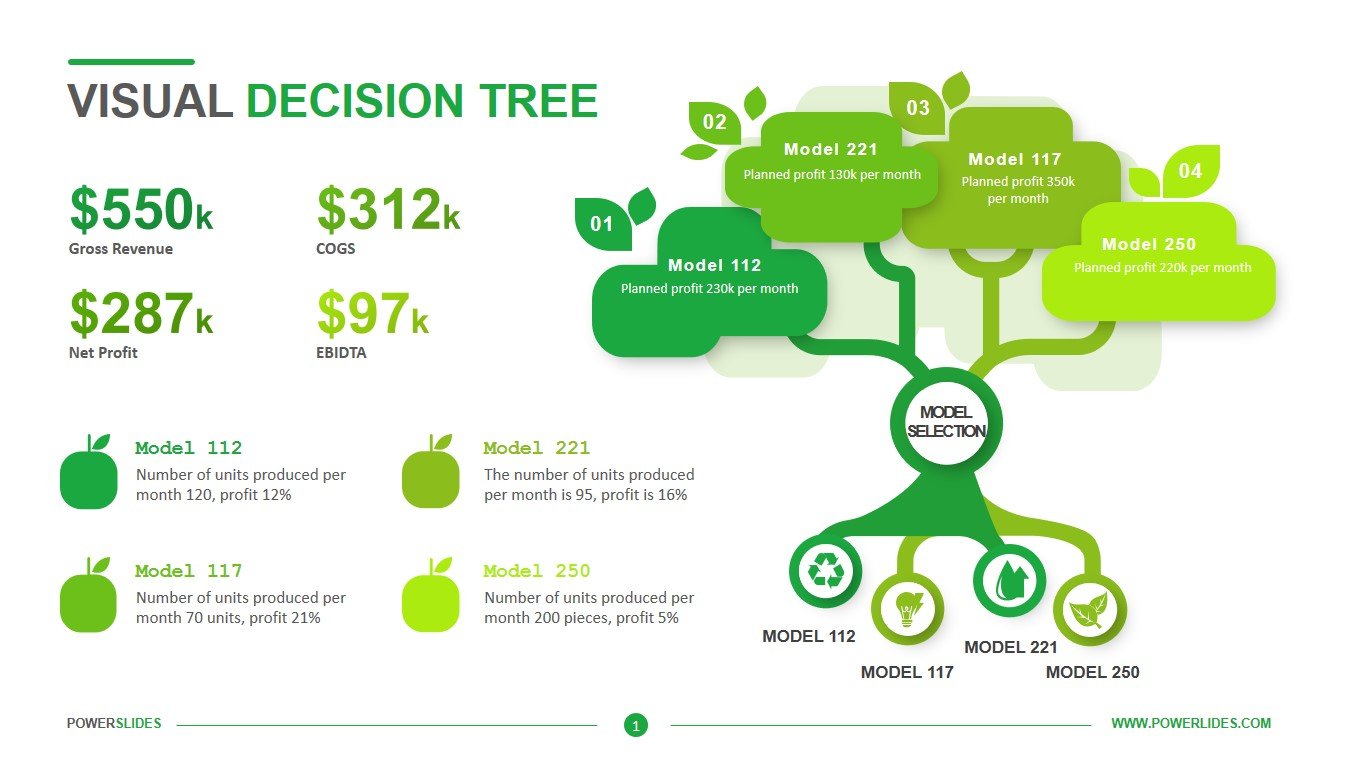
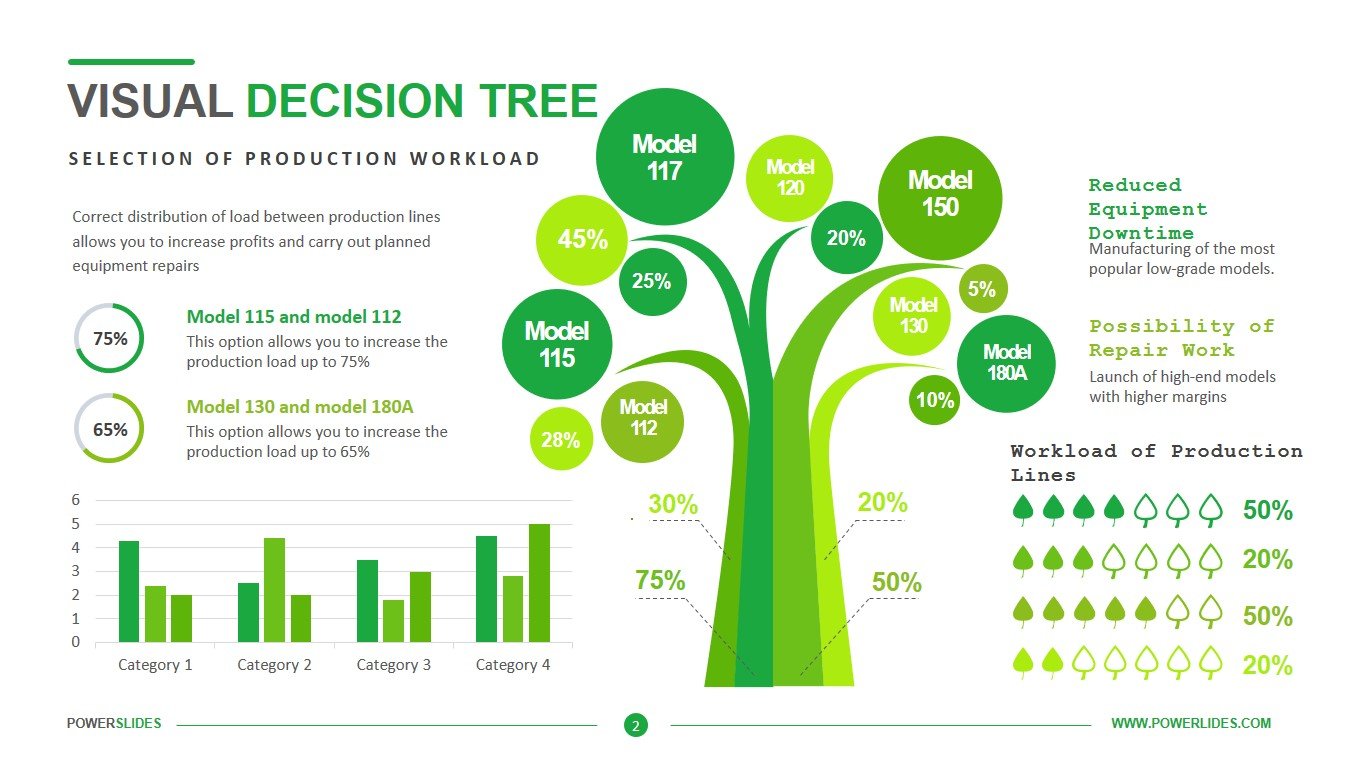
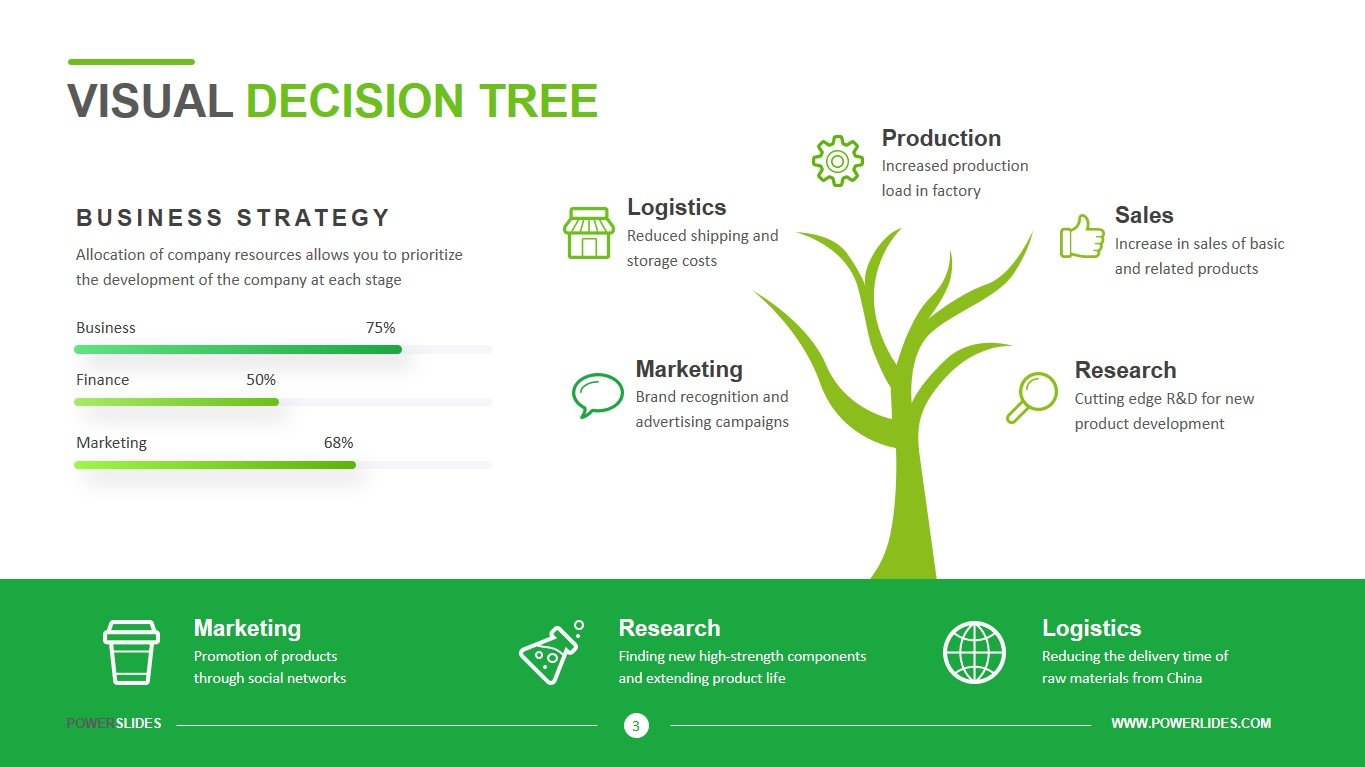
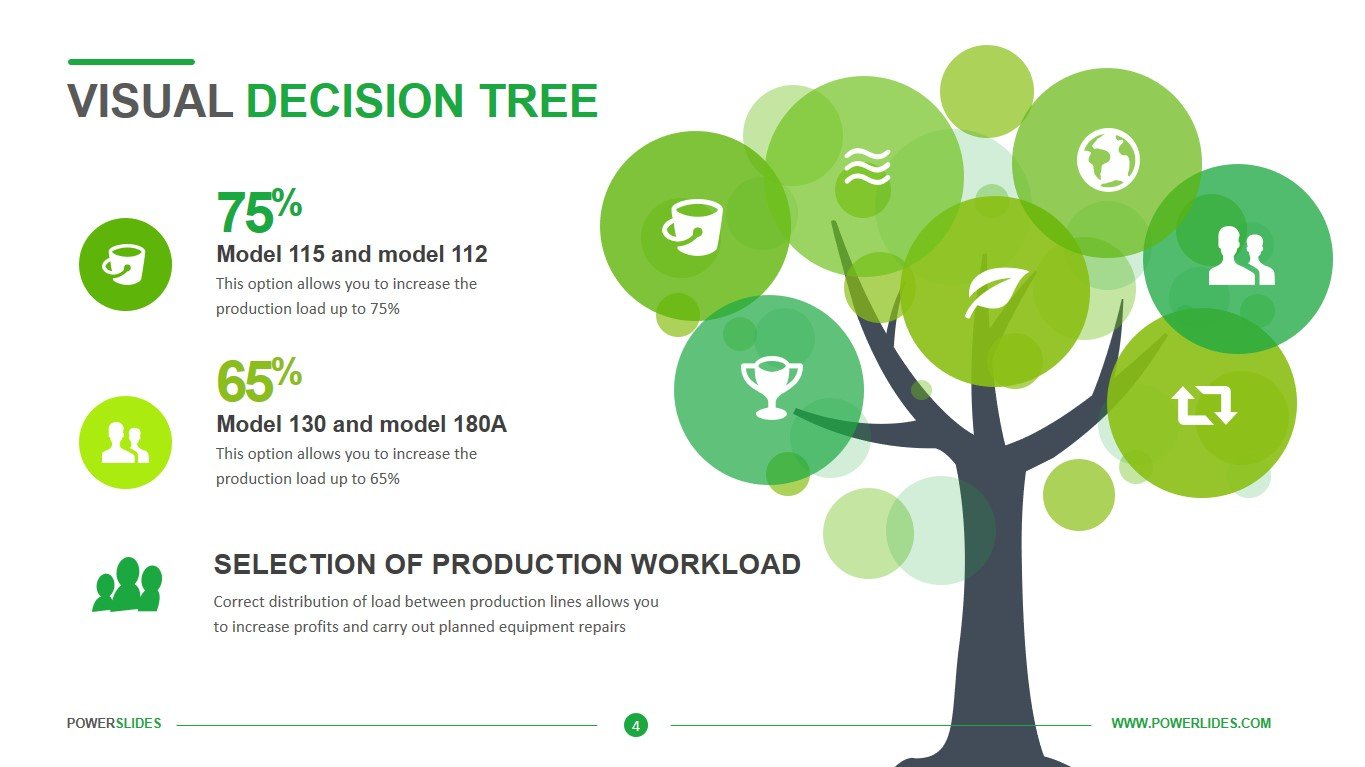
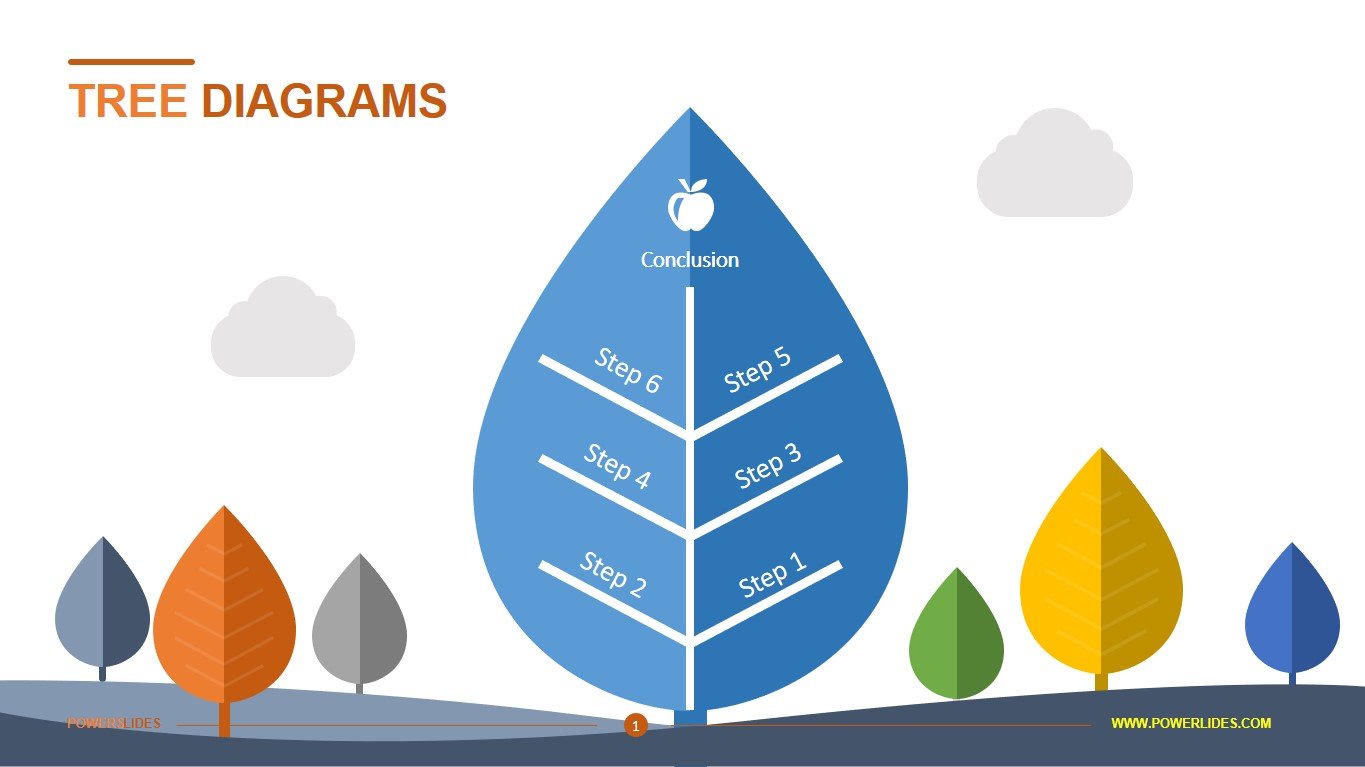
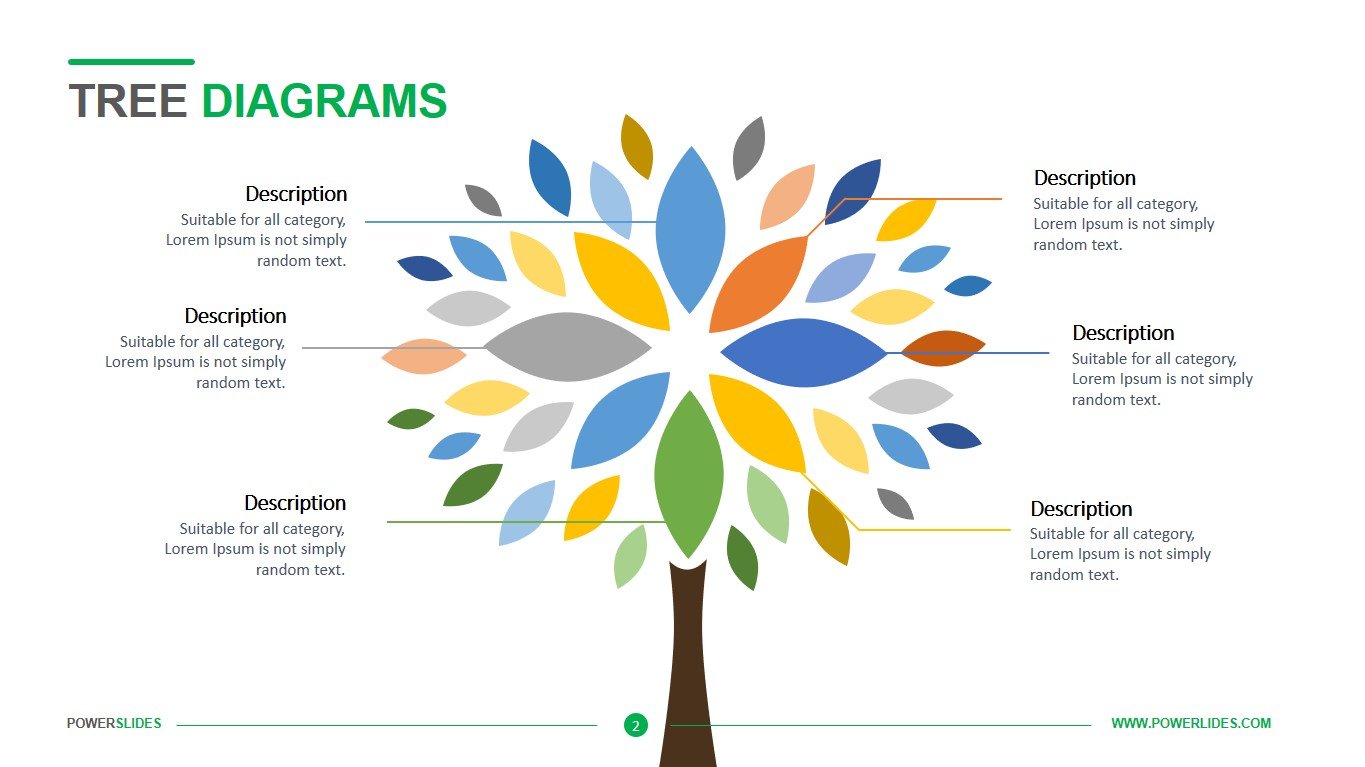
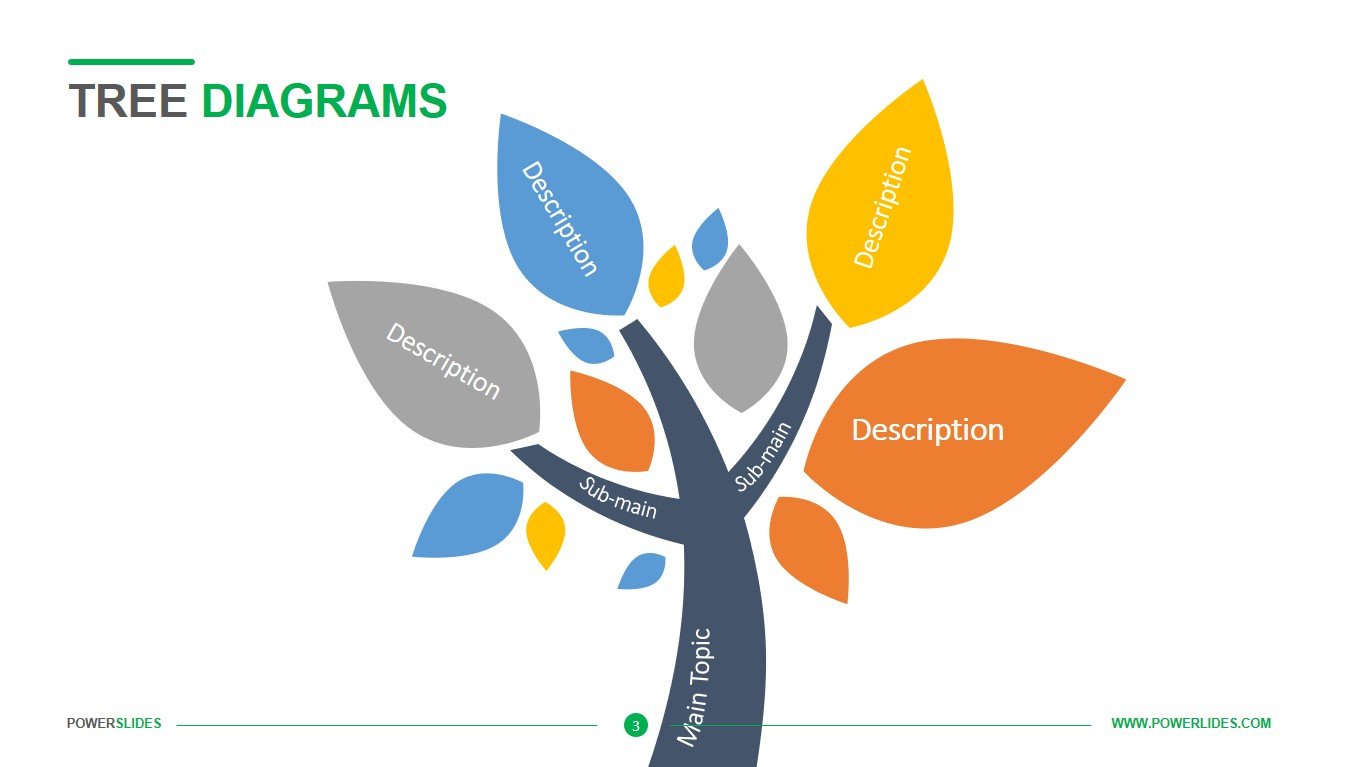
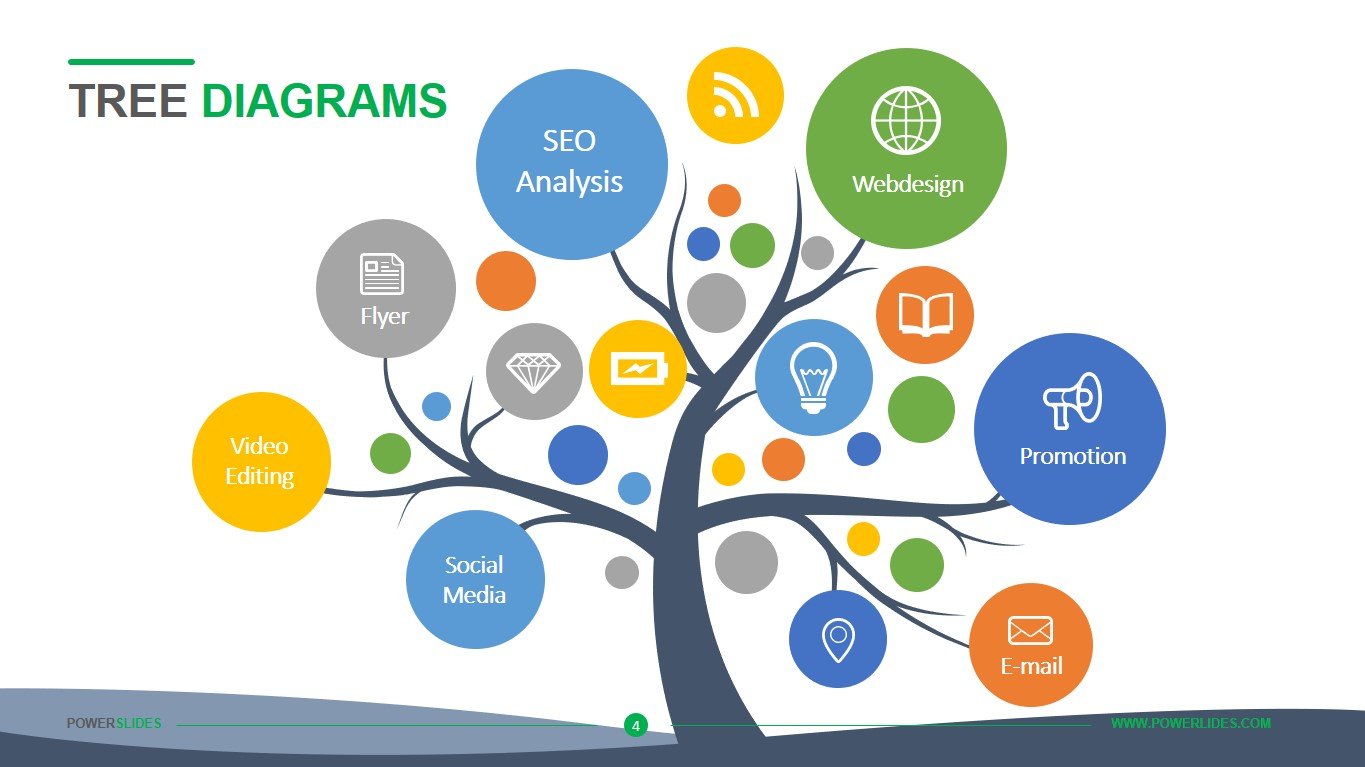
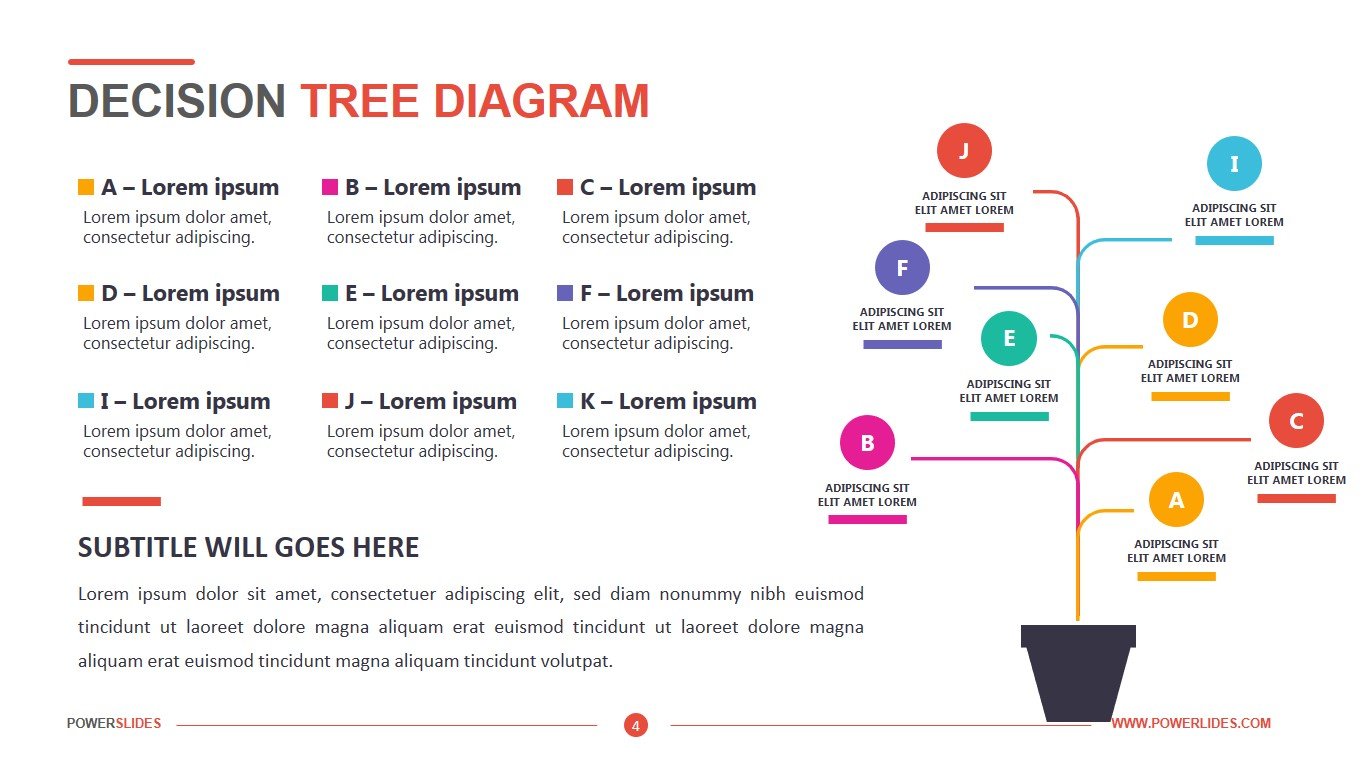
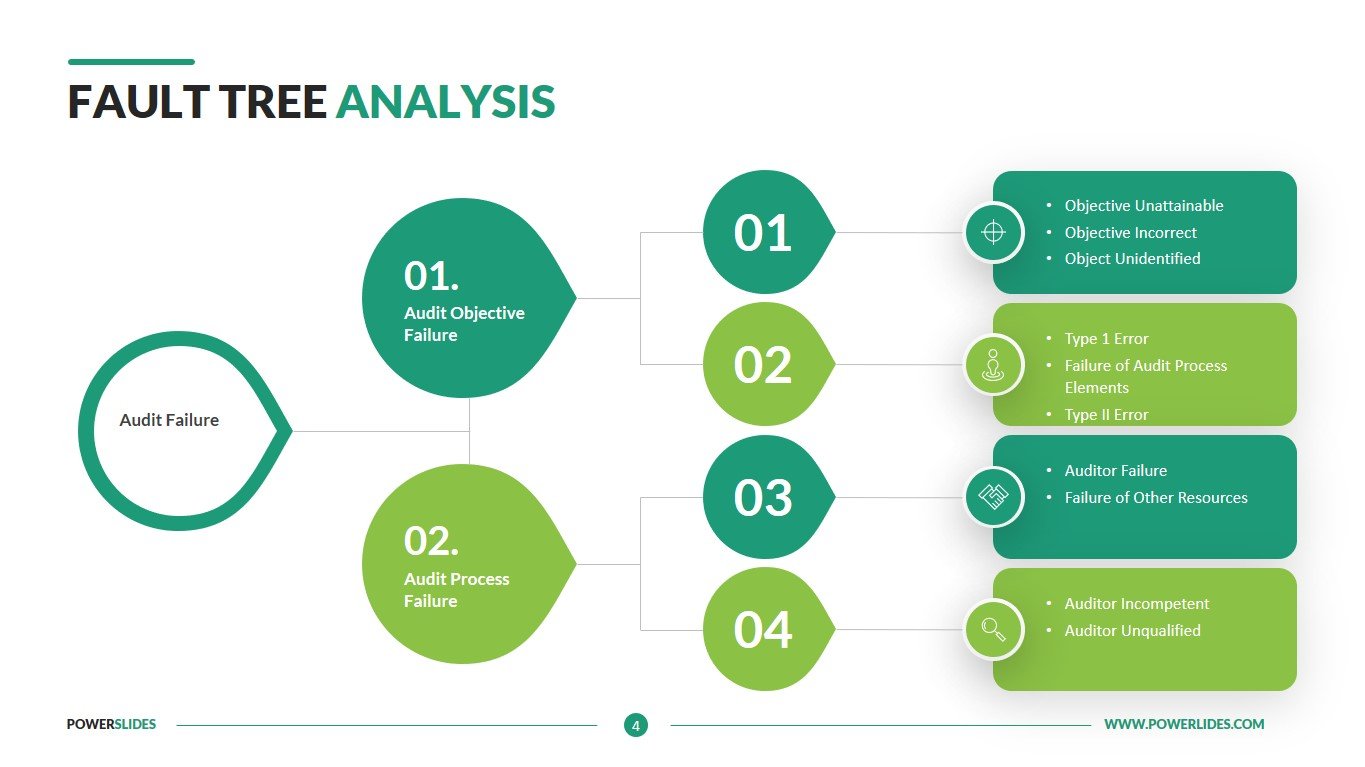
Petal Diagram
What do you think of this template?


 (3.67/ 5)
11 ratings

 4 Slides
 File size: 16:9
 Fonts: Lato Black, Calibri
 Supported version
PPT 2010, PPT 2013, PPT 2016
Supported version
PPT 2010, PPT 2013, PPT 2016

Product details
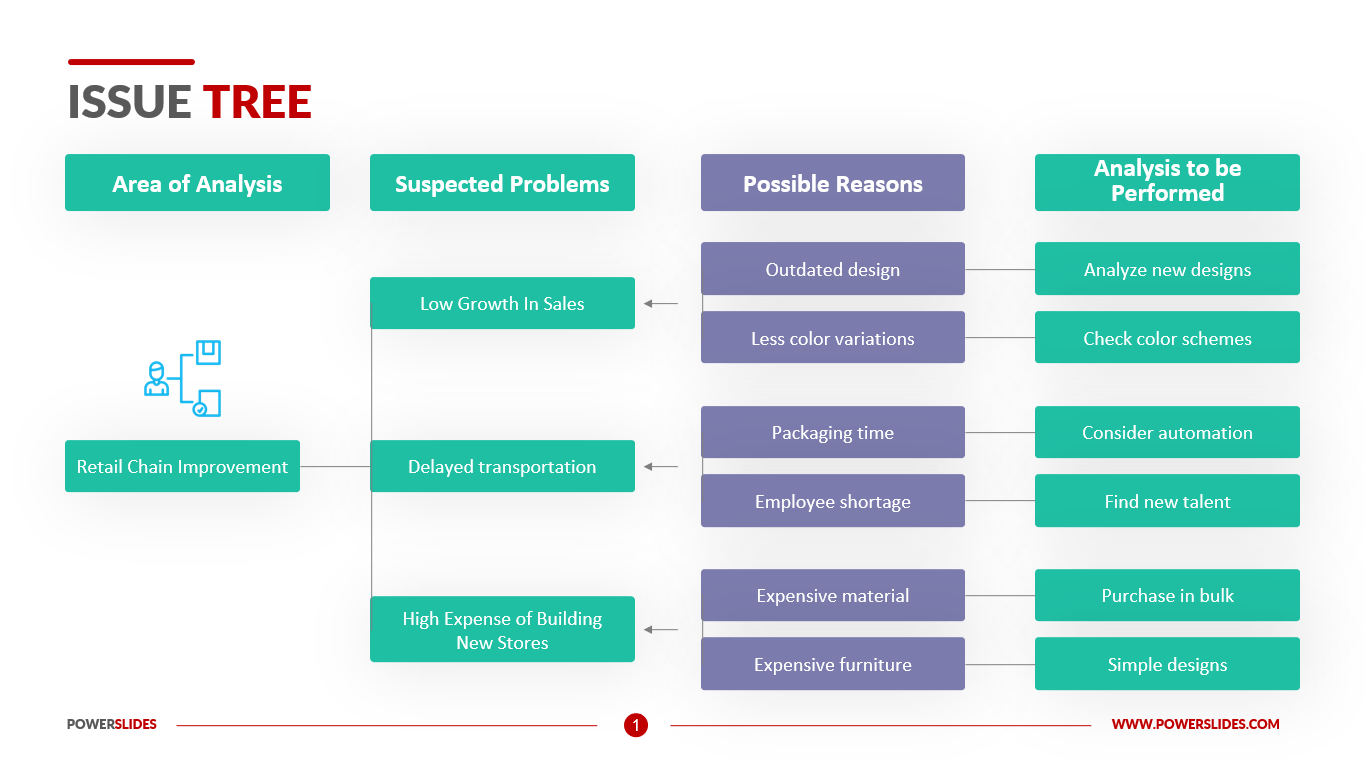
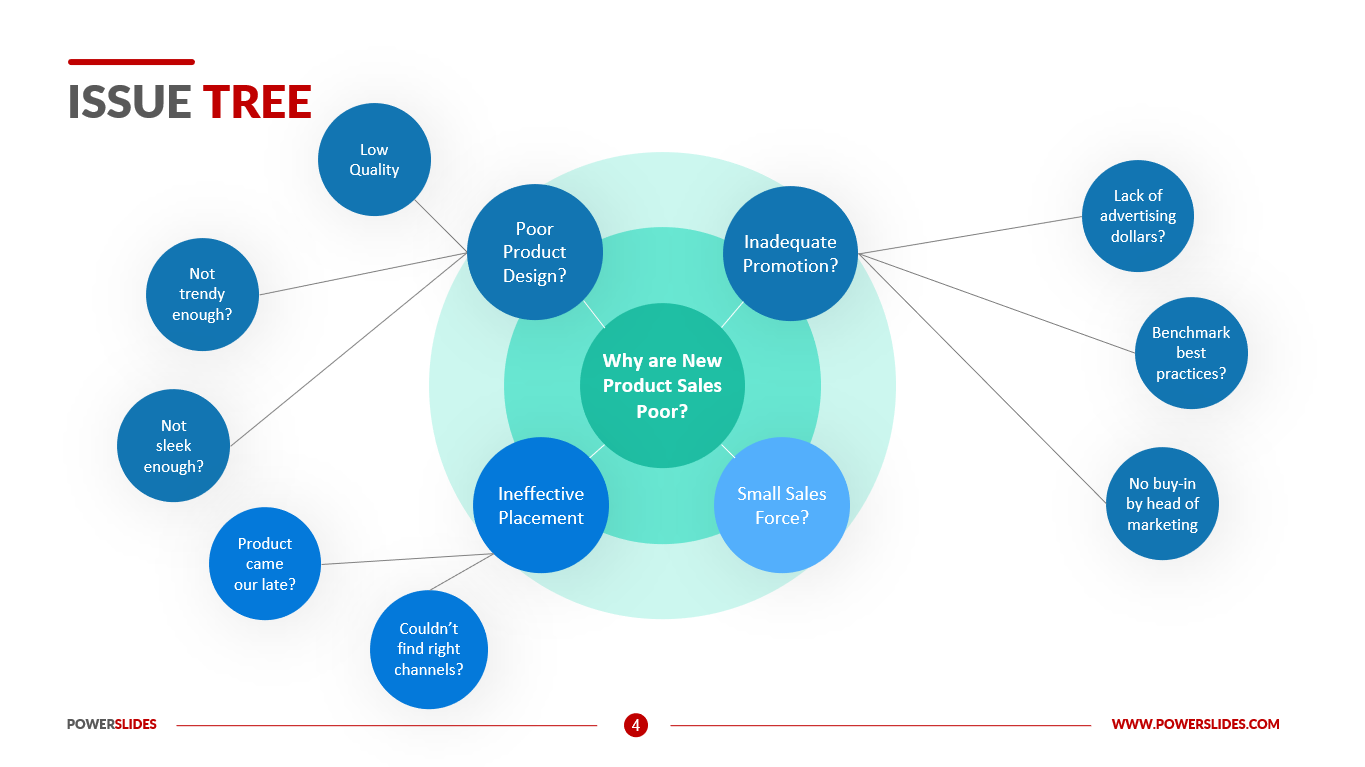
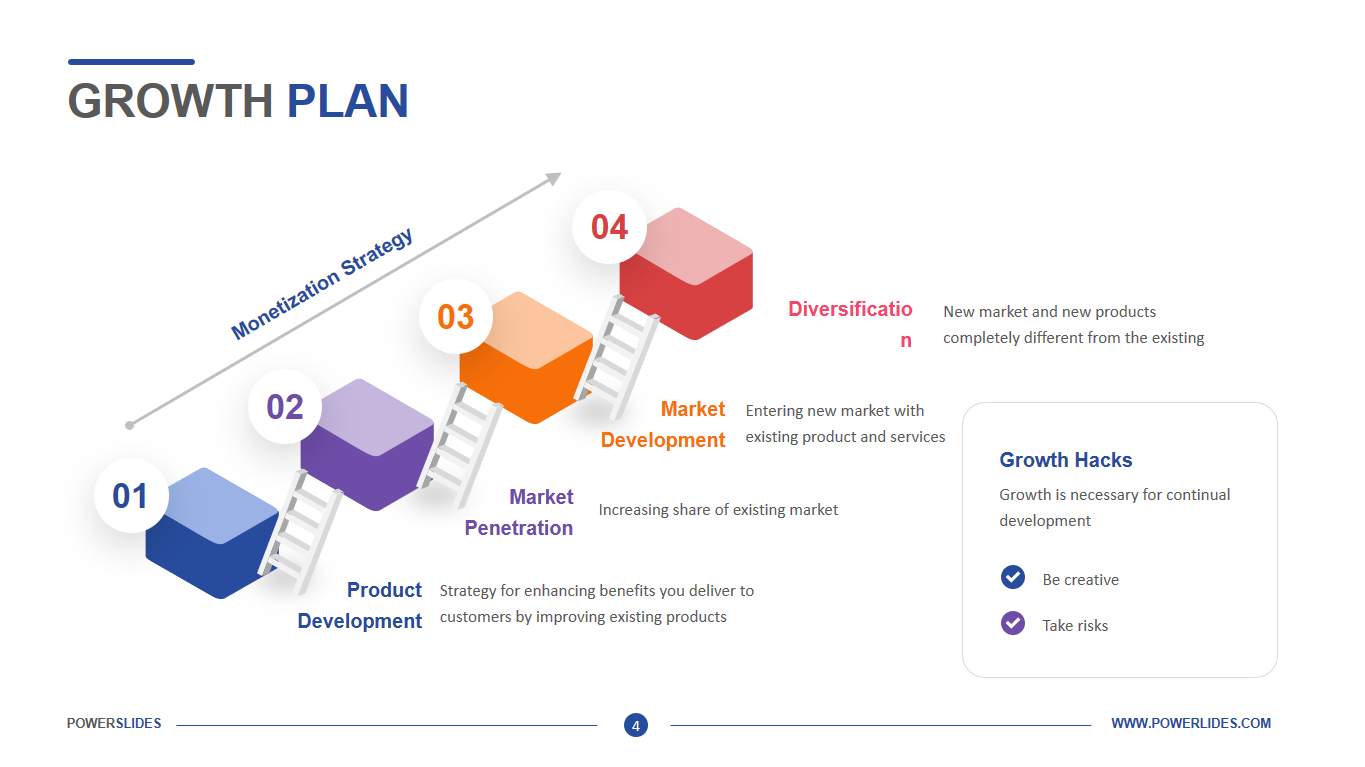
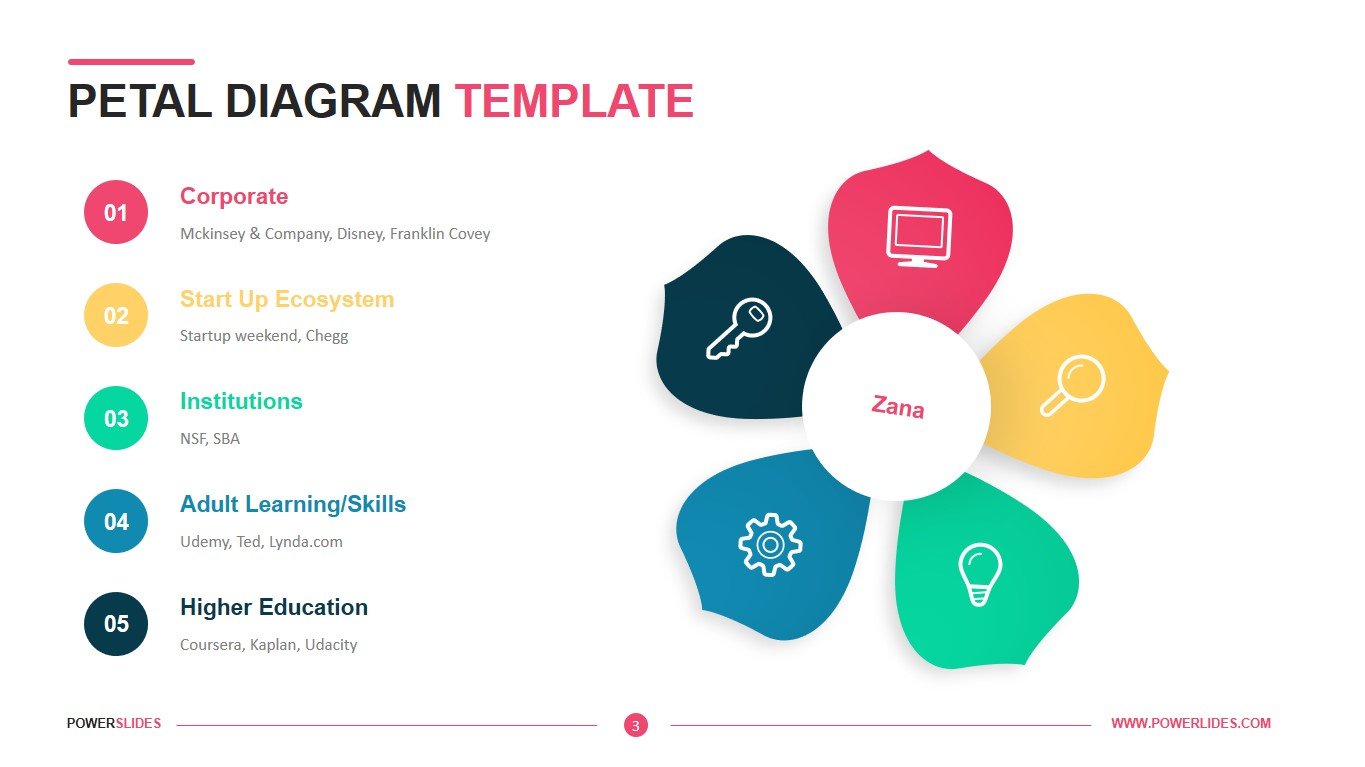
The X / Y Competitive Analysis Slide is used by existing companies planning to enter an existing market. In this case, X / Y competition is based on user-defined metrics in the existing market. But today, most startups are trying to reassign existing markets or create new ones. How do you portray this? What if competition in market creation is indeed based on the intersection of many existing markets? You can link your company in the center of a radar chart. From the center of the multi-petal diagram are additional customer markets. These markets include the corporate sector, higher education, the startup ecosystem, and educational institutions. The petal chart is more illustrative when venture capitalists report the amount of capital created by quantifying the petals, in other words, scaling the petal size. This directly shows how hot and promising the company is. You use this chart to articulate your first hypotheses of who are customers segments you’re targeting. If your hypotheses about the potential customers turn out to be incorrect, and they aren’t interested in your product, then you go back to this competitive diagram and revise it.
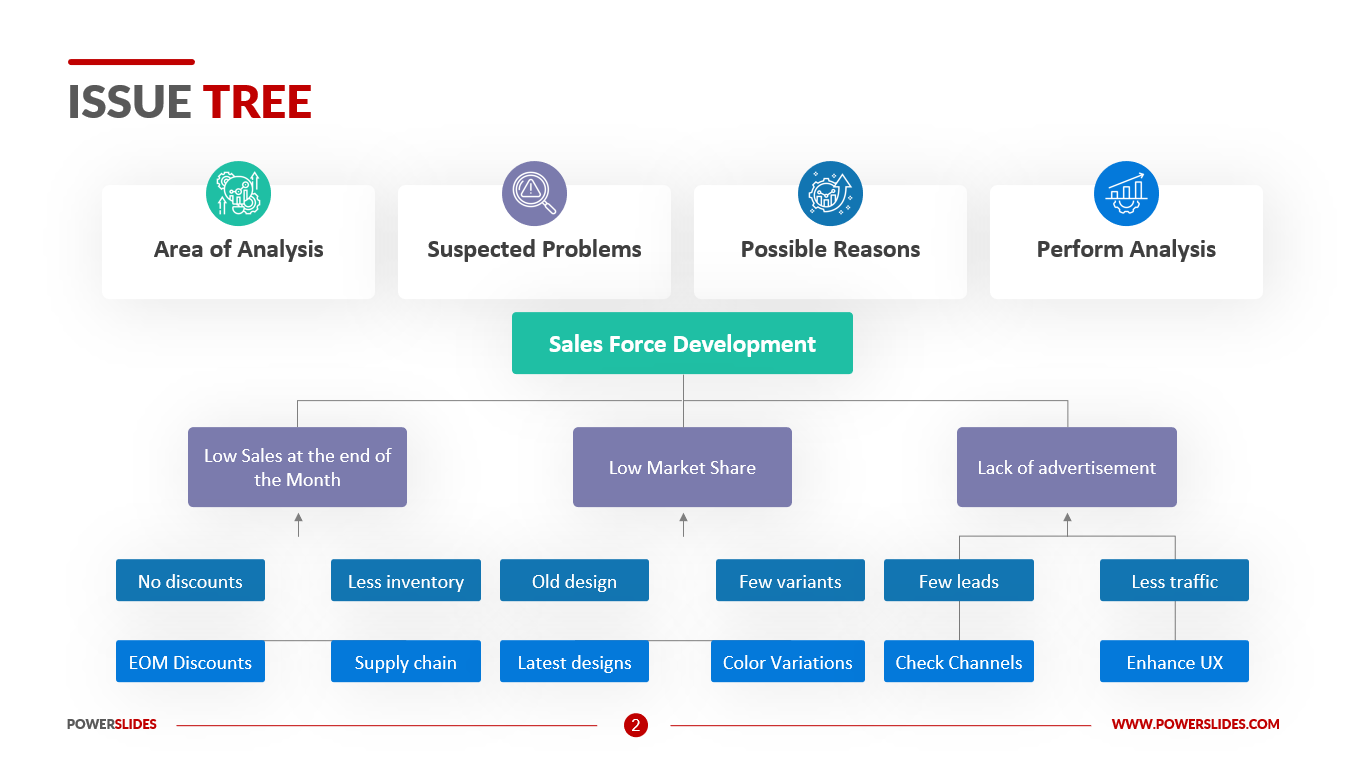
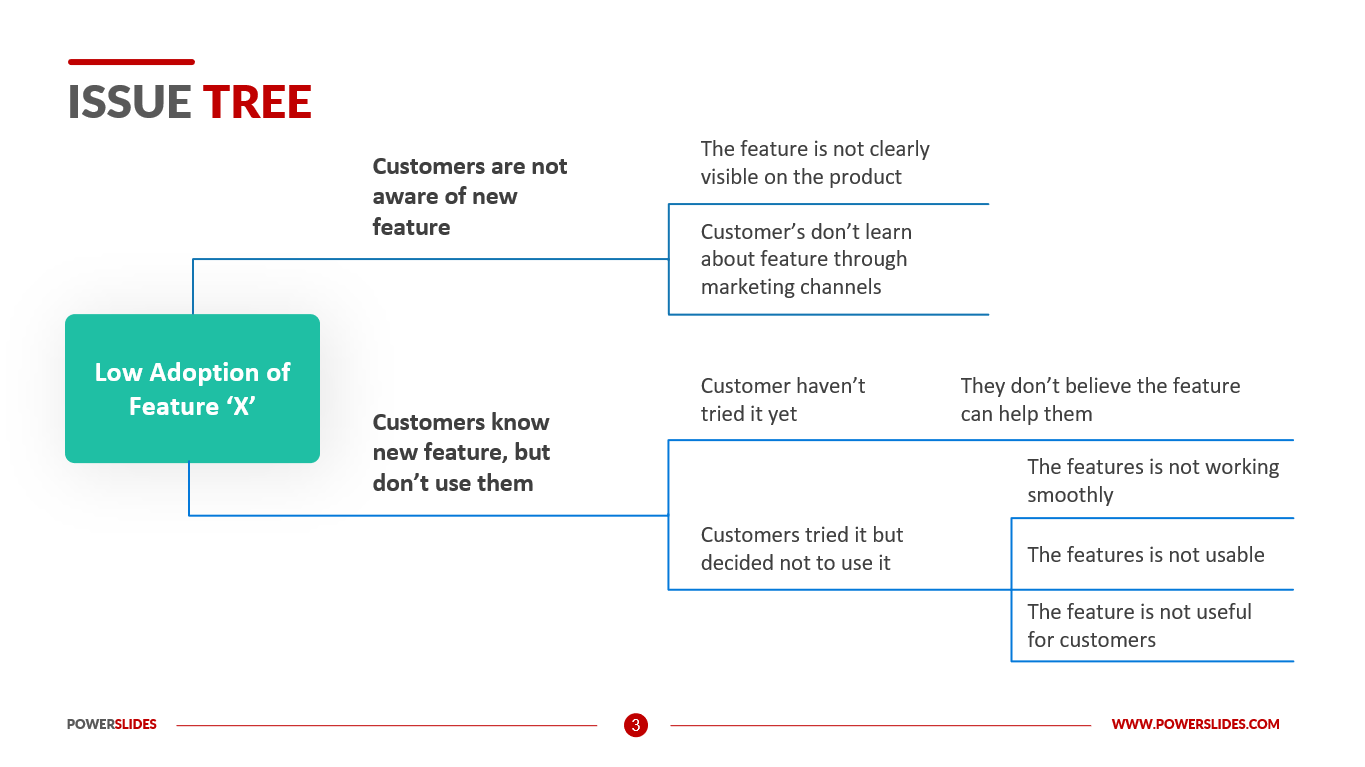
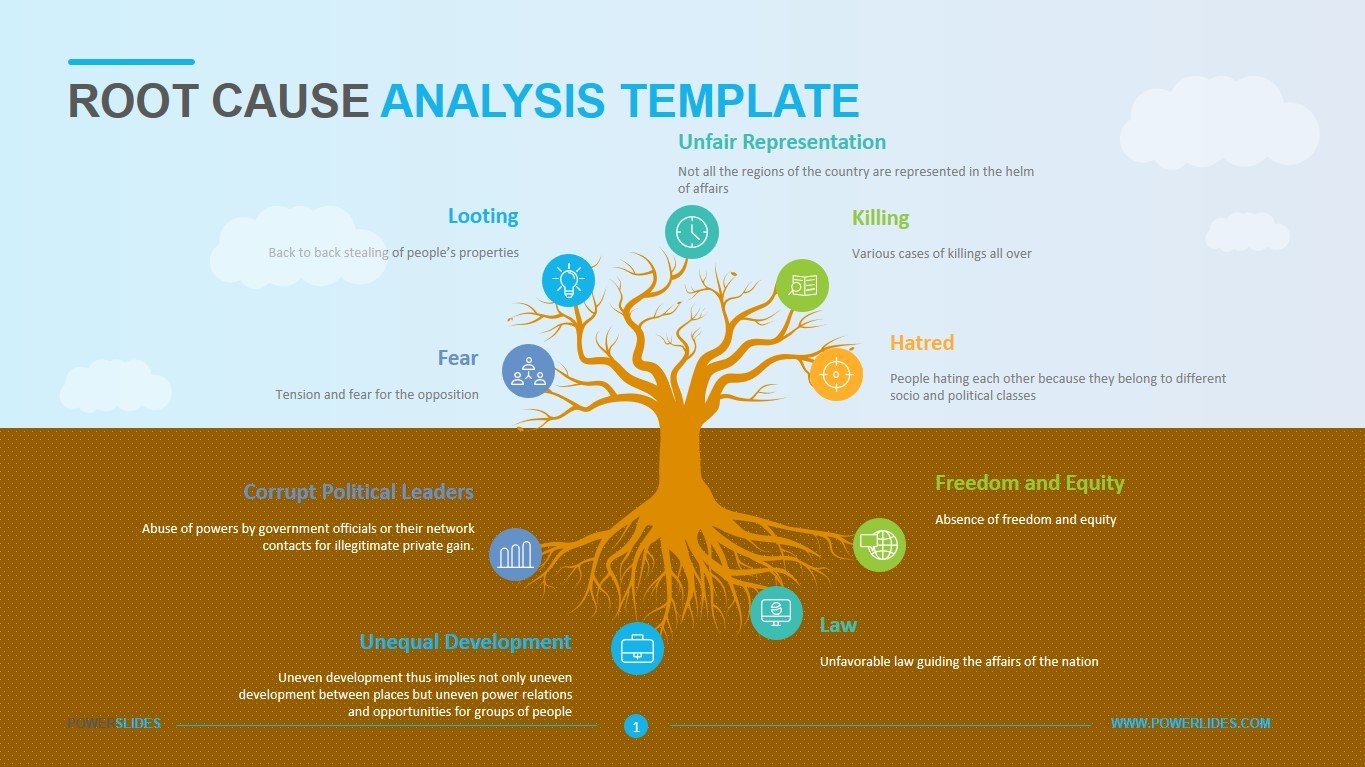
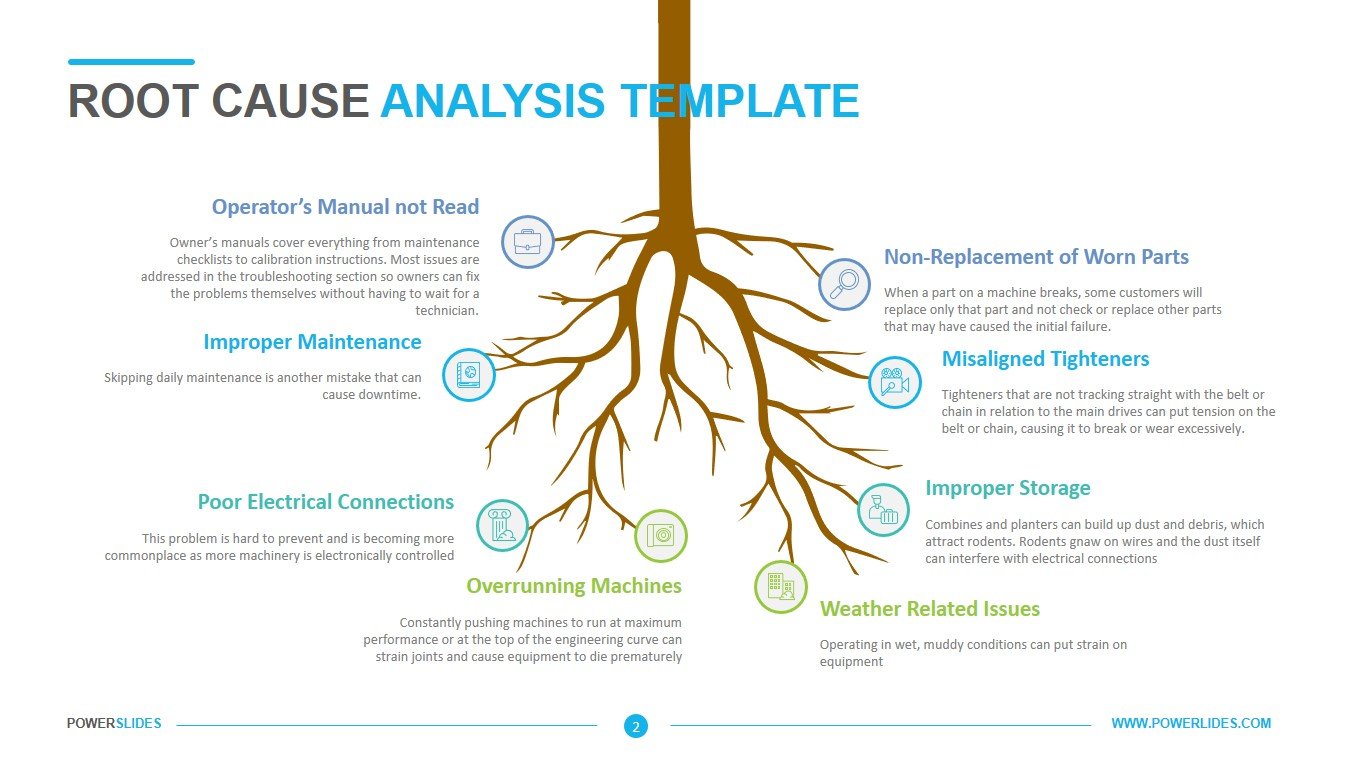
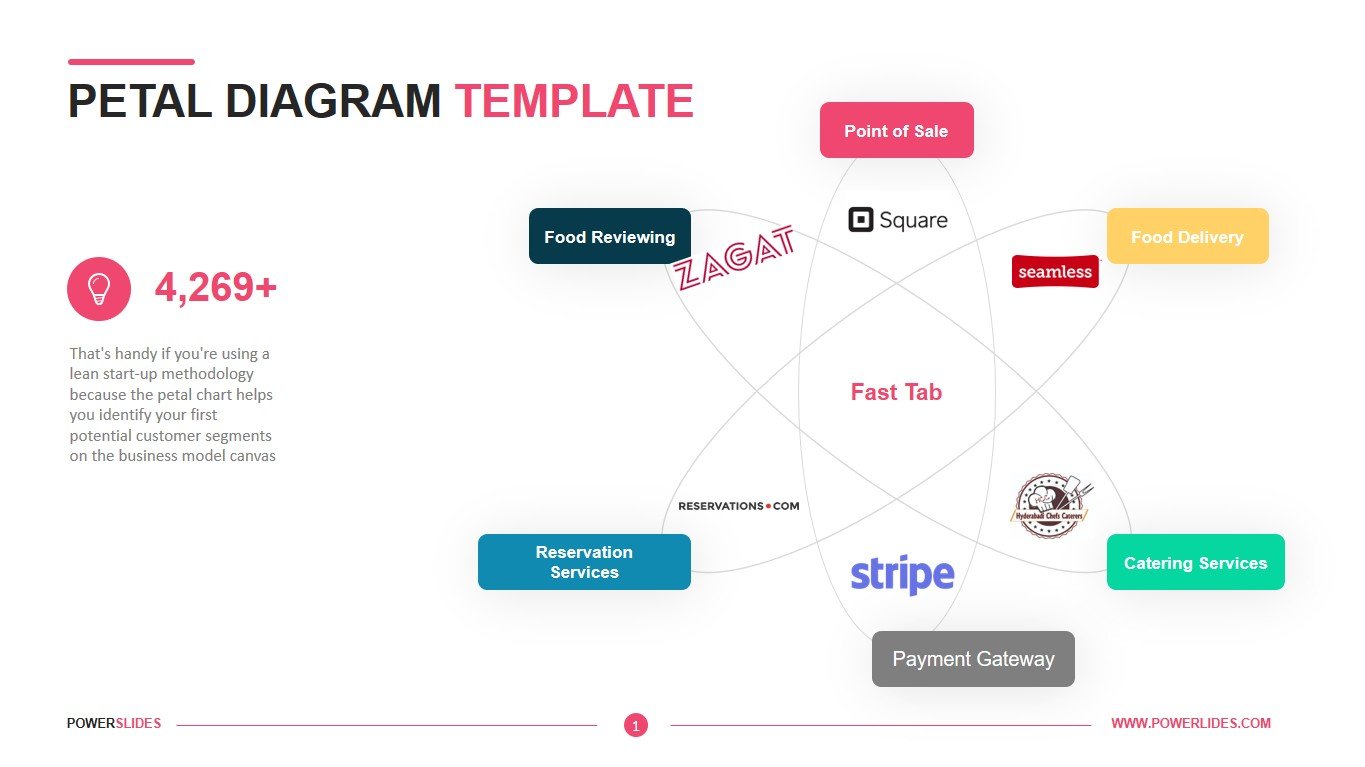
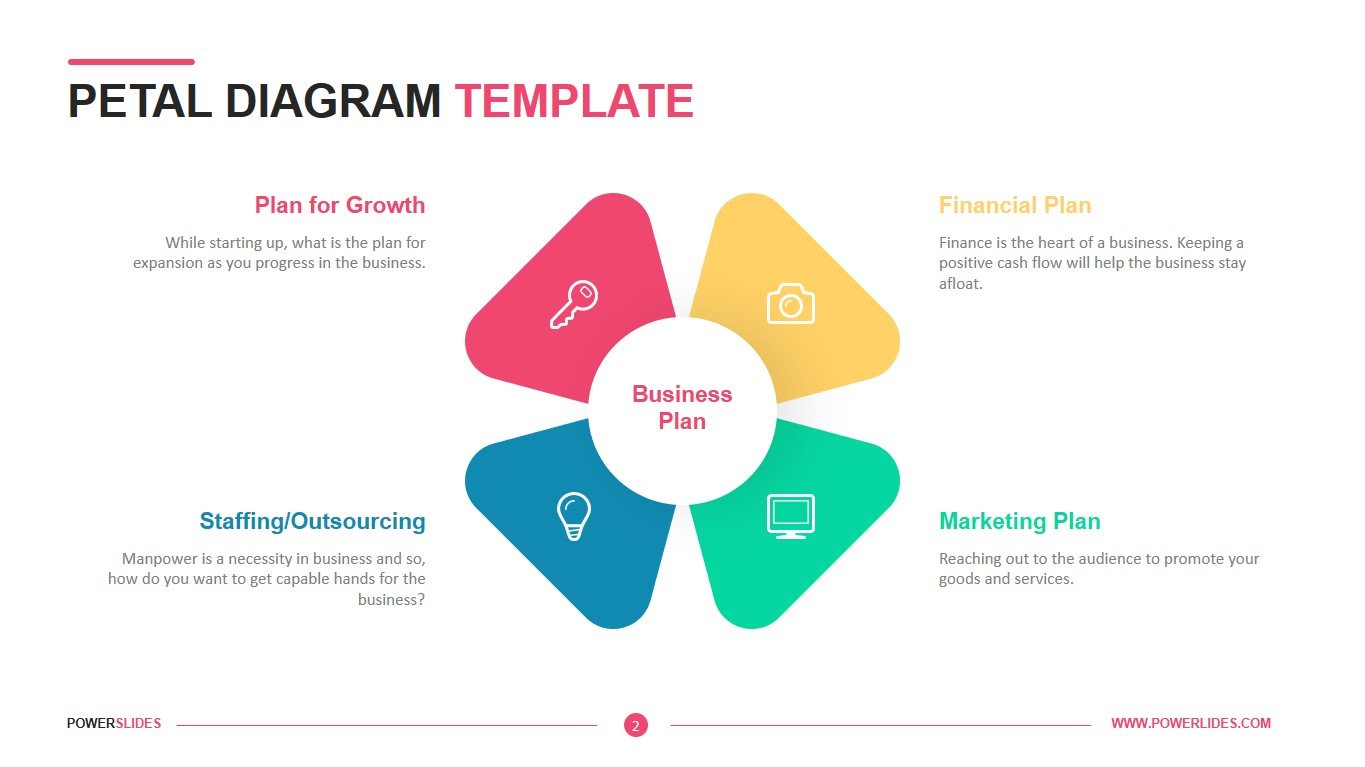
The Petal Diagram template contains all the tools you need to create a professional presentation. The first slide contains categories such as Point of Sale, Food Delivery, Catering Services, Payment Gateway, Reservation Services, Food Reviewing. You can specify your potential clients for potential investors. The slide can be used by sales managers when preparing a strategy for the development of sales in the region. The second slide contains several blocks with different plans – development plan, financial plan, marketing plan, labor supply plan. This slide can be used by entrepreneurs when preparing a business plan for a loan. For example, you can specify in the financial plan the required investment amount and the period for the return of funds. In marketing terms, product promotion channels and categories of potential consumers of the product. Also, this slide can be used when analyzing the company’s development strategy within individual departments. The next slide will be useful for marketers and advertising specialists. You can use this slide when preparing a new product promotion analysis. You can also use the slide when preparing a marketing strategy to increase market share. The last slide can be used by crisis managers when preparing a strategy for overcoming the crisis. You can also use this slide when preparing a course on marketing and bringing a product to market.
The Petal Diagram template will be useful for specialists in the planning and development department of new business projects, product managers and startups. This template will organically complement your presentation collection. All elements are easy to customize. The unusual chart design immediately grabs the audience’s attention. You can also use this template when updating your old financial and investment presentations. Heads of companies and departments of companies need to have this template in their collection.


