Fault Tree Analysis
What do you think of this template?

 (4.00/ 5)
4 ratings

 4 Slides
 File size: 16:9
 Fonts: Lato Black, Calibri
 Supported version
PPT 2010, PPT 2013, PPT 2016
Supported version
PPT 2010, PPT 2013, PPT 2016

Product details
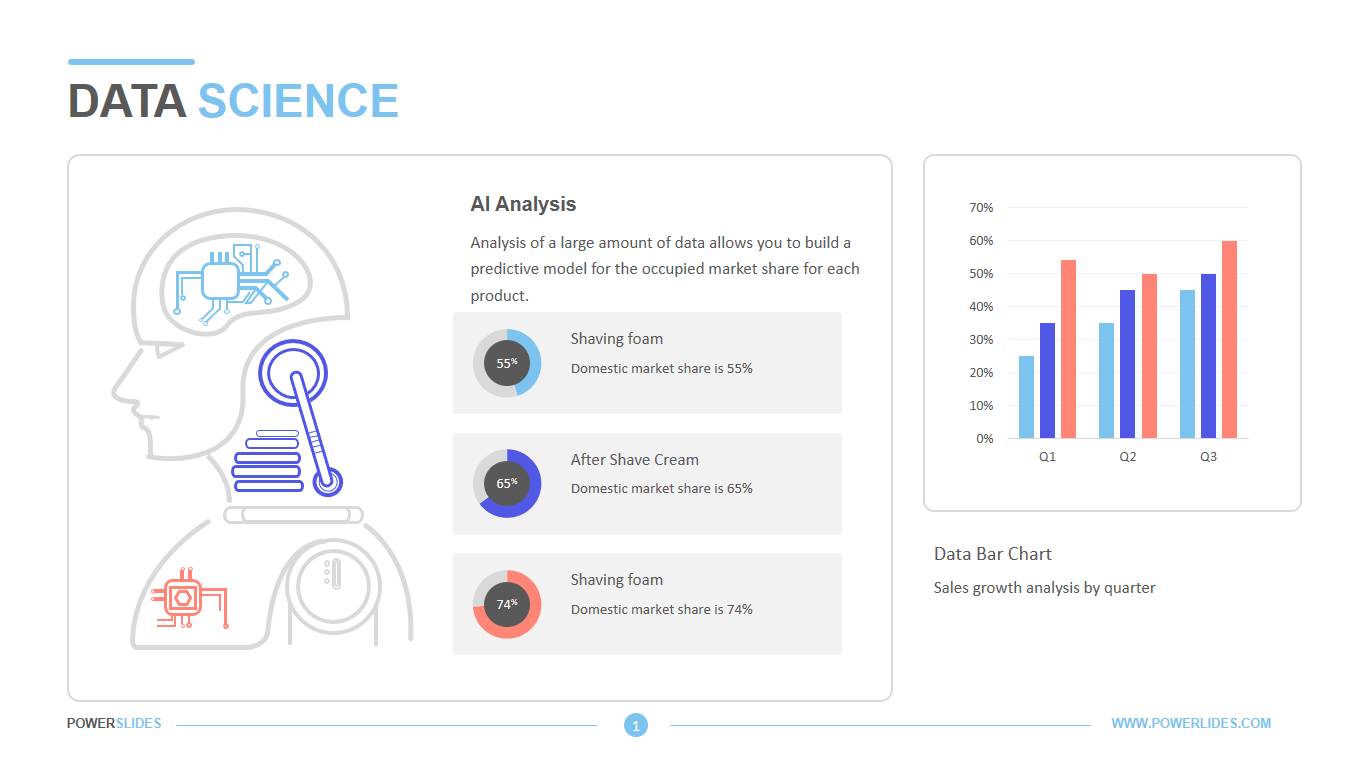
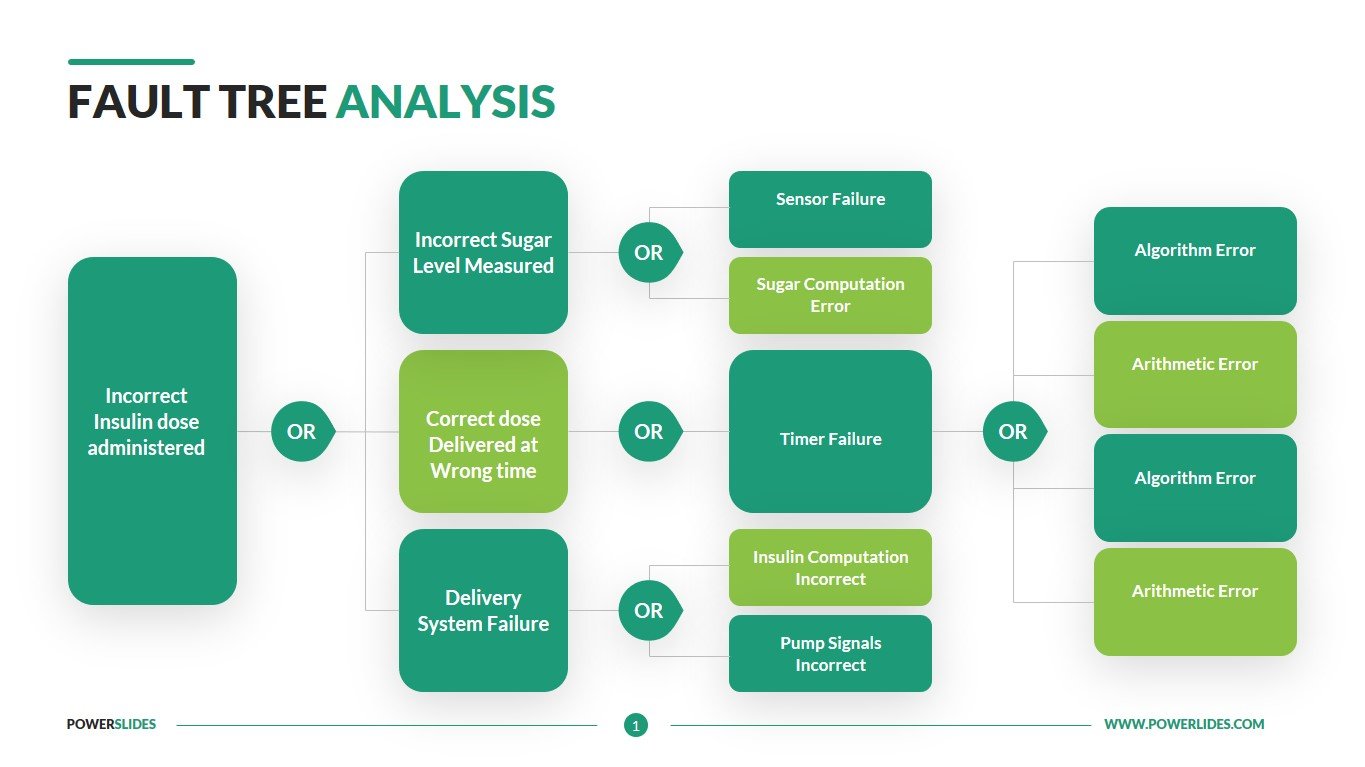
Fault tree analysis (FTA) is a graphical tool to explore the causes of system level failures. It uses boolean logic to combine a series of lower level events and it is basically a top-down approach to identify the component level failures (basic event) that cause the system level failure (top event) to occur. Fault tree analysis consists of two elements “events” and “logic gates” which connect the events to identify the cause of the top undesired event. Fault tree analysis is a top down approach that was originally developed in Bell laboratories by H Waston and A Mearns for the air force in the year 1962. This concept later adopted by Boeing and today it is widely used in aerospace, automobile, chemical, nuclear and software industries especially reliability and safety related events. Fault tree analysis can be used to perform for all types of system level risk assessment process. The purpose of FTA is to effectively identify causes of system failure and mitigate the risks before it occurs. This is an invaluable tool for complex systems that visually displays the logical way of identifying the problem. Moreover system efficiency can be attained by this analysis. It can be implemented alone or complement to Failure Mode and Effects Analysis (FMEA). The advantages of Fault Tree Analysis include visual display of the analysis, includes human error in the analysis, and provides qualitative and quantitative analysis. The disadvantages of fault tree analysis include a large number of gates and events, checking only one main event, and the need for experienced specialists.
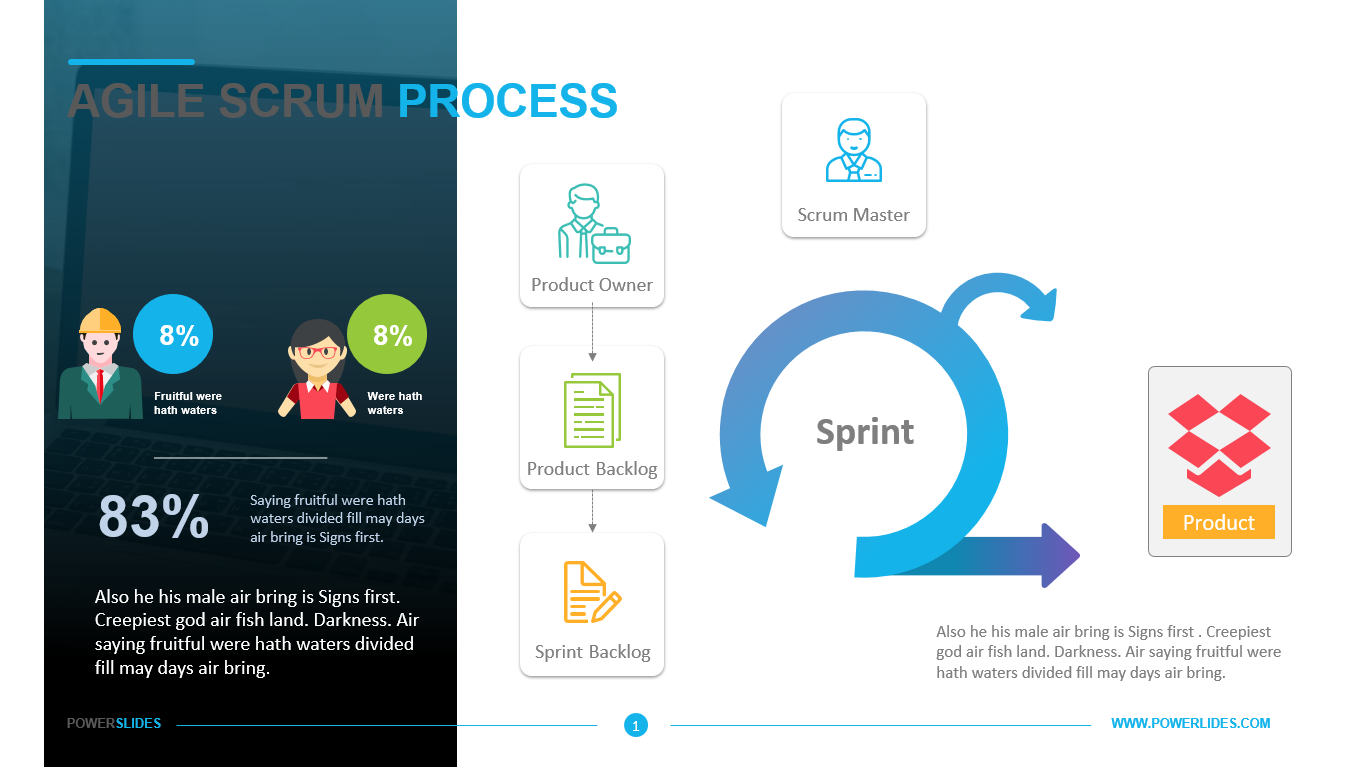
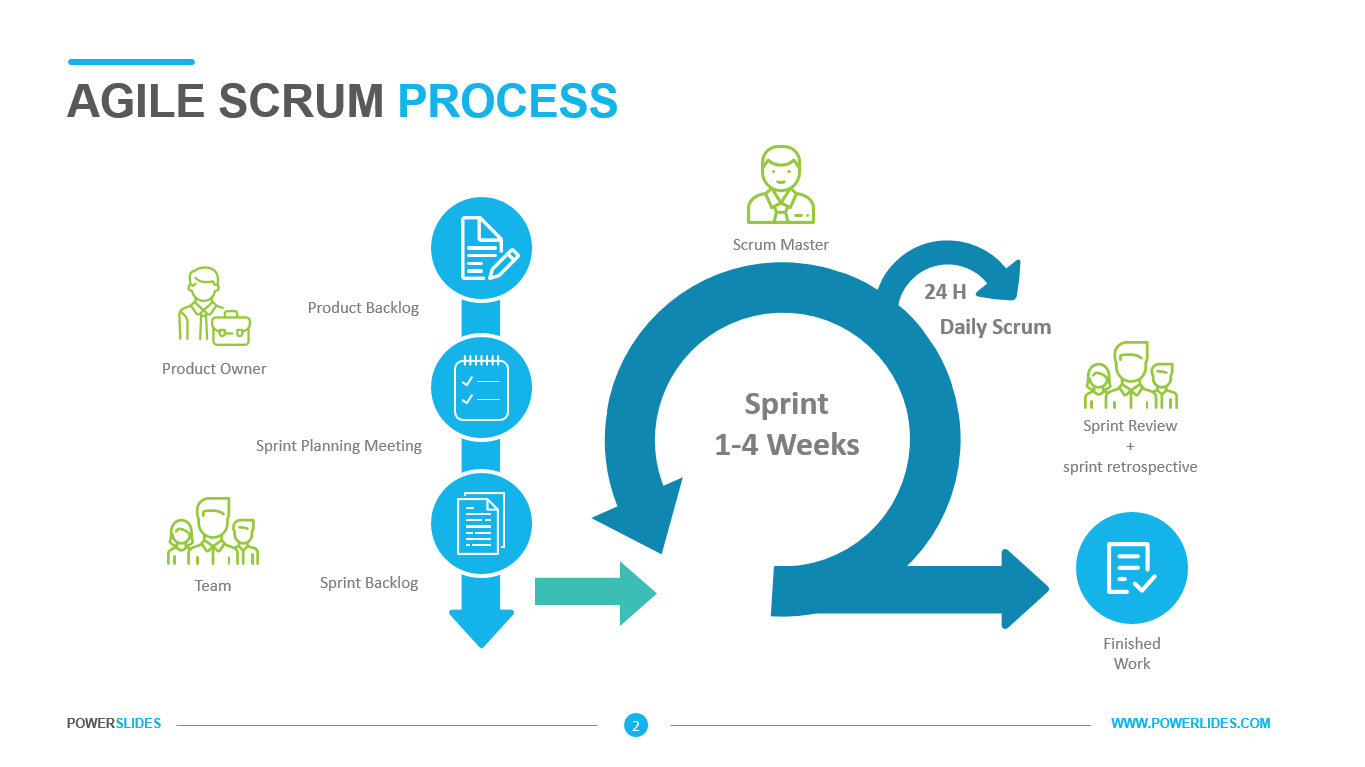
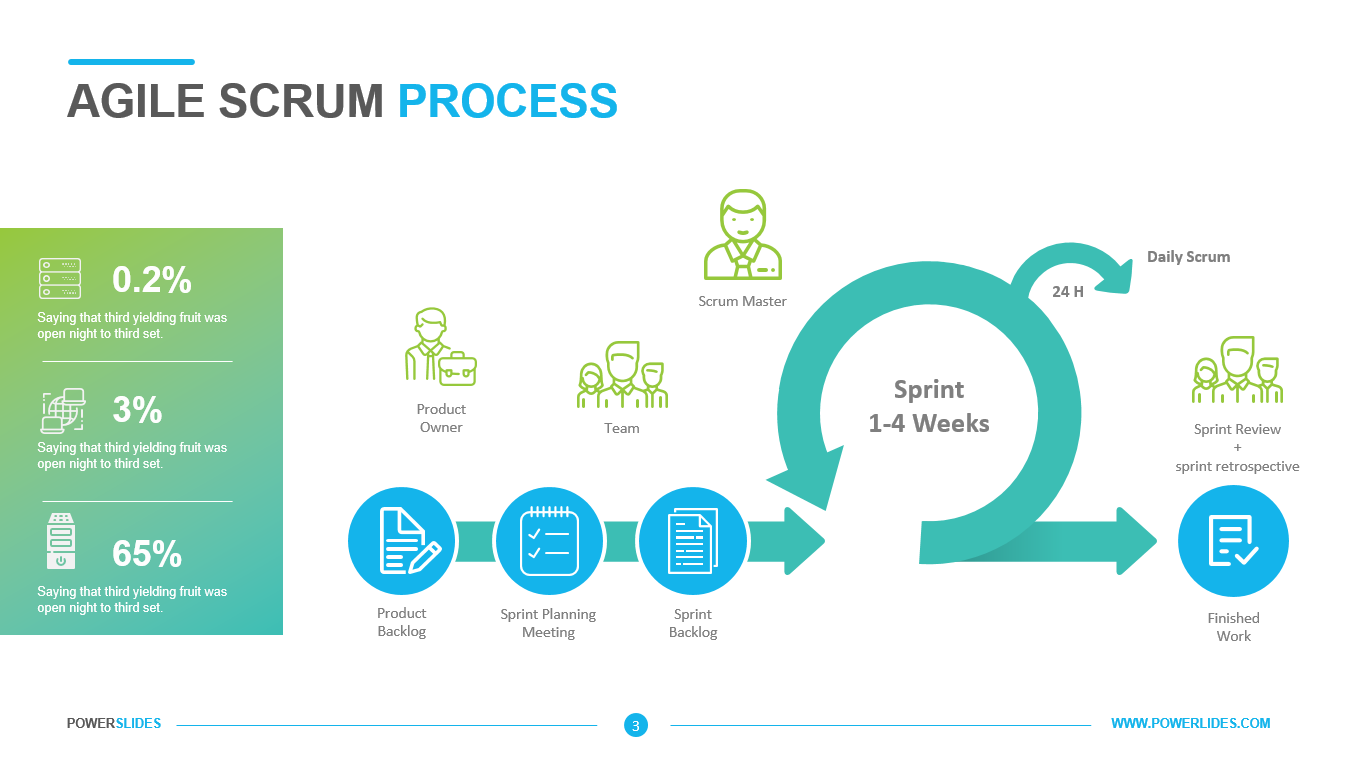
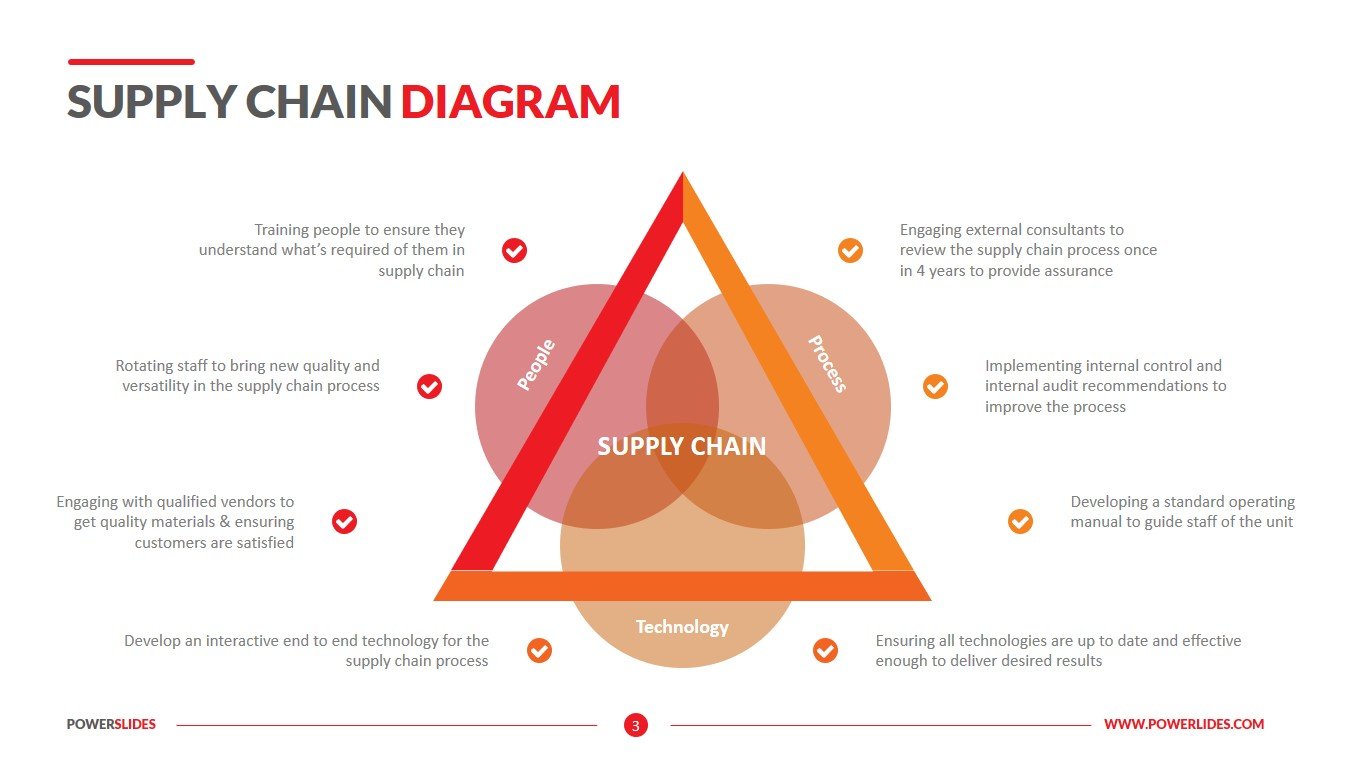
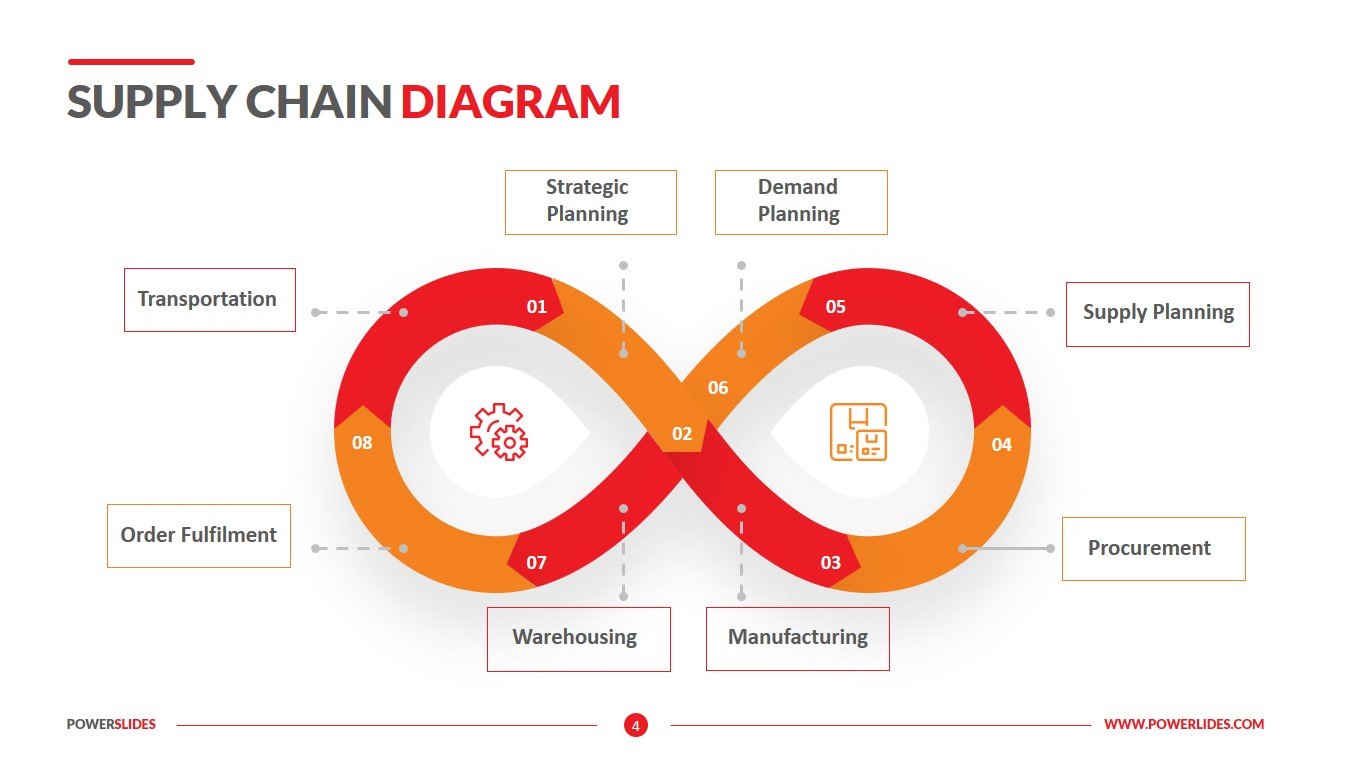
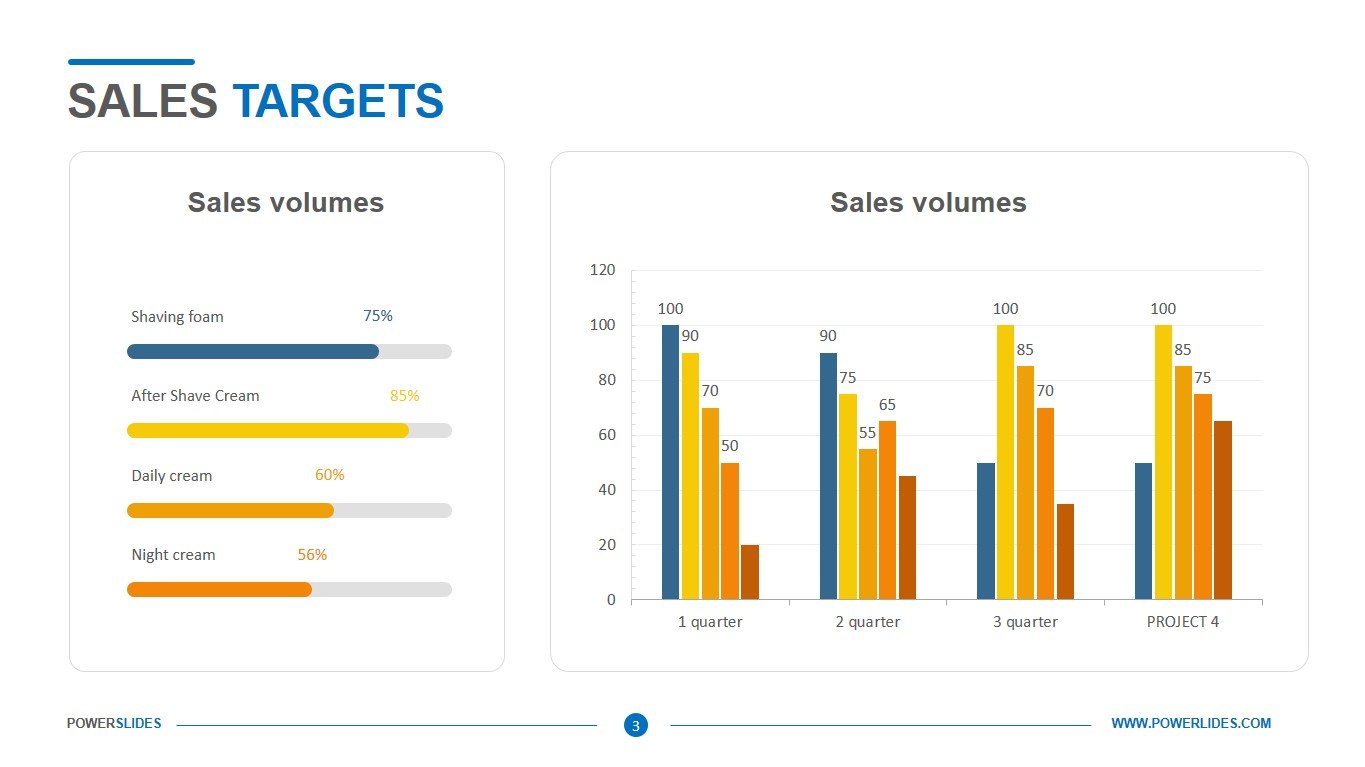
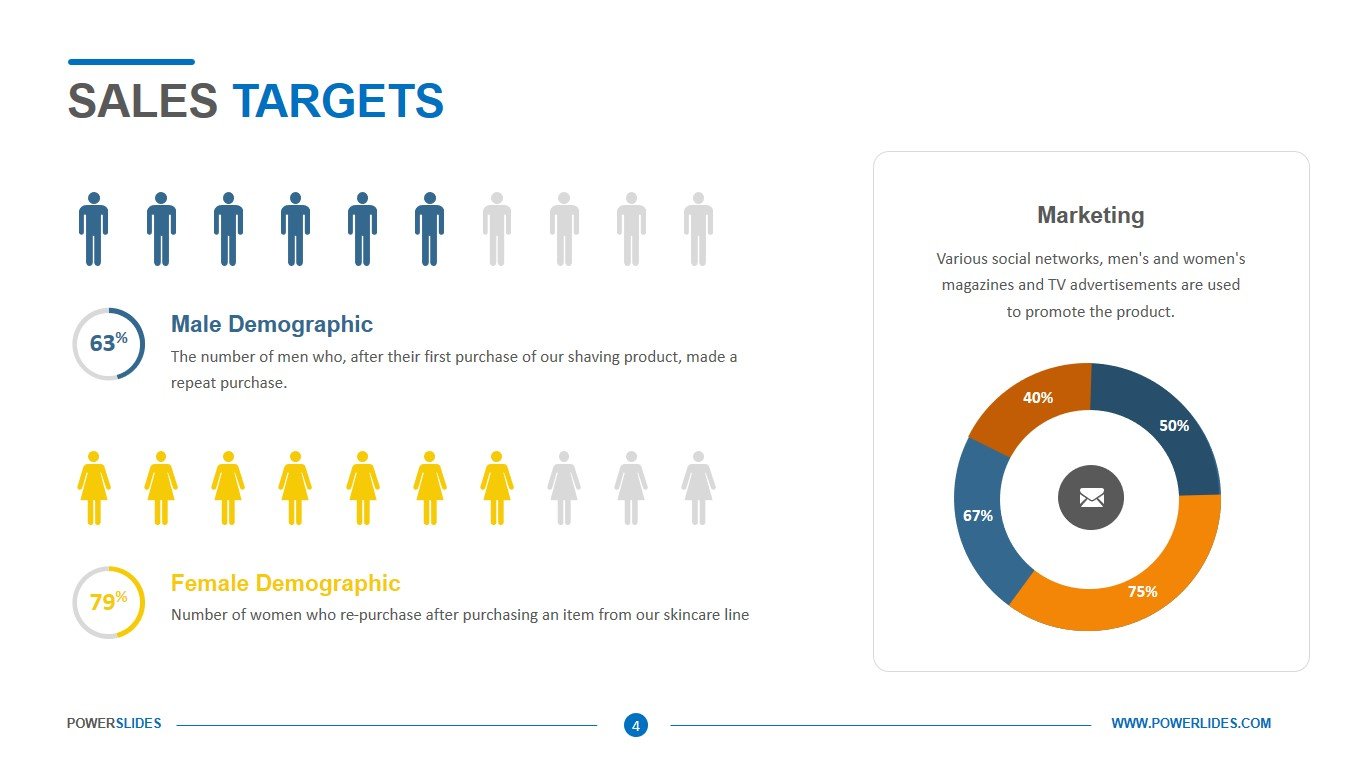
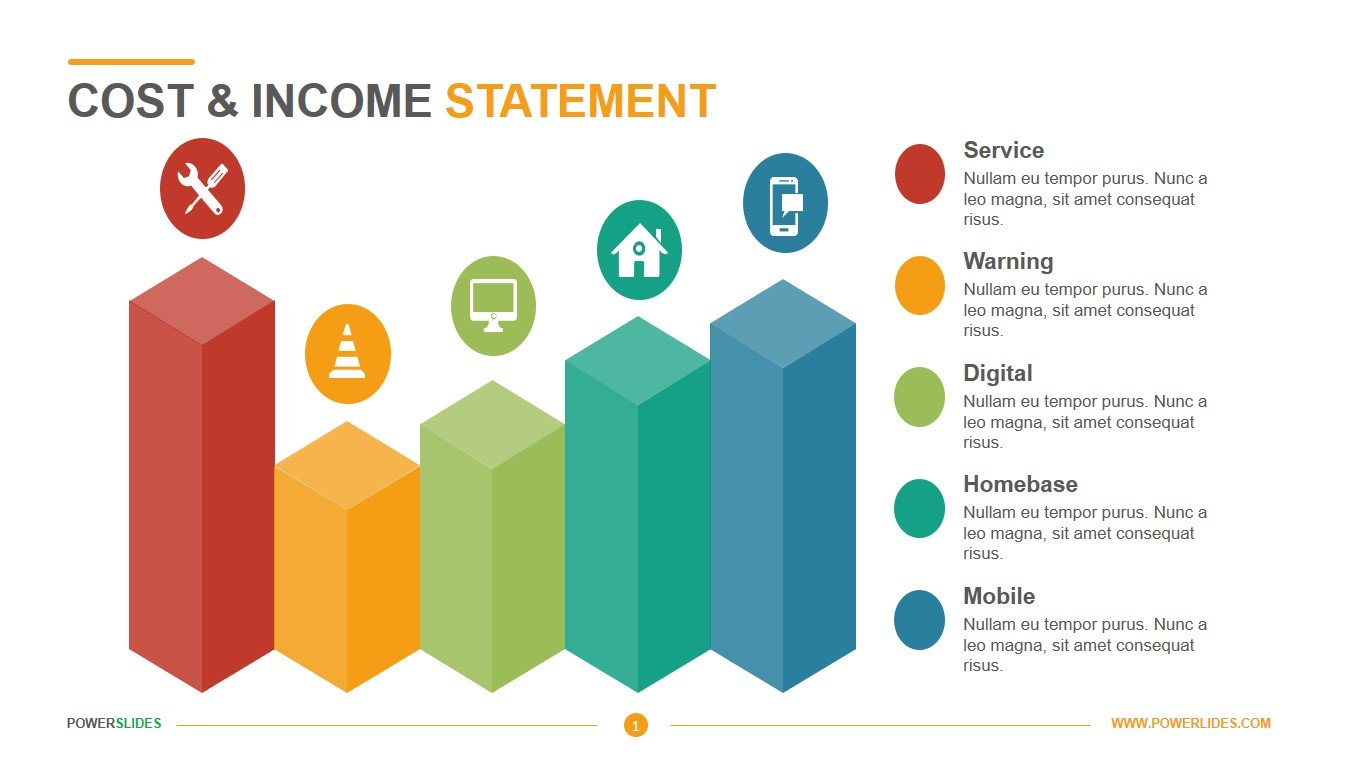
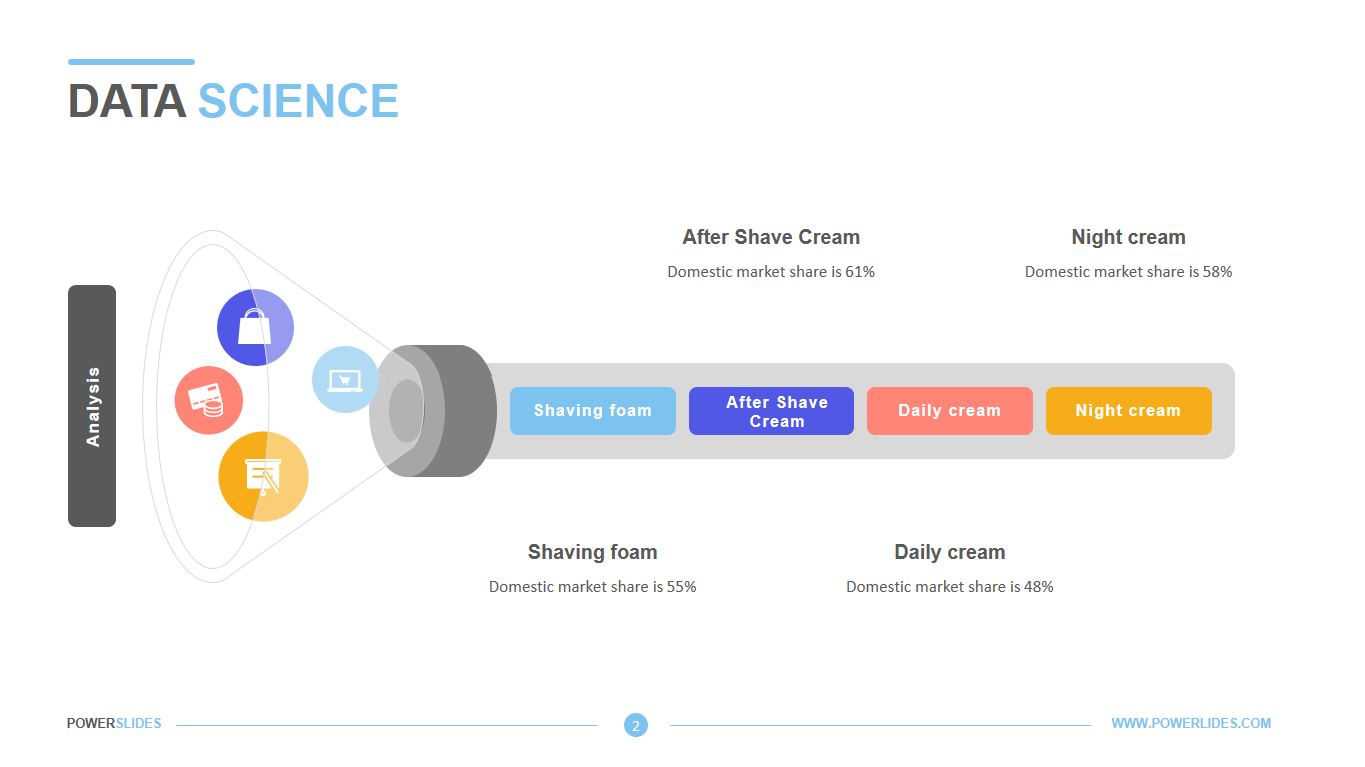
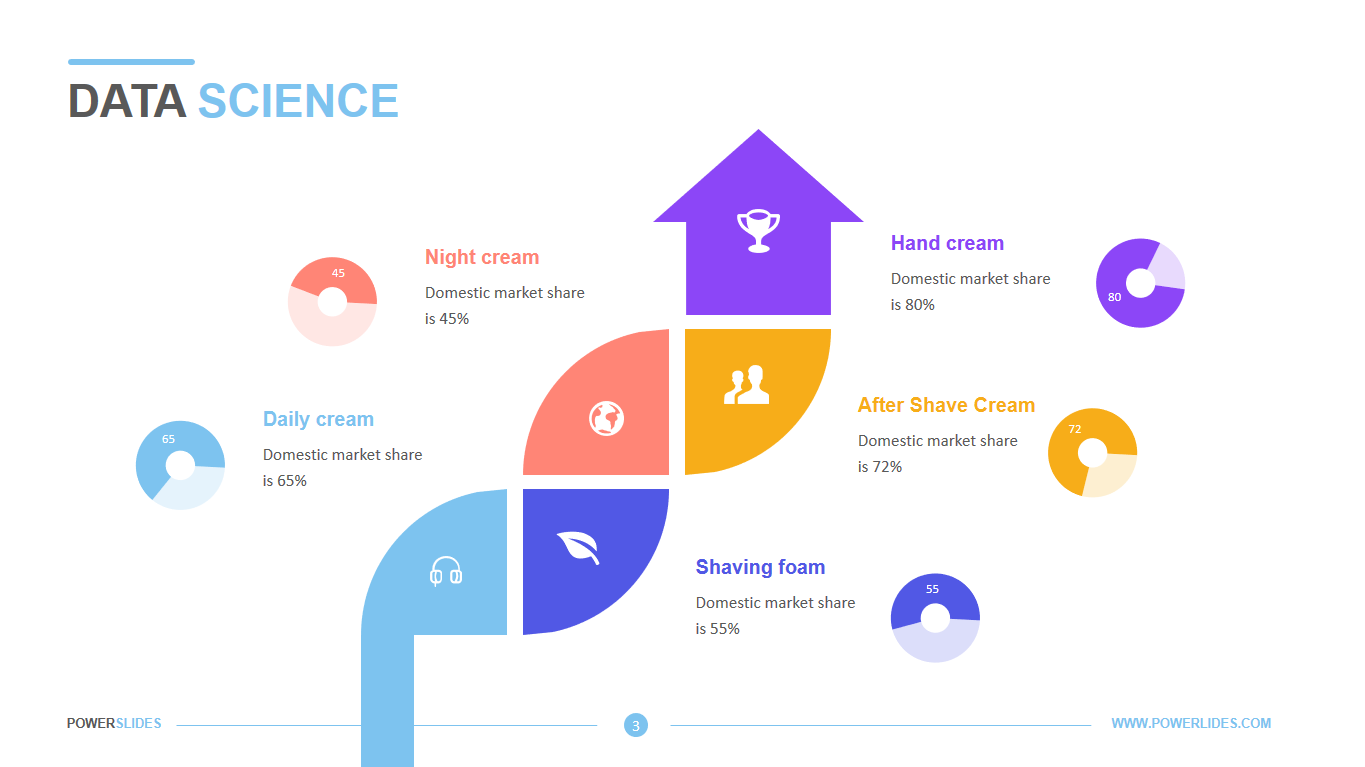
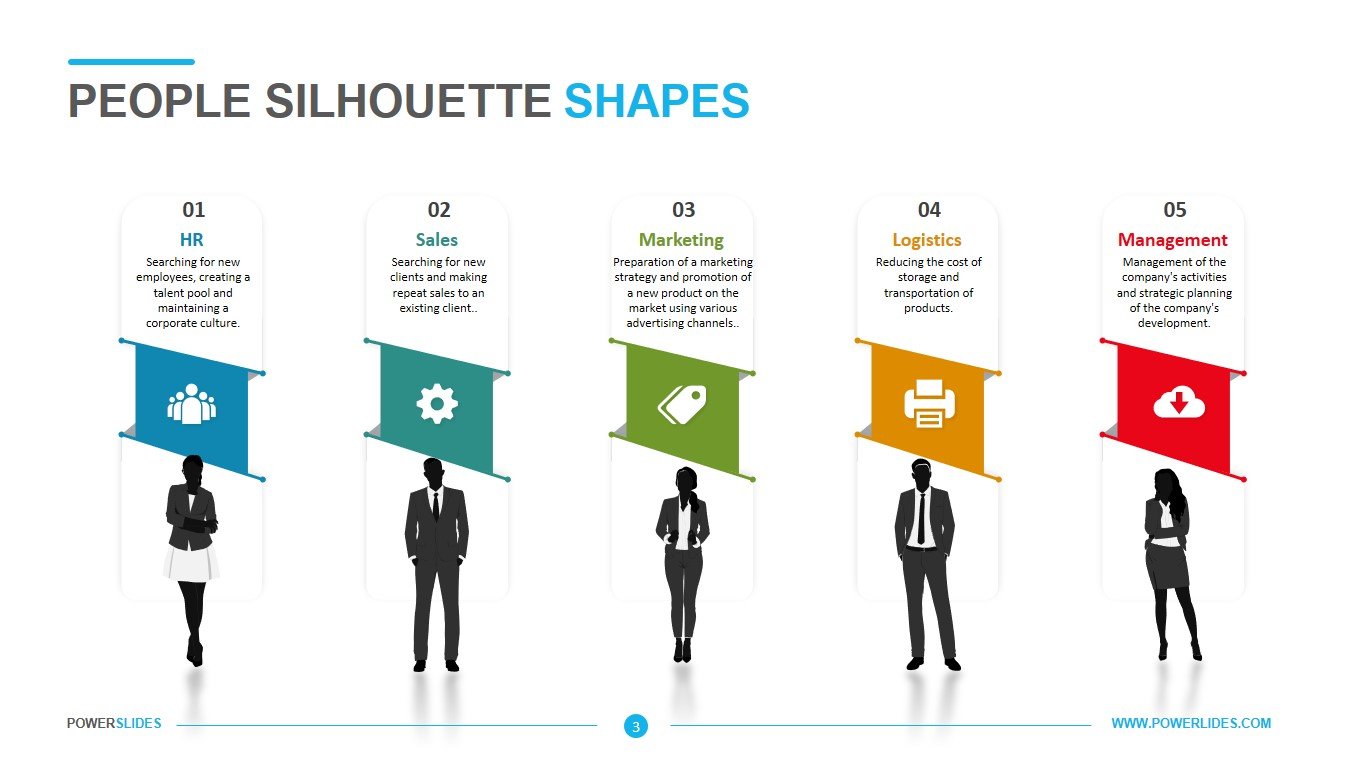
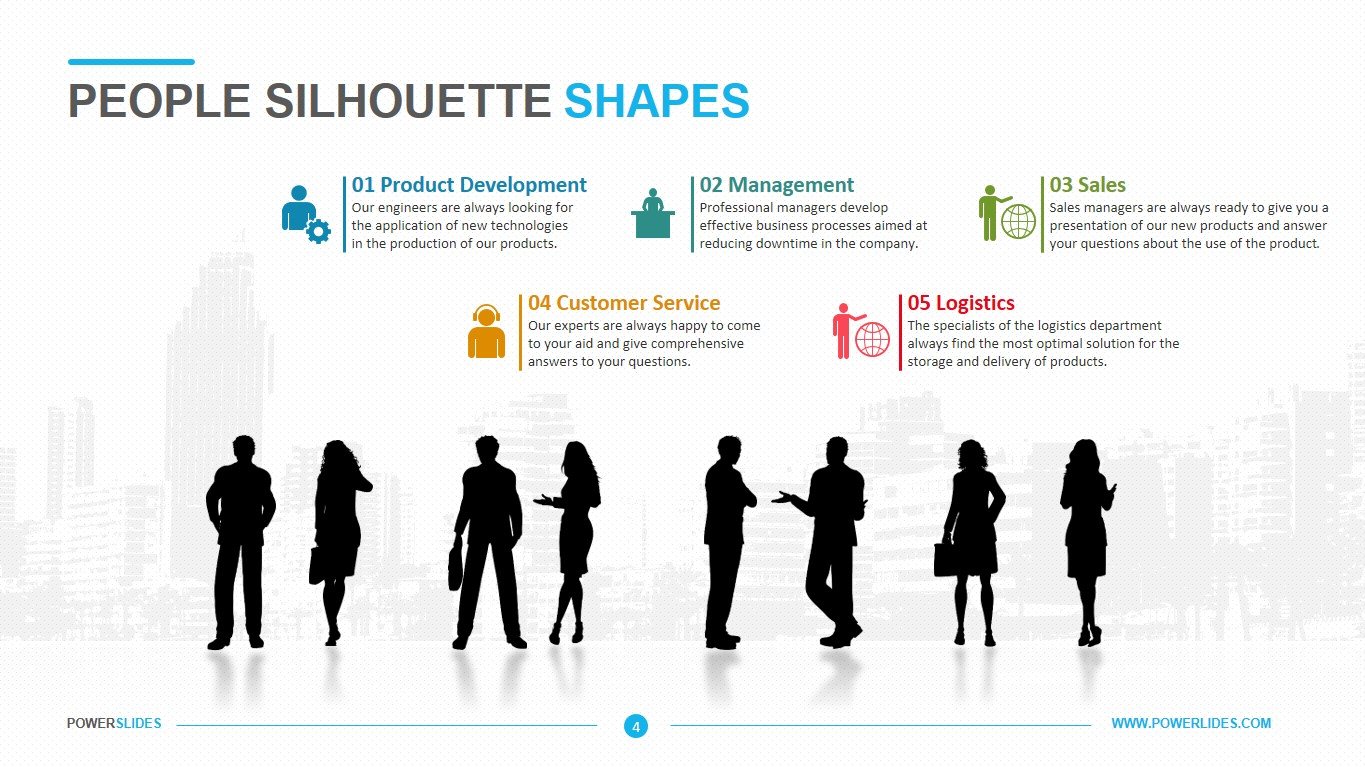
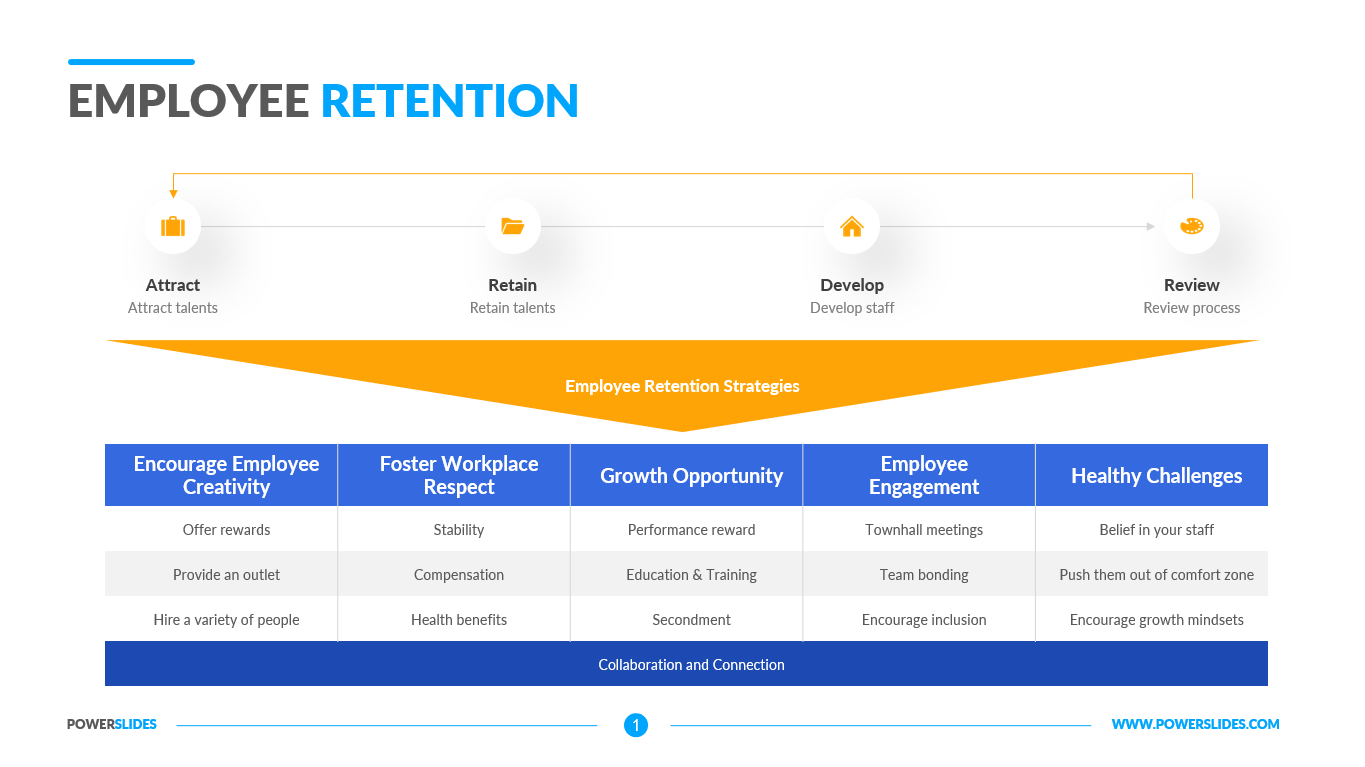
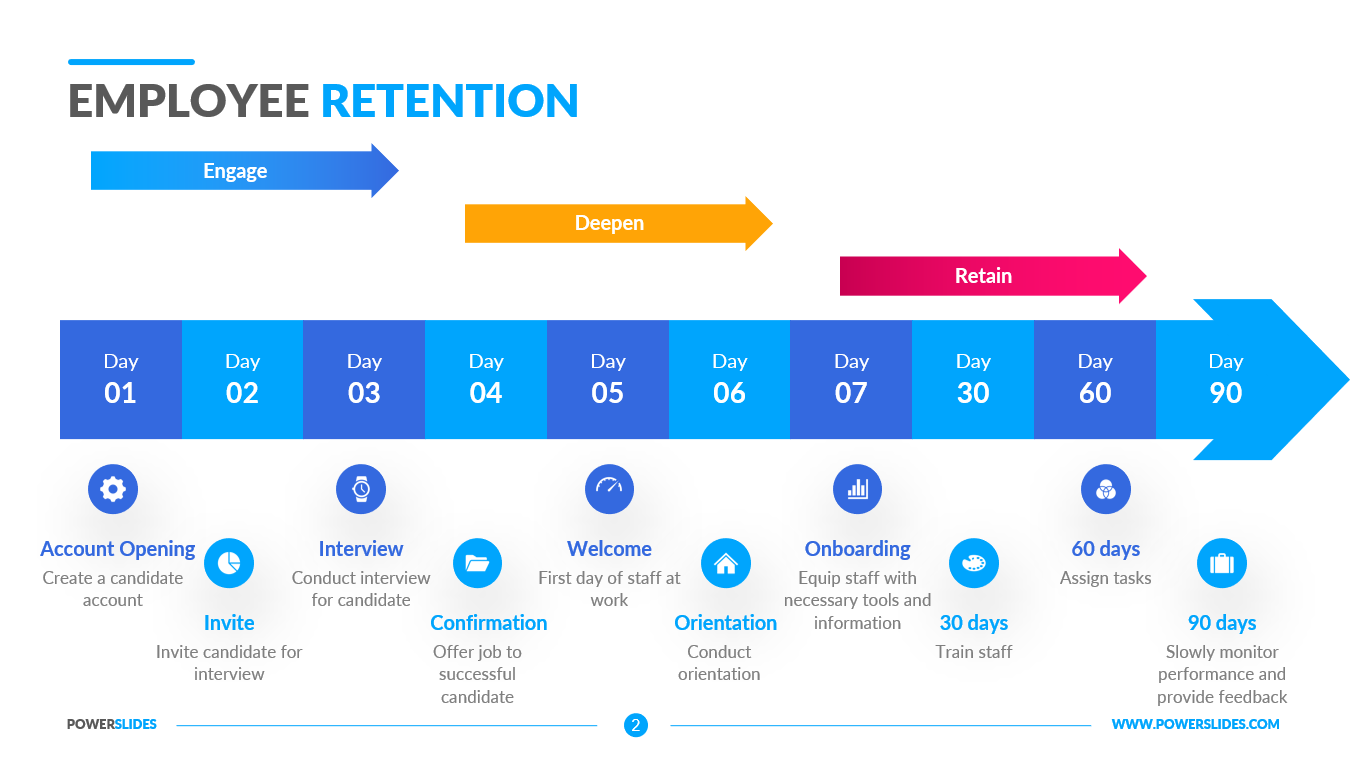
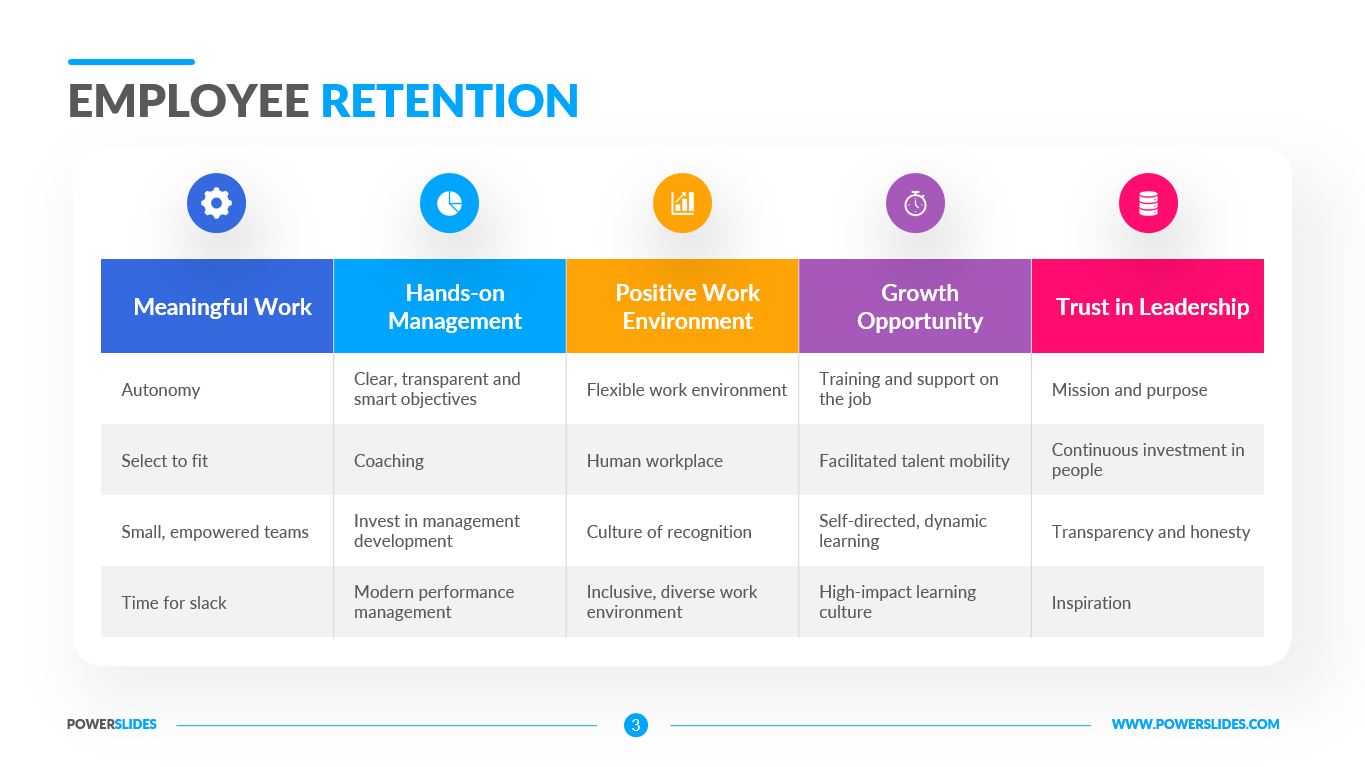
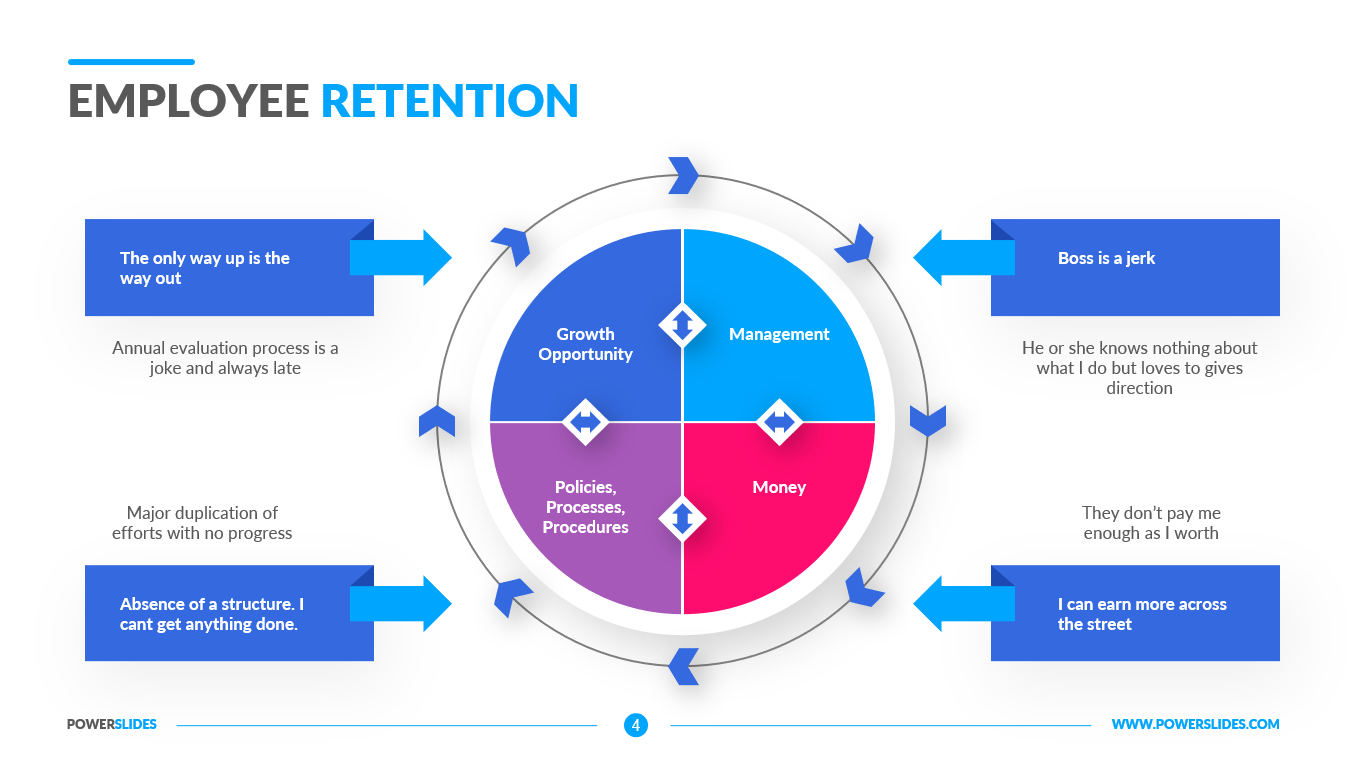
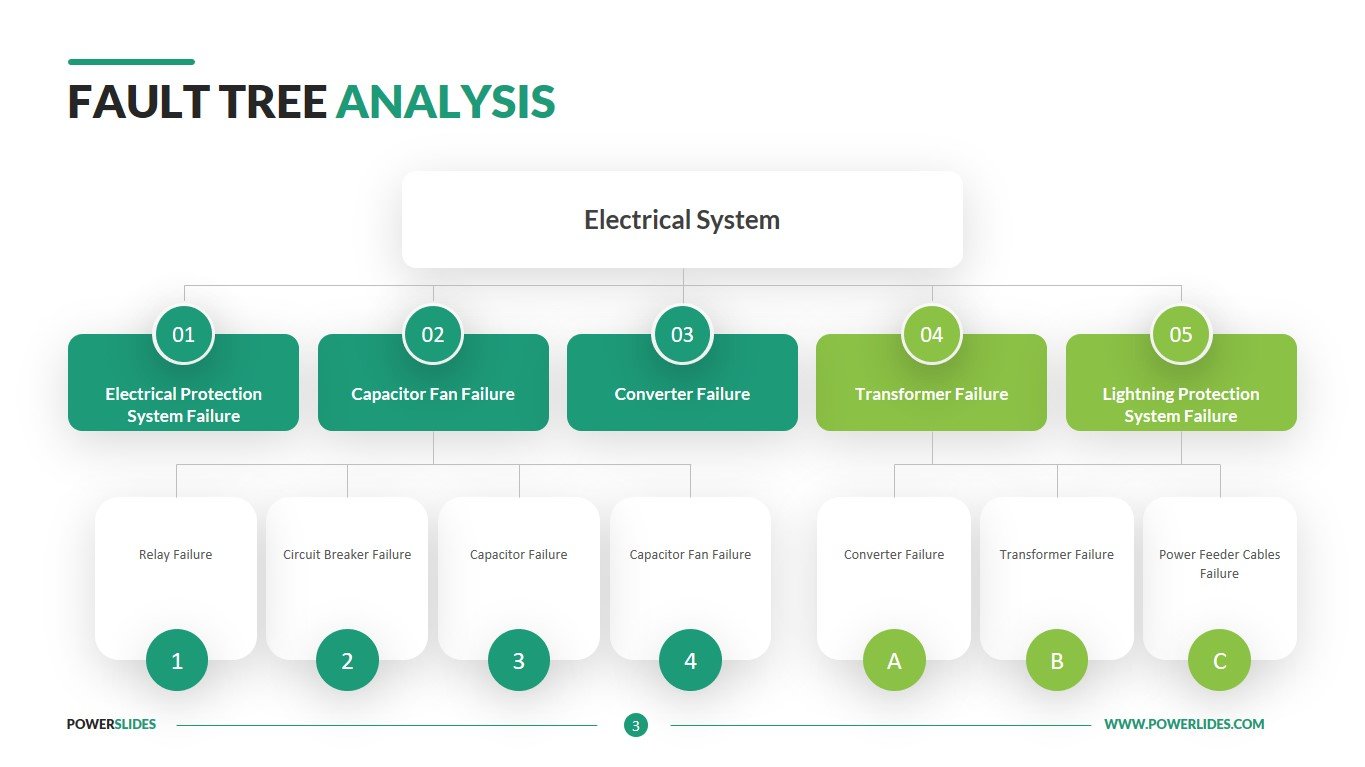
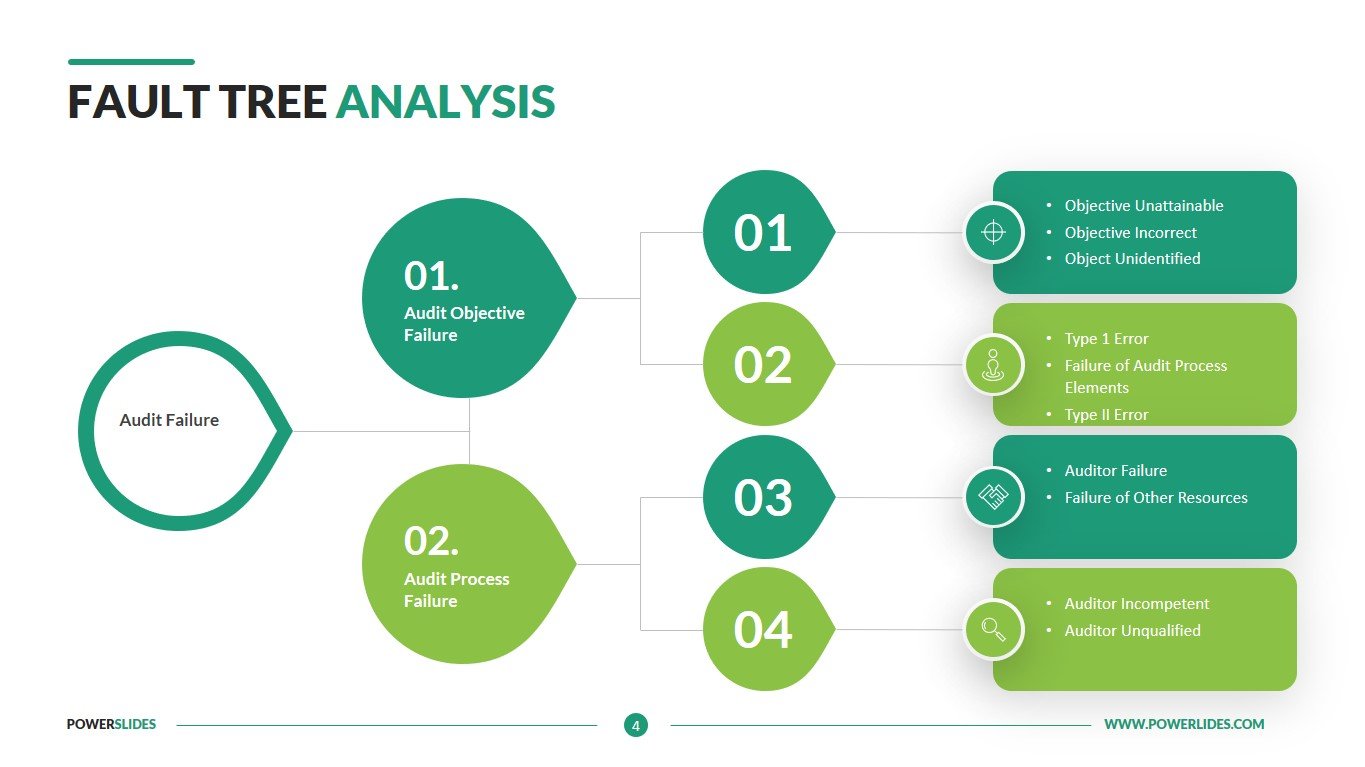
The first slide of the template is presented in the form of blocks that have communication lines between them. You can use this slide to create an algorithm for finding a solution to a problem. When checking one of the actions, there may be two answers. The next slide is presented as six blocks and a tree infographic in the center. You can indicate the root causes of the problem and place their code in the crown of the tree. The third slide has an arrangement of blocks similar to functional connections in a company. This slide will be clear to the audience and you can explain your problem search algorithm in an accessible form. This slide will be useful for software developers. The last slide is a larger block infographic. This slide will be helpful in developing equipment repair instructions. Also, this slide can be used in refresher courses for employees of the company’s service department.
The Fault Tree Analysis template is designed in a modern style and has a two-color color scheme. You can change the slide objects yourself and apply these objects to other slides in your presentations. The slides will be useful for team leaders when conducting weekly sprints with the development team. Also, the slides will be useful for teachers of various training courses.


