Survey Results
What do you think of this template?
 (5.00/ 5)
15 ratings

 4 Slides
 File size: 16:9
 Fonts: Lato Black, Calibri
  Supported version
PPT 2010, PPT 2013, PPT 2016
Supported version
PPT 2010, PPT 2013, PPT 2016

Product details
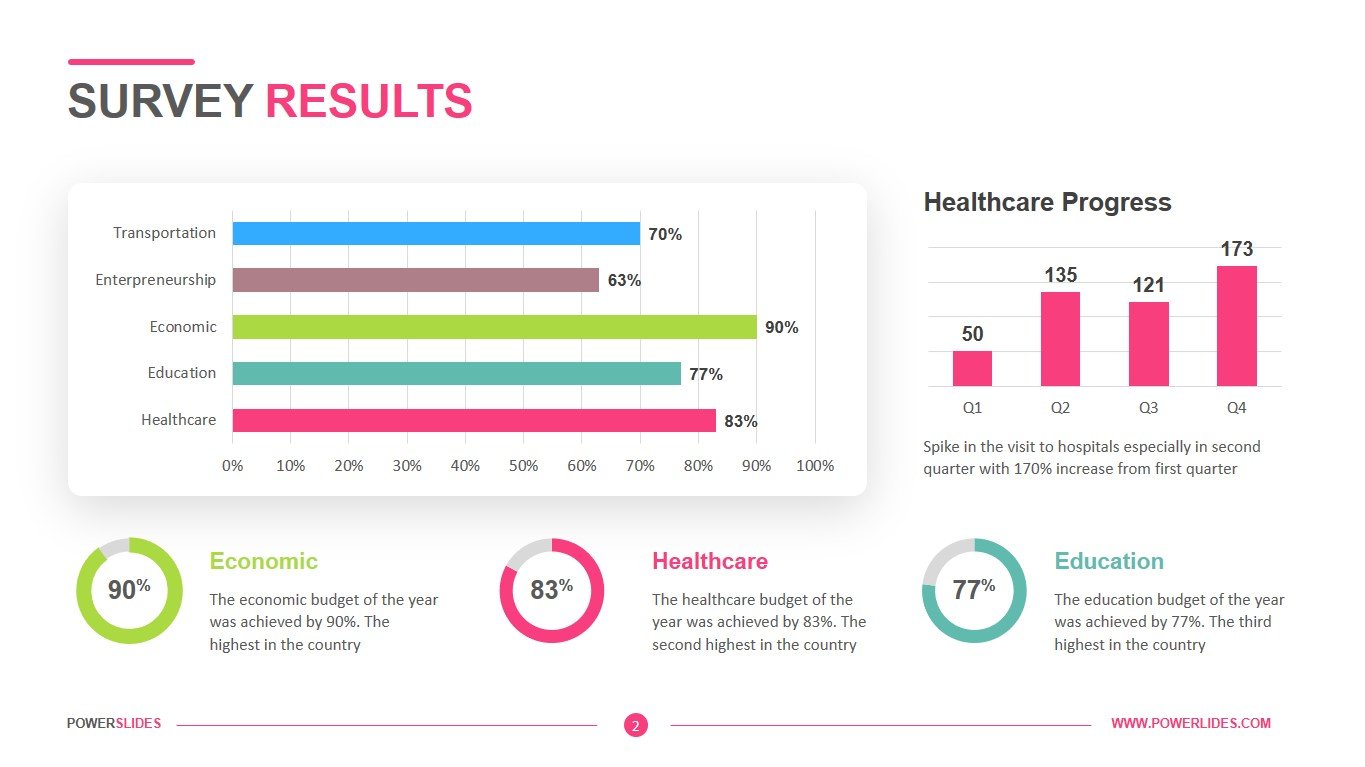
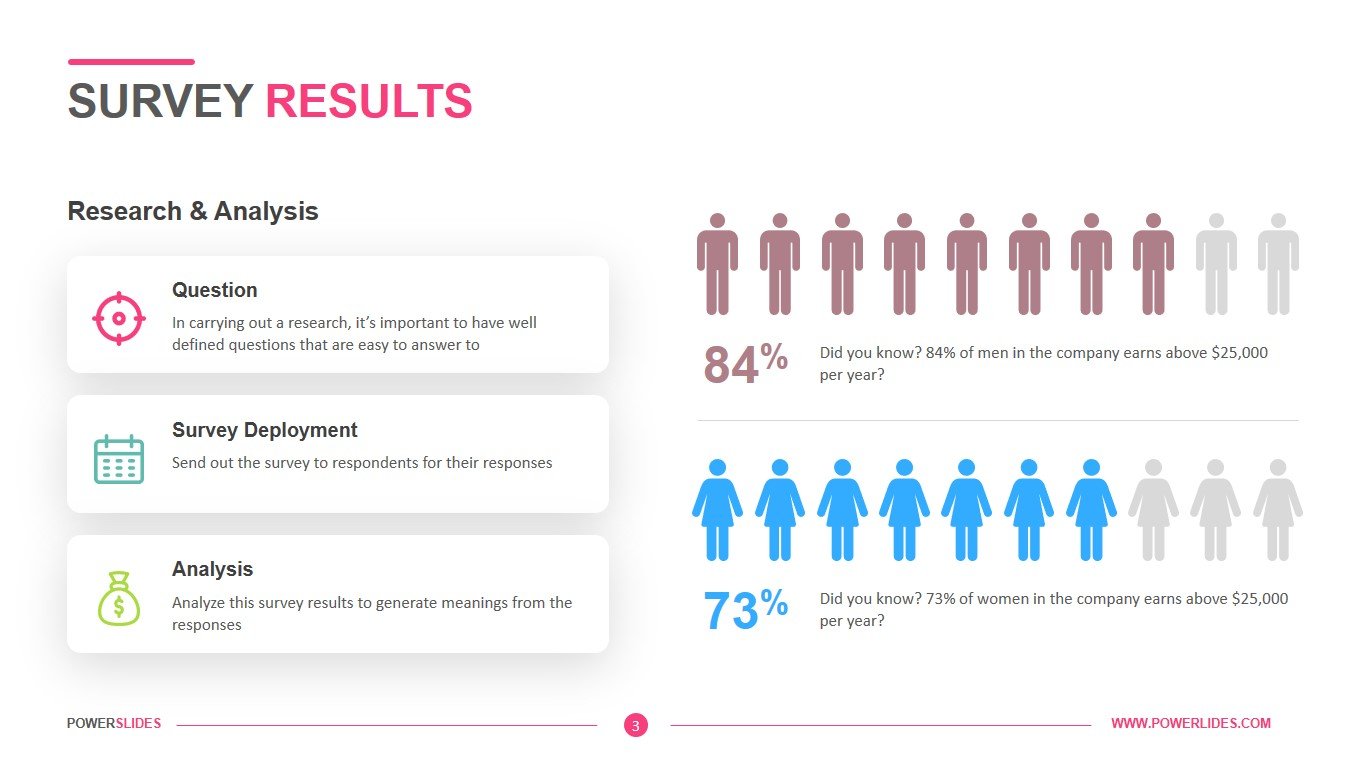
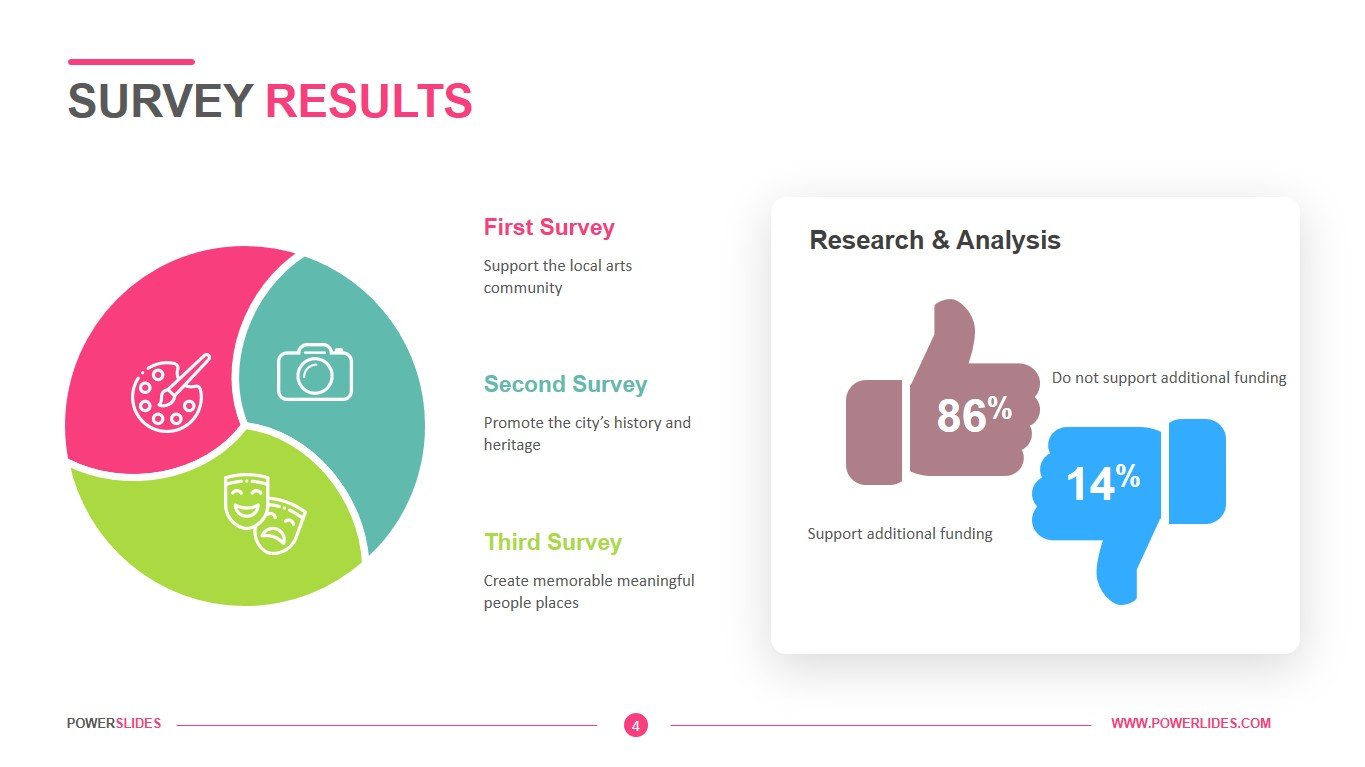
After creating and conducting your survey, you must now process and analyze the results. These require strict attention to detail and, in some cases, knowledge of statistics and computer software packages. How you conduct these steps will depend on the scope of your study, your own capabilities, and the audience to whom you wish to direct the work. Before actually beginning the survey, the researcher should know how they want to analyze the data. If you are collecting quantifiable data, a codebook is needed for interpreting your data and should be established prior to collecting the survey data. This is important because there are many different formulas needed in order to properly analyze the survey research and obtain statistical significance. Since computer programs have made the process of analyzing data vastly easier than it was, it would be sensible to choose this route. Be sure to pick your program before you design your survey – some programs require the data to be laid out in different ways. After the survey is conducted and the data collected, the results must be assembled in some useable format that allows comparison within the survey group, between groups, or both. The results could be analyzed in a number of ways. A T-test may be used to determine if scores of two groups differ on a single variable – whether writing ability differs among students in two classrooms, for instance. A matched T-Test could also be applied to determine if scores of the same participants in a study differ under different conditions or over time. Secondary analysis of survey data is an accepted methodology which applies previously collected survey data to new research questions. This methodology is particularly useful to researchers who do not have the time or money to conduct an extensive survey, but may be looking at questions for which some large survey has already collected relevant data.
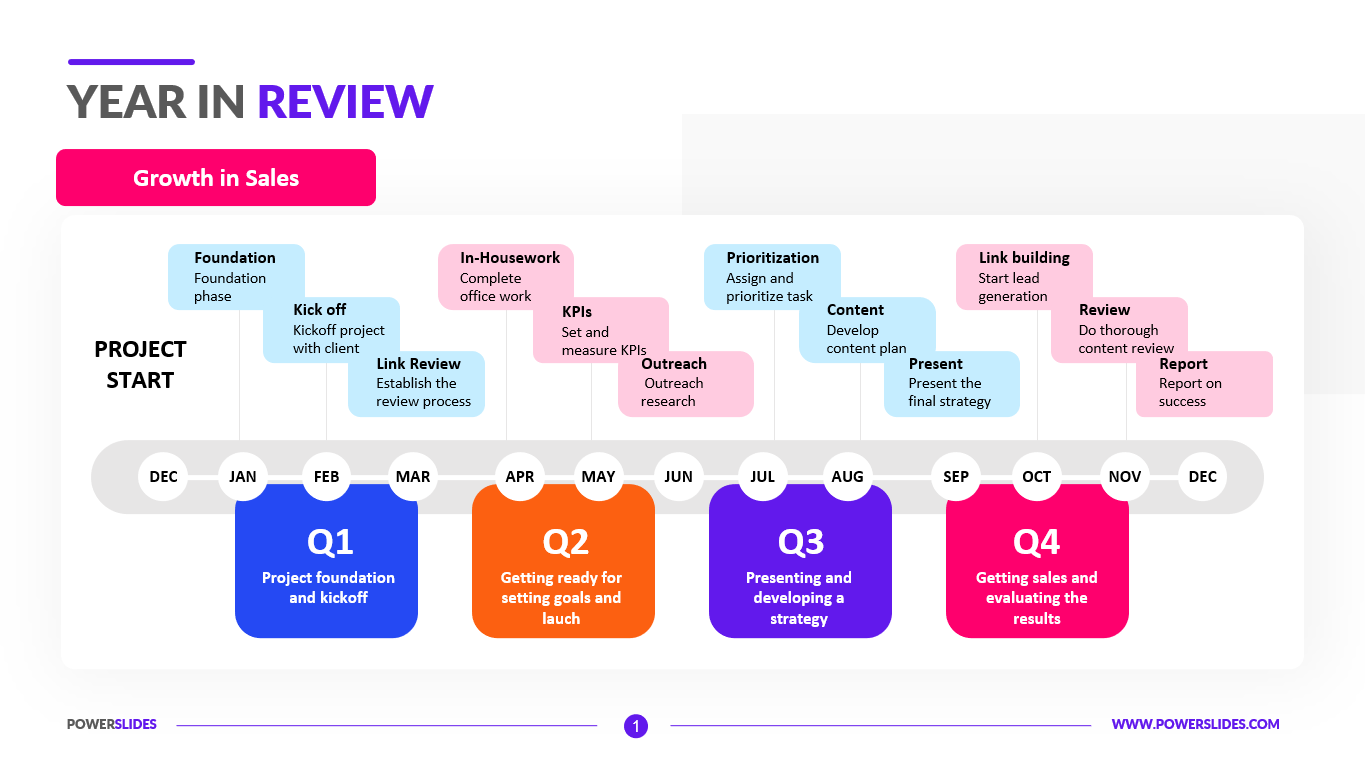
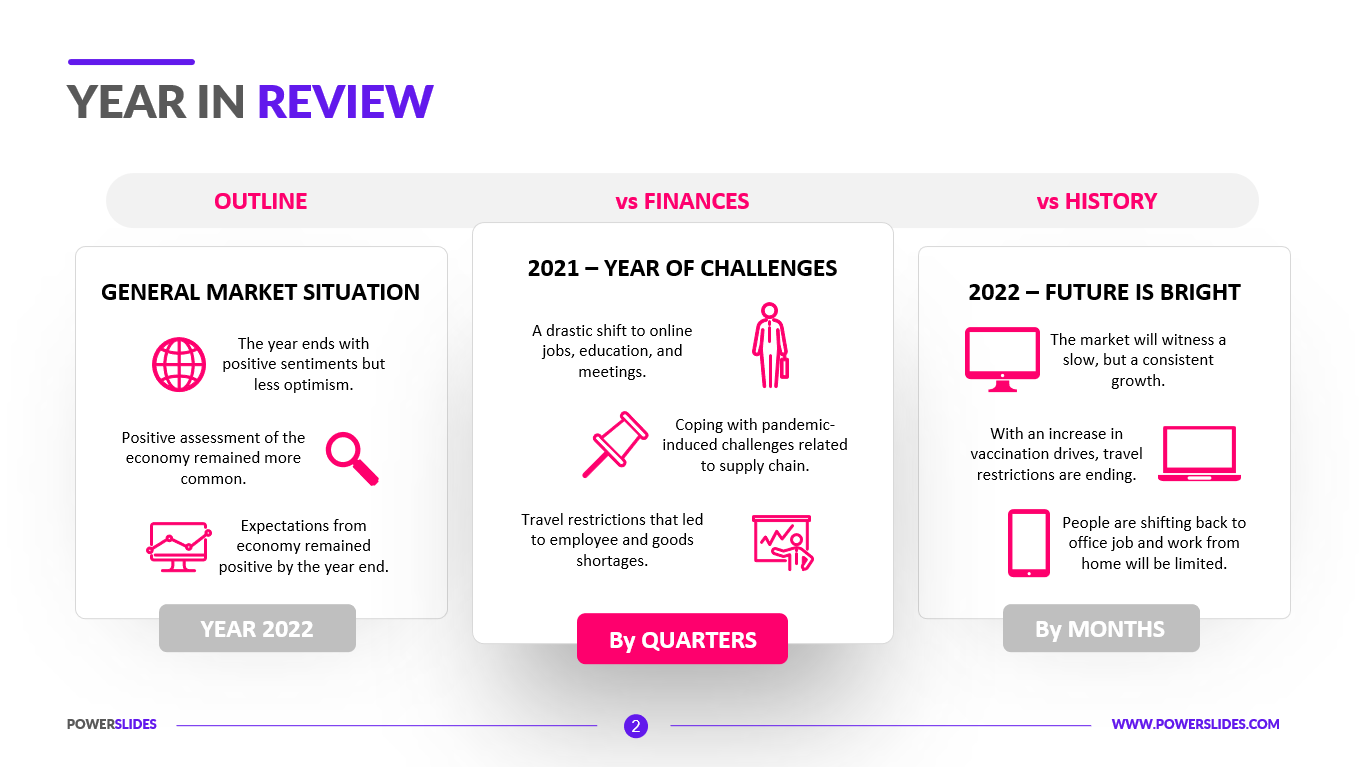
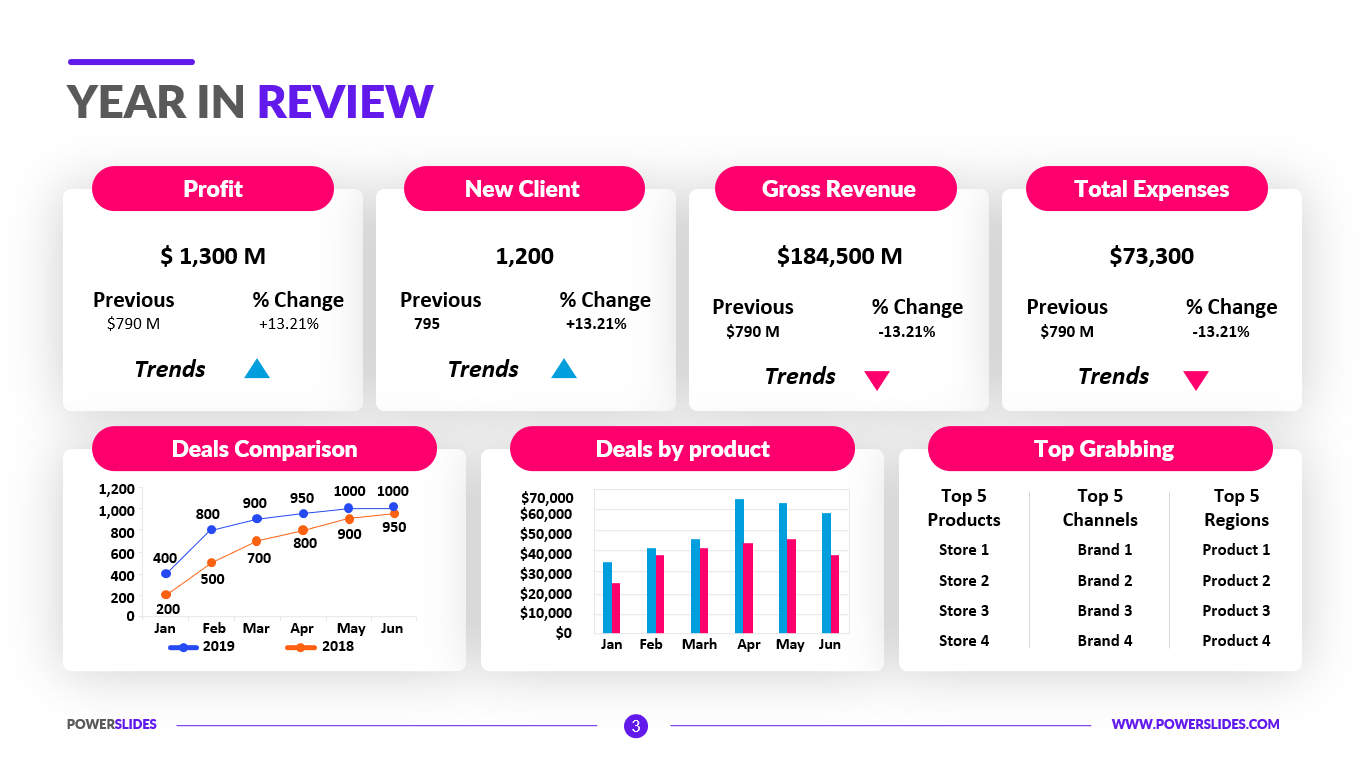
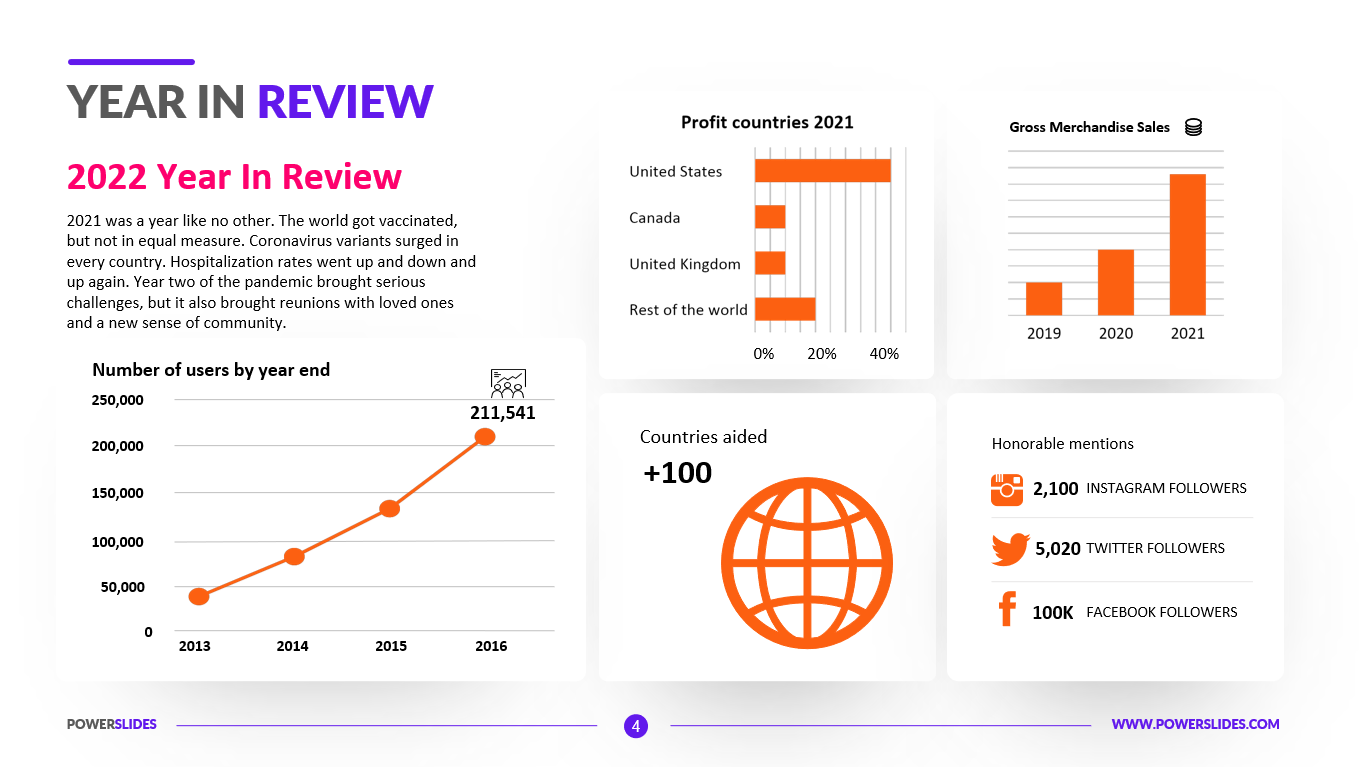
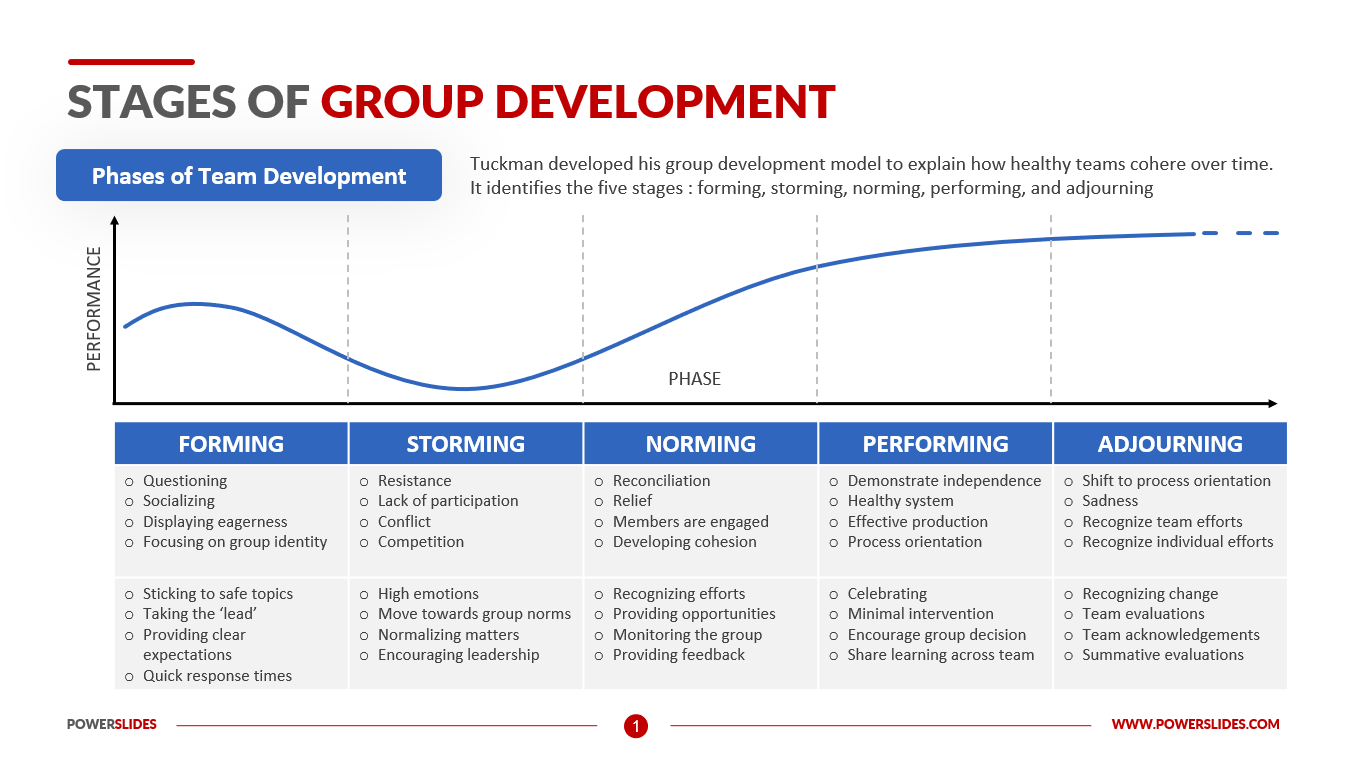
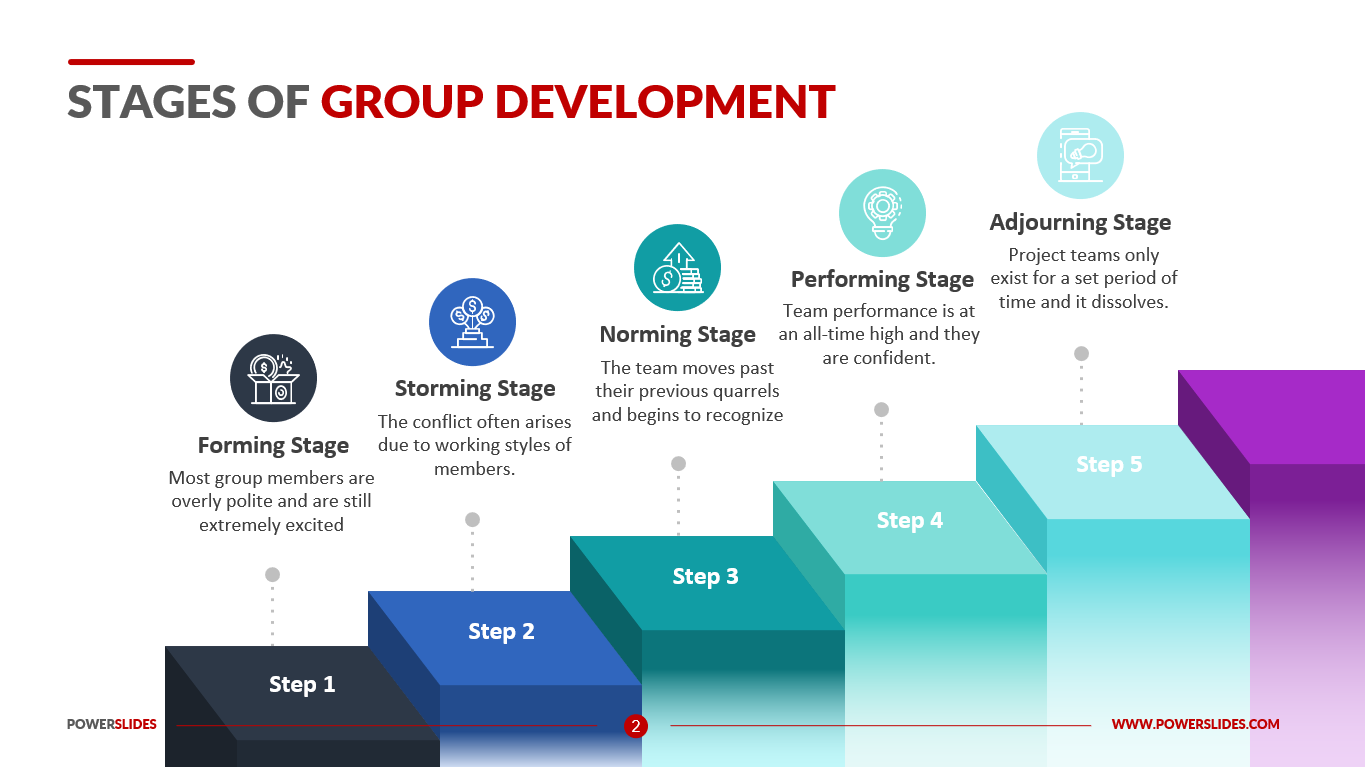
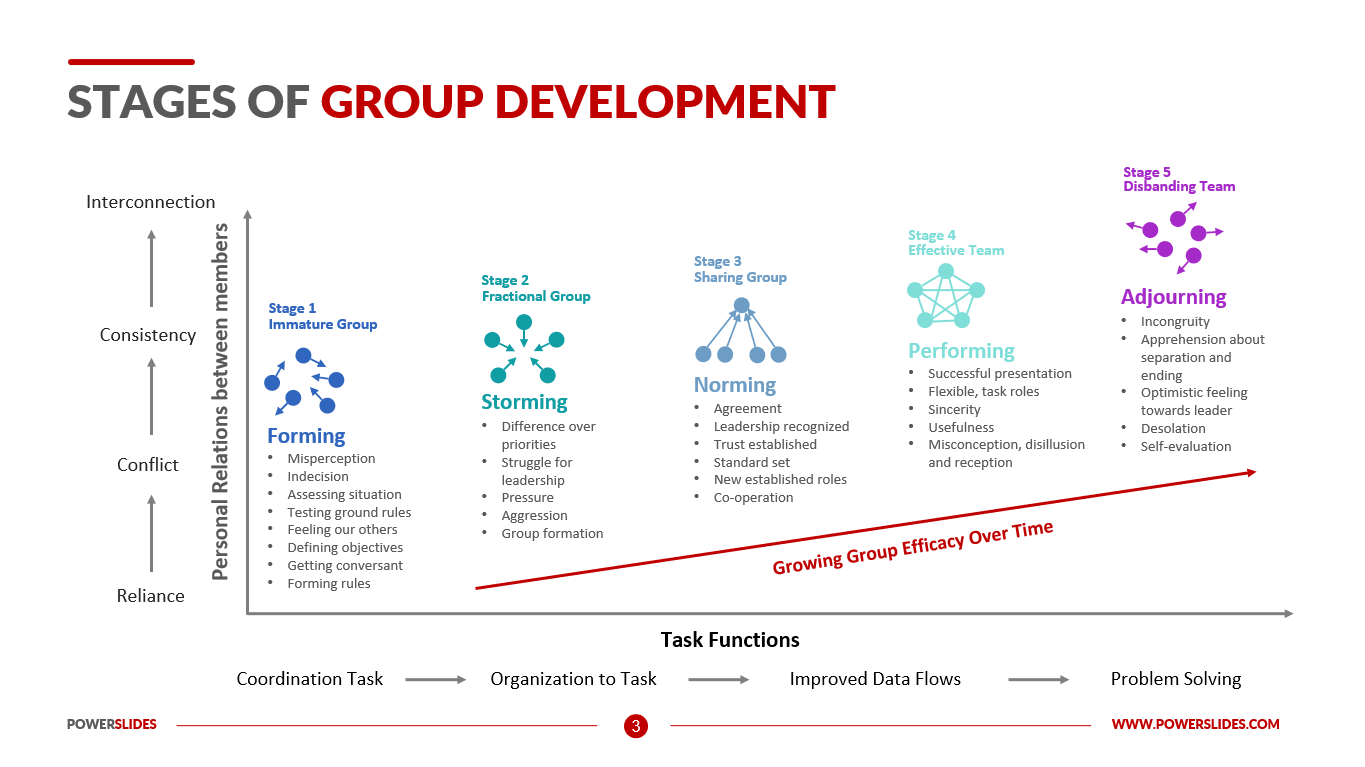
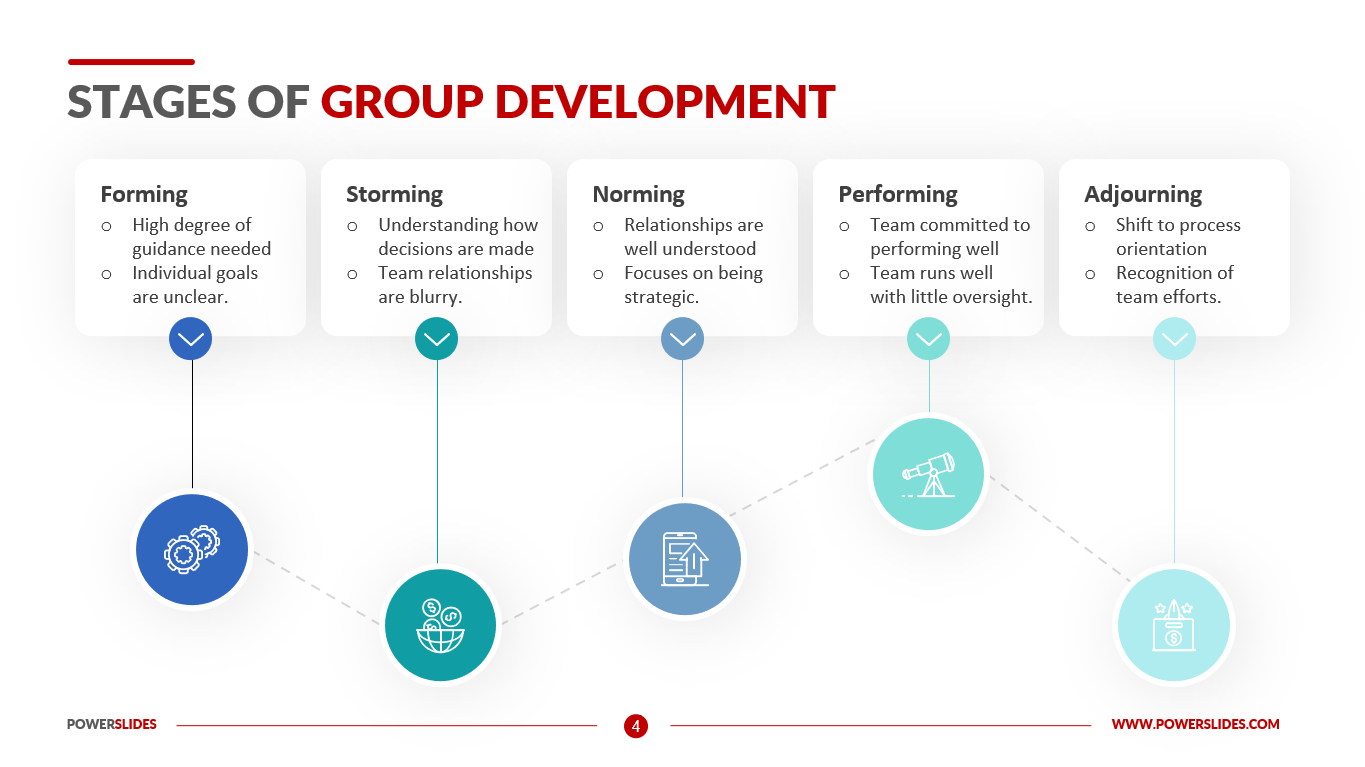
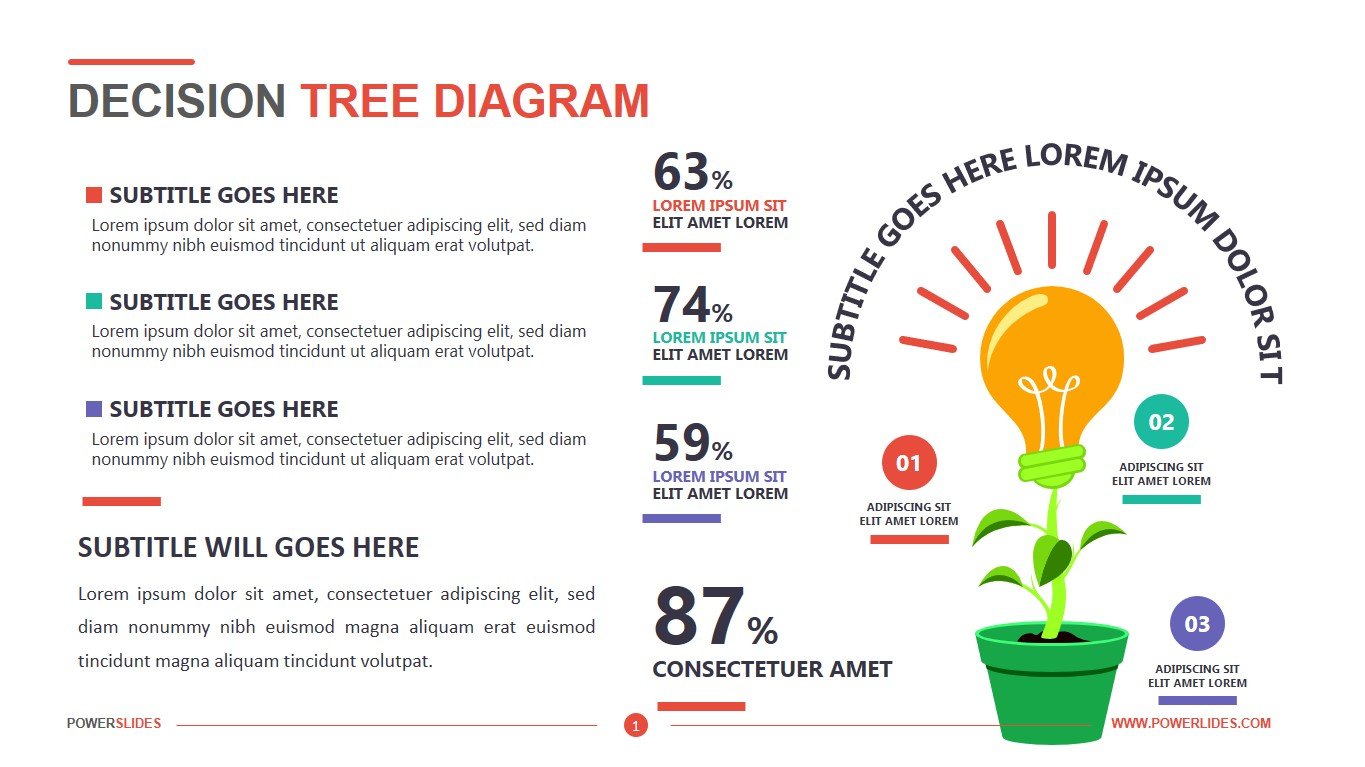
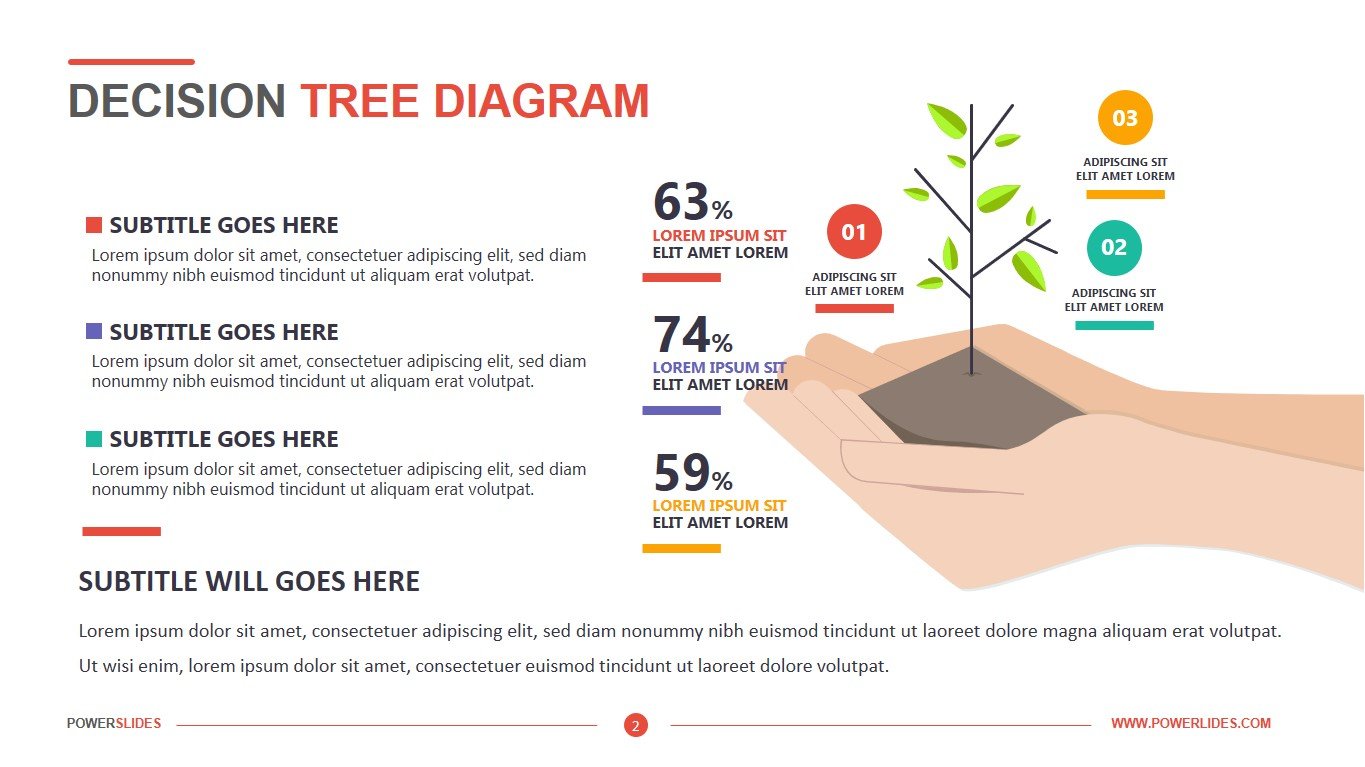
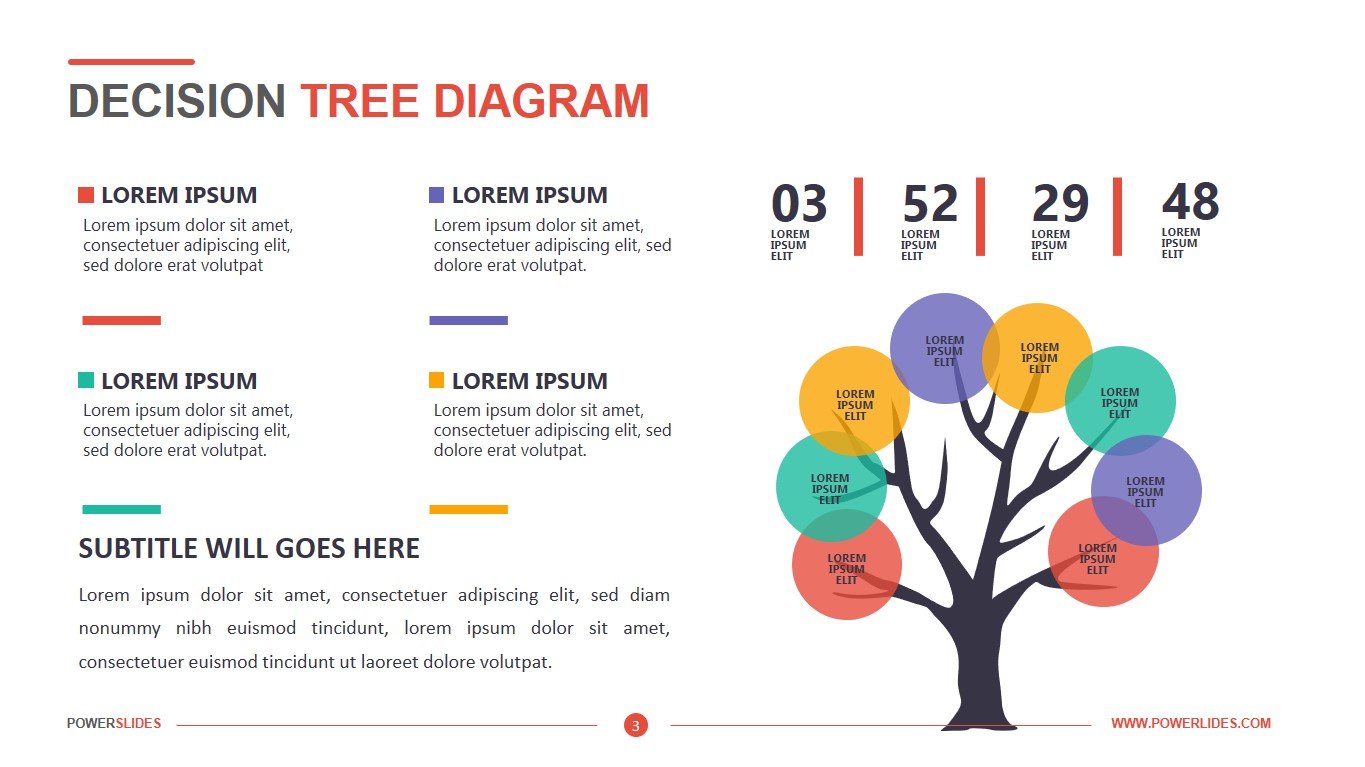
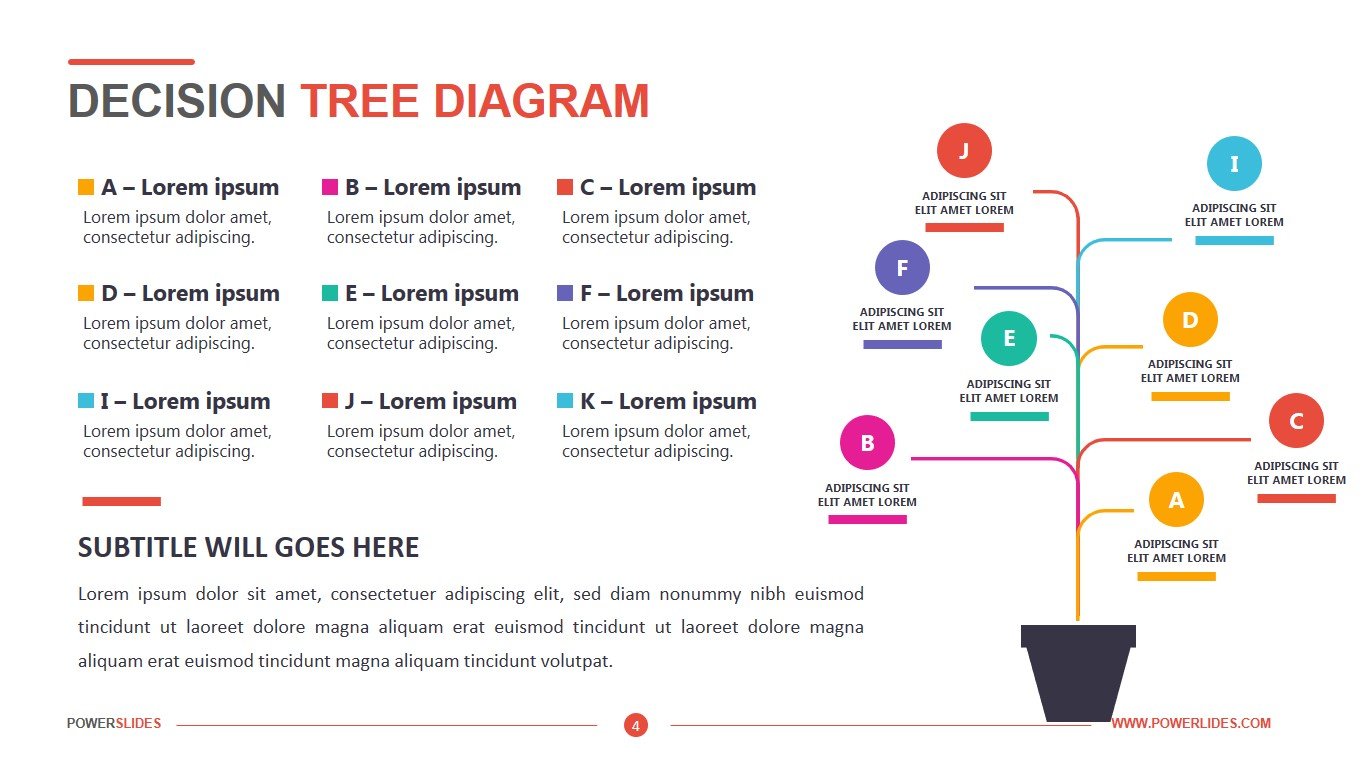
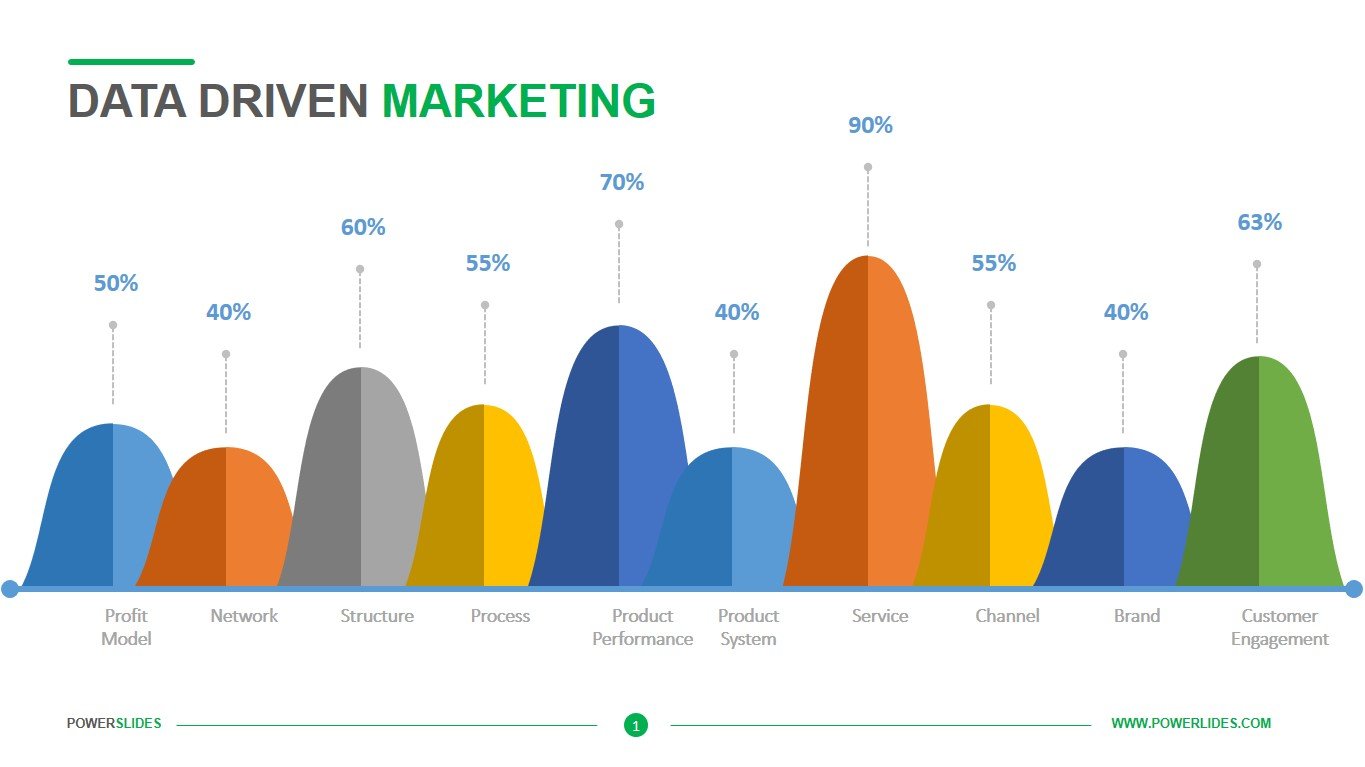
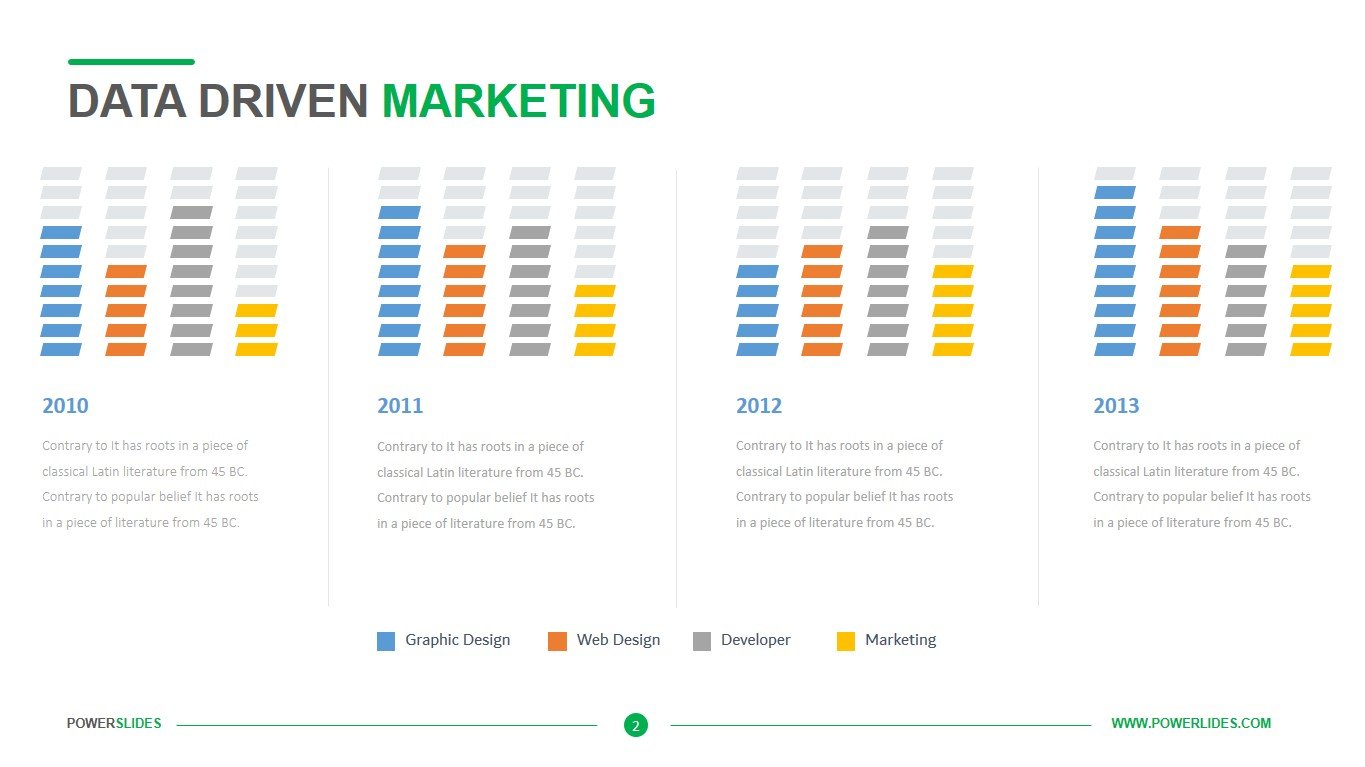
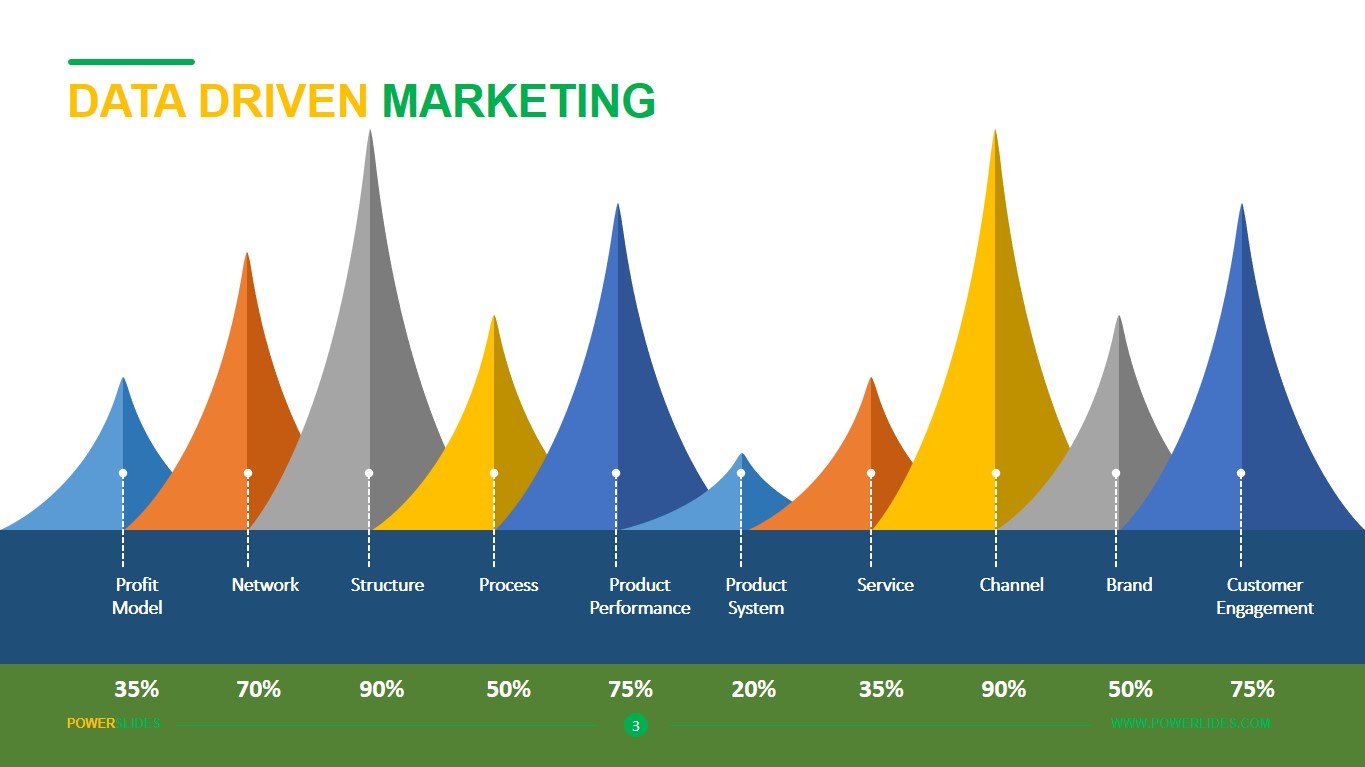
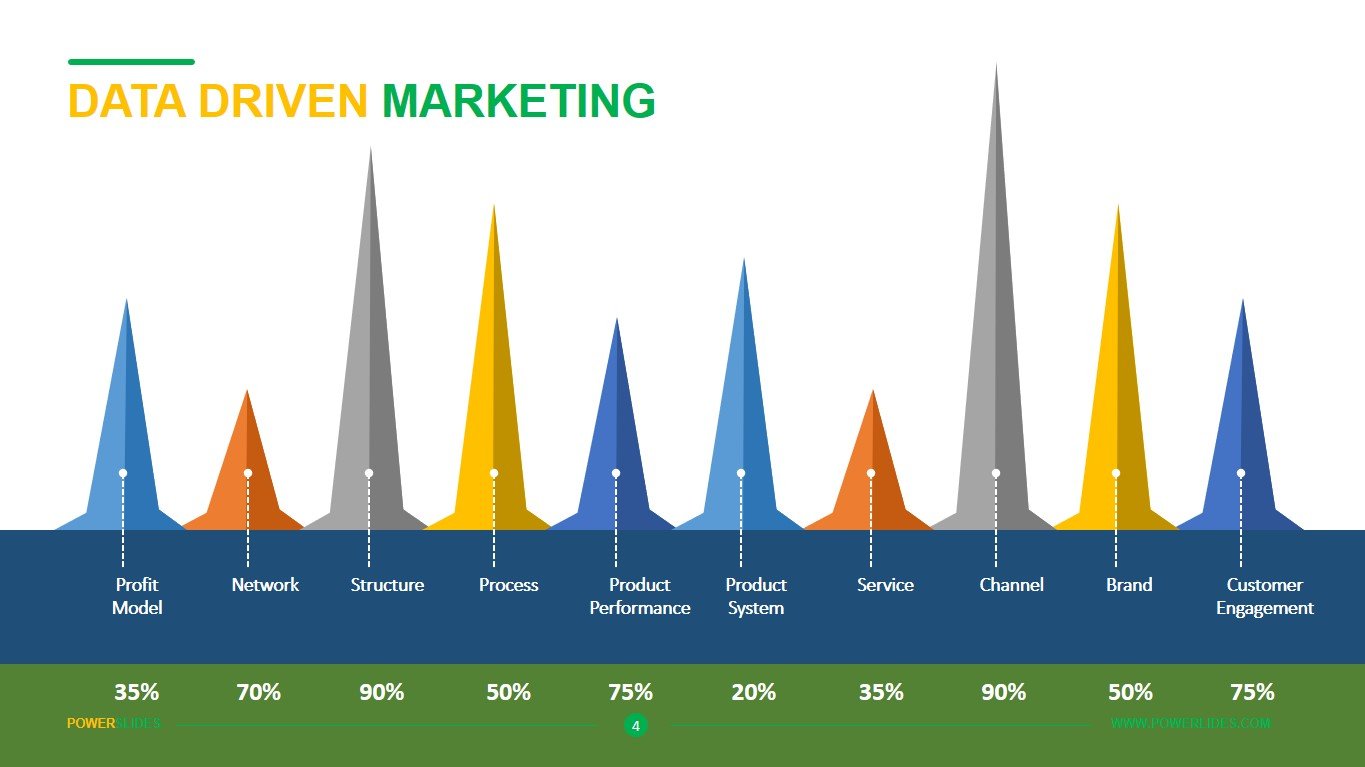
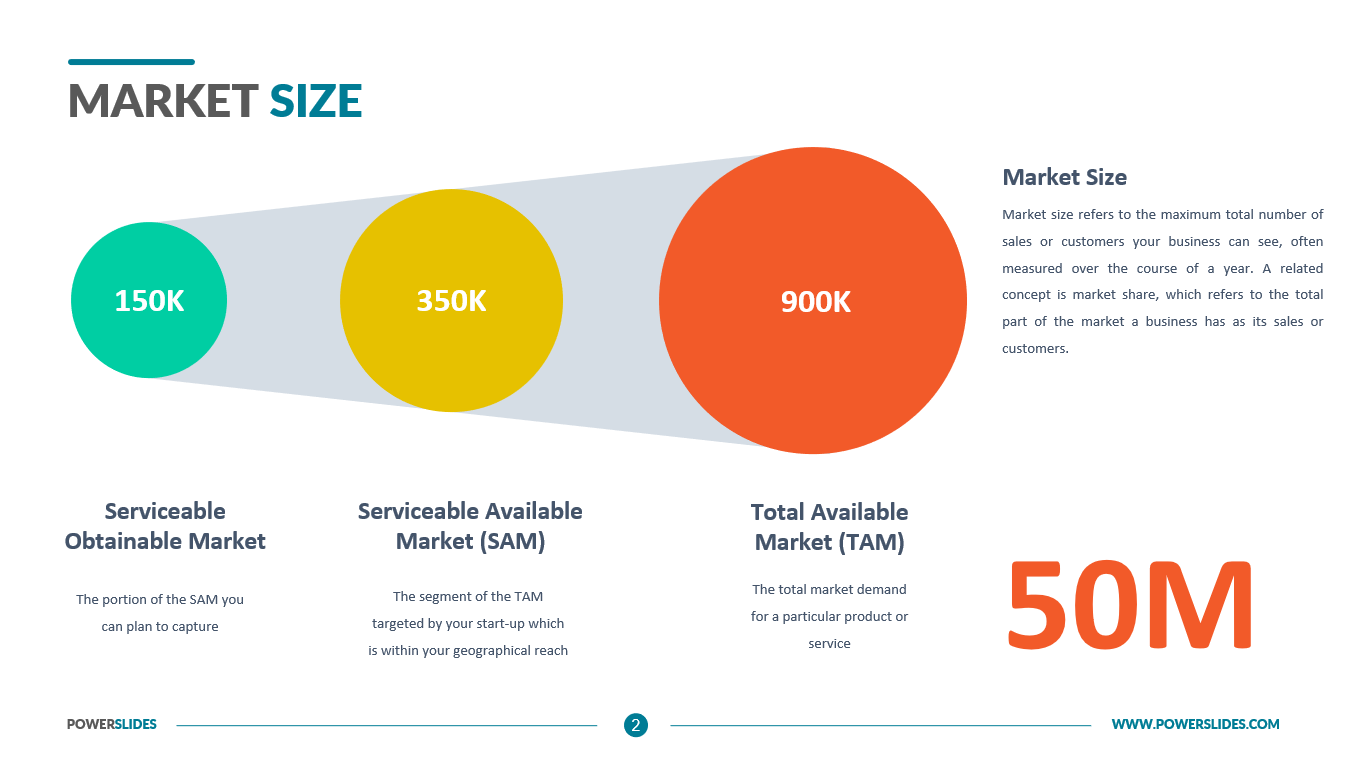
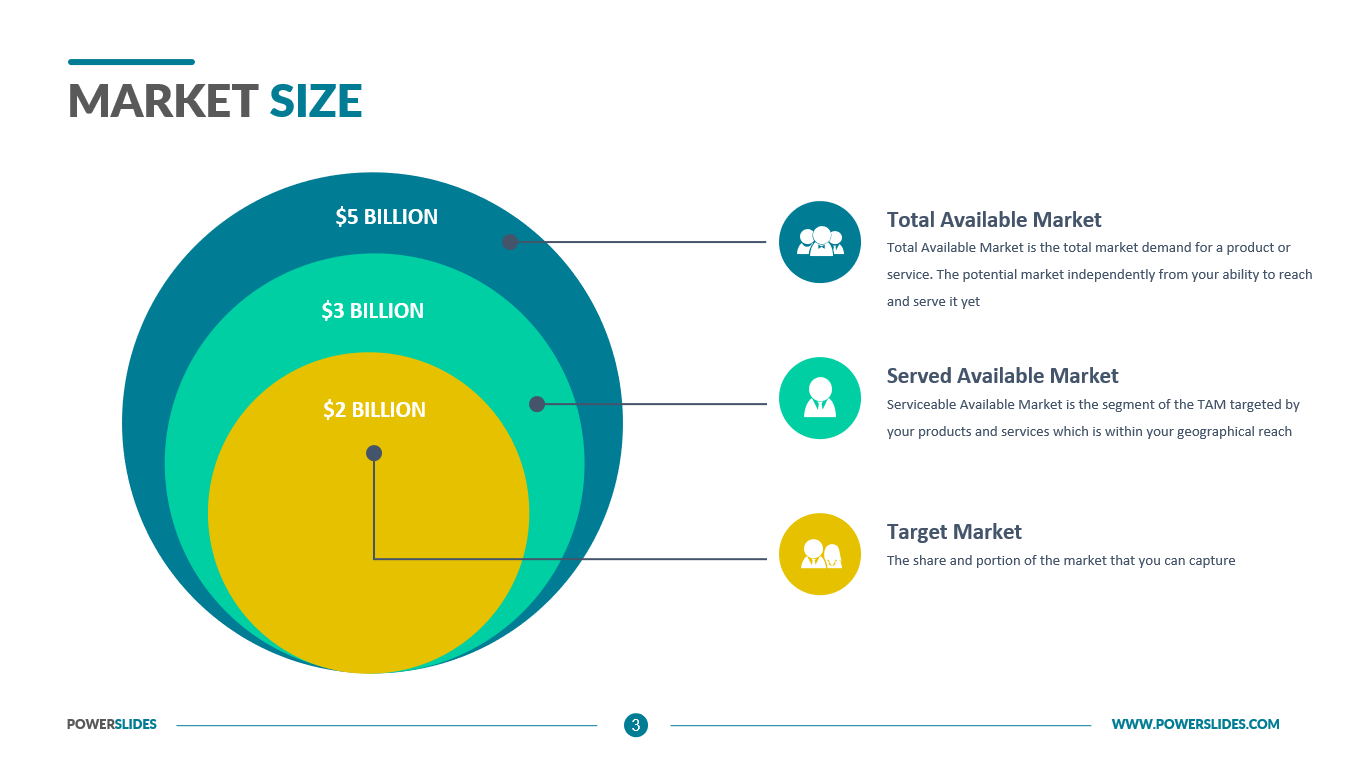
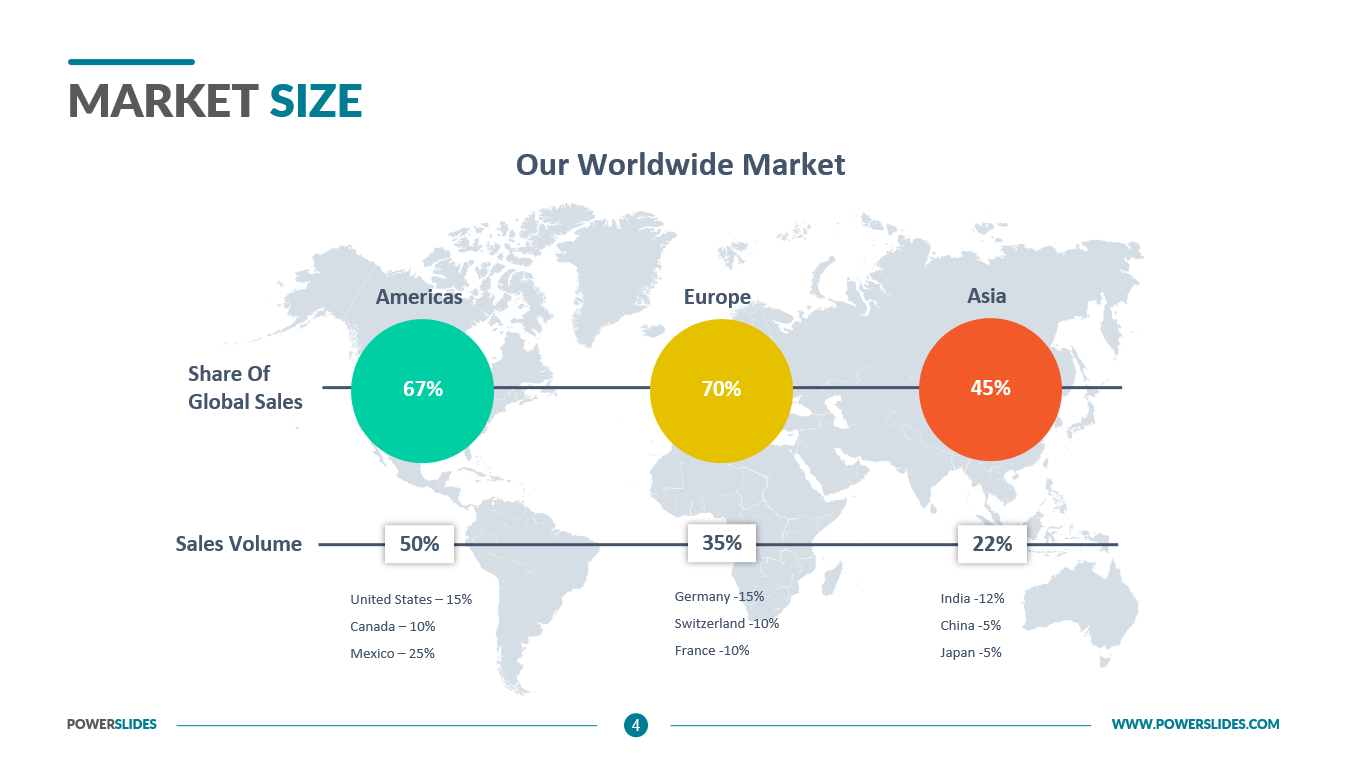
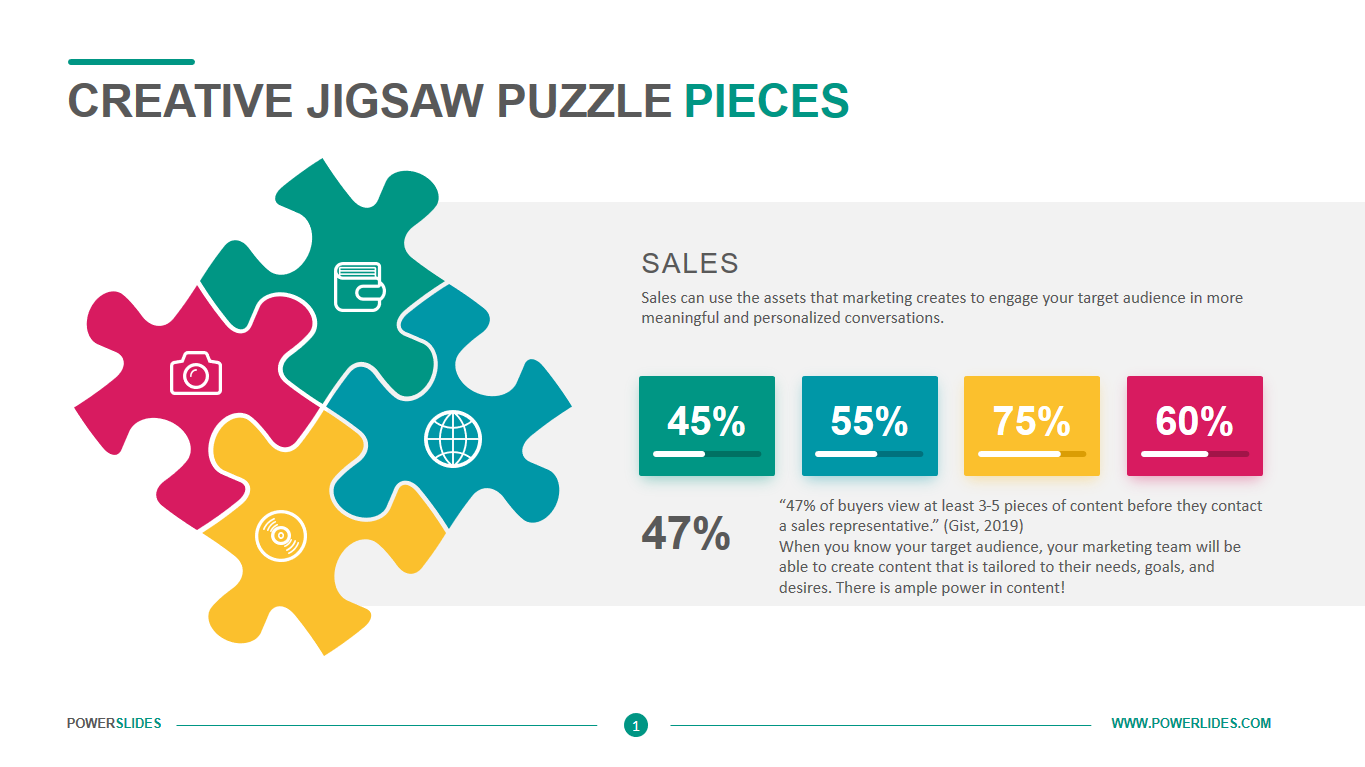
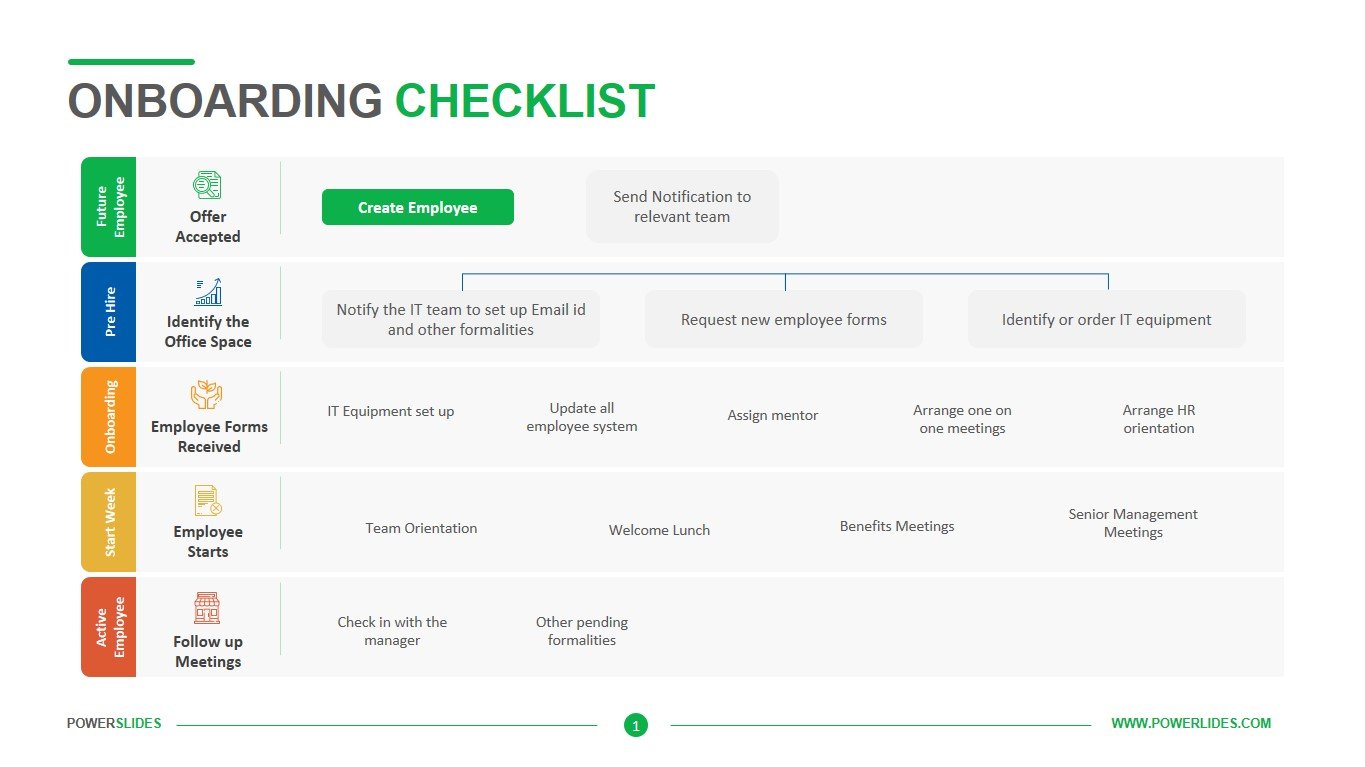
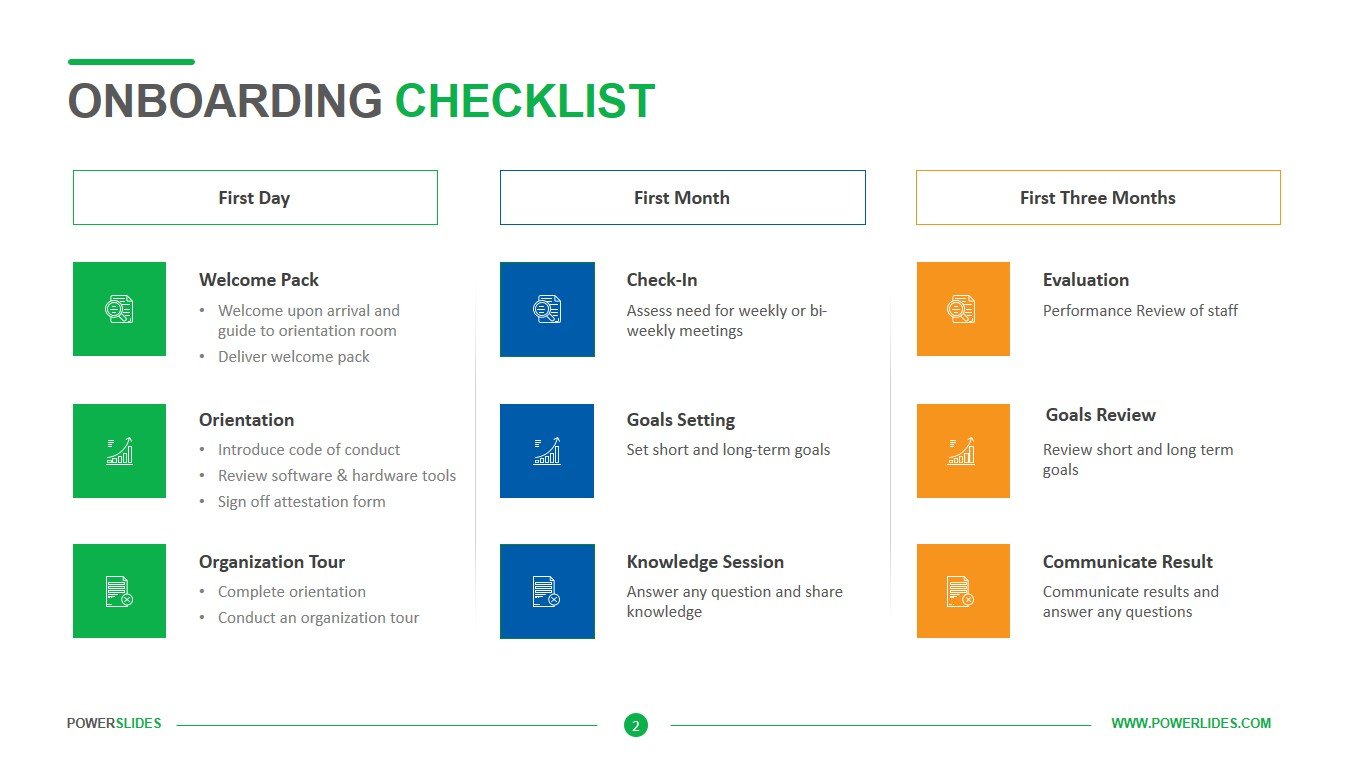
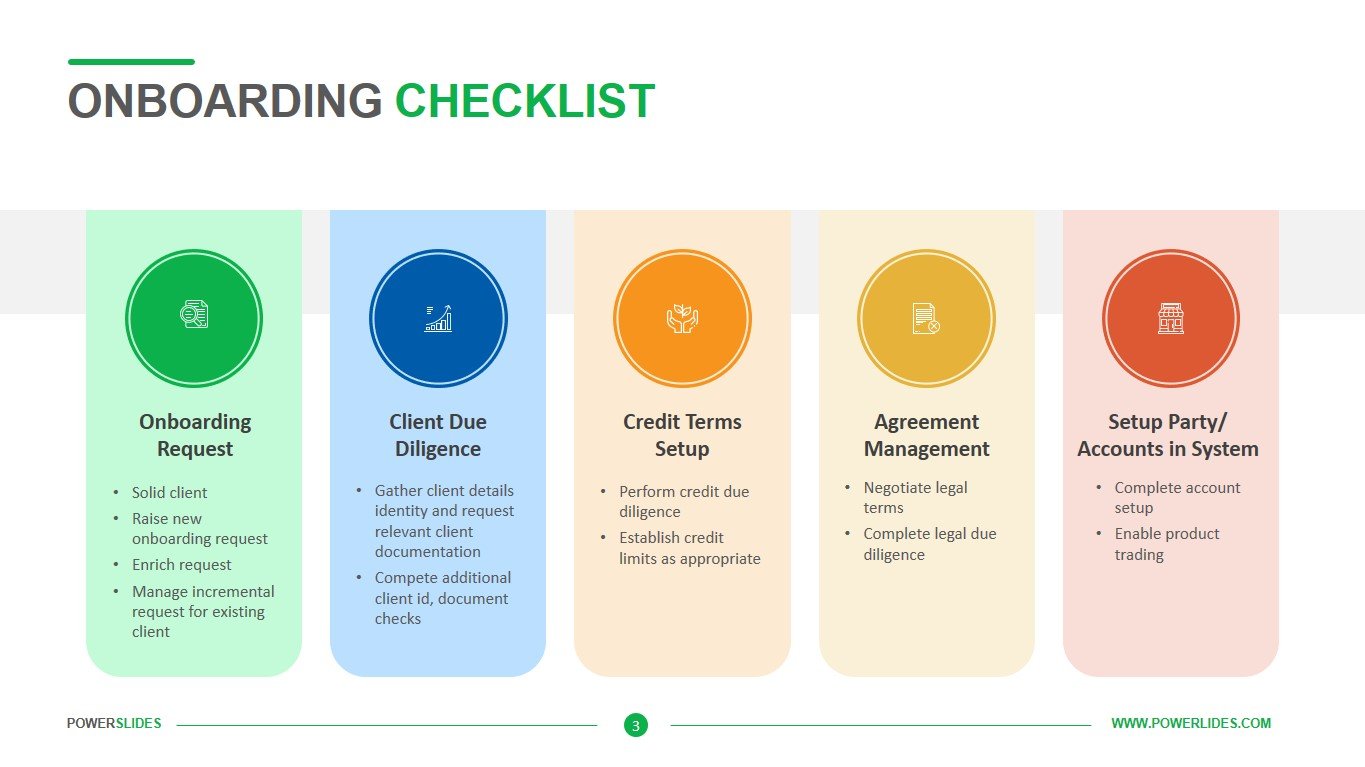
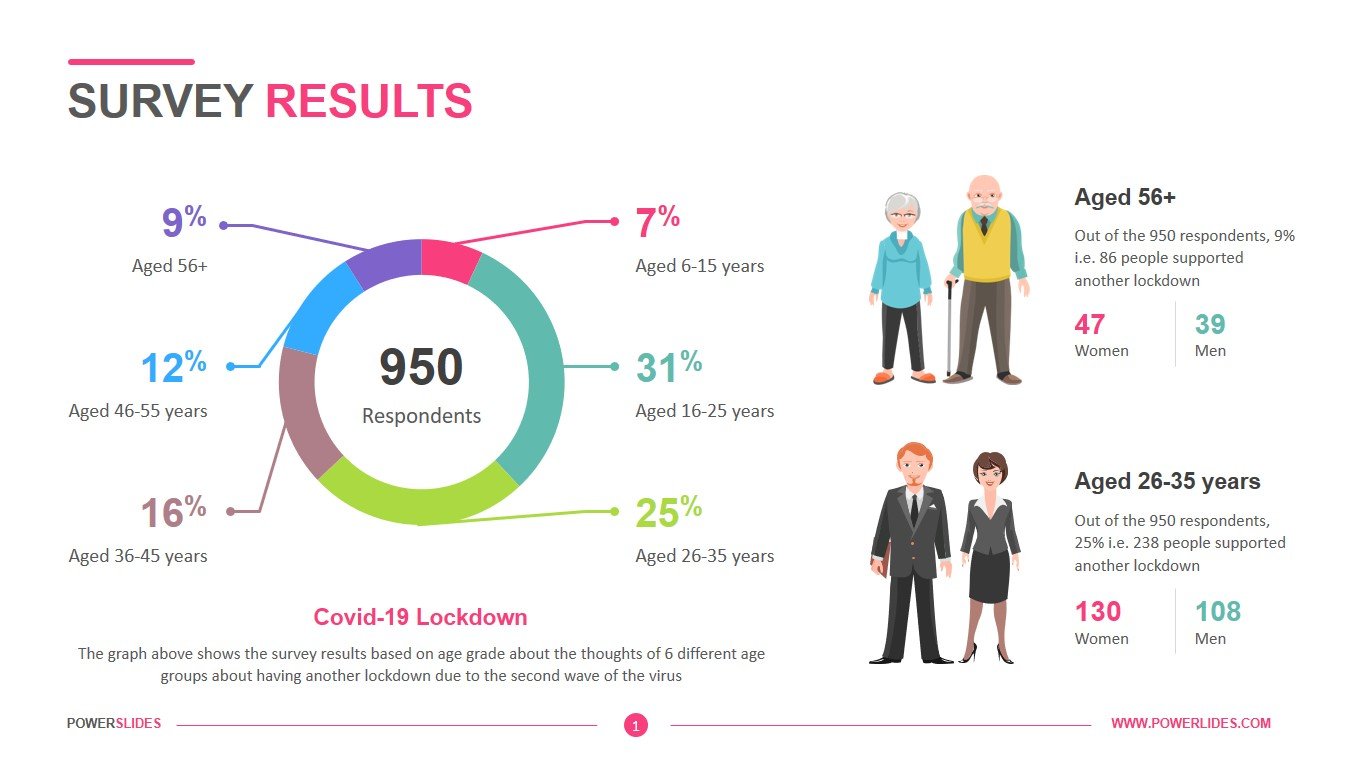
The Survey Results template consists of four professional slides, each with a large number of infographics, charts and graphs. All slides of the template are made in a bright color scheme and have all the necessary tools to build a professional presentation. This template will be useful in providing data from various social surveys. The first slide allows you to divide your respondents into age categories and give a short description for each of them. For example, you can provide information about respondents’ preferences for your new shampoo or new car model. The next slide will be useful for financiers and economists. You can use this slide to provide your complex analytical calculations and cash flow projections. This template will also be useful for marketing specialists when preparing a report on an advertising campaign for a new product. The slides of this template can also be used by airlines to display the number of passengers carried. If necessary, you can independently change the size and color of the infographic and the position of the blocks. The Survey Results template will also be useful for startups and investment companies in preparing their complex analytical data and forecasts for potential clients.


