Donut Chart
What do you think of this template?

 (4.33/ 5)
13 ratings

 4 Slides
 File size: 16:9
 Fonts: Lato, Calibri
 Supported version
PPT 2010, PPT 2013, PPT 2016
Supported version
PPT 2010, PPT 2013, PPT 2016

Product details
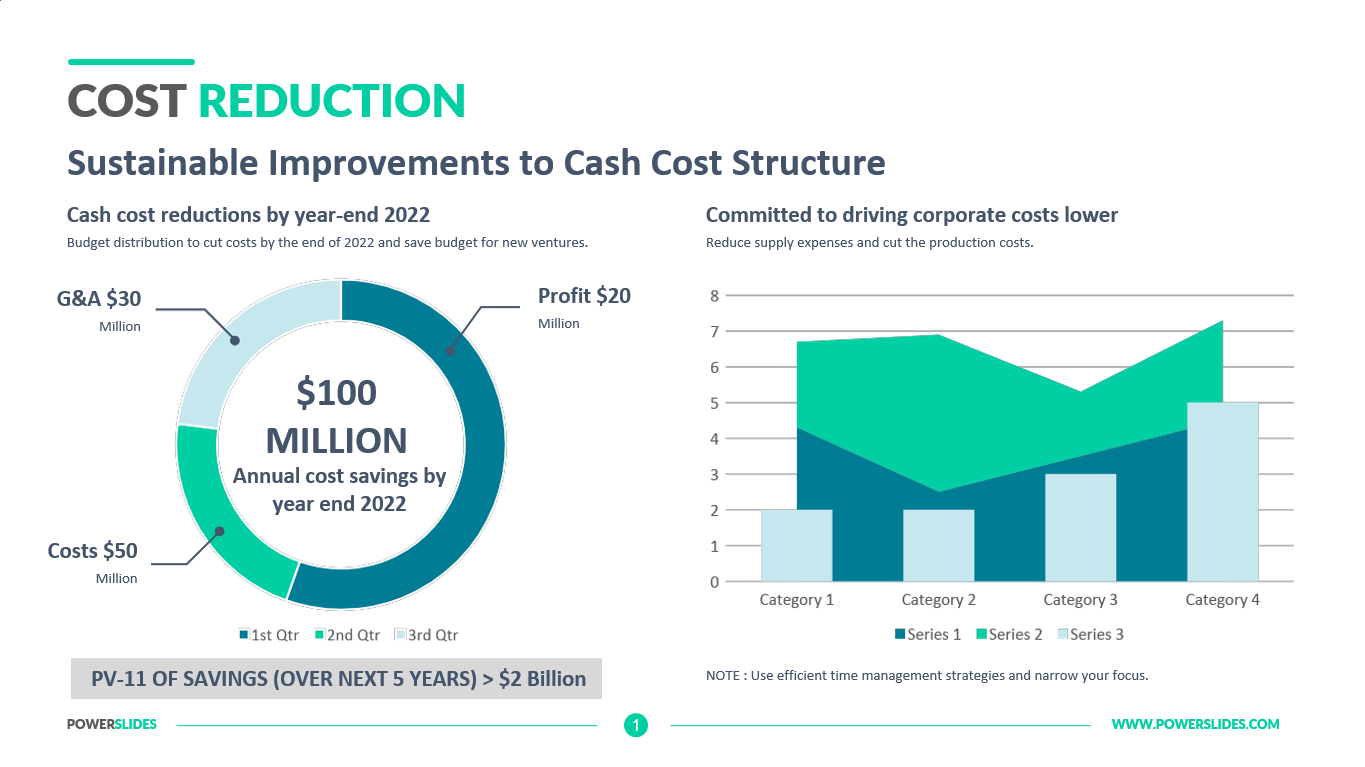
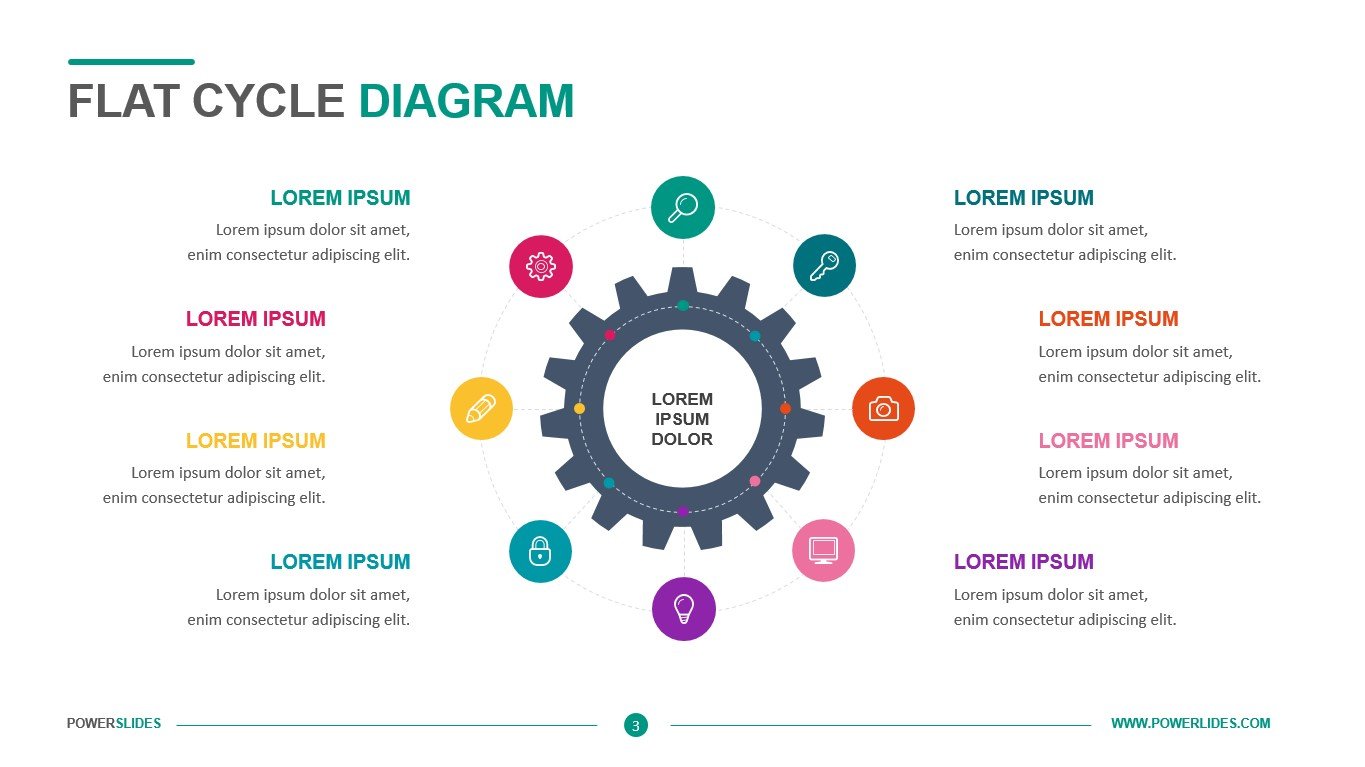
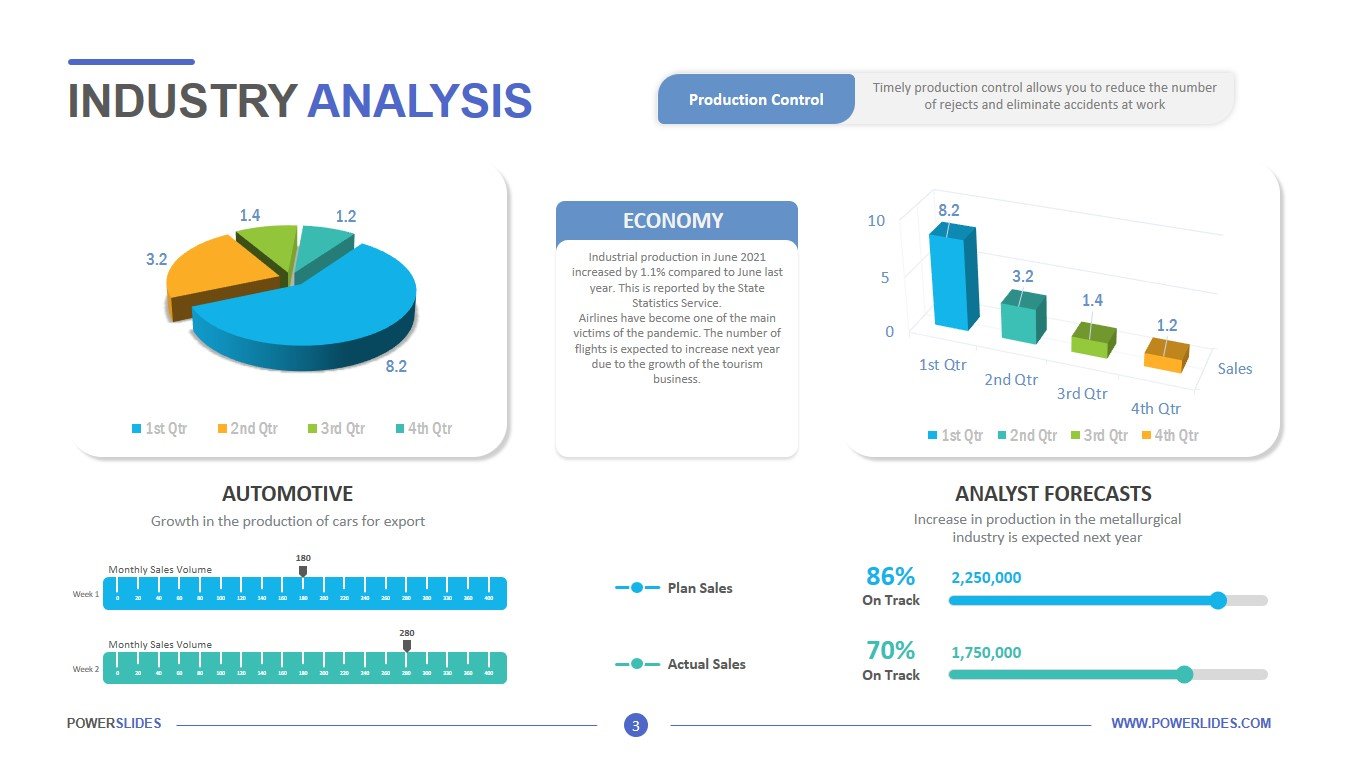
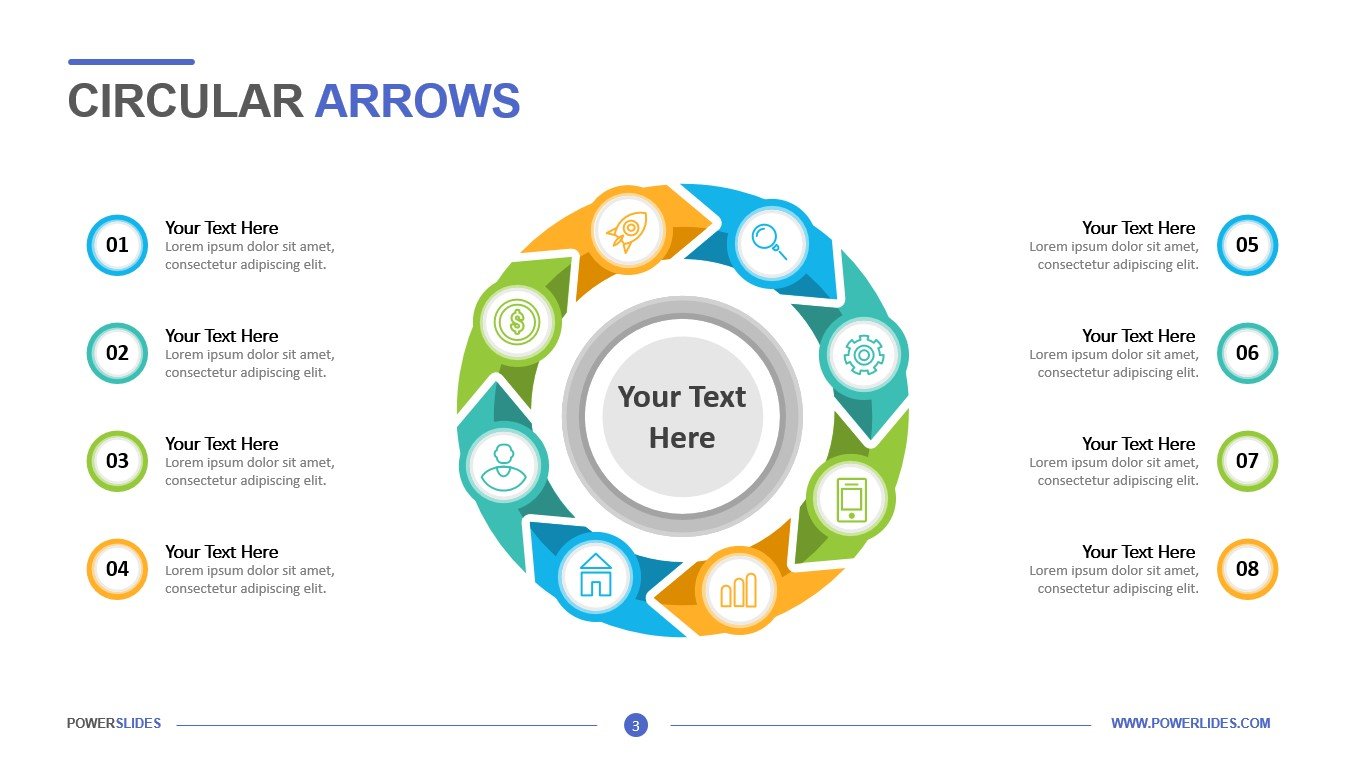
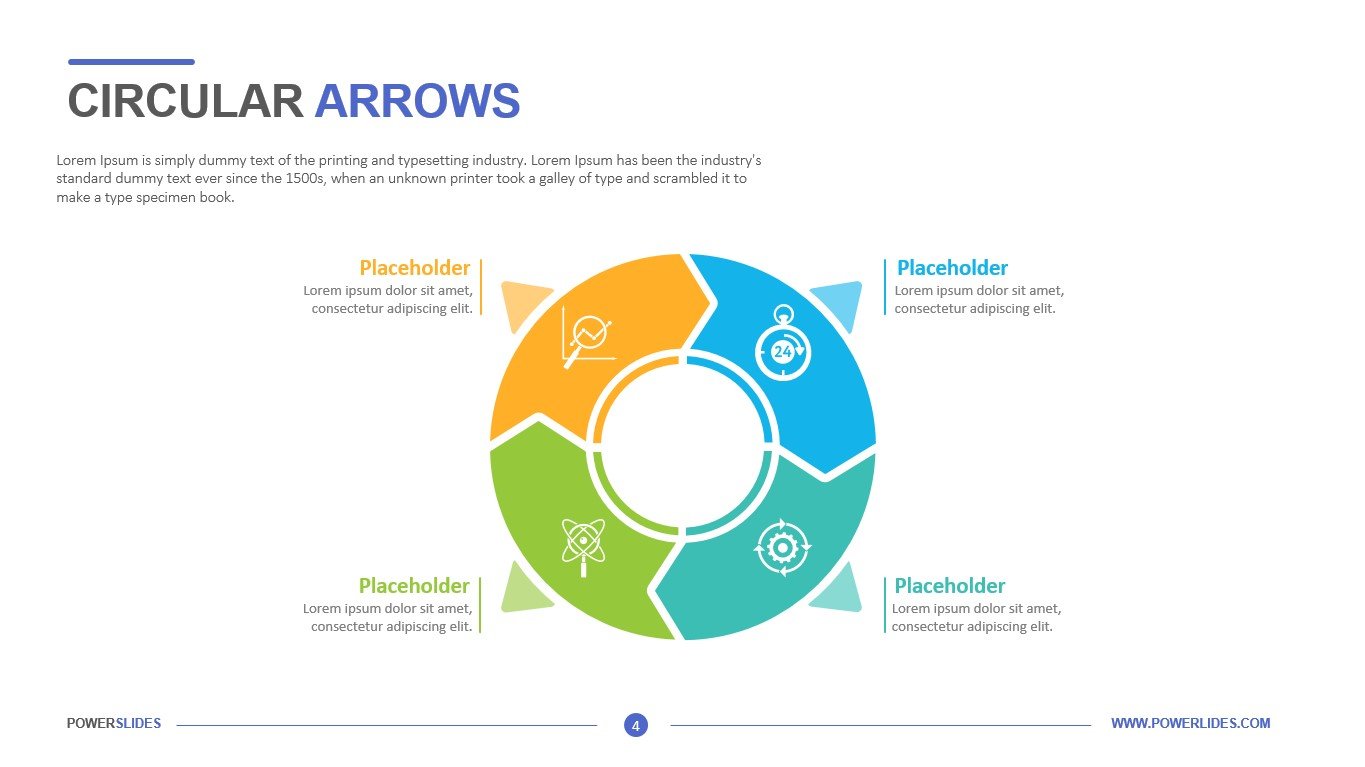
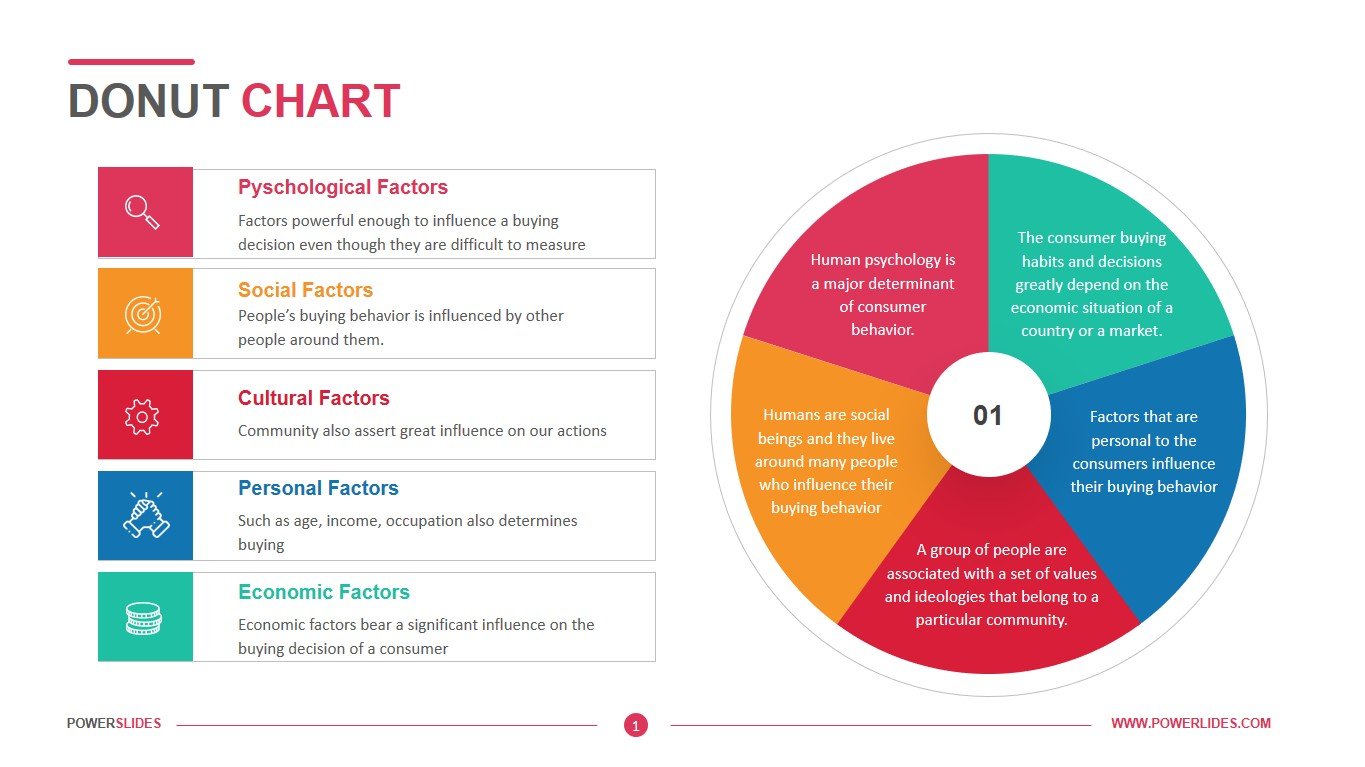
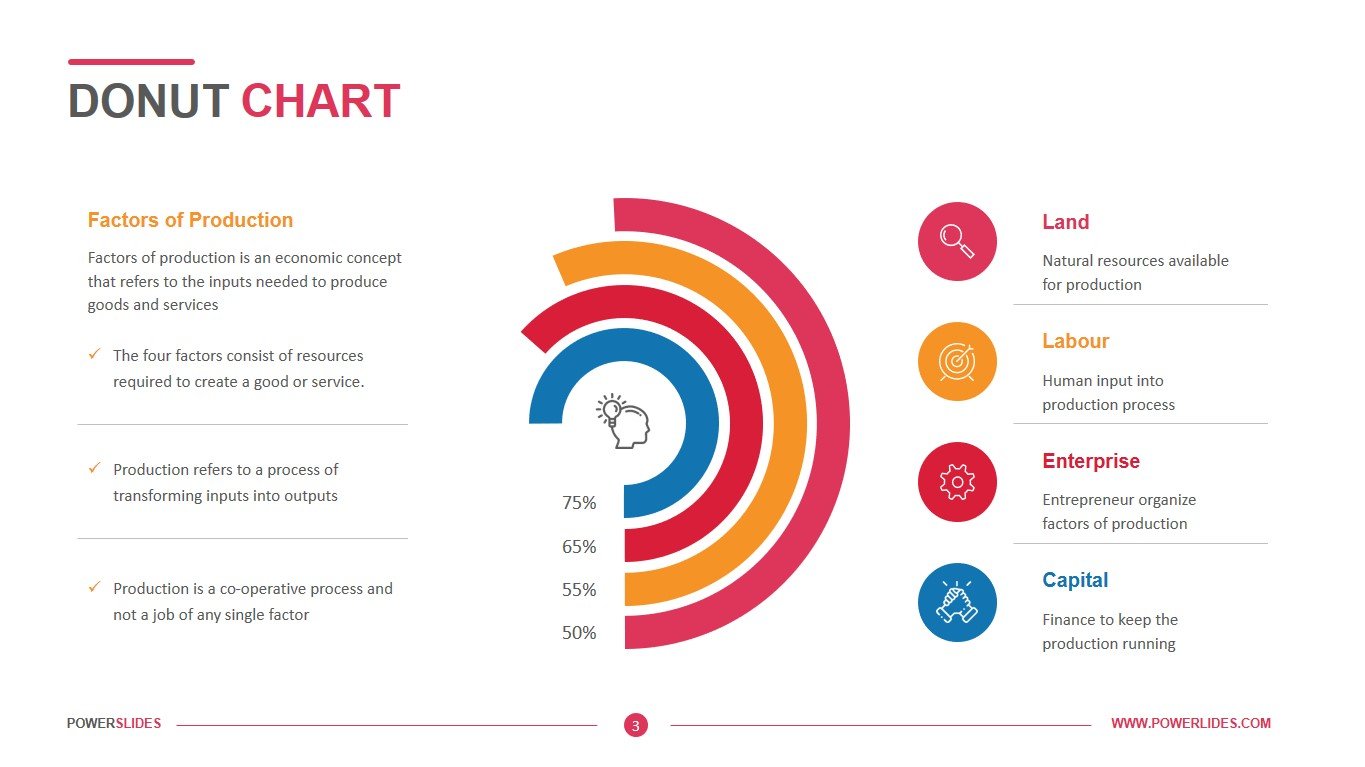
A donut chart (also spelled donut) is functionally identical to a pie chart, with the exception of a blank center and the ability to support multiple statistics at once. Donut charts provide a better data intensity ratio to standard pie charts since the blank center can be used to display additional, related data. The scope of such a diagram is not limited. A donut chart is used in their reports by financiers and economists, sales and purchasing managers, HR managers, and business coaches. Donut Chart template provides a huge selection of different modifications of this type of chart.
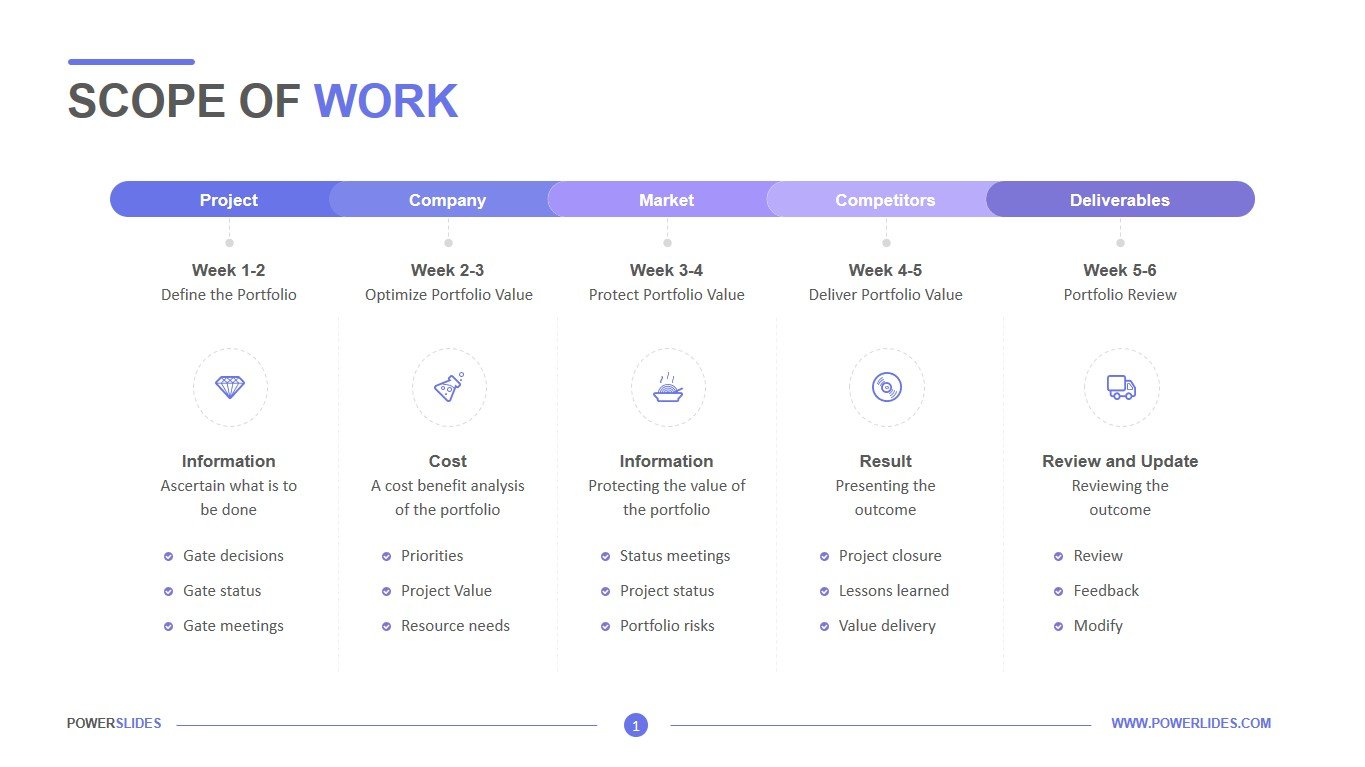
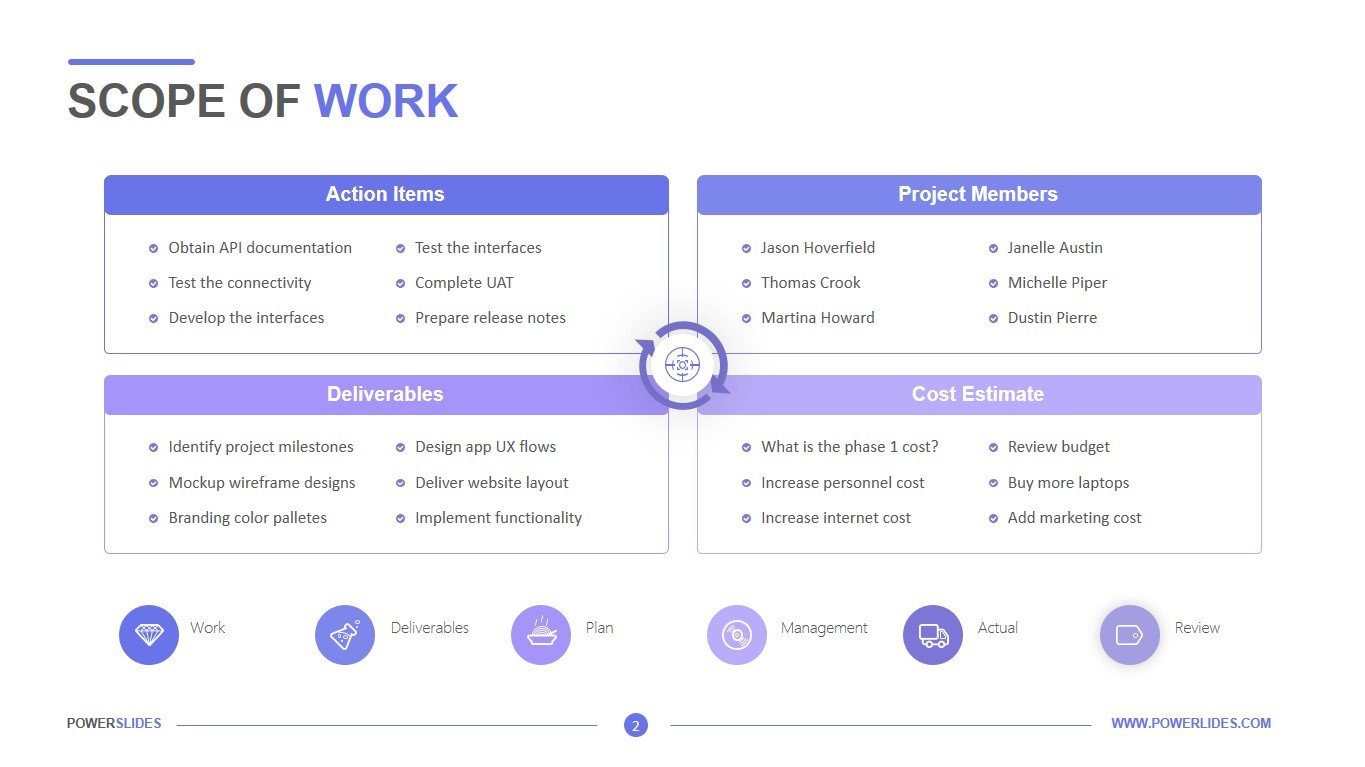
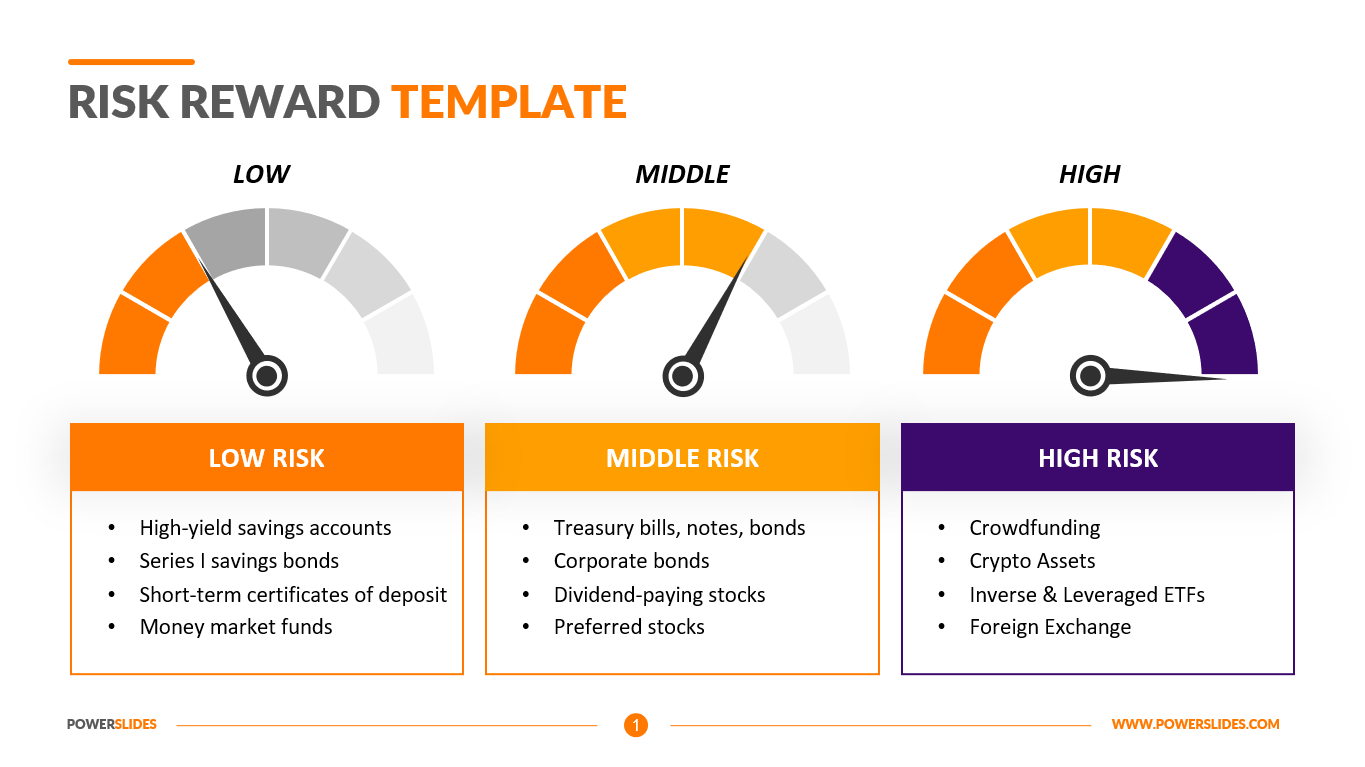
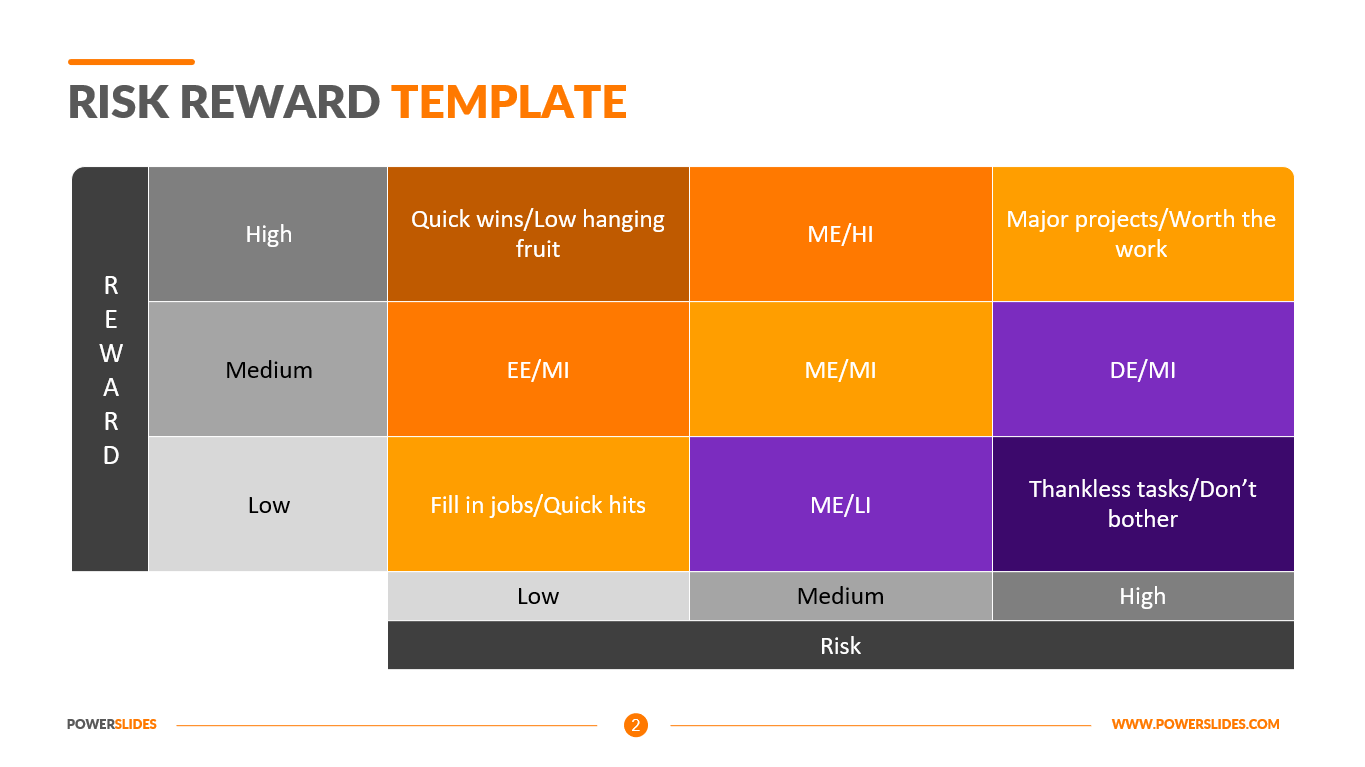
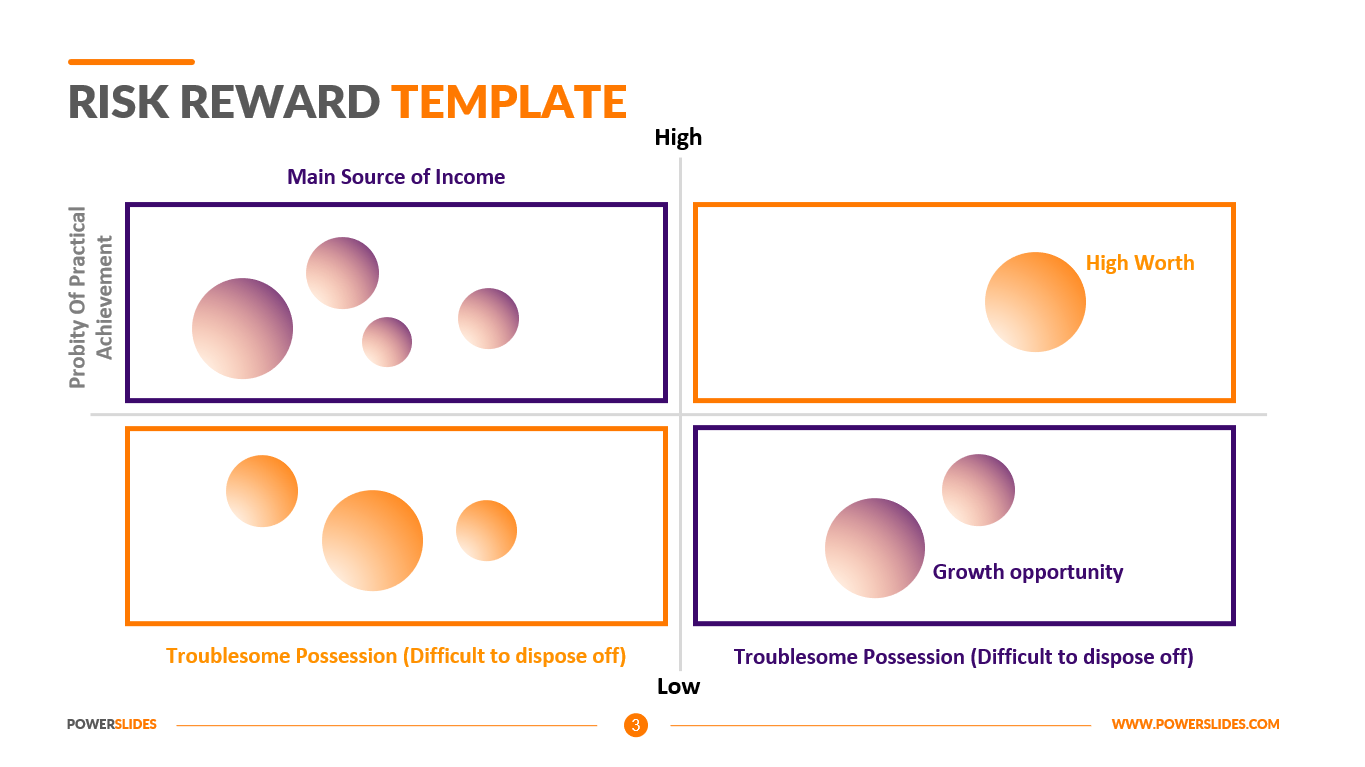
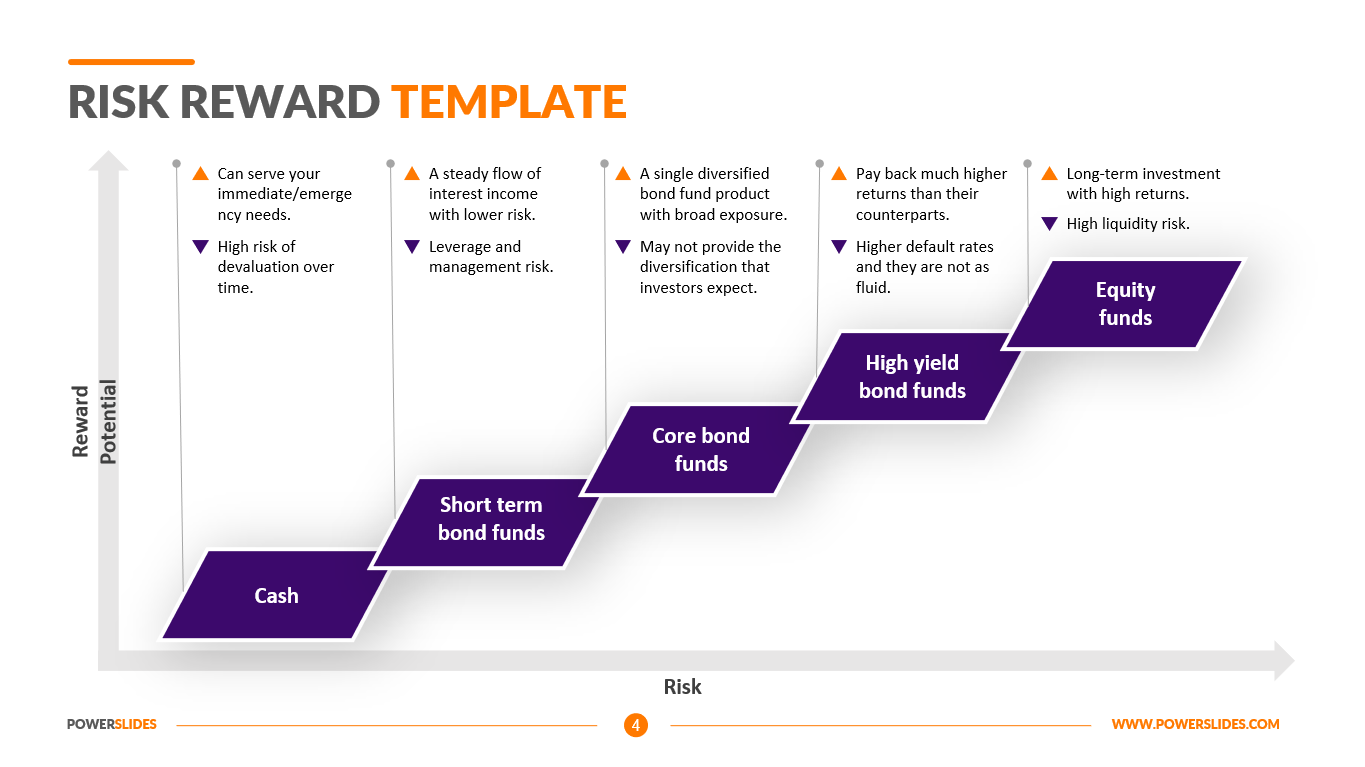
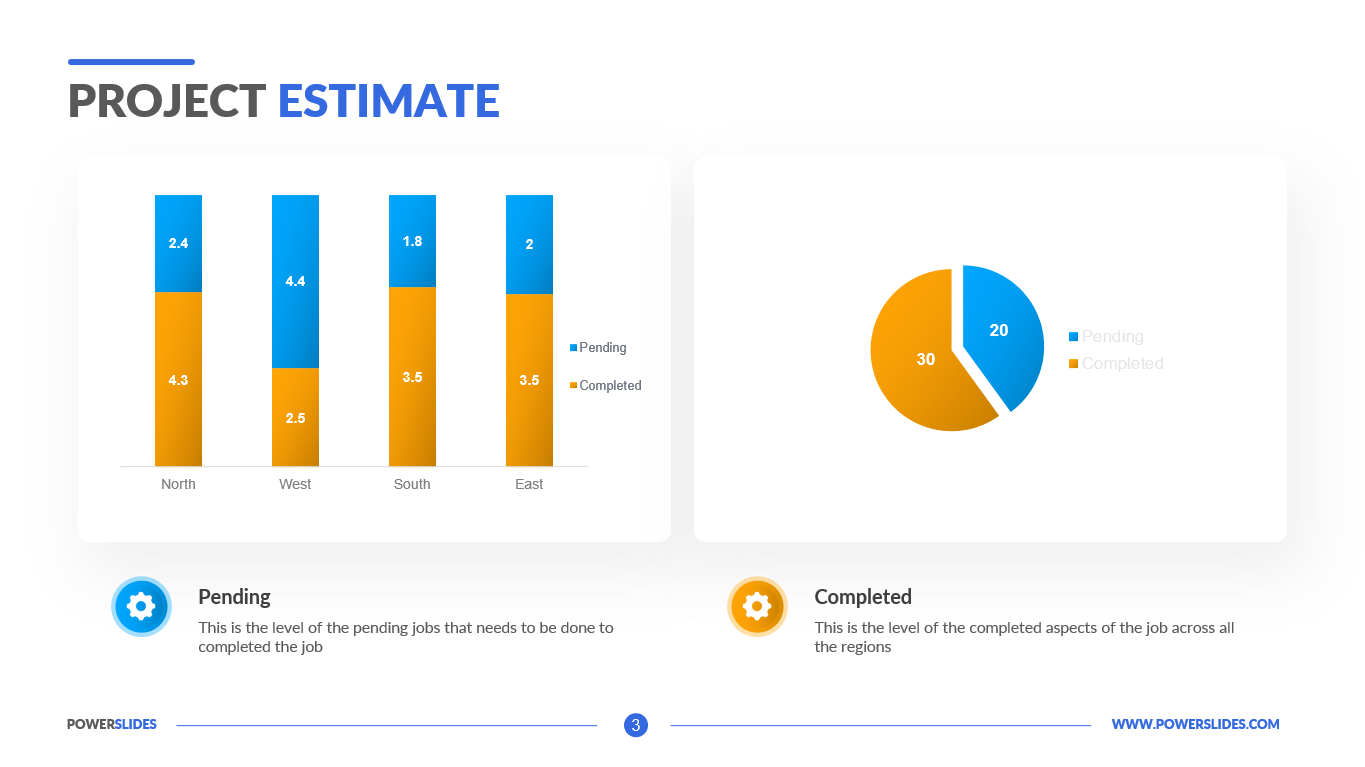
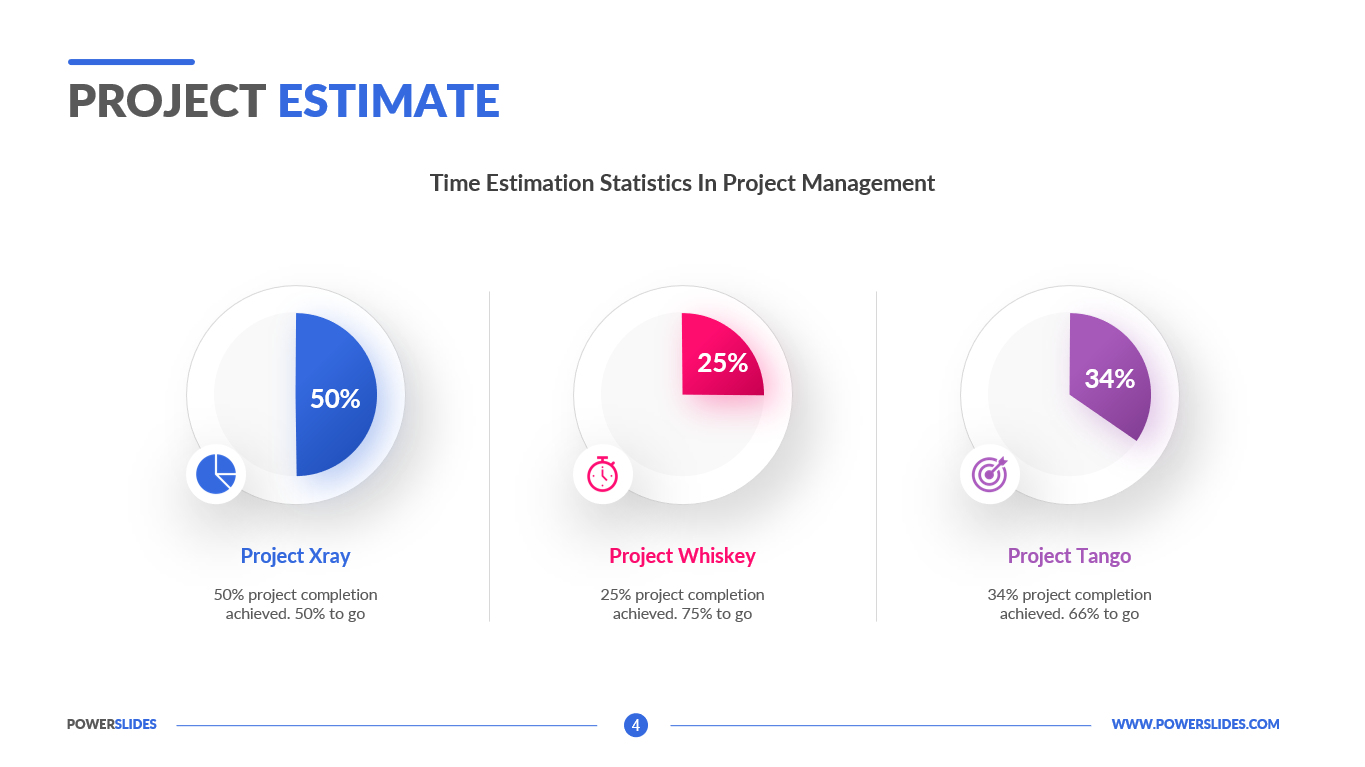
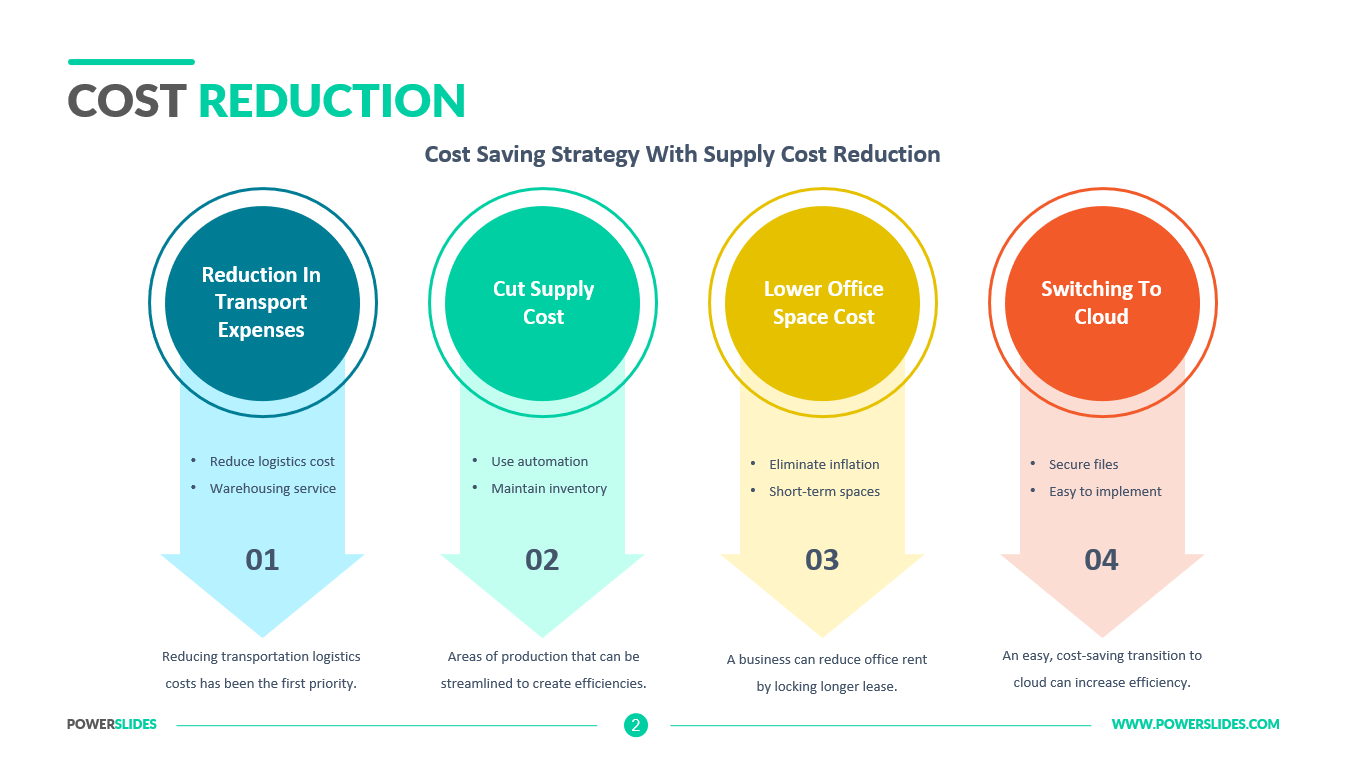
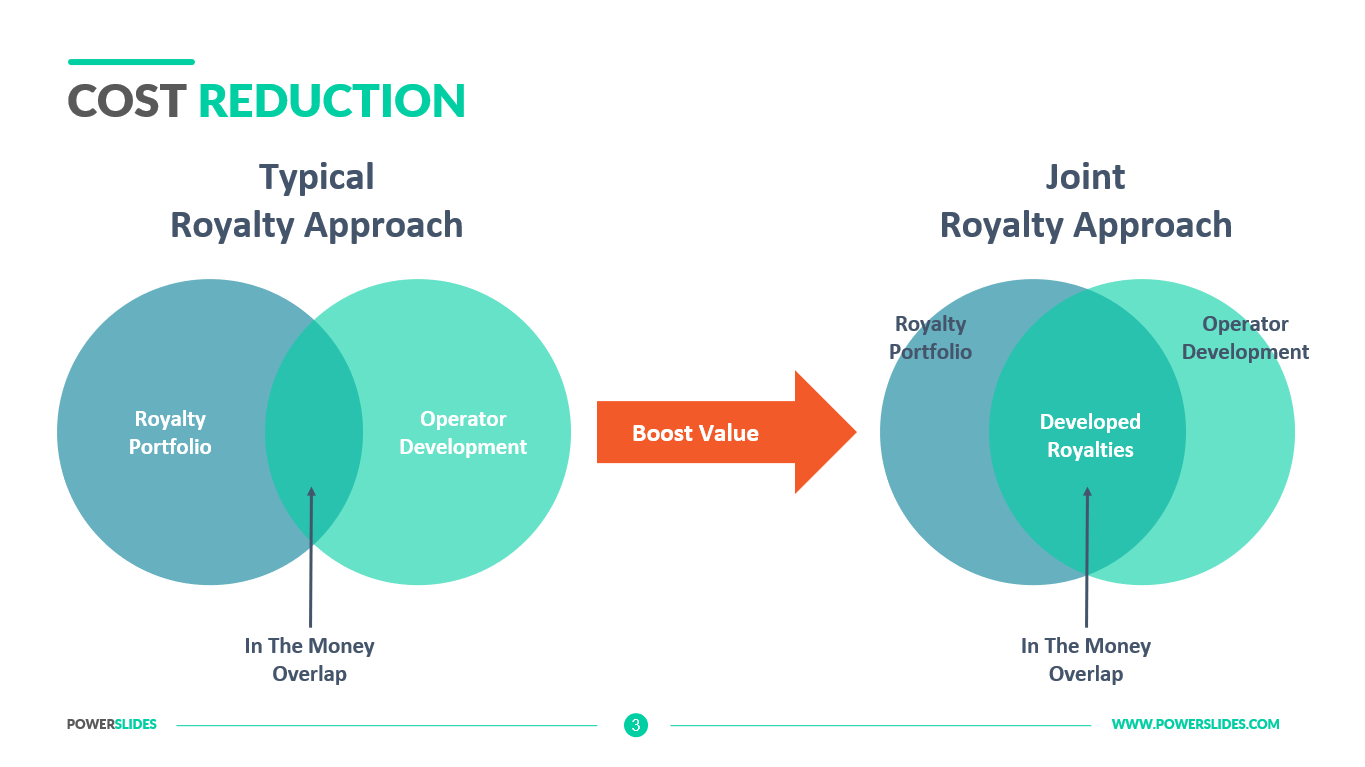
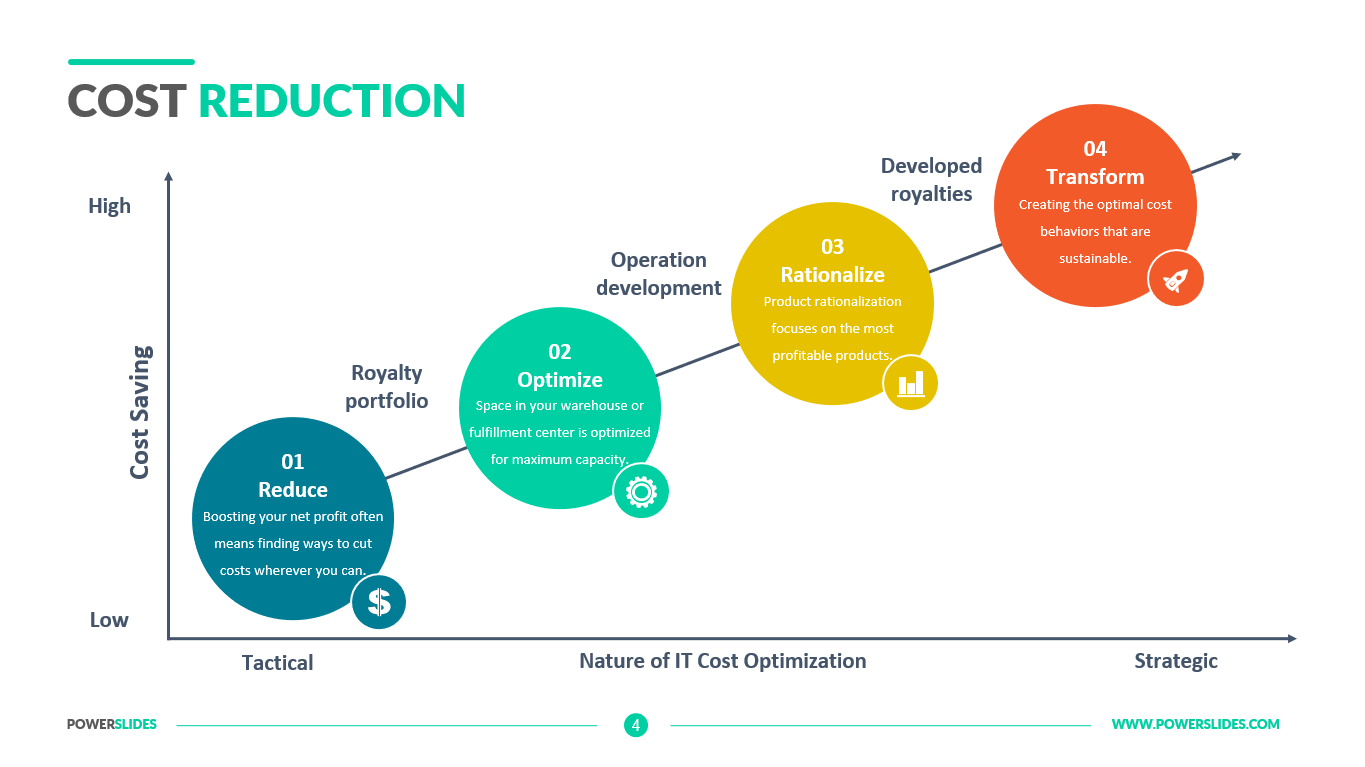
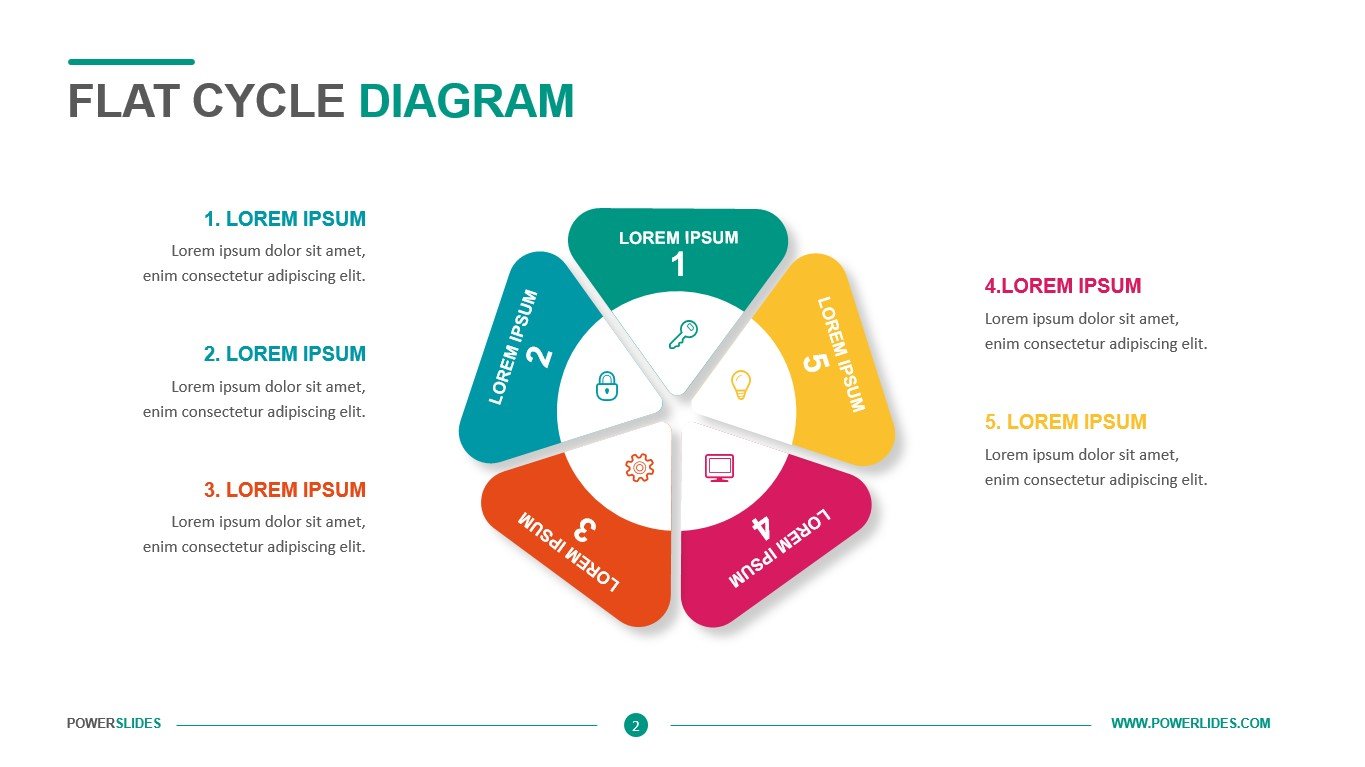
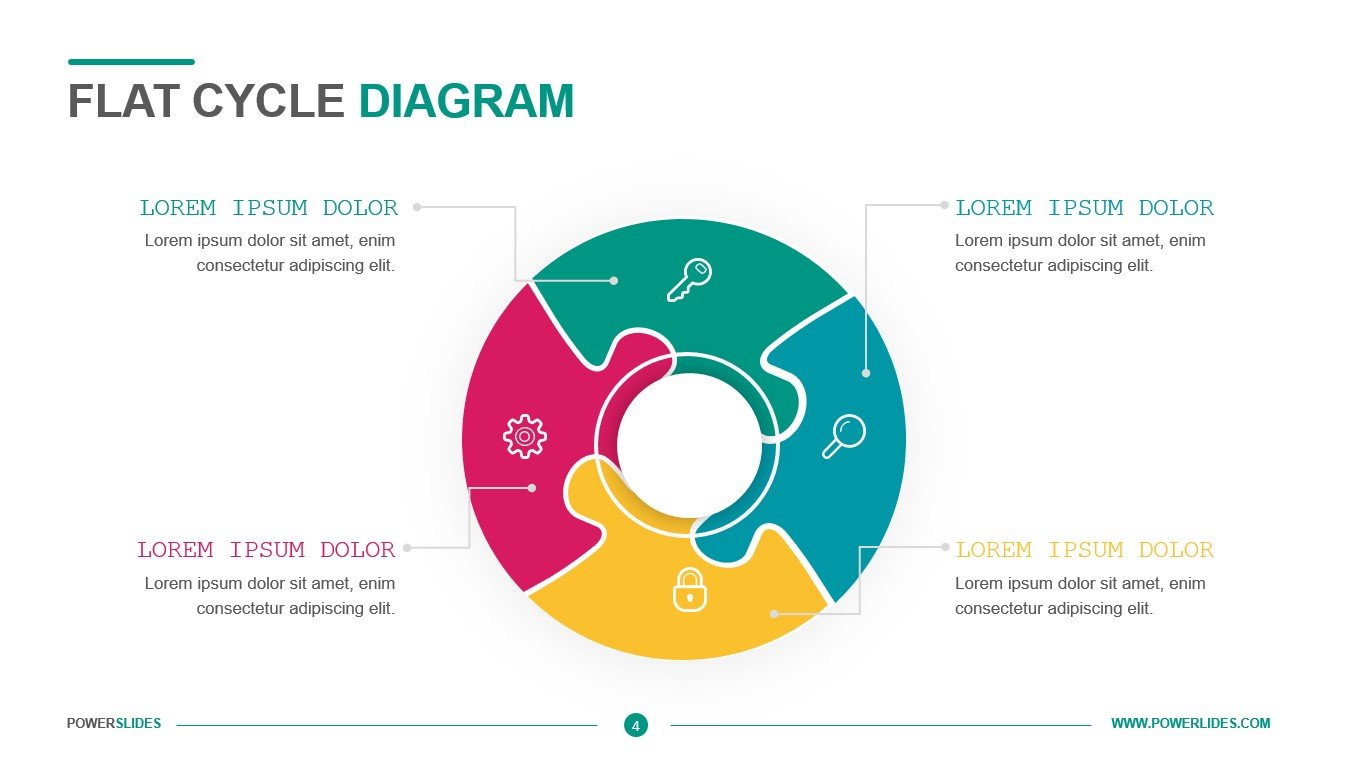
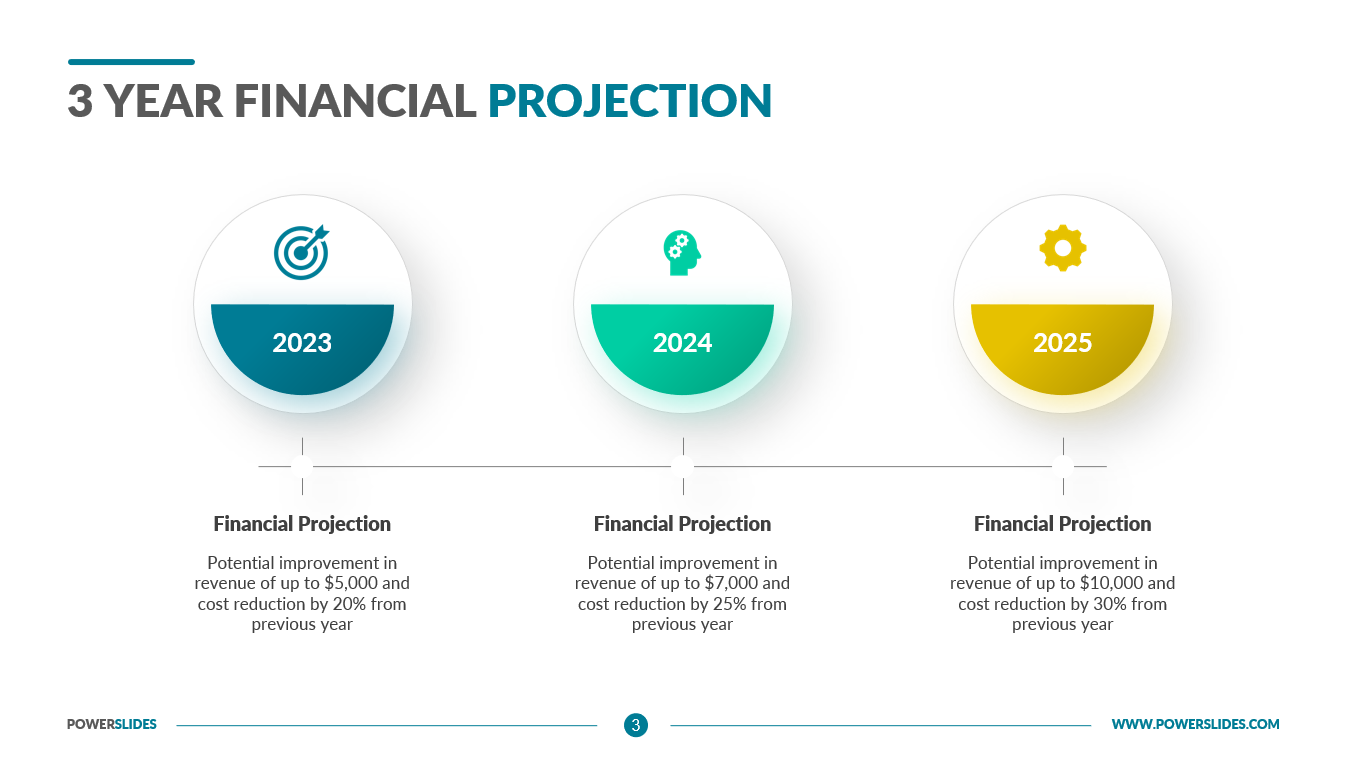
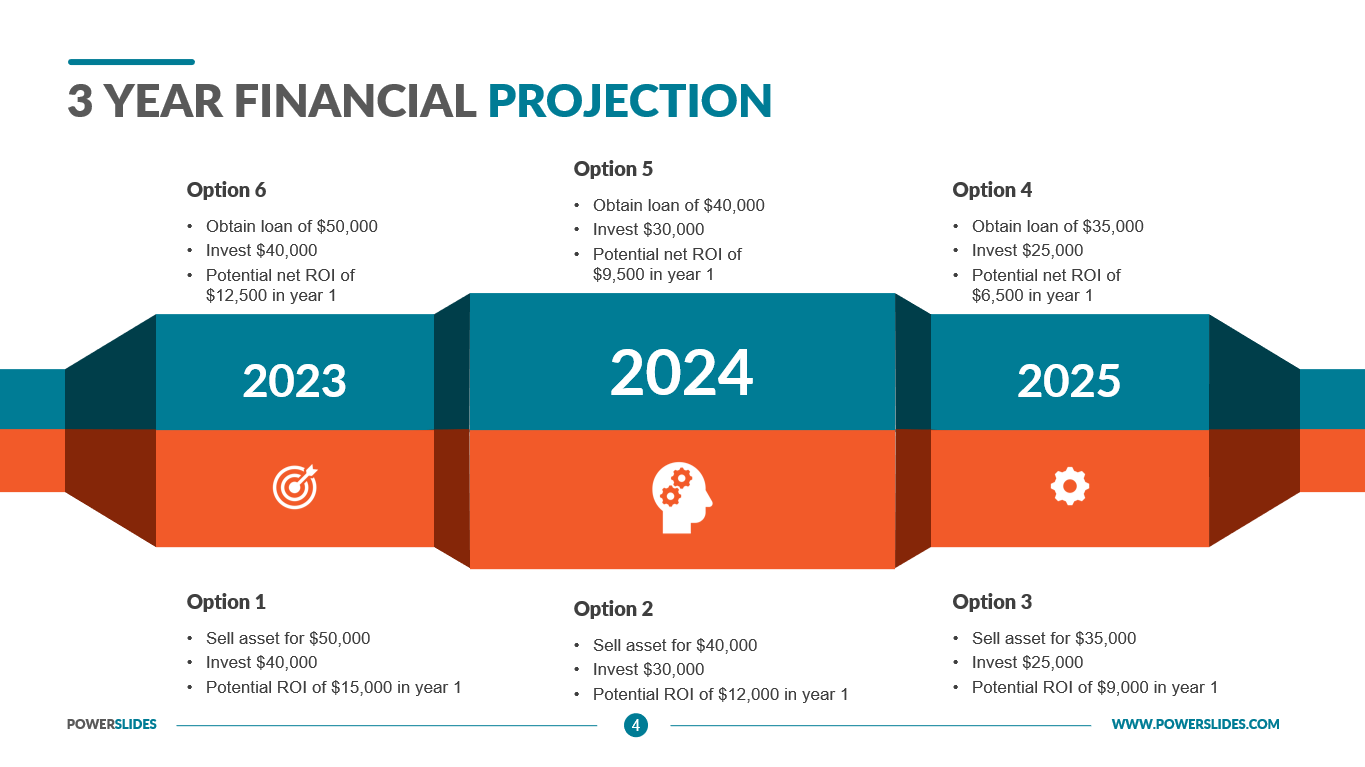
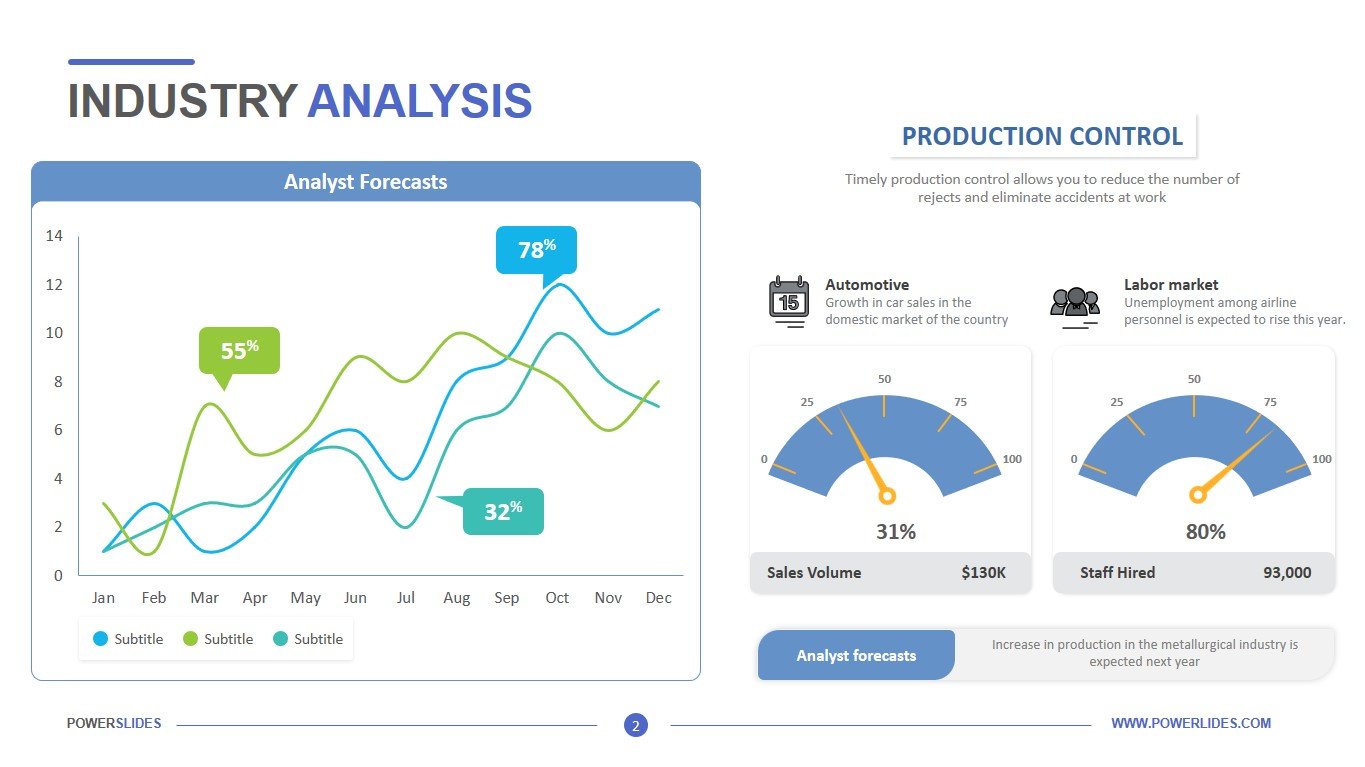
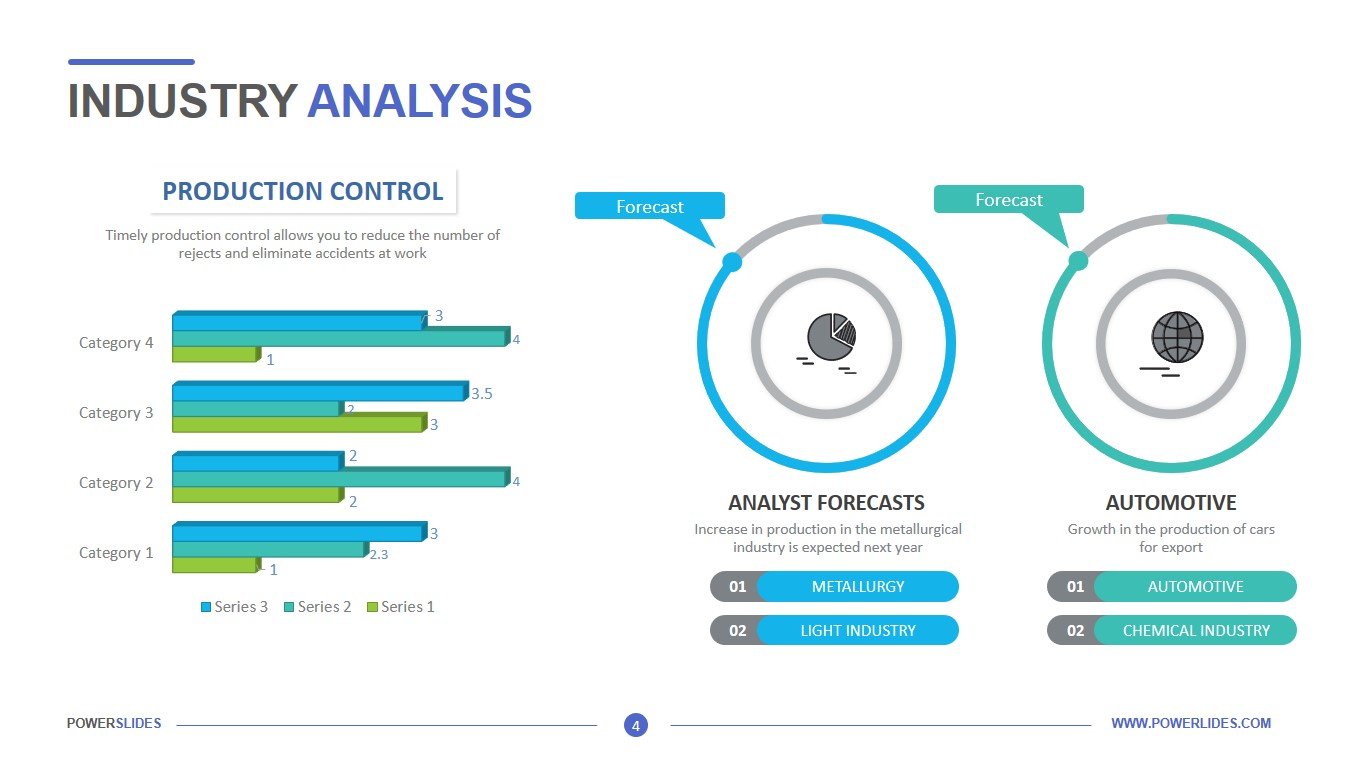
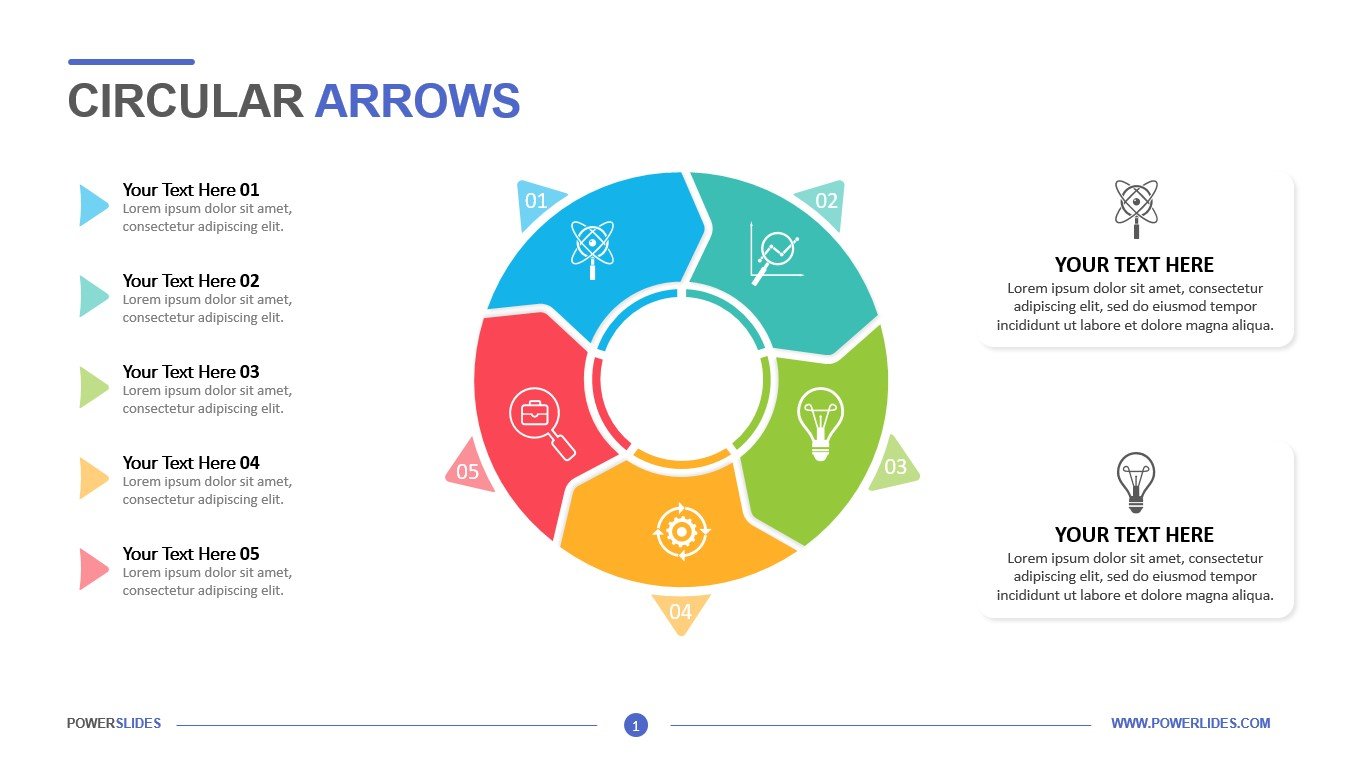
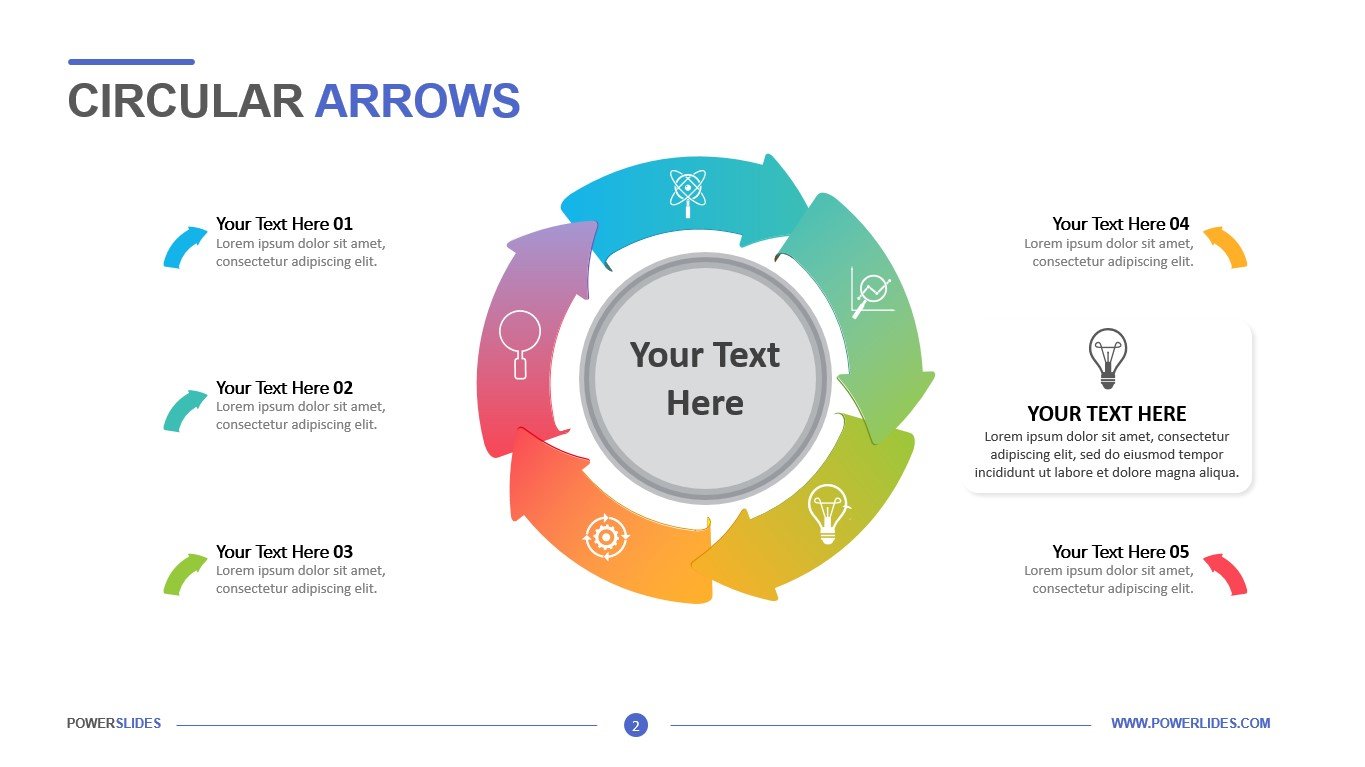
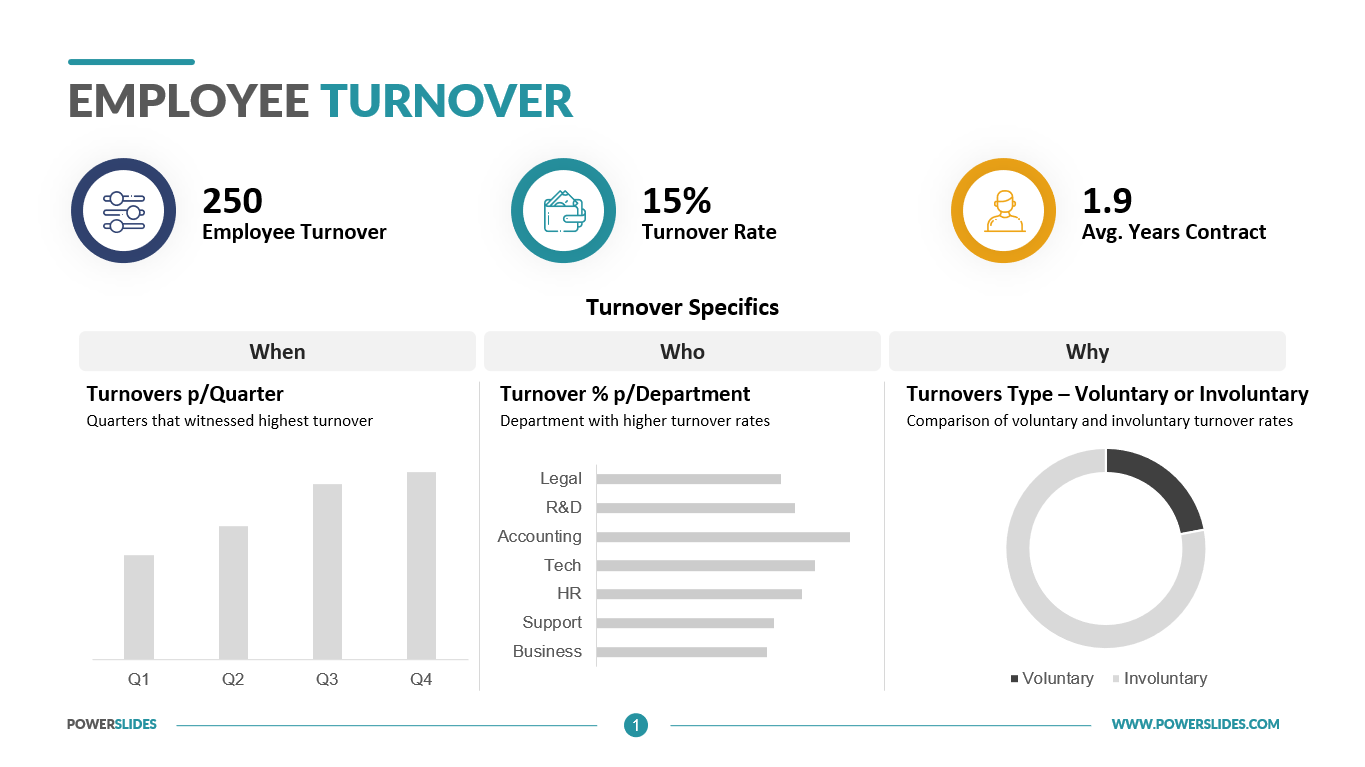
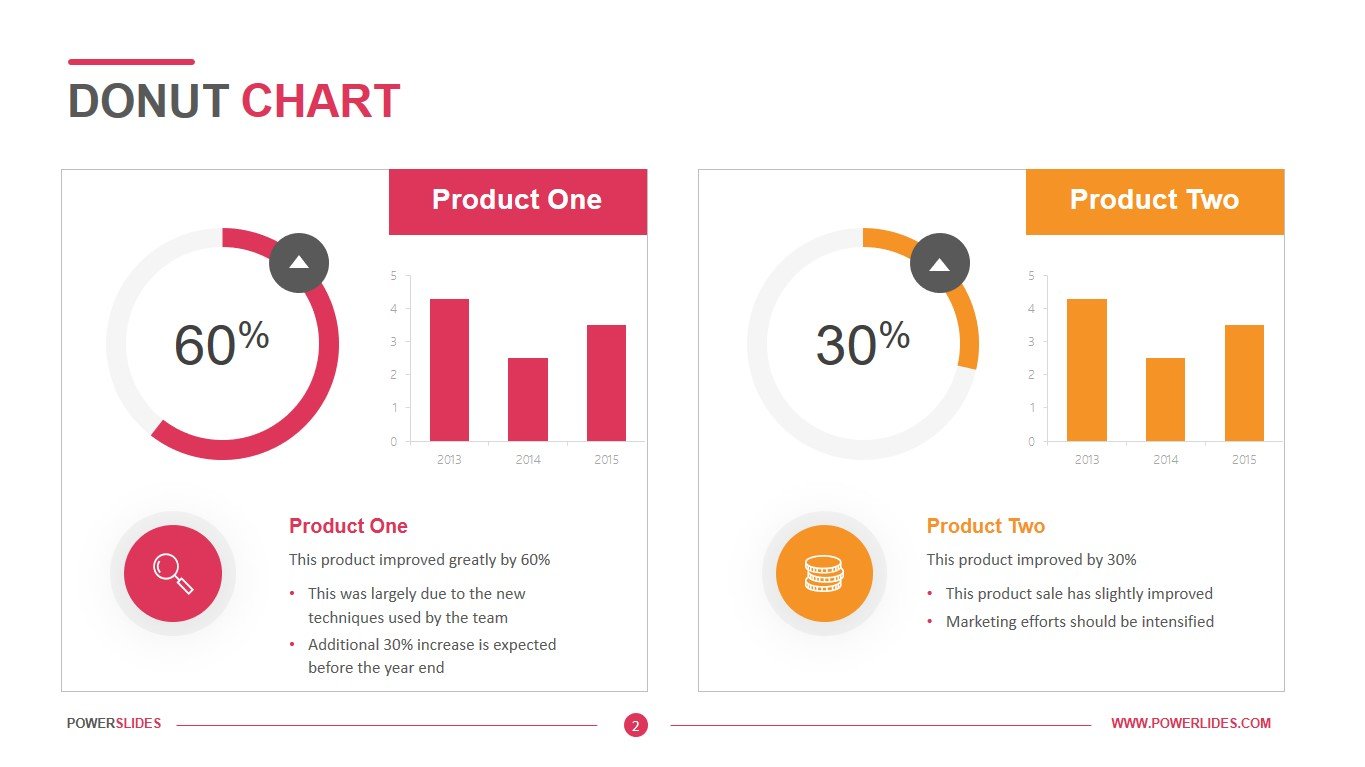
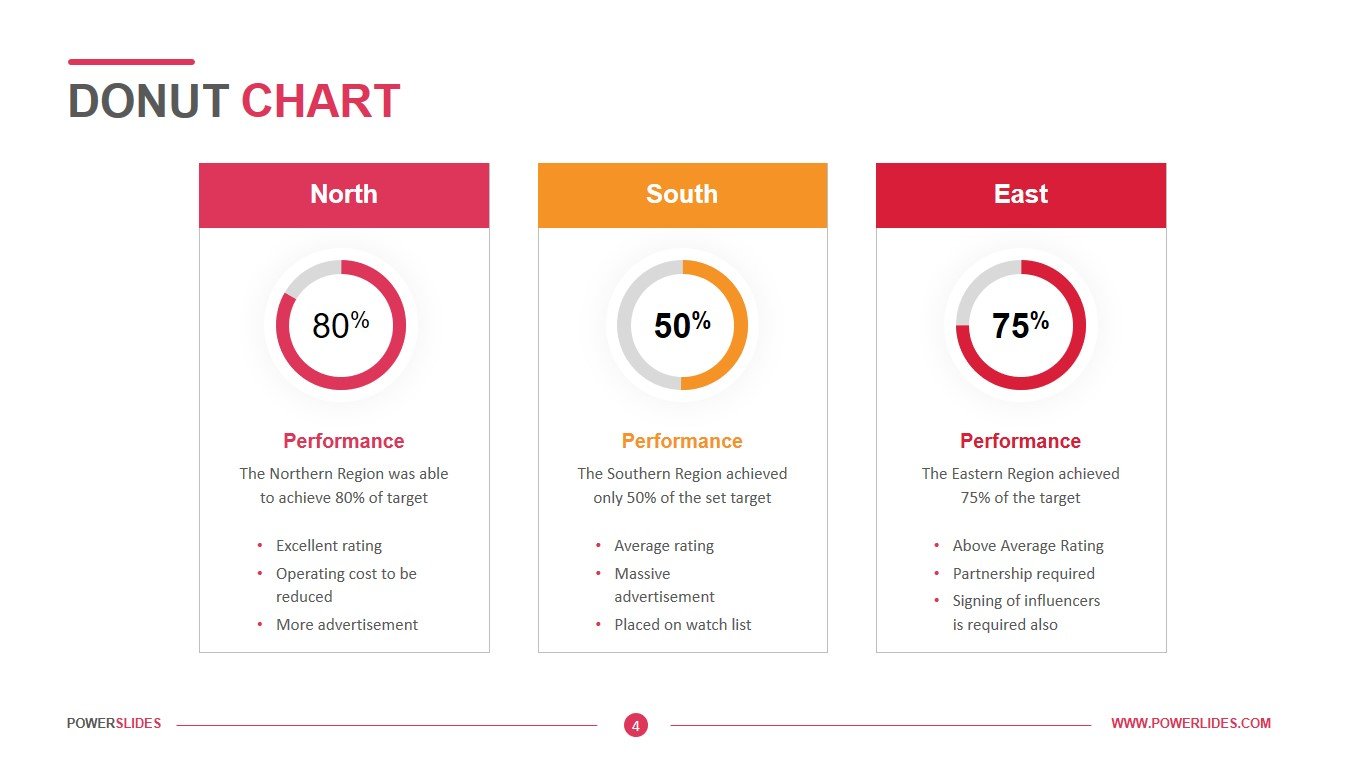
The first slide is presented with the classic Donut Chart. You can display here the sales volumes by region, different types of product costs, the number of office and production personnel. On the left side of the slide, you can describe in detail each part of the diagram. The second slide contains several types of diagrams. On the left side, you can display information that is associated with an increase in indicators, and on the right, information that is associated with a decrease in various indicators. Thus, this slide will be useful in any analysis, and especially when comparing costs and benefits. Also, this slide can be used when planning activities to reduce negative factors and increase the profitability of the project. The next slide will be helpful in analyzing several indicators that need to be presented side by side. For example, salespeople might use this slide when comparing sales across different regions. You can also use this slide in preparing information about the employee and his basic skills. Marketers can use this slide when preparing a report on the effectiveness of the use of advertising in various channels (social media advertising, television, magazine advertising). The last slide presents the data in three blocks. In each block, you can specify the percentage of completion and give a short description of the task. For example, this slide can be used to provide information on the readiness of projects that are being worked on in parallel. You can use this slide when competing between sales teams or software developers’ teams.
Donut Chart template contains modern and stylish infographics. The template’s color scheme makes slides memorable and immediately grabs the audience’s attention. Each of the slides in this template is easily customizable to suit your requirements. You can change the color to suit your current presentation so that the added slides complement presentation harmoniously. Also, you can move blocks with text and change the font size. Business analysts should definitely have this template in their presentation collection. They can use the template to create profit and loss statements, analyze product costs, stock returns, and analyze the demand for various product groups. HR managers can also use this template when preparing data on the number of employees in various branches of the company. Donut Chart template will take its rightful place in your collection of templates.


