Break Even Analysis
What do you think of this template?

 (3.00/ 5)
6 ratings

 4 Slides
 File size: 16:9
 Fonts: Lato Black, Calibri
 Supported version
PPT 2010, PPT 2013, PPT 2016
Supported version
PPT 2010, PPT 2013, PPT 2016

Product details
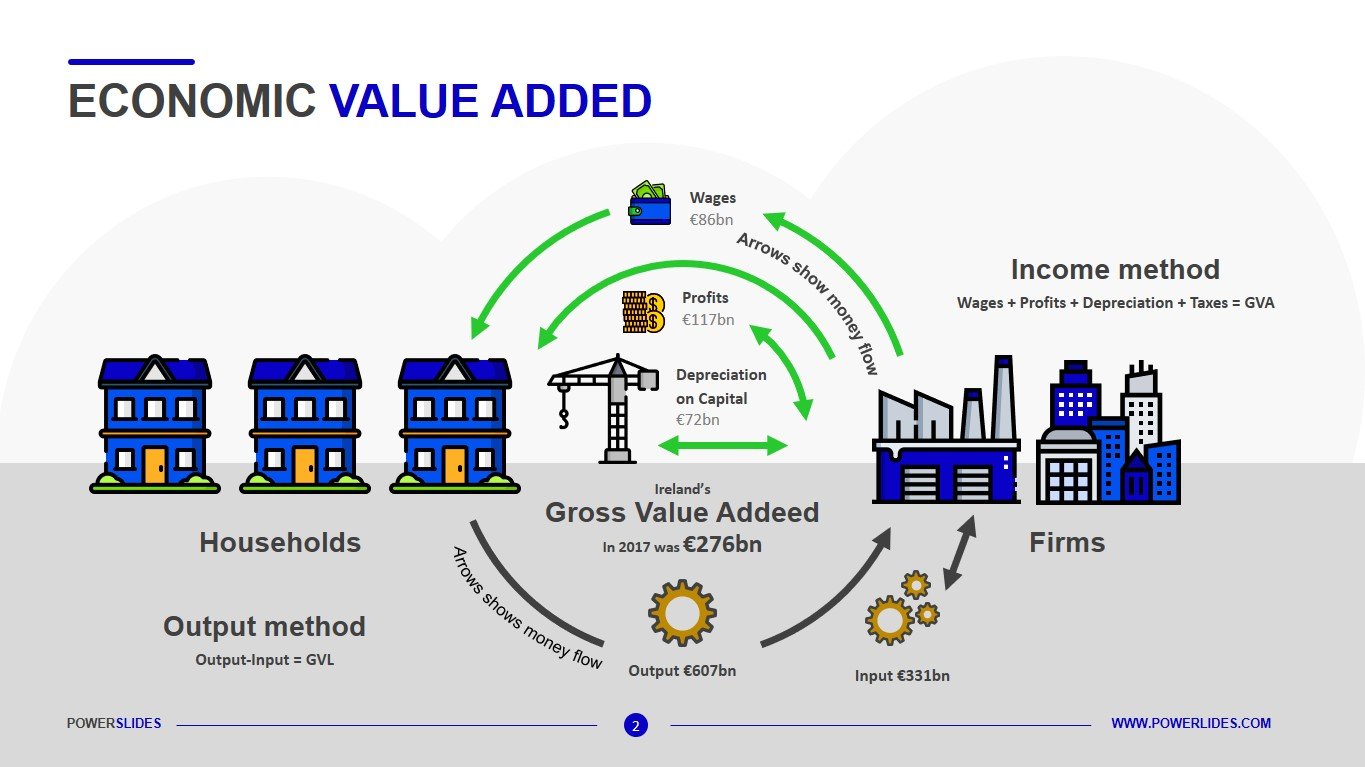
Break-even analysis entails the calculation and examination of the margin of safety for an entity based on the revenues collected and associated costs. Analyzing different price levels a business uses break-even analysis to determine what level of sales are necessary to cover the company’s total fixed costs. A demand-side analysis would give a seller significant insight regarding selling capabilities. Break-even analysis is useful in the determination of the level of production or a targeted desired sales mix. The break-even point is calculated by dividing the total fixed costs of production by the price of a product per individual unit less the variable costs of production. Fixed costs are those which remain the same regardless of how many units are sold. Break-even analysis looks at the level of fixed costs relative to the profit earned by each additional unit produced and sold. In general, a company with lower fixed costs will have a lower break-even point of sale. Break-even analysis is also used by investors to determine at what price they will break even on a trade or investment. The calculation is useful when trading in or creating a strategy to buy options or a fixed-income security product. The calculation of break-even analysis may use two equations. In the first calculation, divide the total fixed costs by the unit contribution margin. Alternatively, the calculation for a break-even point in sales dollars happens by dividing the total fixed costs by the contribution margin ratio. The contribution margin ratio is the contribution margin per unit divided by the sale price.
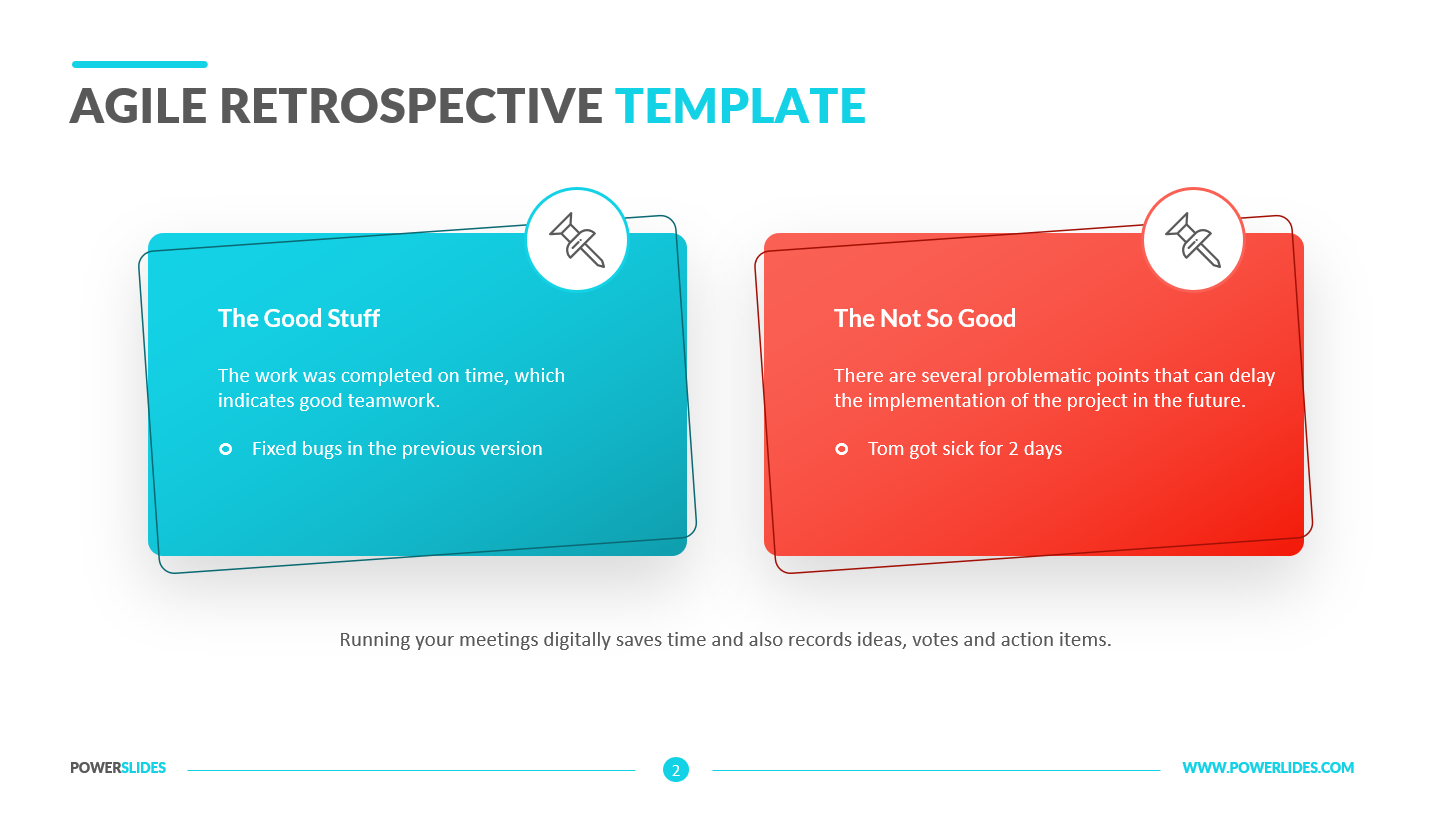
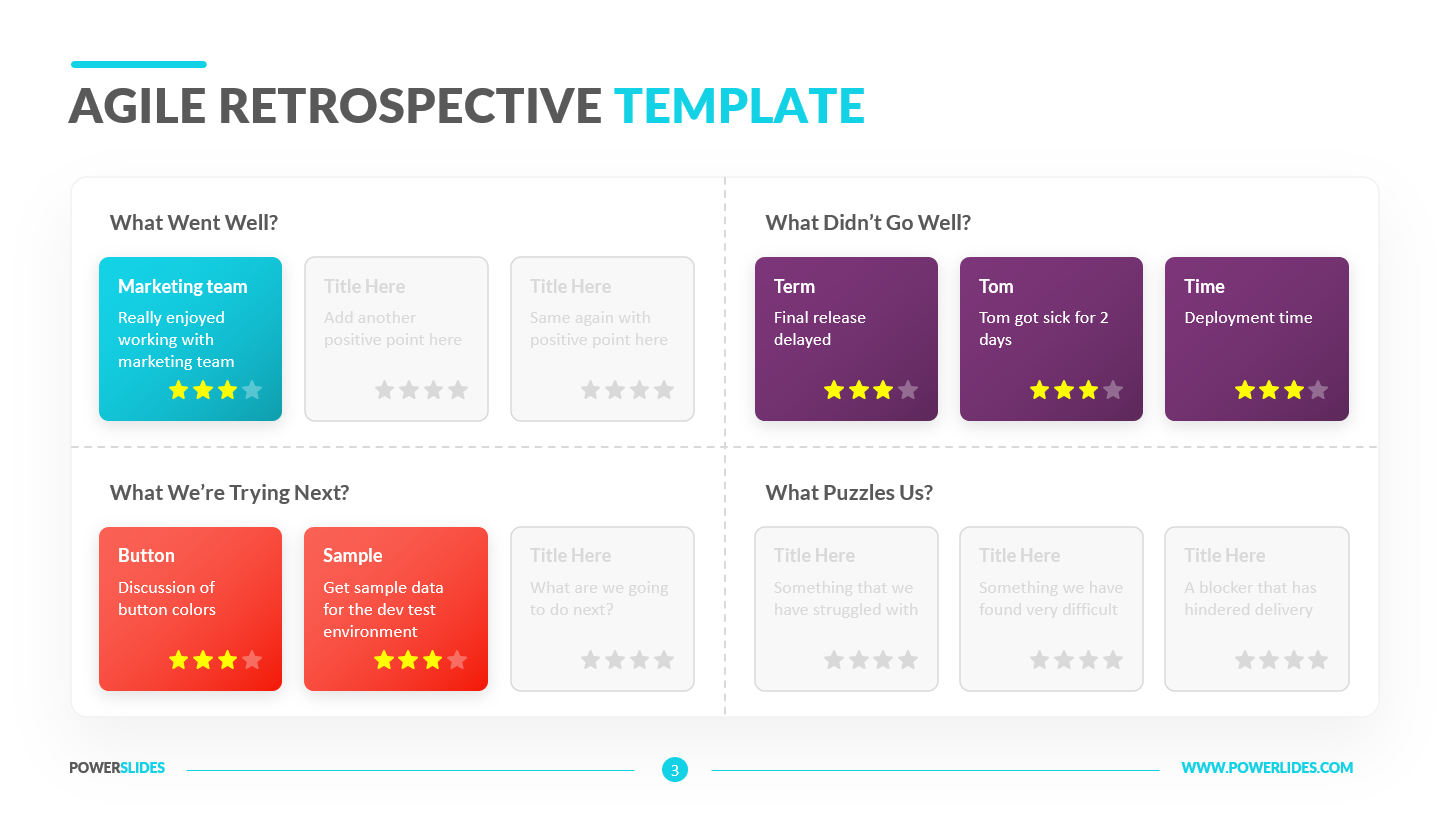
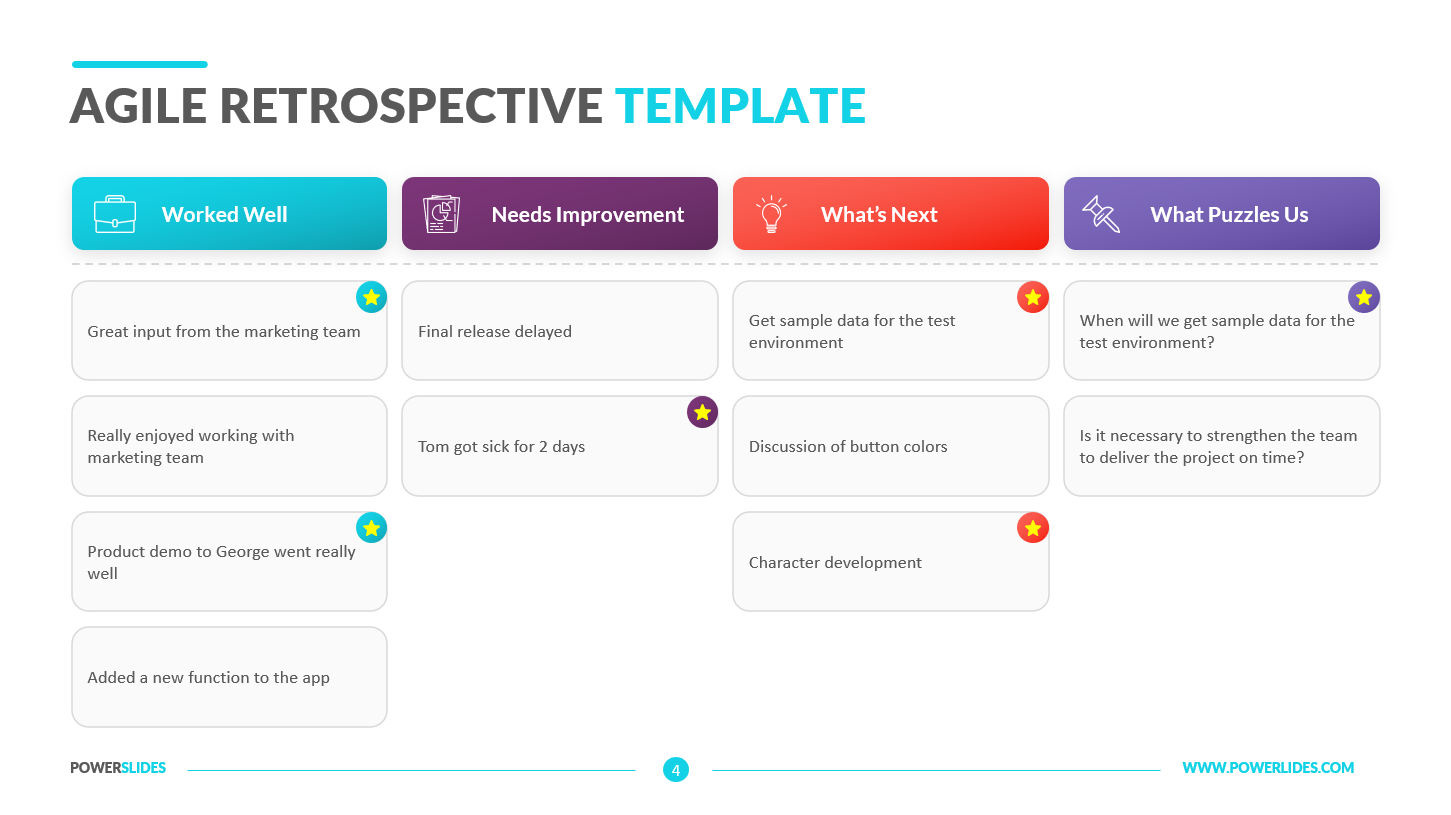
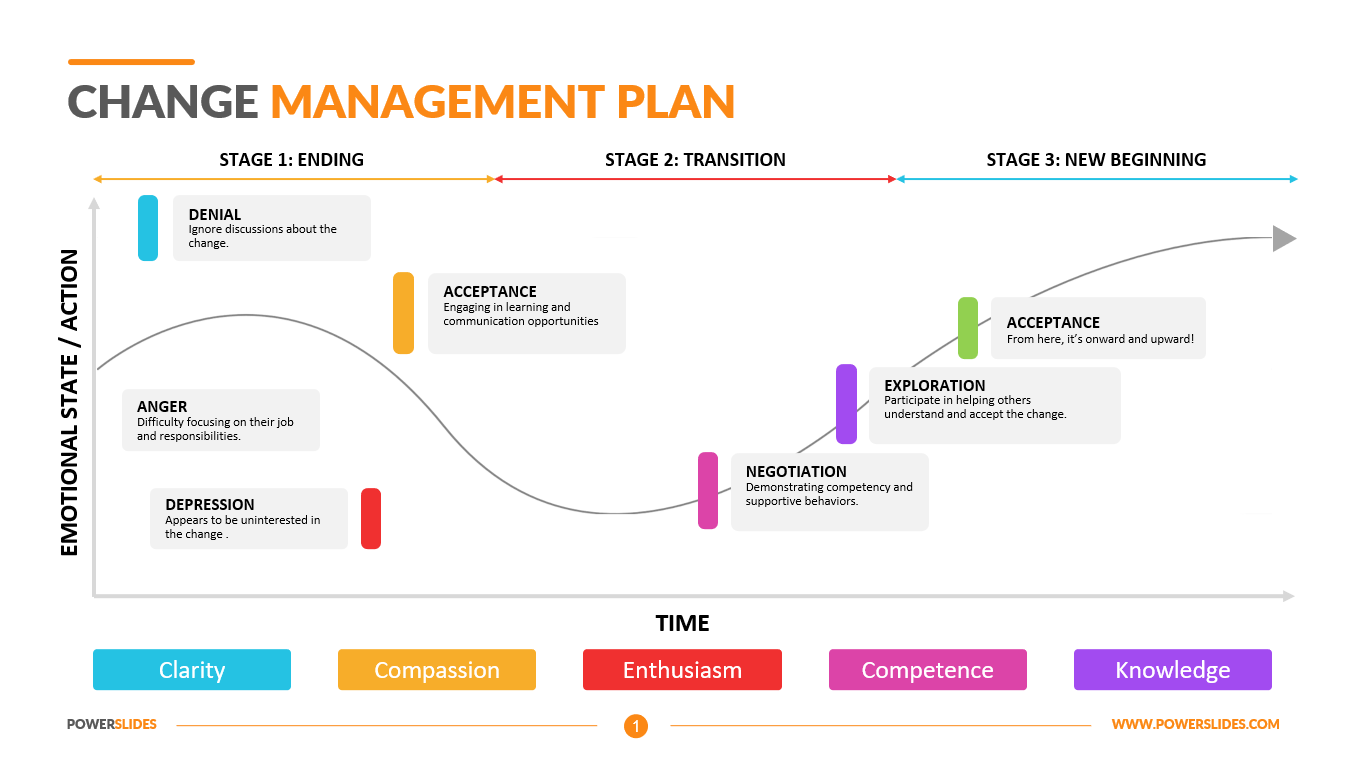
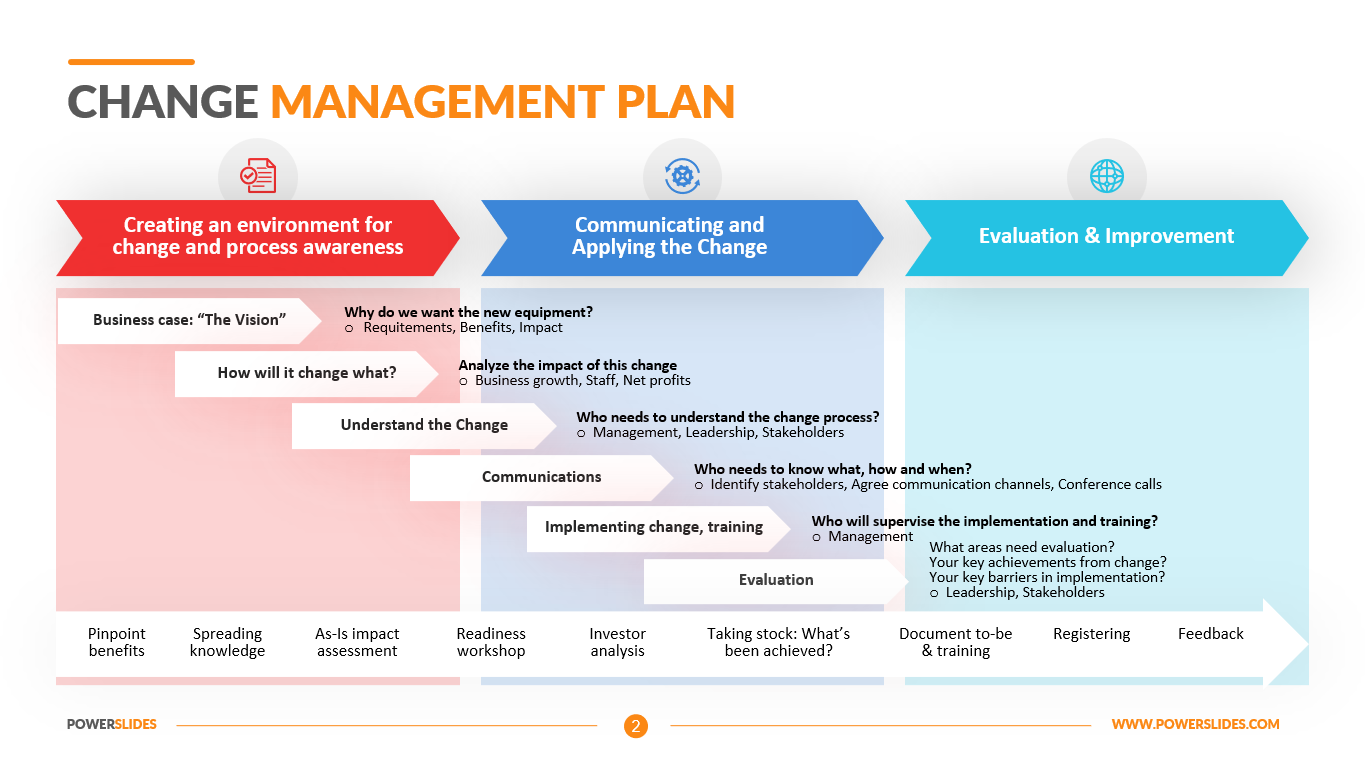
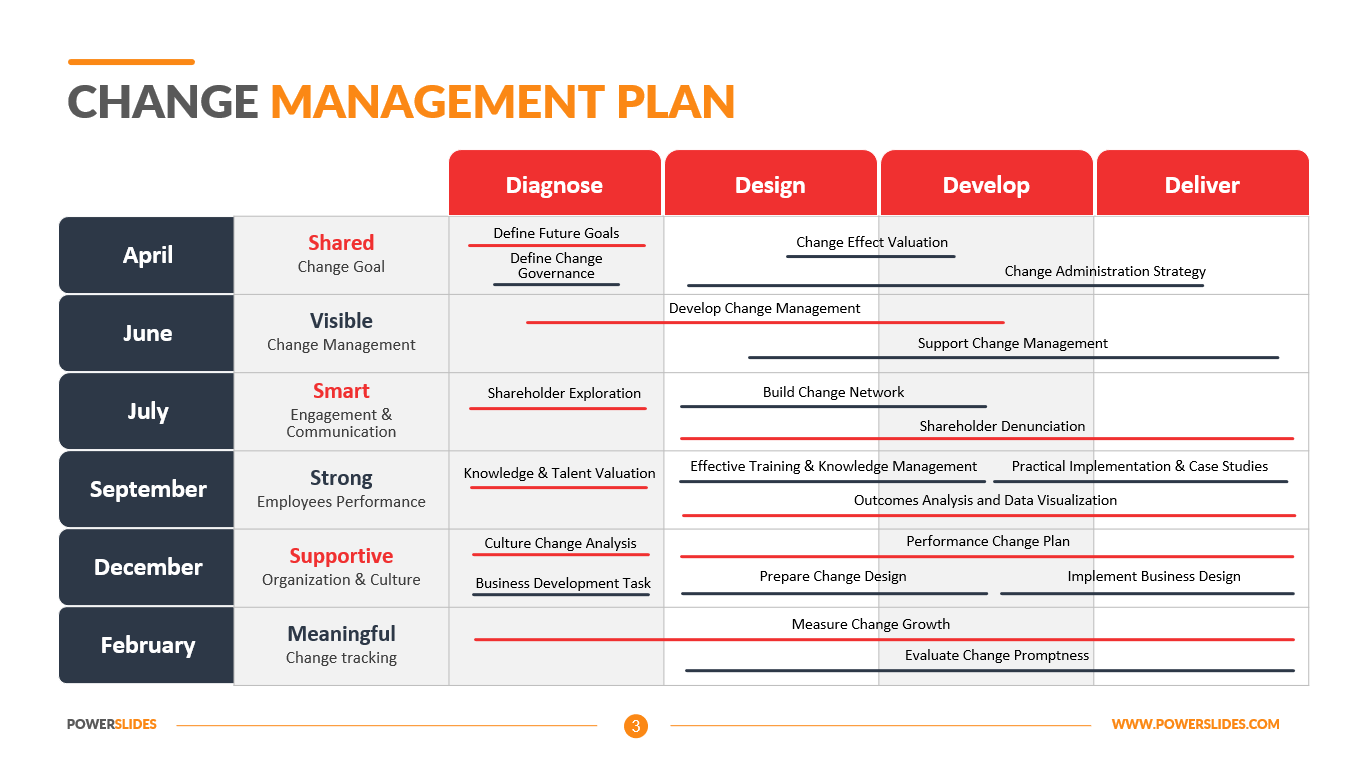
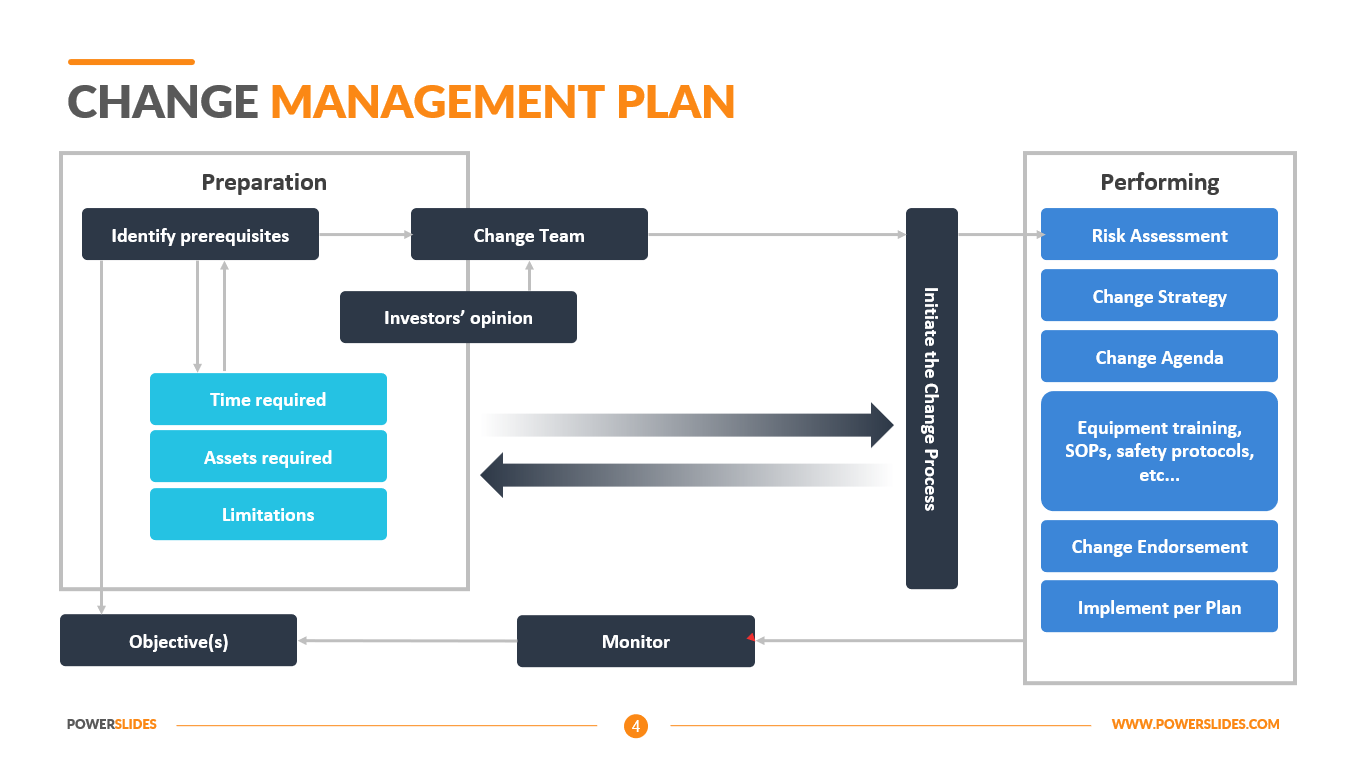
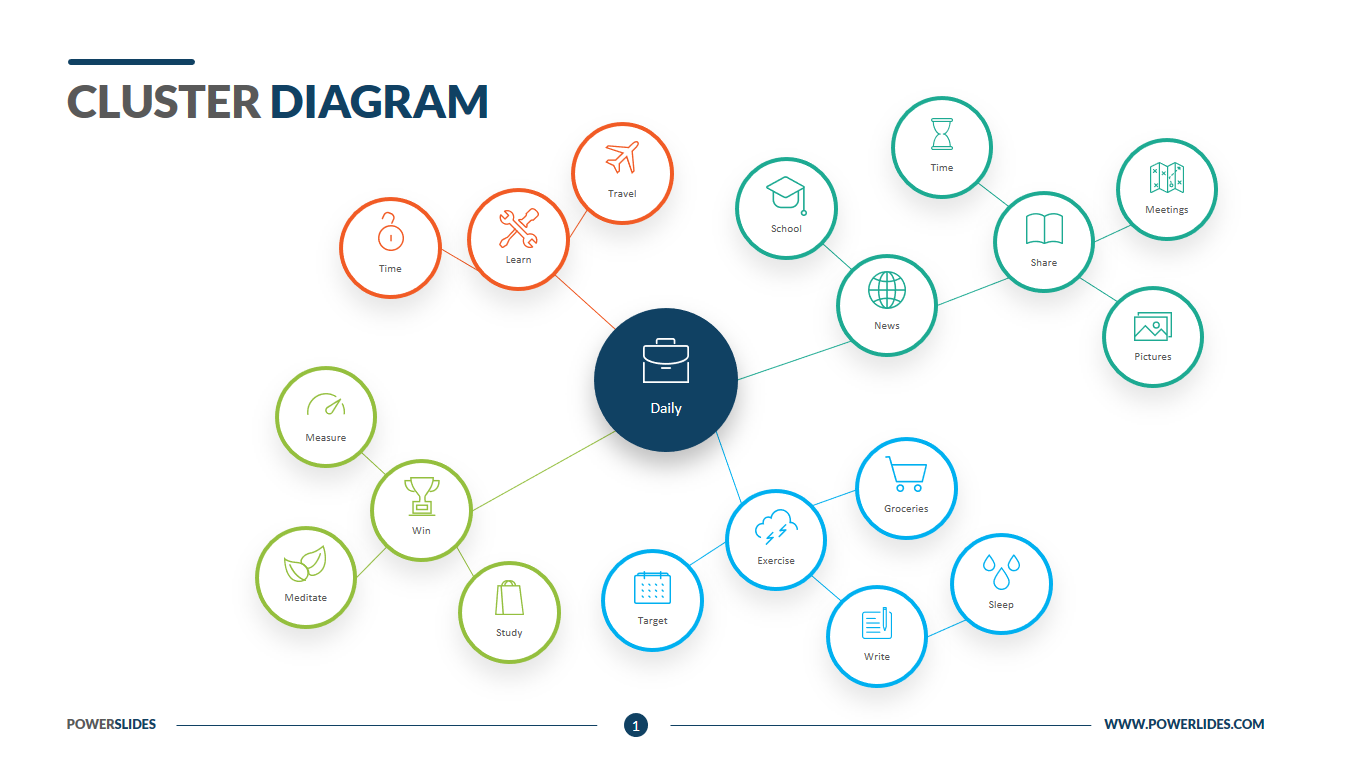
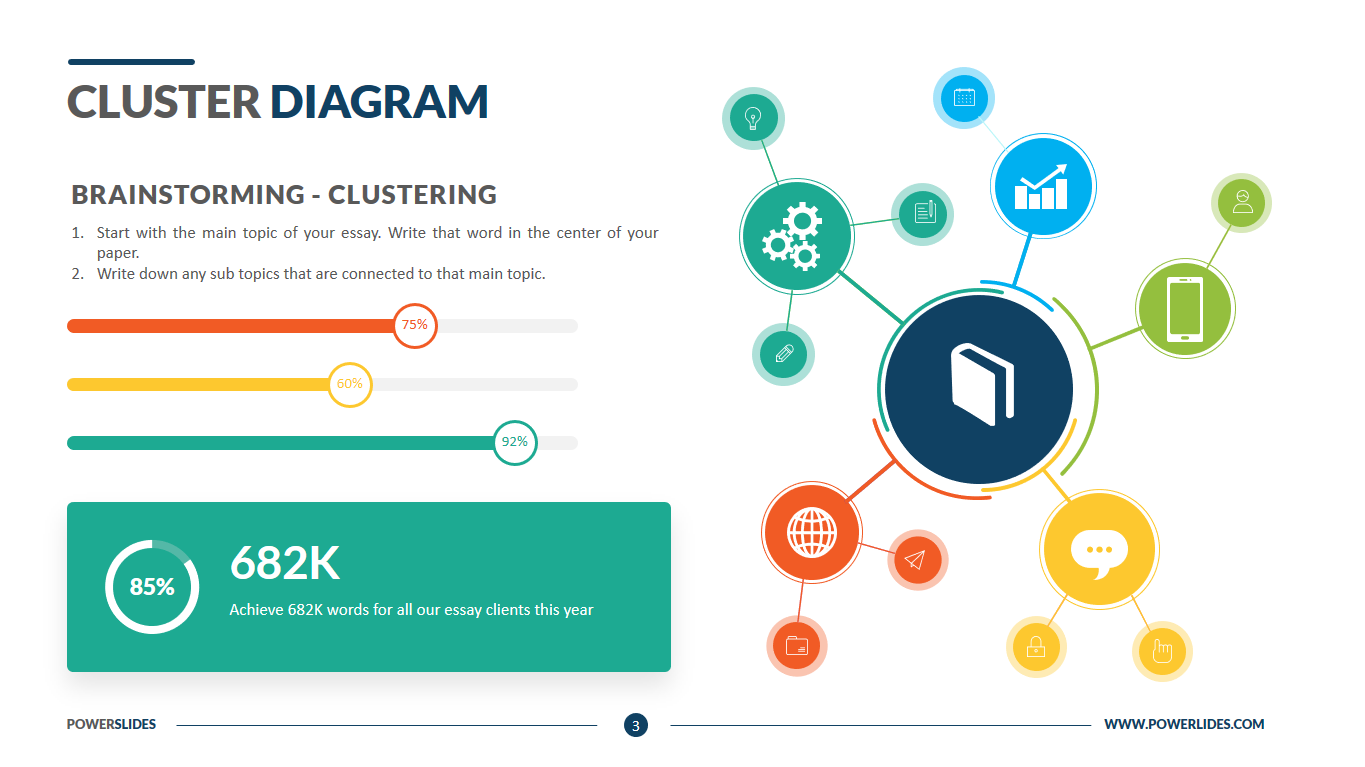
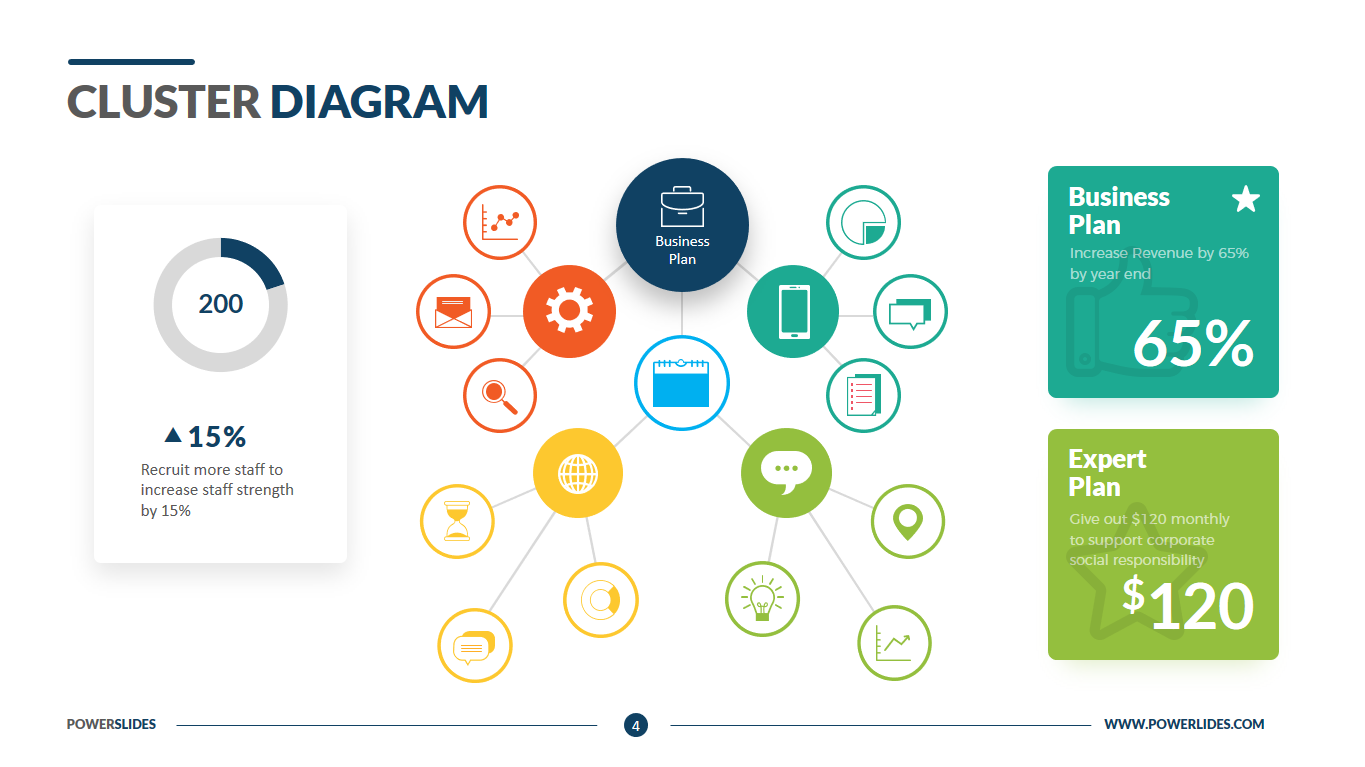
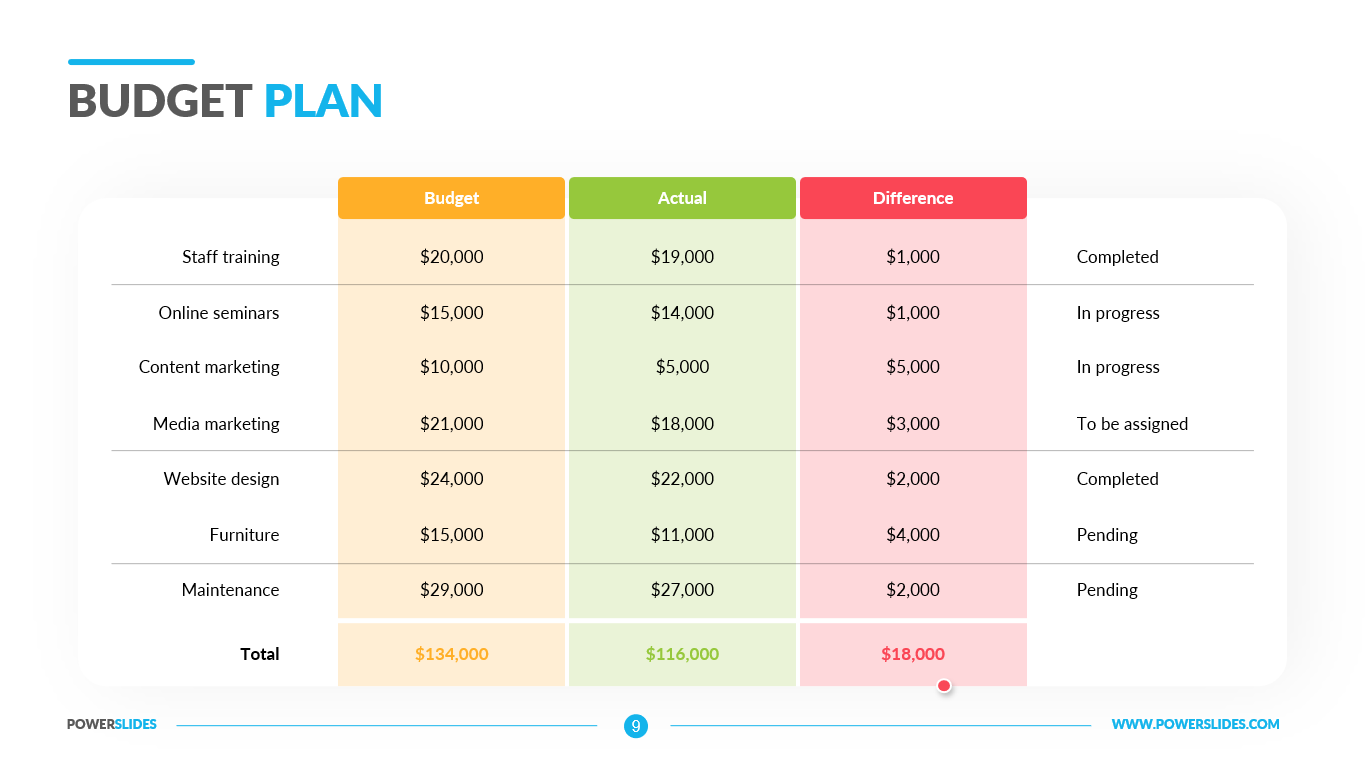
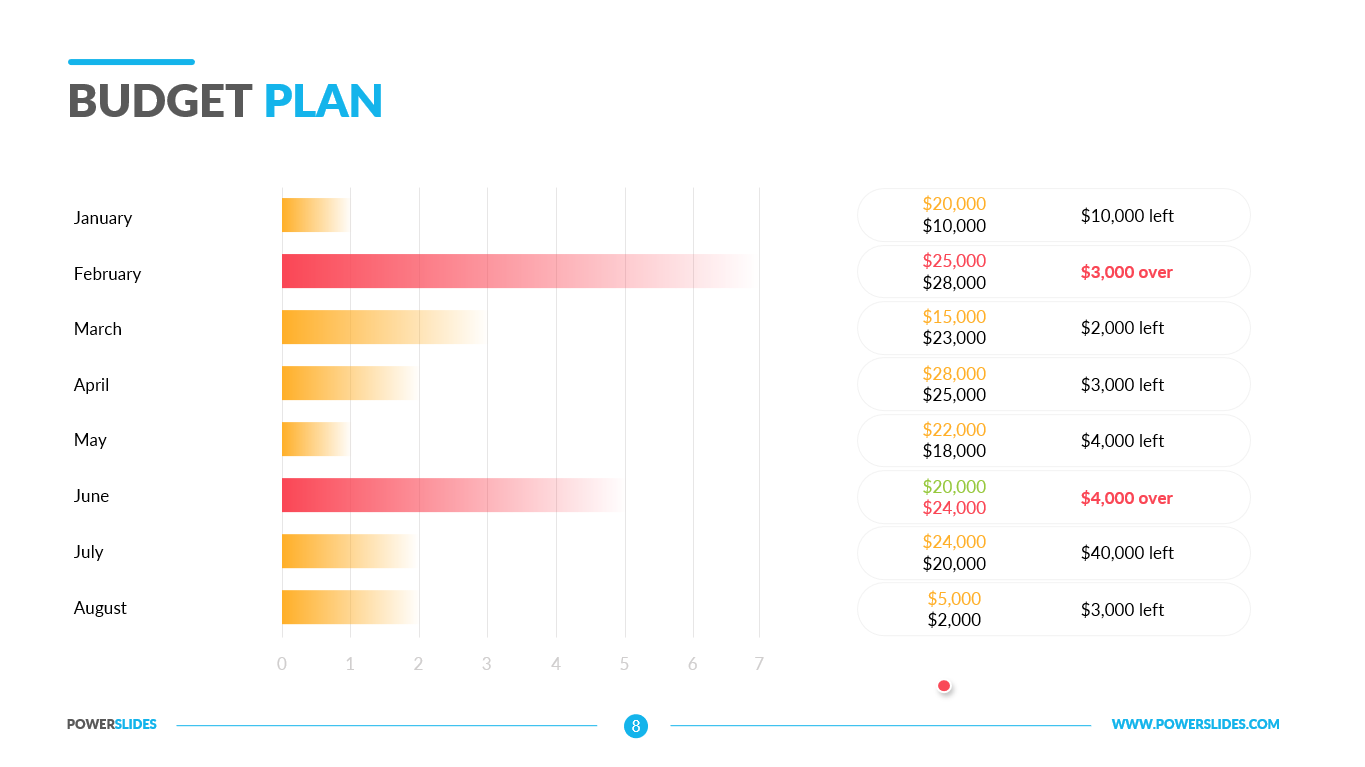
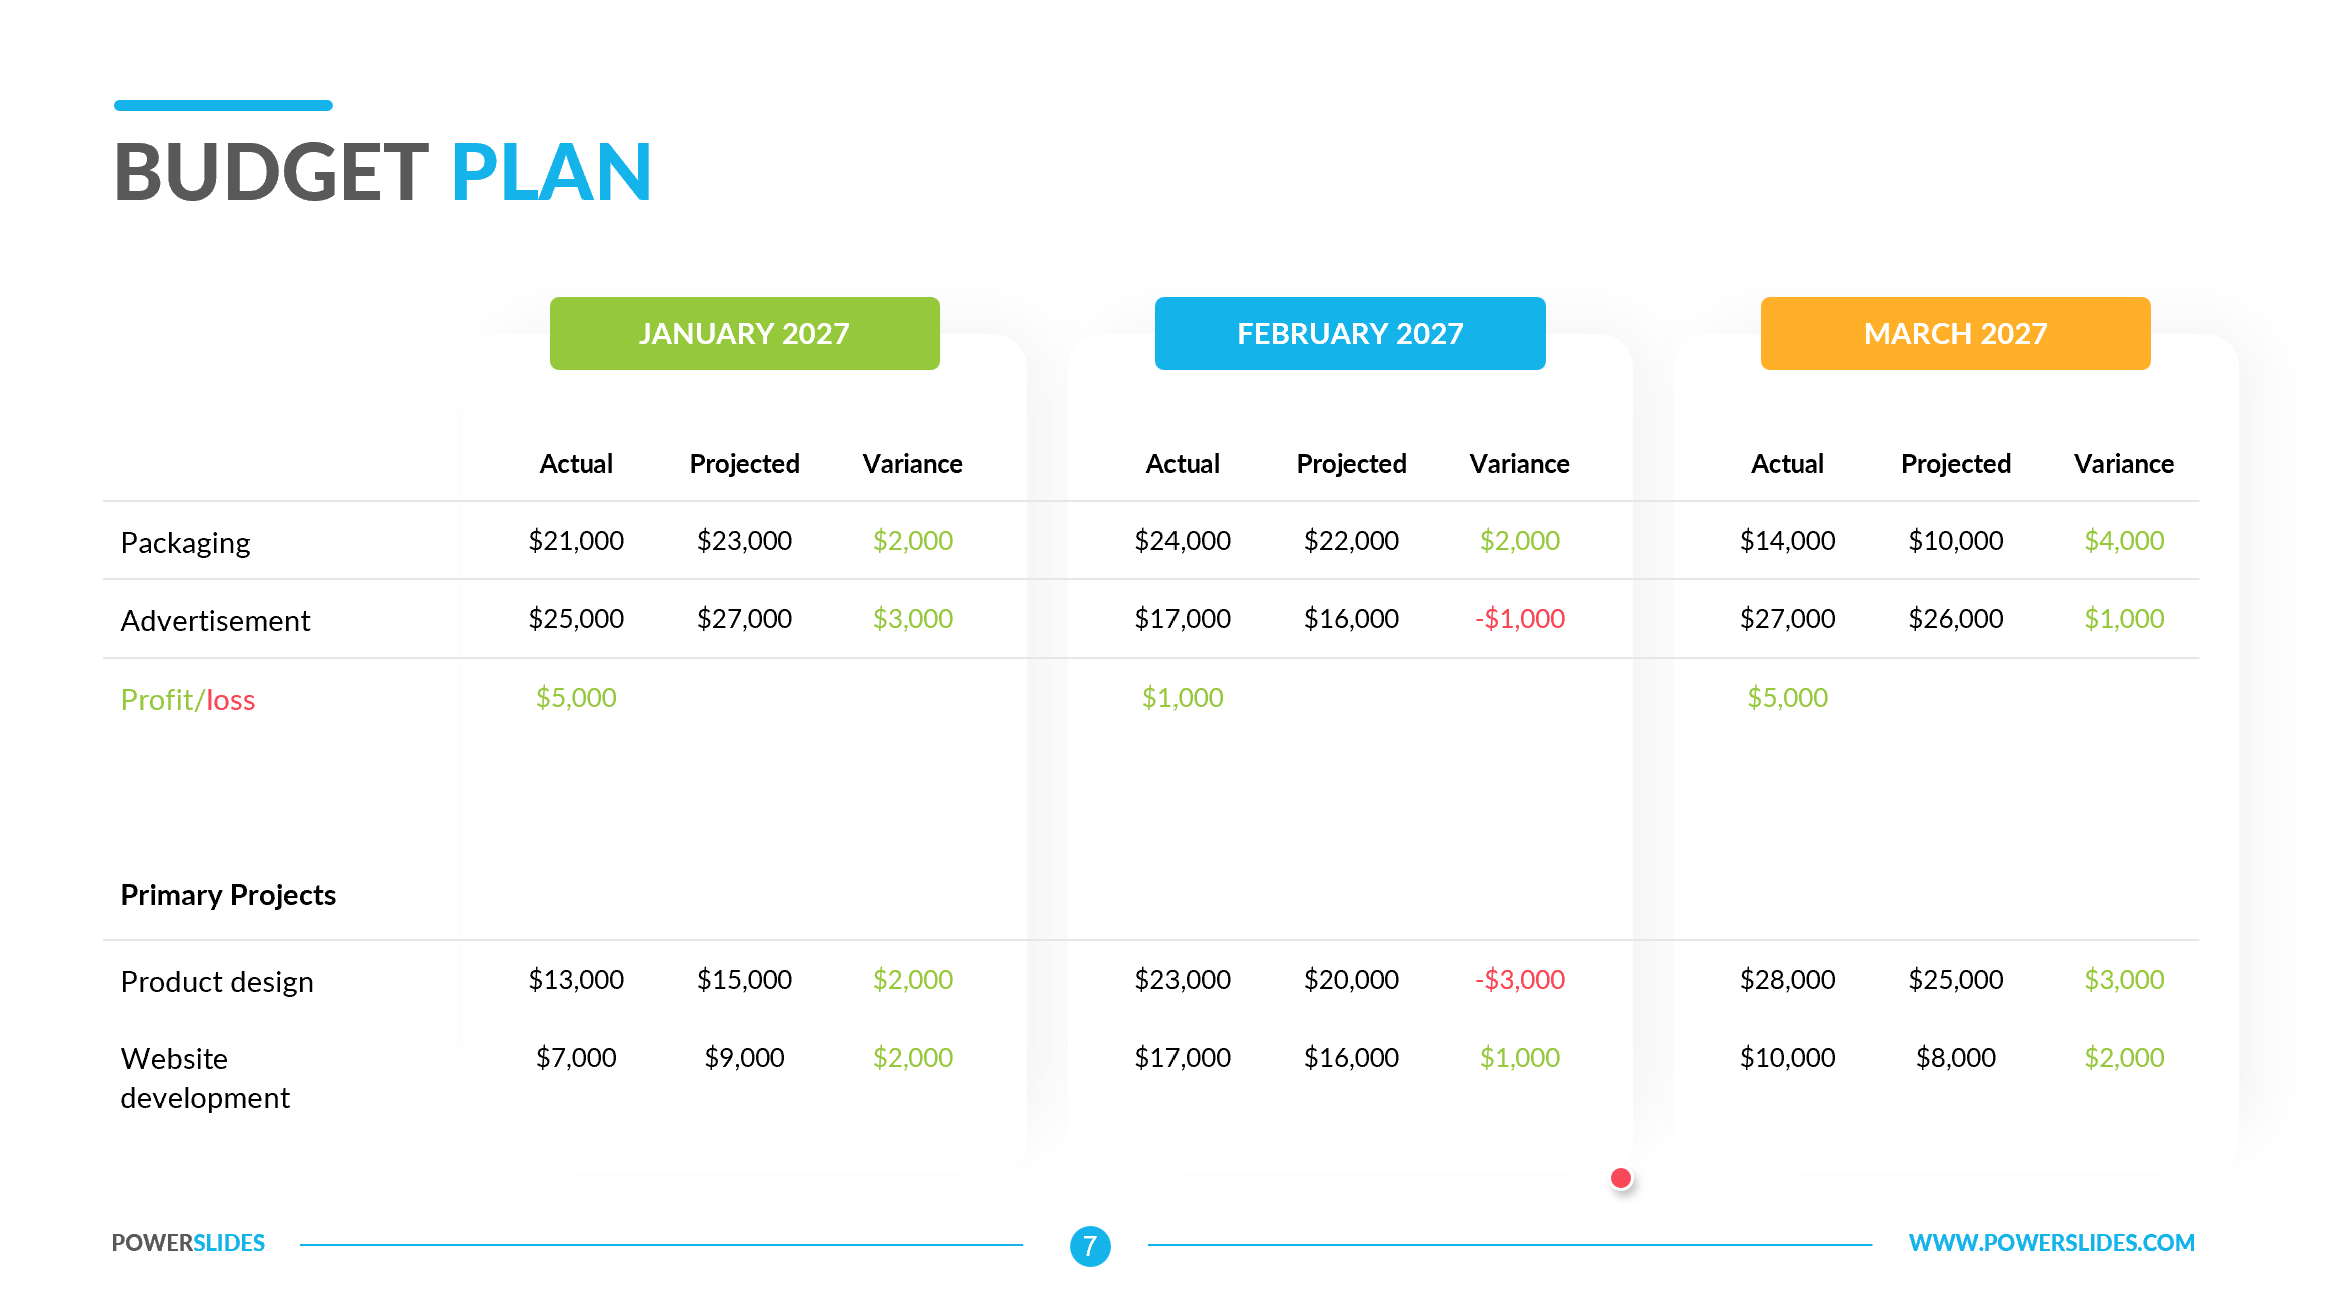
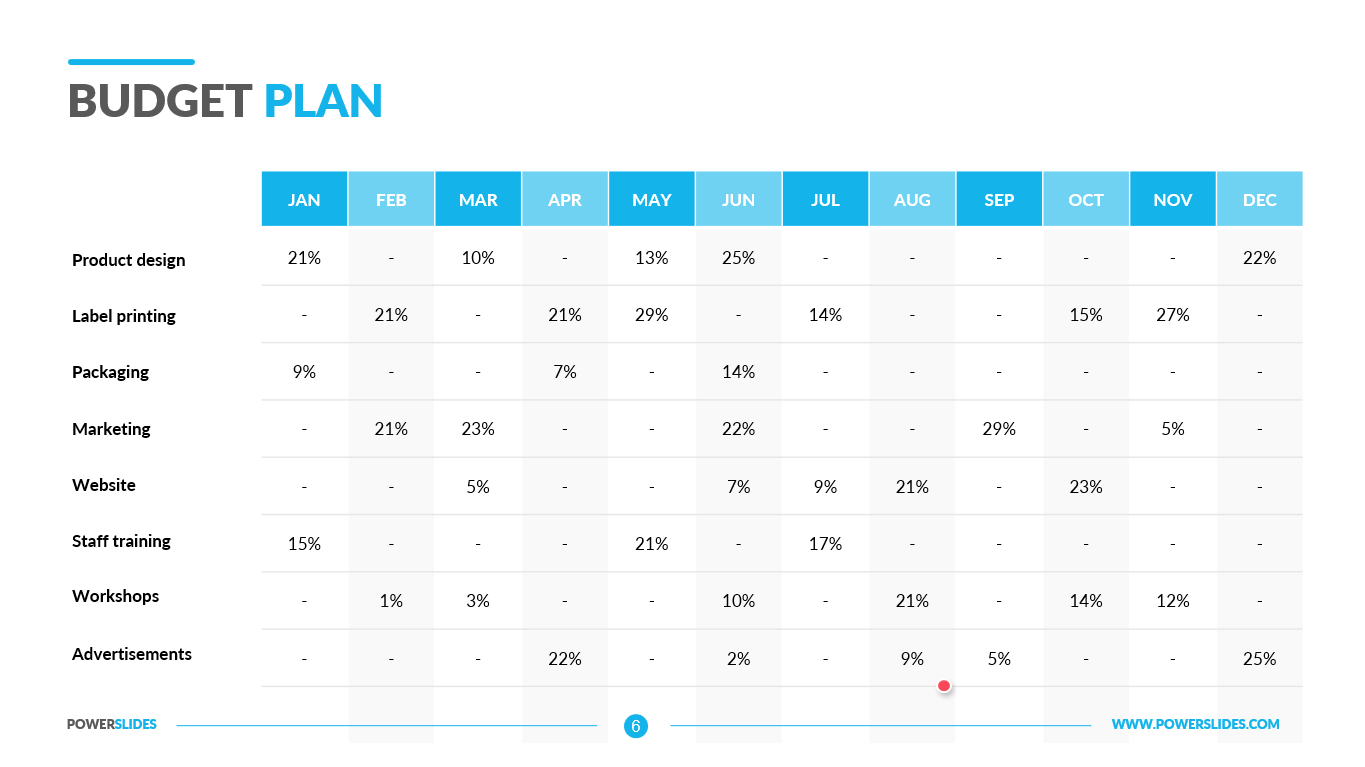
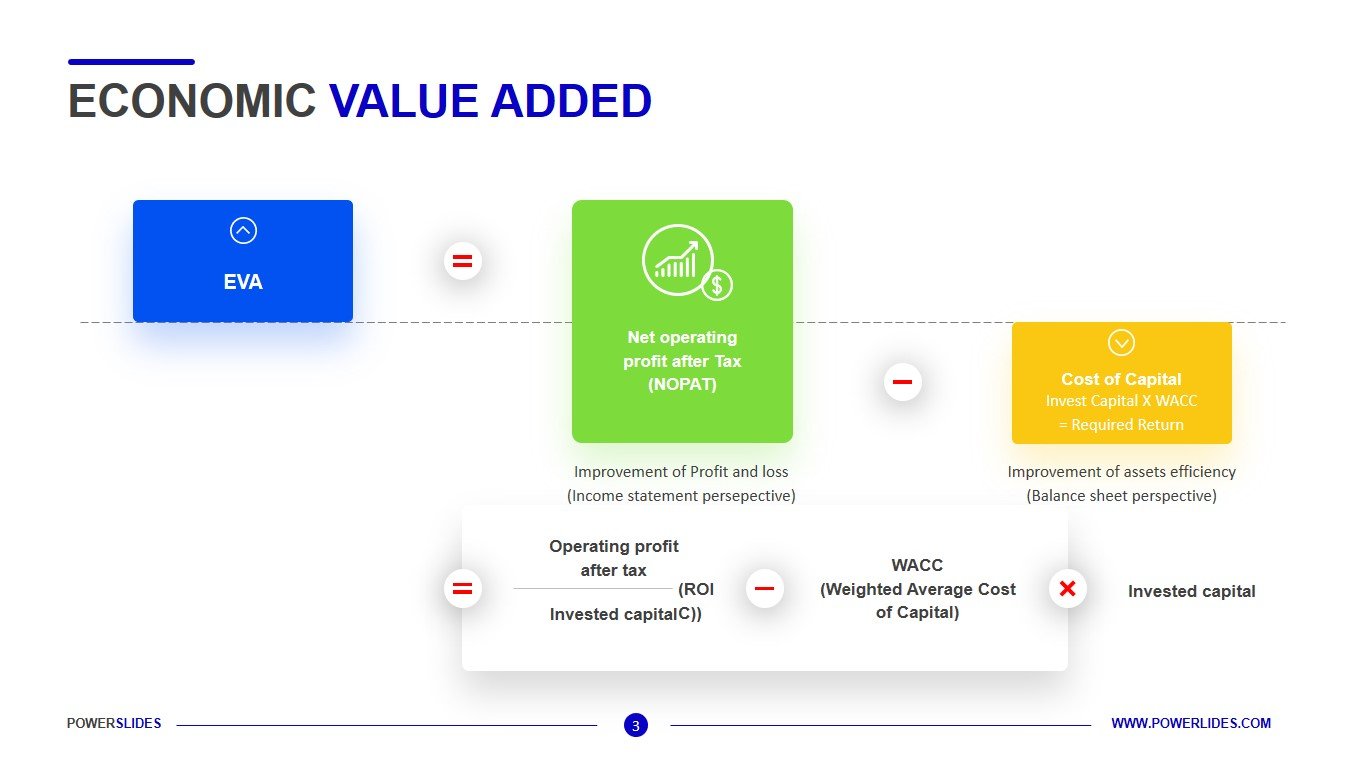
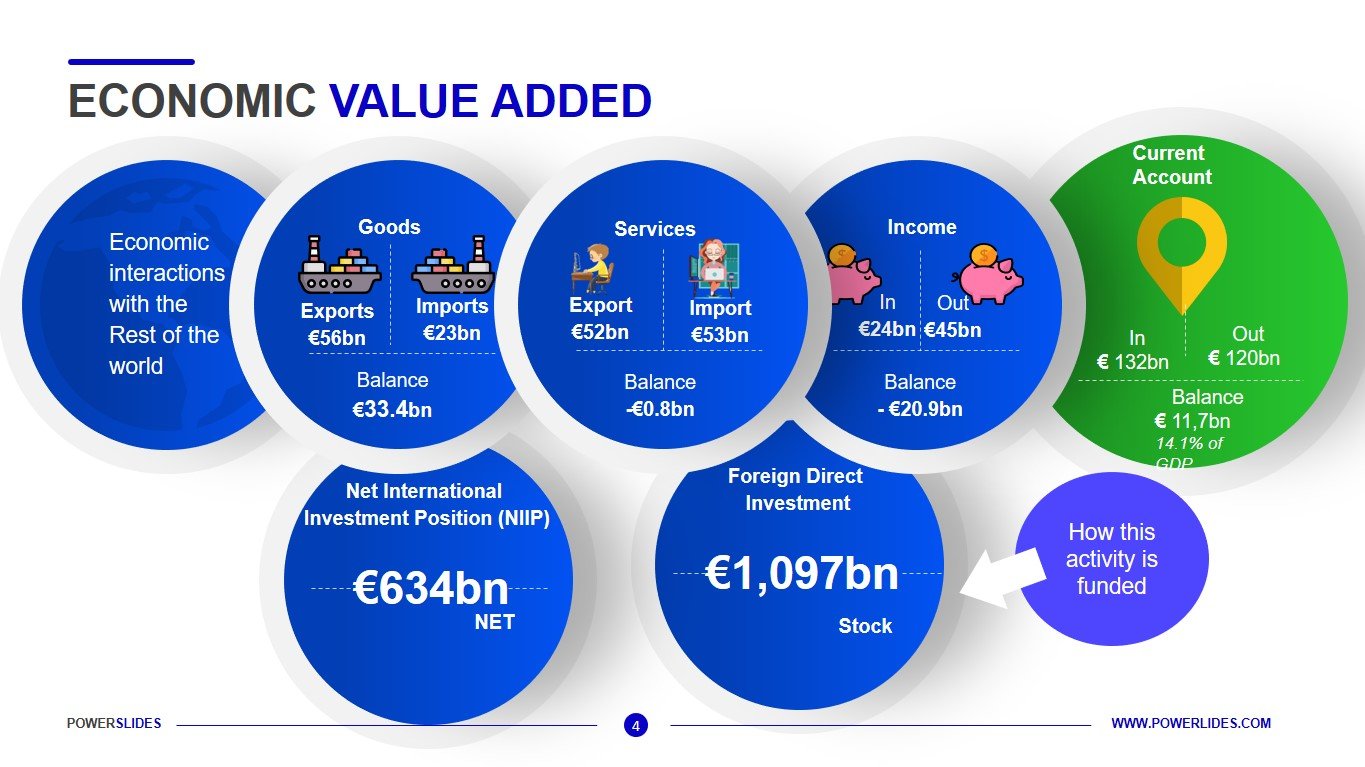
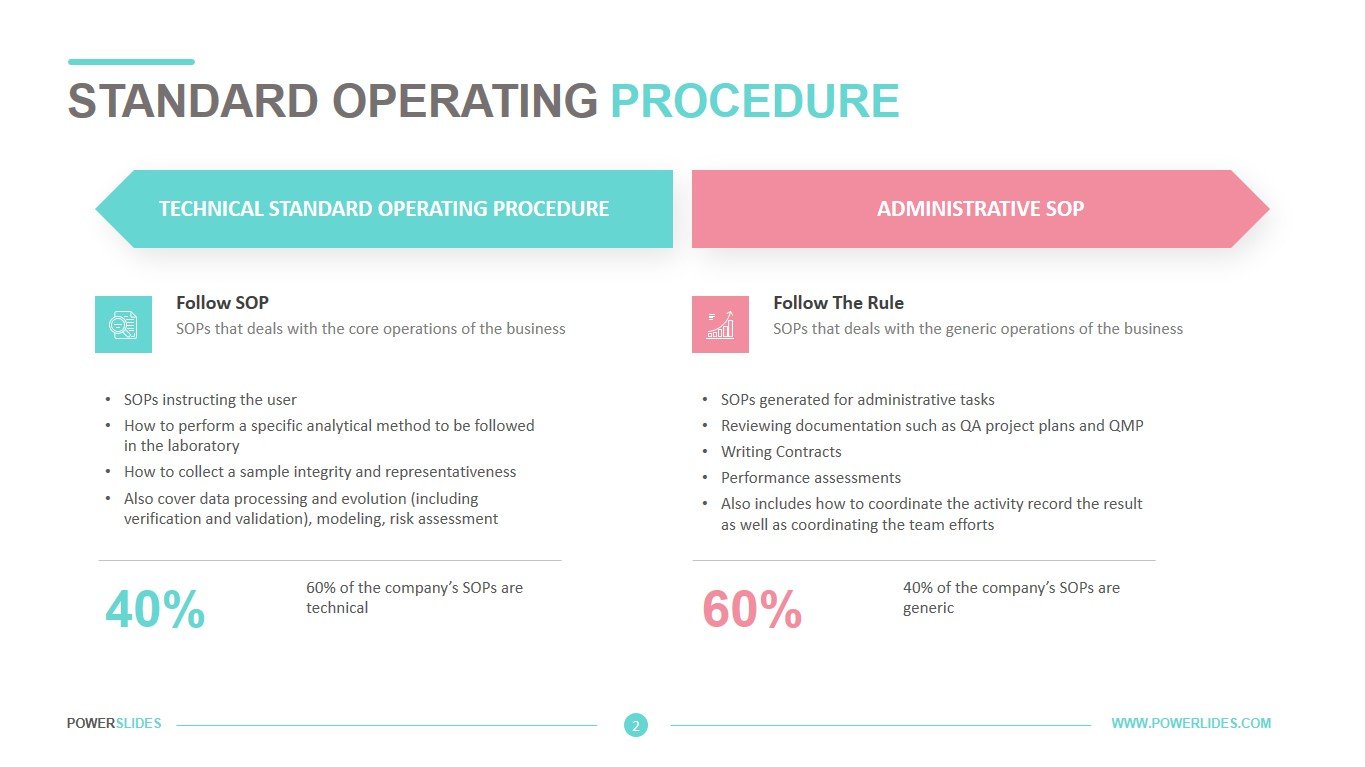
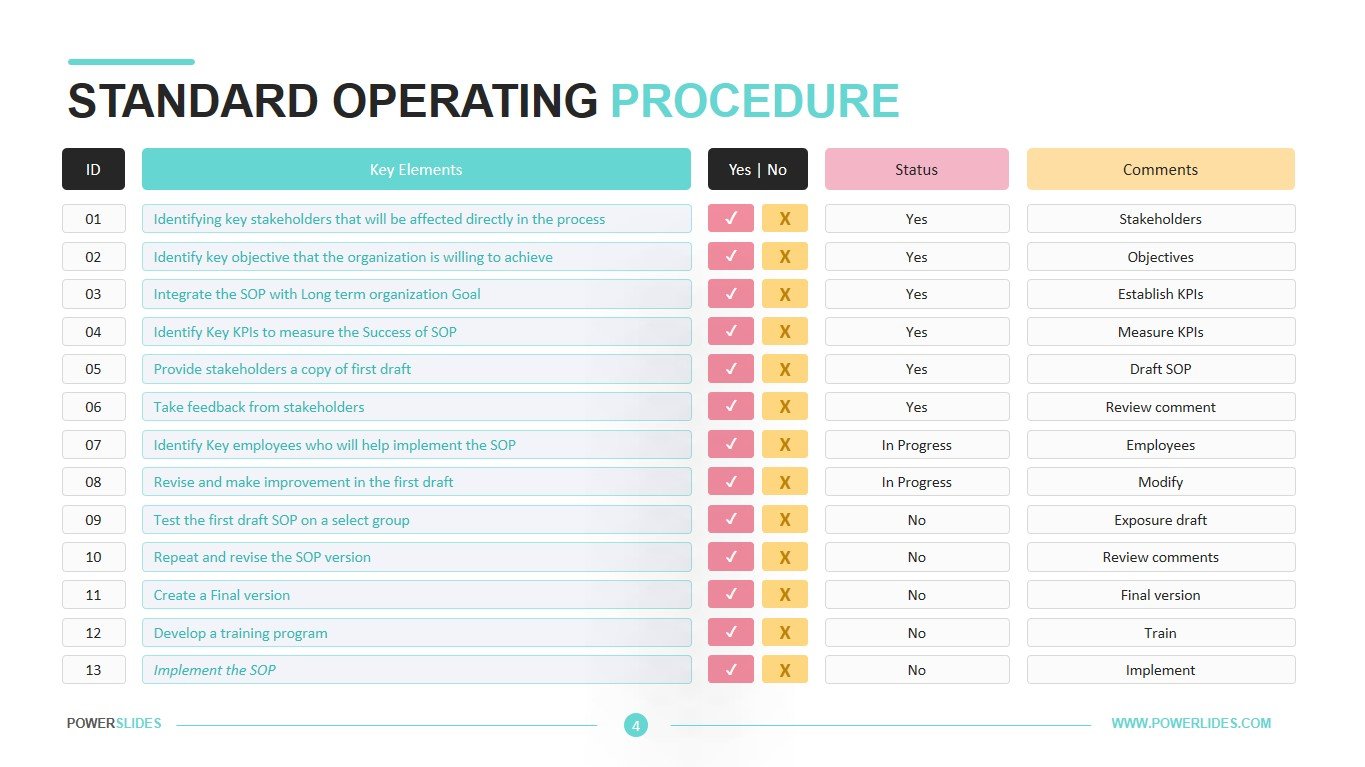
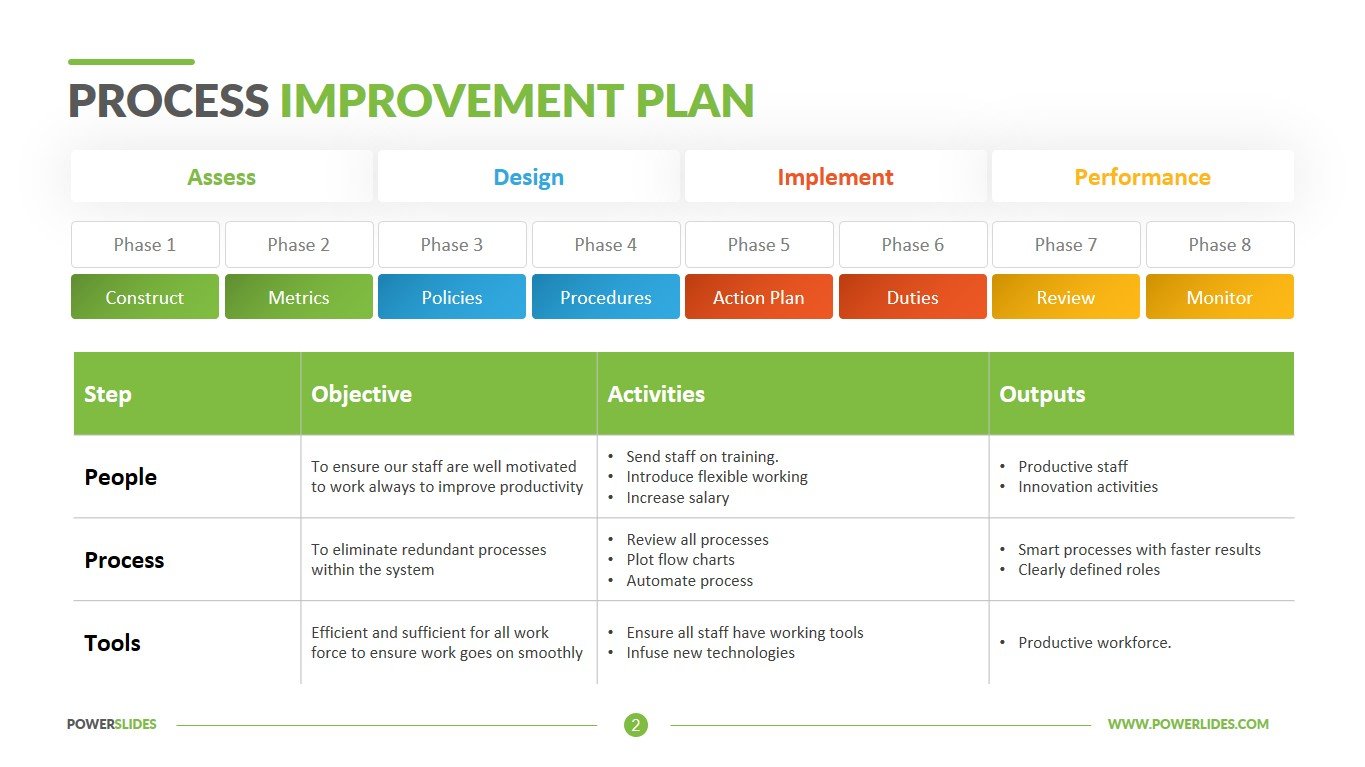
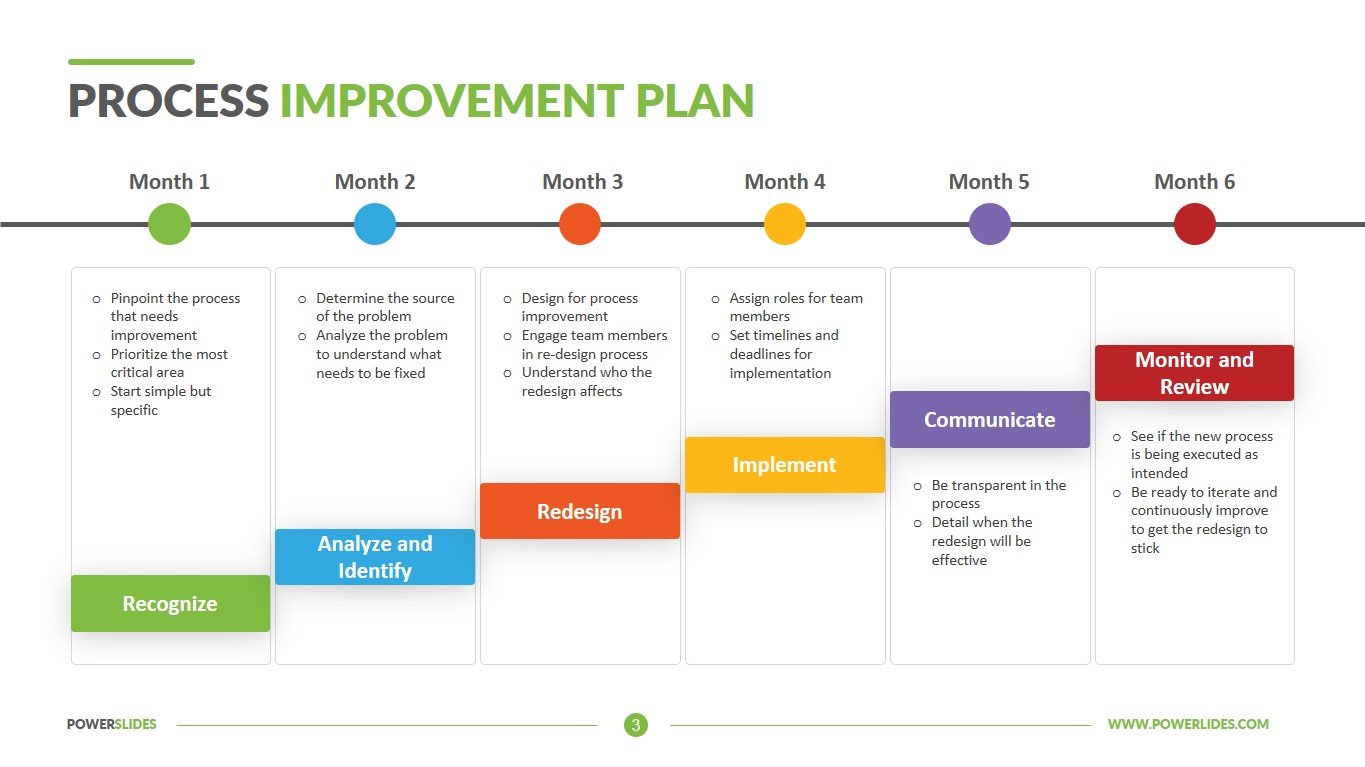
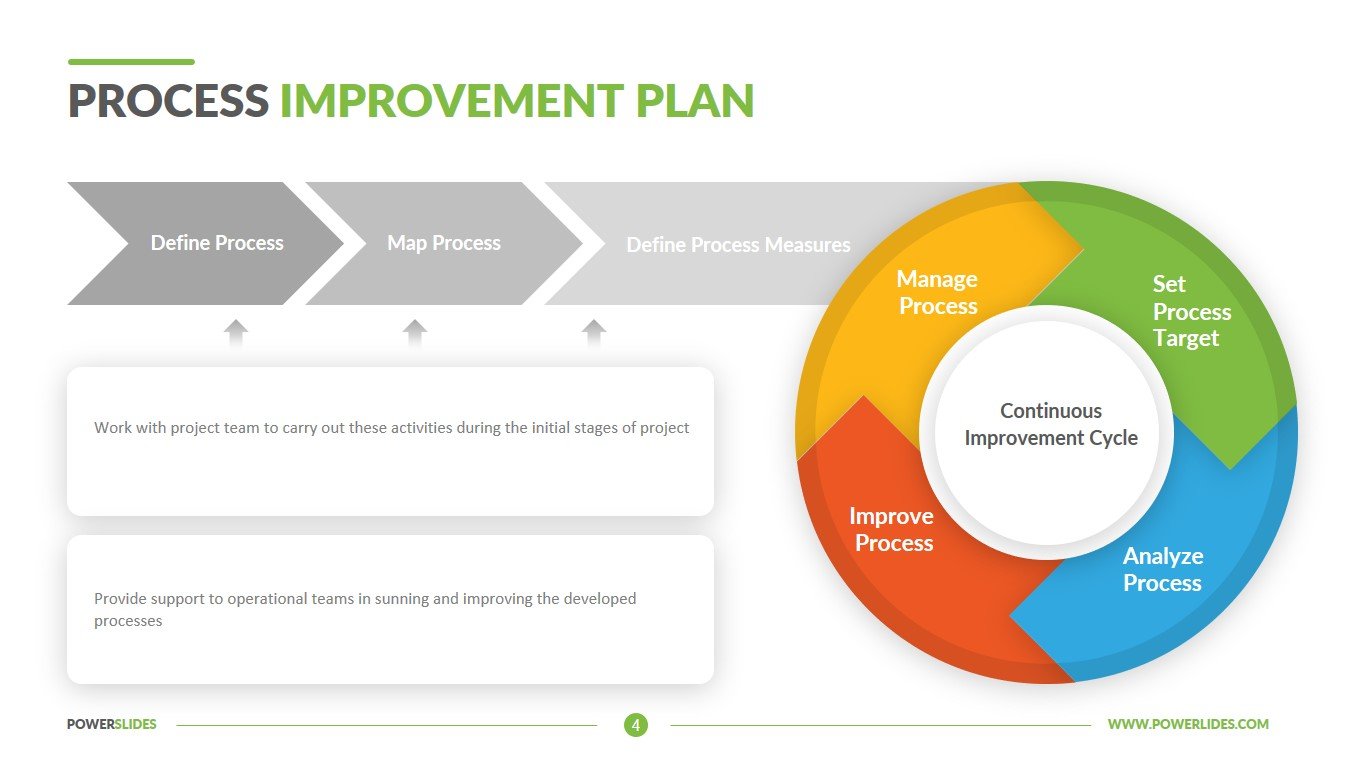
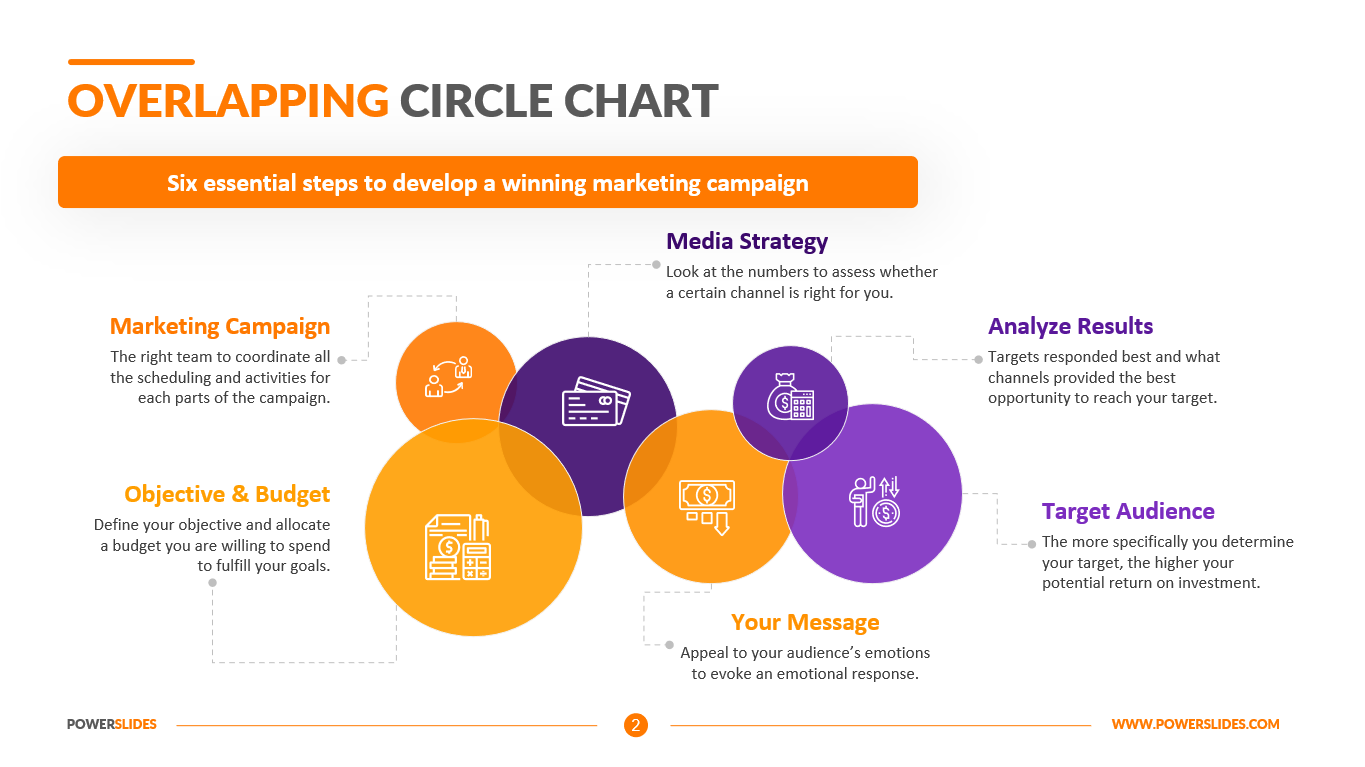
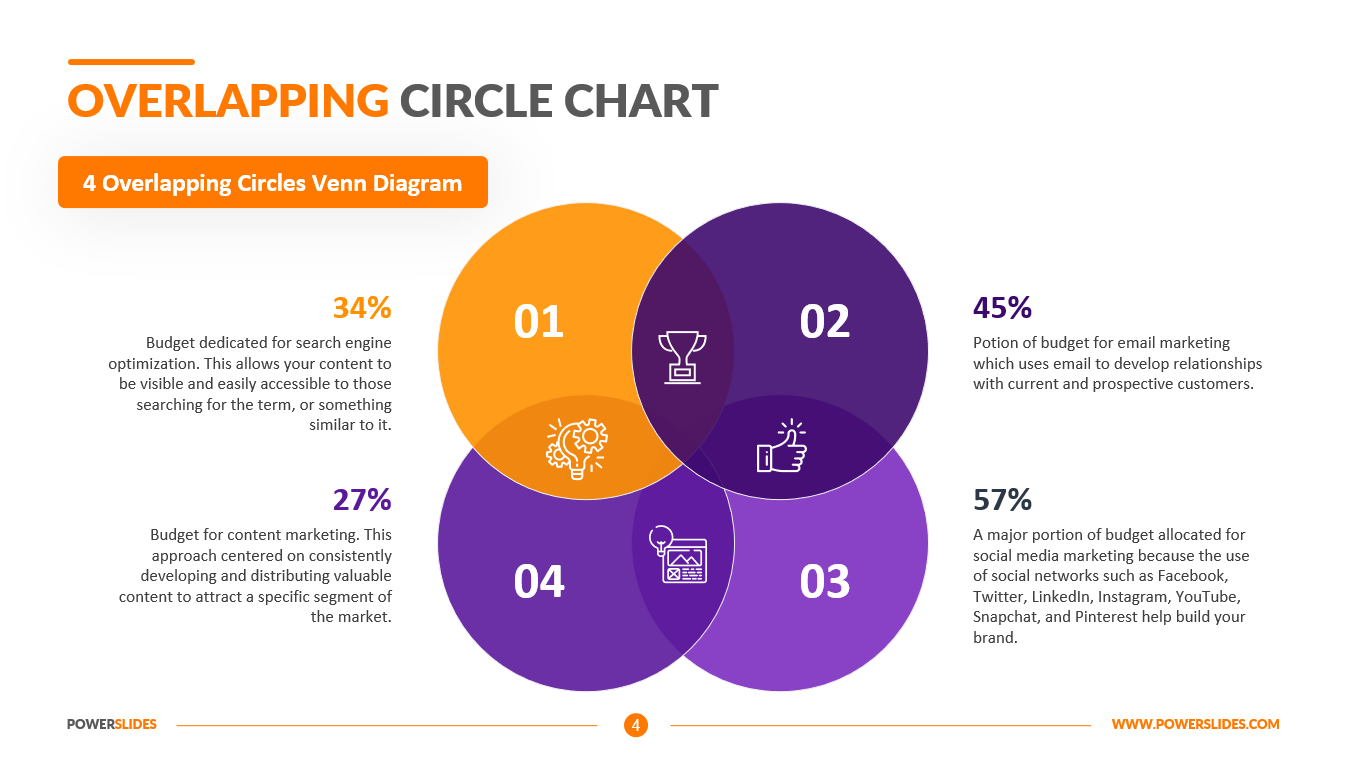
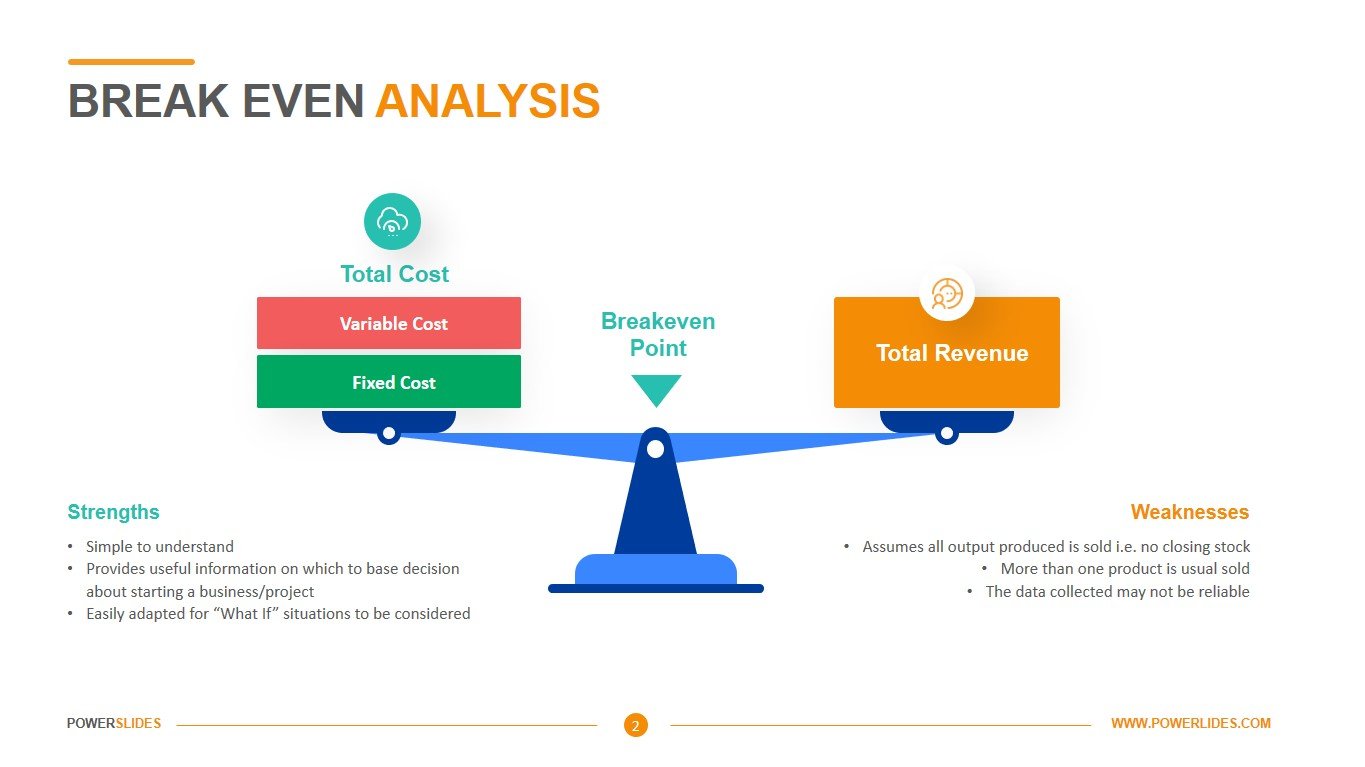
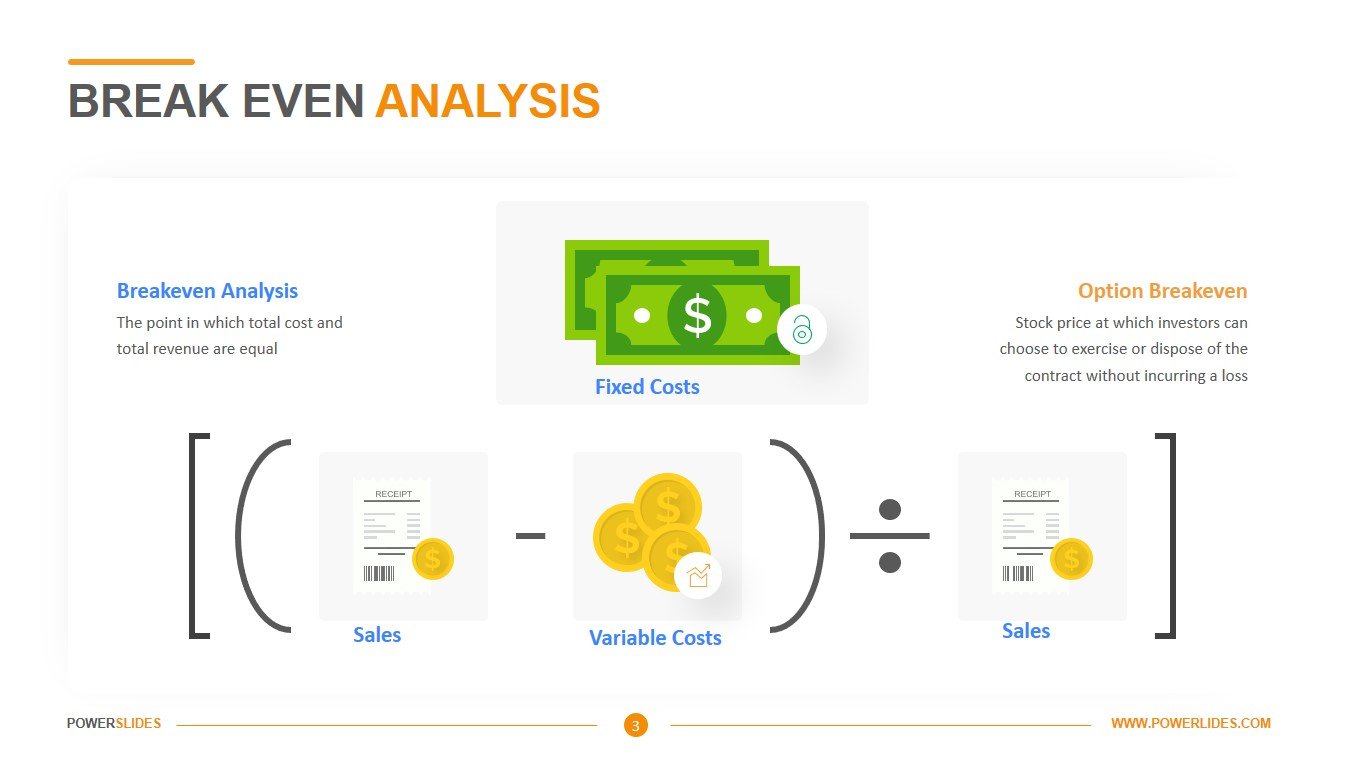
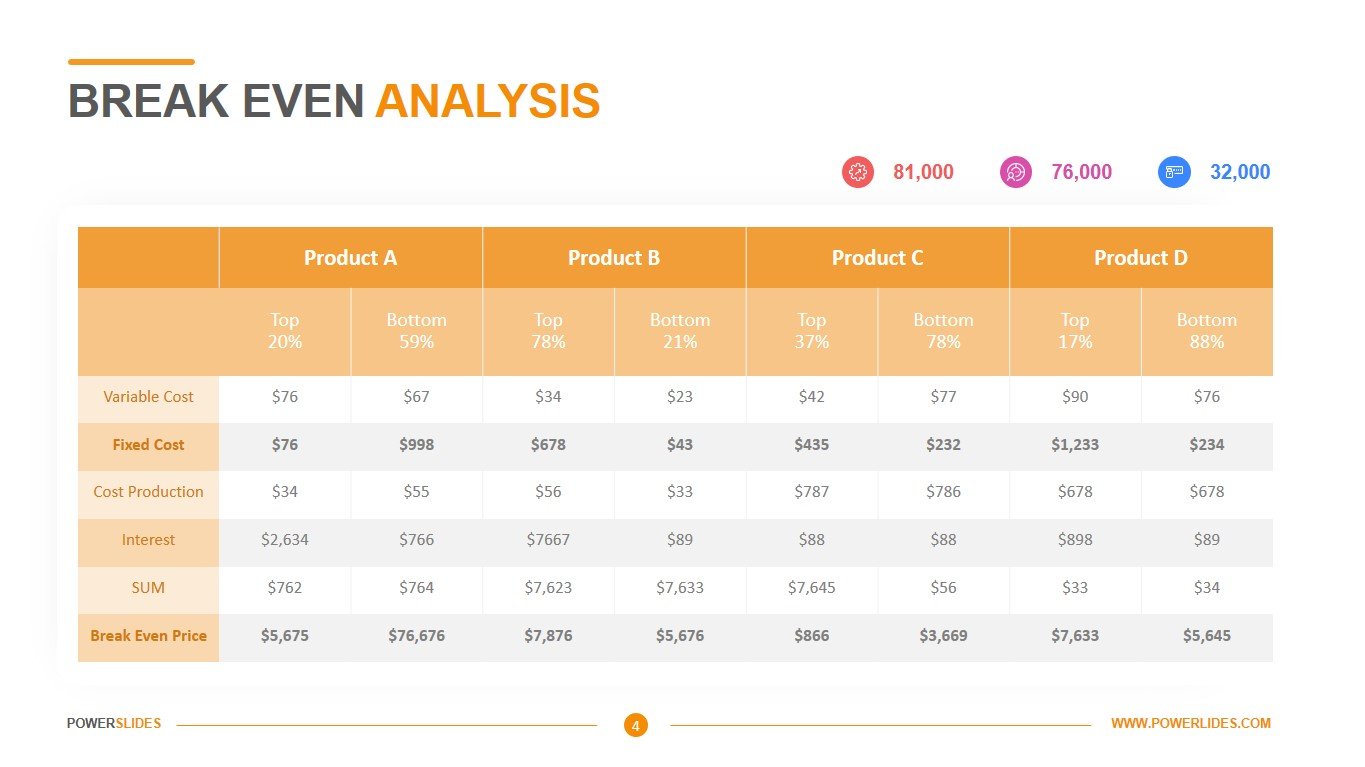
The first slide is presented as a stylized graph. Your audience will immediately understand how many products need to be produced in order to cover all the company’s costs. The next slide is presented as stylized scales, the bowls of which are aligned. This way you show equality between your income and expenses. Economists and financiers can use these two slides in their daily work. The third slide is presented as a formula. You can use this slide when preparing your course in economics. The last slide is a table that contains data for four of the company’s products. This table helps you compare the profit for each product. Also, this slide can be used when preparing analytical reports for the finance department.
Break Even Analysis template is made in a modern style and has all the necessary professional tools. You can customize the color of the template so that the slides match your corporate style. The slides of this template will be useful for managers of all levels. Also, the slides from this template can be used by startup leaders when presenting their go-to-market strategies to investors. The template will harmoniously complement your collection of professional presentations and will take its rightful place. This template should be in the collection of employees of investment companies. For example, you can compare the financial statements of your regional offices.


