Pareto Principle
What do you think of this template?
 (5.00/ 5)
5 ratings

 4 Slides
 File size: 16:9
 Fonts: Lato, Calibri
 Supported version
PPT 2010, PPT 2013, PPT 2016
Supported version
PPT 2010, PPT 2013, PPT 2016

Product details
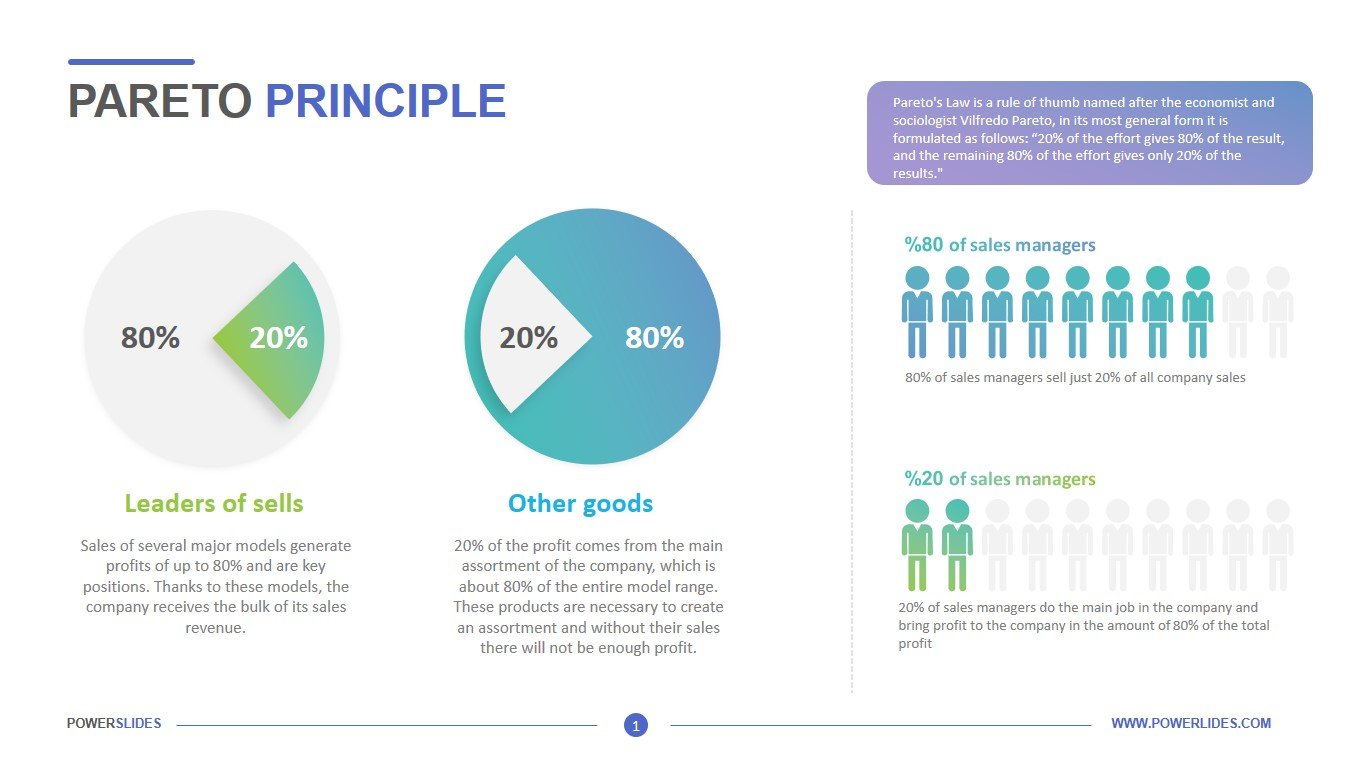
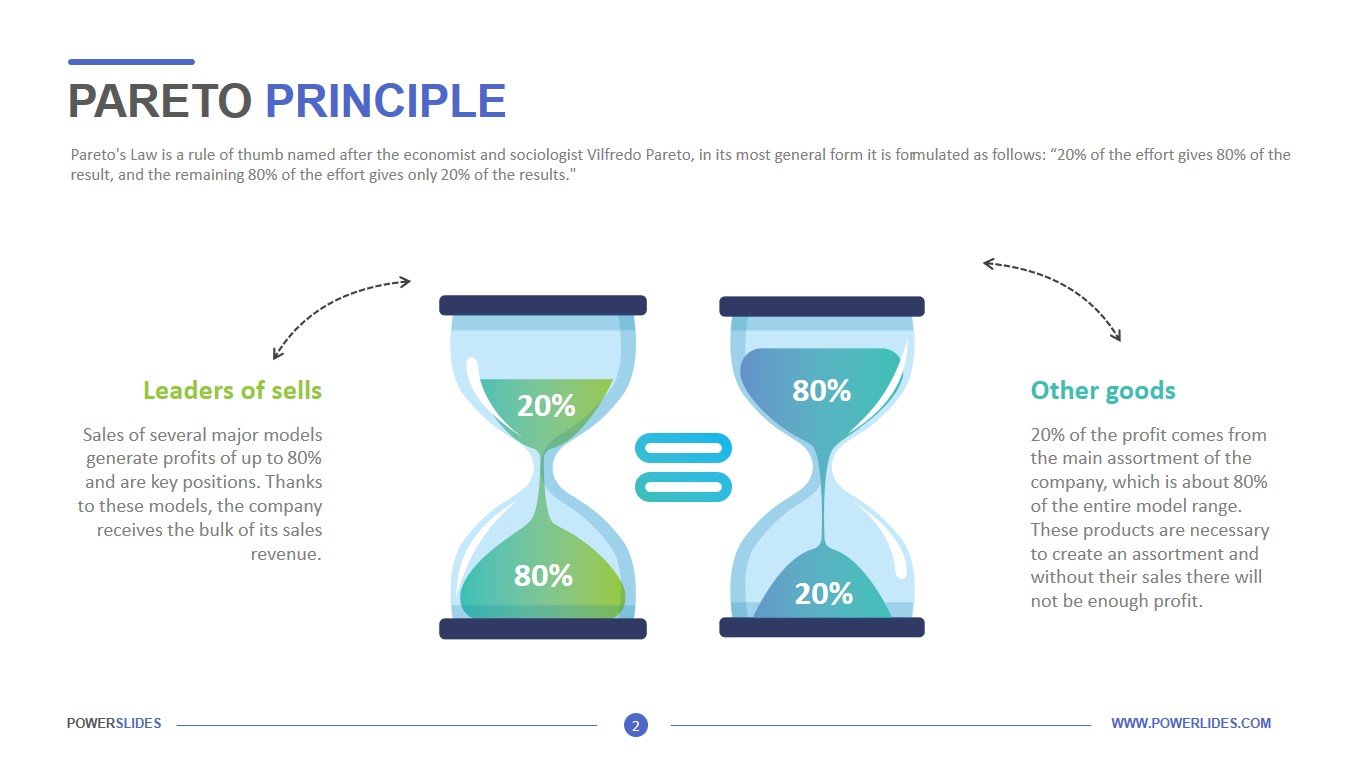
The Pareto Principle, named after esteemed economist Vilfredo Pareto, specifies that 80% of consequences come from 20% of the causes, asserting an unequal relationship between inputs and outputs. This principle serves as a general reminder that the relationship between inputs and outputs is not balanced. The Pareto Principle is also known as the Pareto Rule or the 80/20 Rule. The principle, which was derived from the imbalance of land ownership in Italy, is commonly used to illustrate the notion that not things are equal, and the minority owns the majority. Pareto principle is another free power point template to be used by professionals and higher level students to use graphics and visuals to show the mathematical ratios, proportions, and their interrelation. This template comes in a very wide range of designs and you can use them to describe literally anything you want to. These come in an array of colors and themes and are customizable too so that you can present your ideas, facts, and figures in a better way. The template is made in a modern style and gives you the opportunity to use all the necessary tools to prepare a professional business presentation.
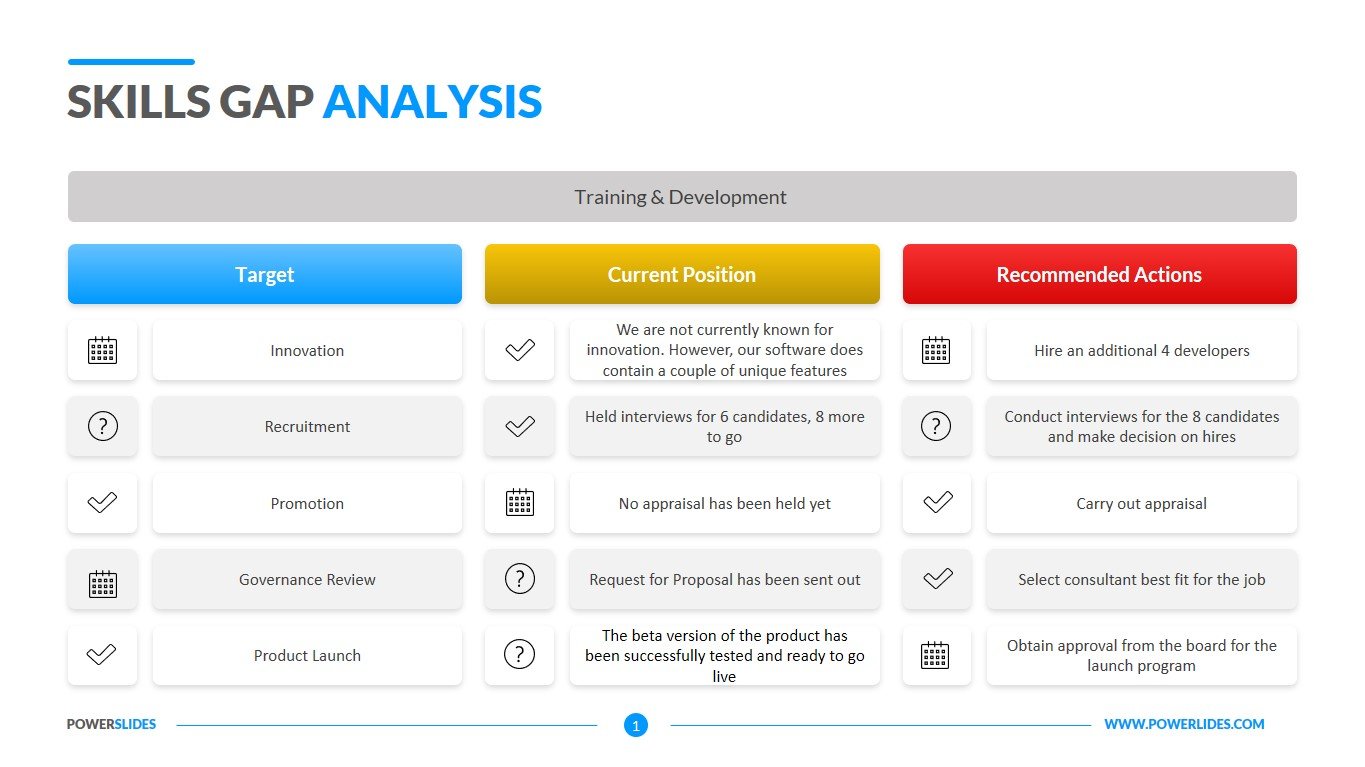
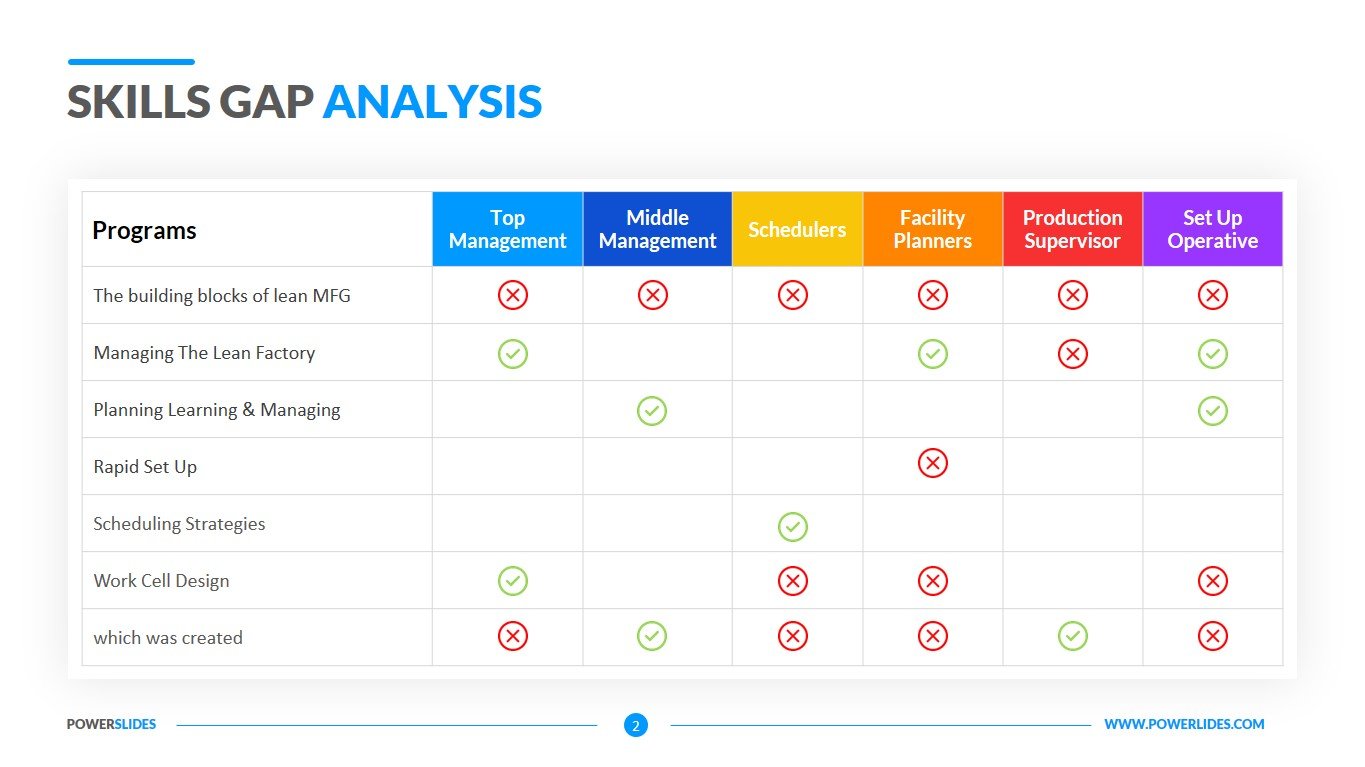
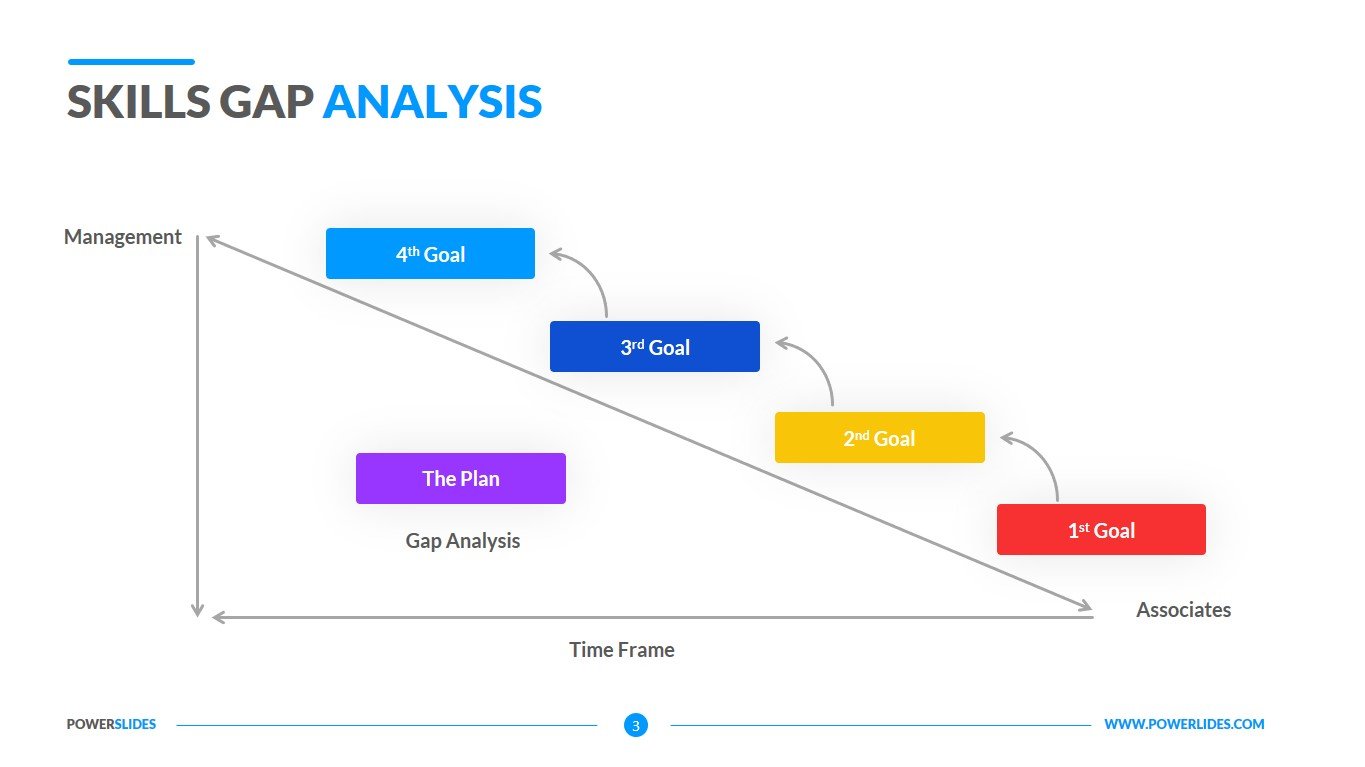
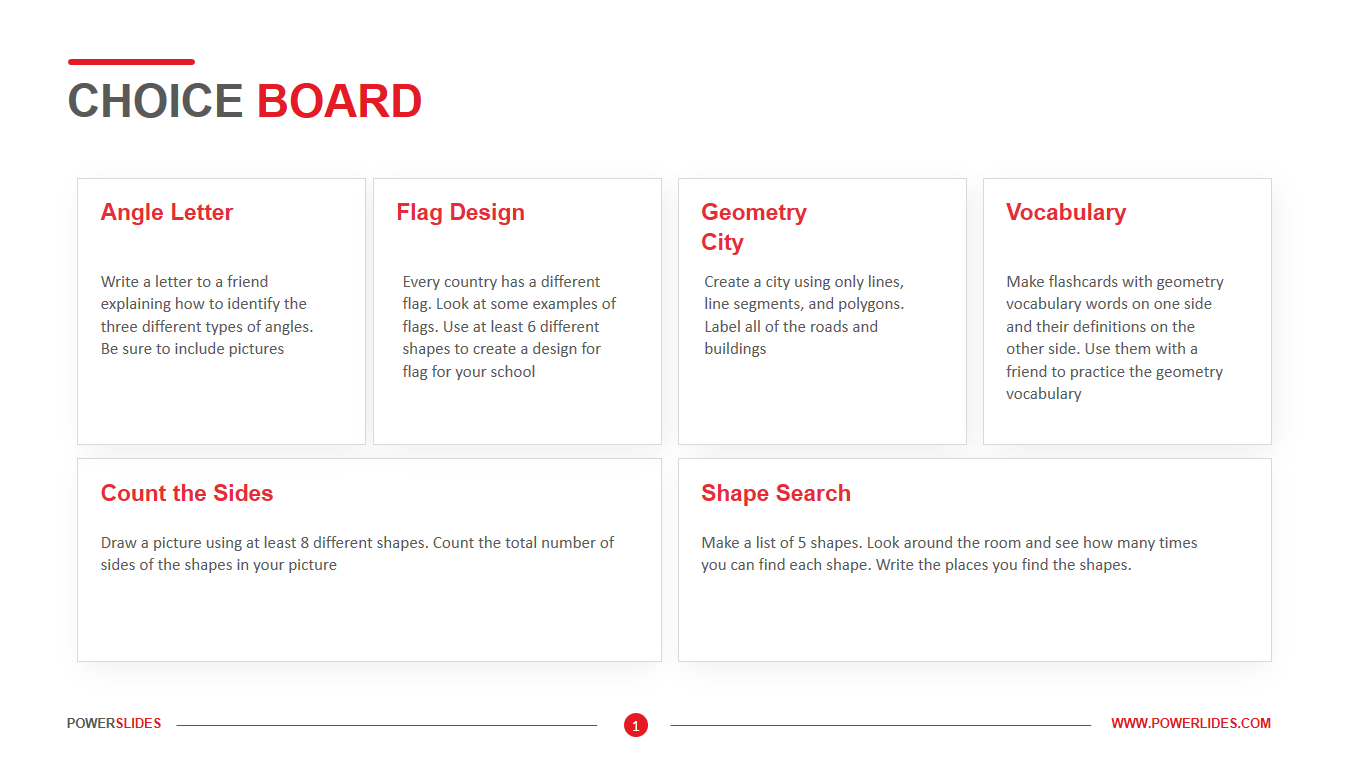
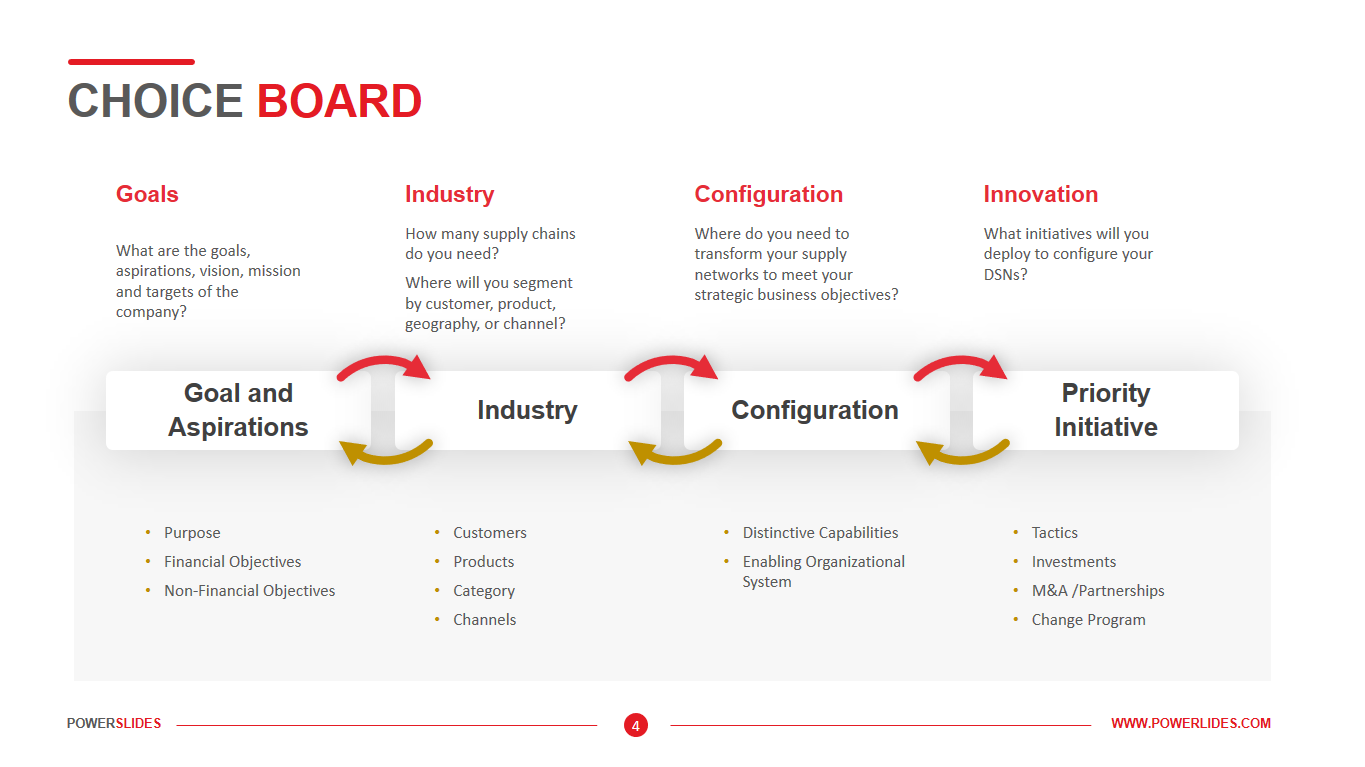
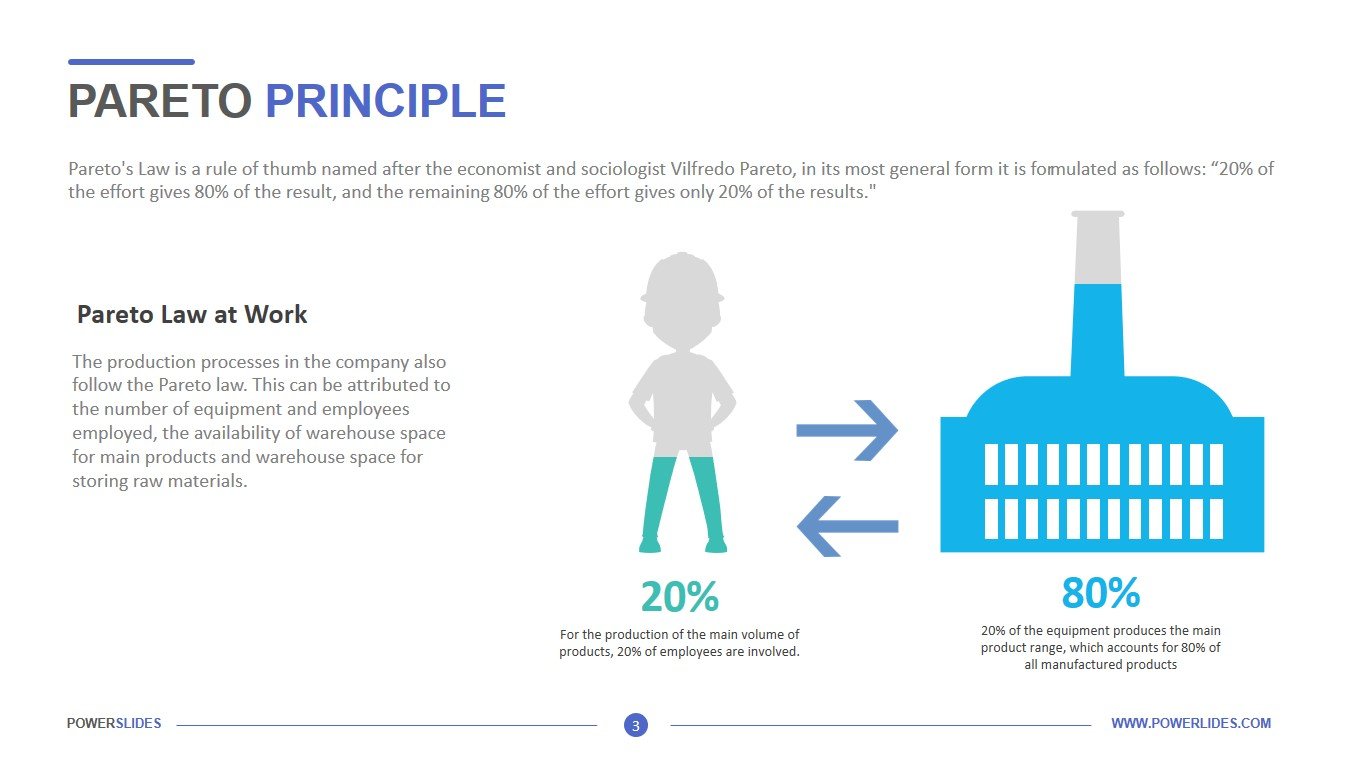
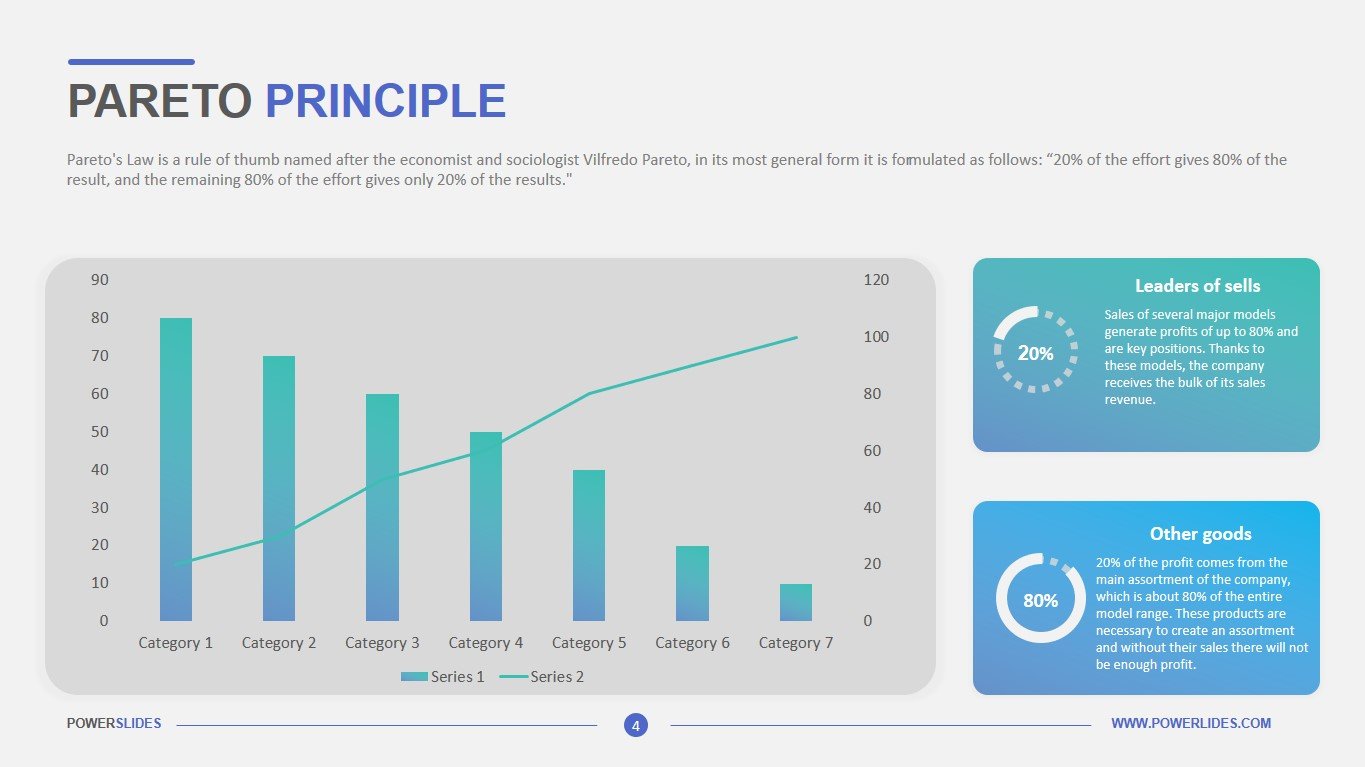
The first slide gives you the opportunity to describe the Pareto principle in your educational course or abstract. You can also use this slide to prepare information on the distribution of funds among the population. You can also use this slide when preparing a report on an upcoming advertising campaign. For example, you can indicate that only 20% of consumers from the total number of those who viewed an advertisement will place an order for a product. The second slide is presented as two hourglasses. You can use it when preparing a sales analysis of your products. For example, a sales director might indicate that only 20% of products generate 80% of the profit. The remaining 80% of products only generate 20% of the profit. This slide can be used by business trainers when preparing time management courses. For example, presenting on a slide the information that only 20% of the time spent gives 80% of the result. The next slide can be used by HR managers when preparing a report on the number of executives and ordinary employees. Also, the slide can be used by production managers when preparing an analysis of the effectiveness of equipment use. They can also use the slide to analyze the work of 20% of workers who do 80% of all work. The last slide gives you the opportunity to use graphs and charts when analyzing Pareto’s law. This slide can be useful for financiers when analyzing the performance of various stocks. Also, the slide can be used by investment companies and startups.
Pareto Principle can be used to describe the ration of one thing in another, to prepare medical deficiency related reports, to describe the results of any voting campaign in a visual manner, to account for the differences in the population of the same areas, to differentiate between the policies of two competitor businesses and for other such reasons. You can add text within these Pareto graphs or either around them on the same slide to add more the information that you are giving through their use.


