Flow Chart Symbols
What do you think of this template?

 (4.00/ 5)
28 ratings

 4 Slides
 File size: 16:9
 Fonts: Lato Black, Calibri
 Supported version
PPT 2010, PPT 2013, PPT 2016
Supported version
PPT 2010, PPT 2013, PPT 2016

Product details
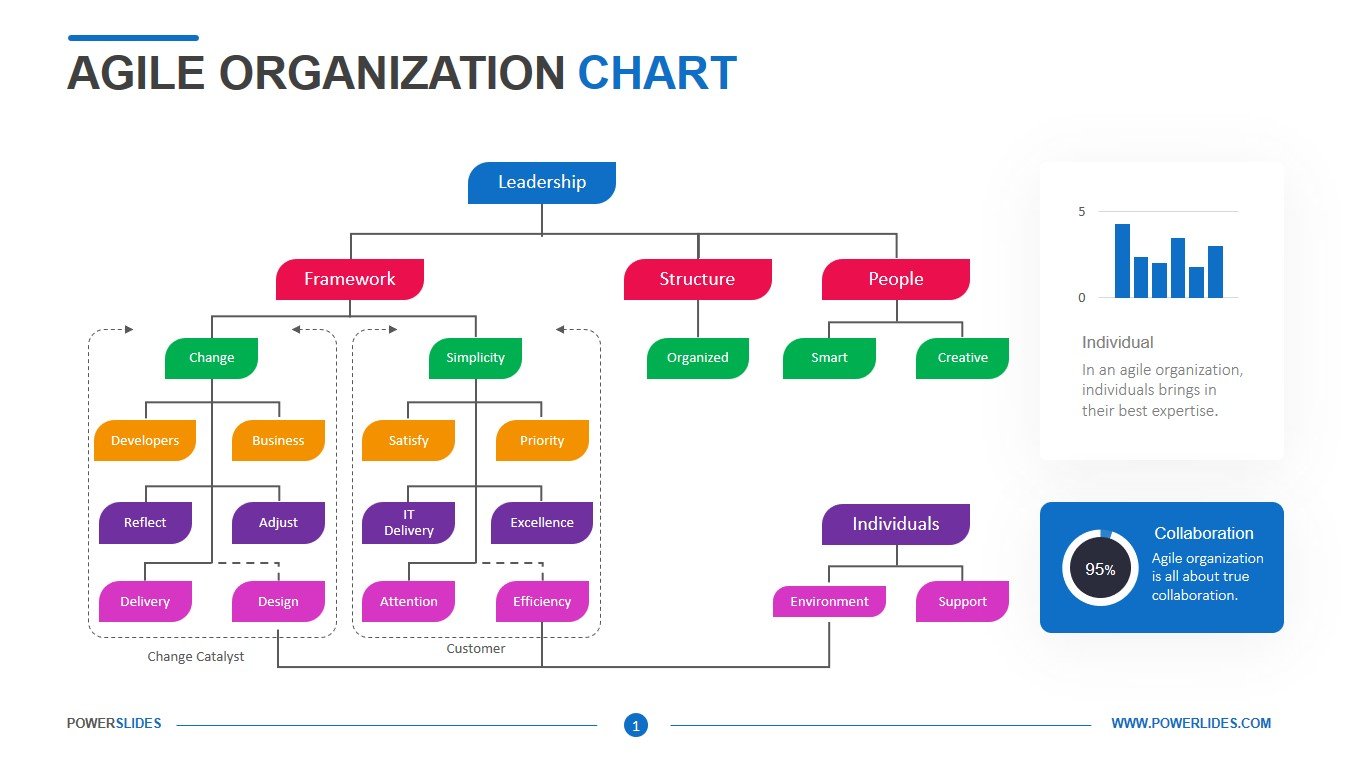
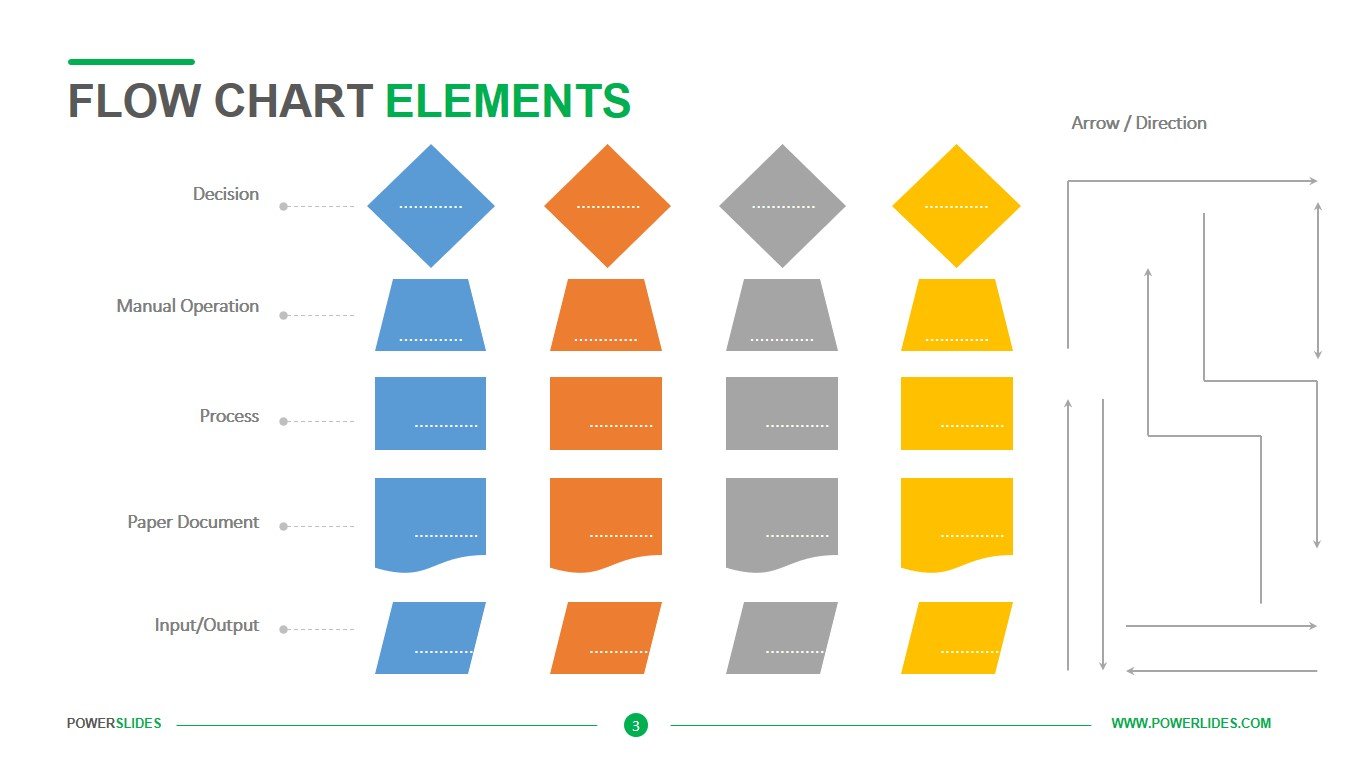
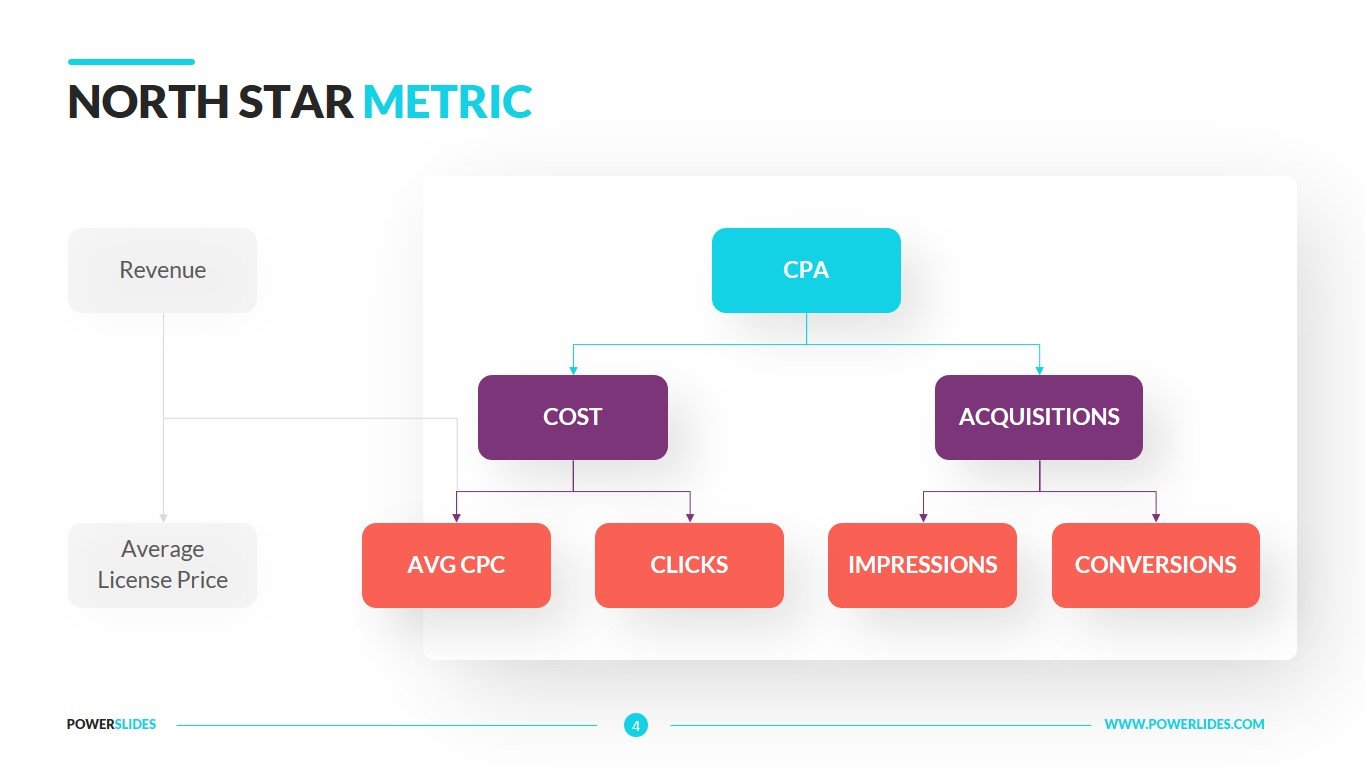
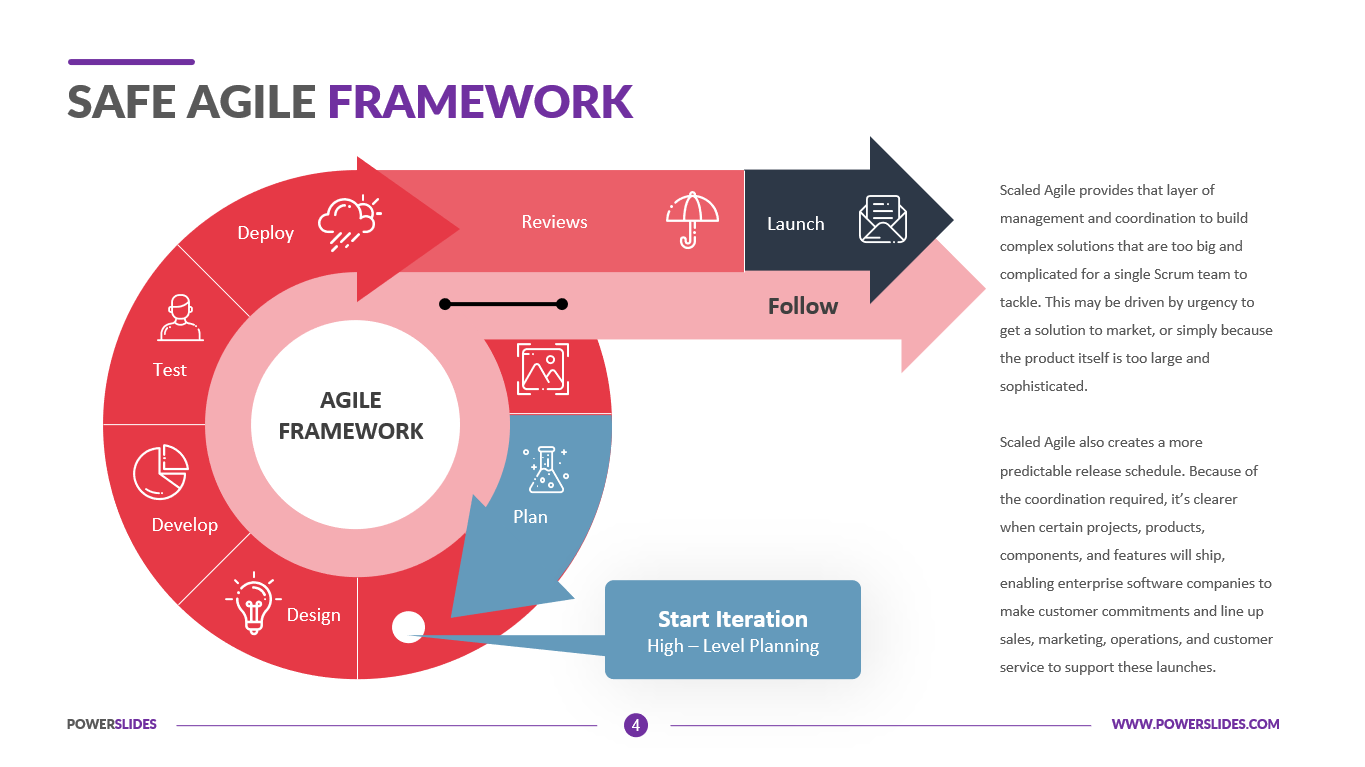
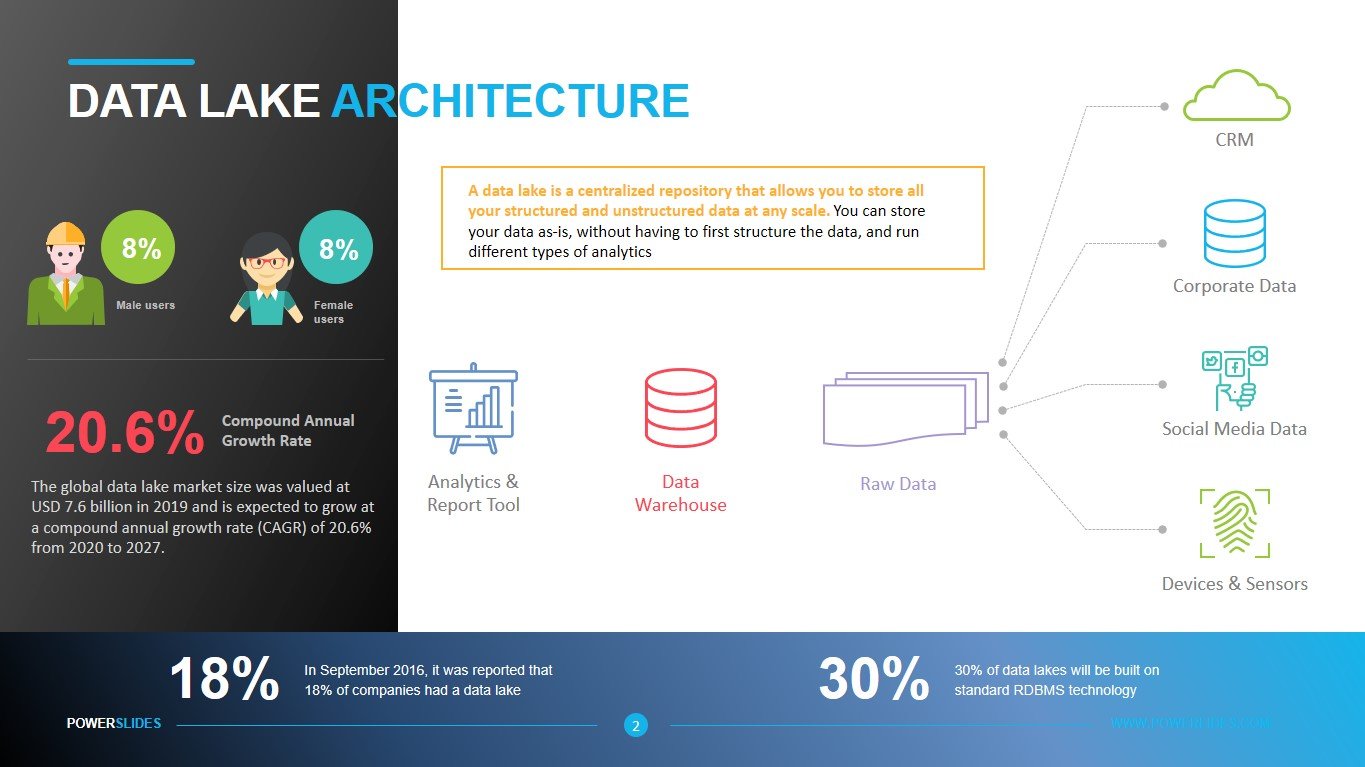
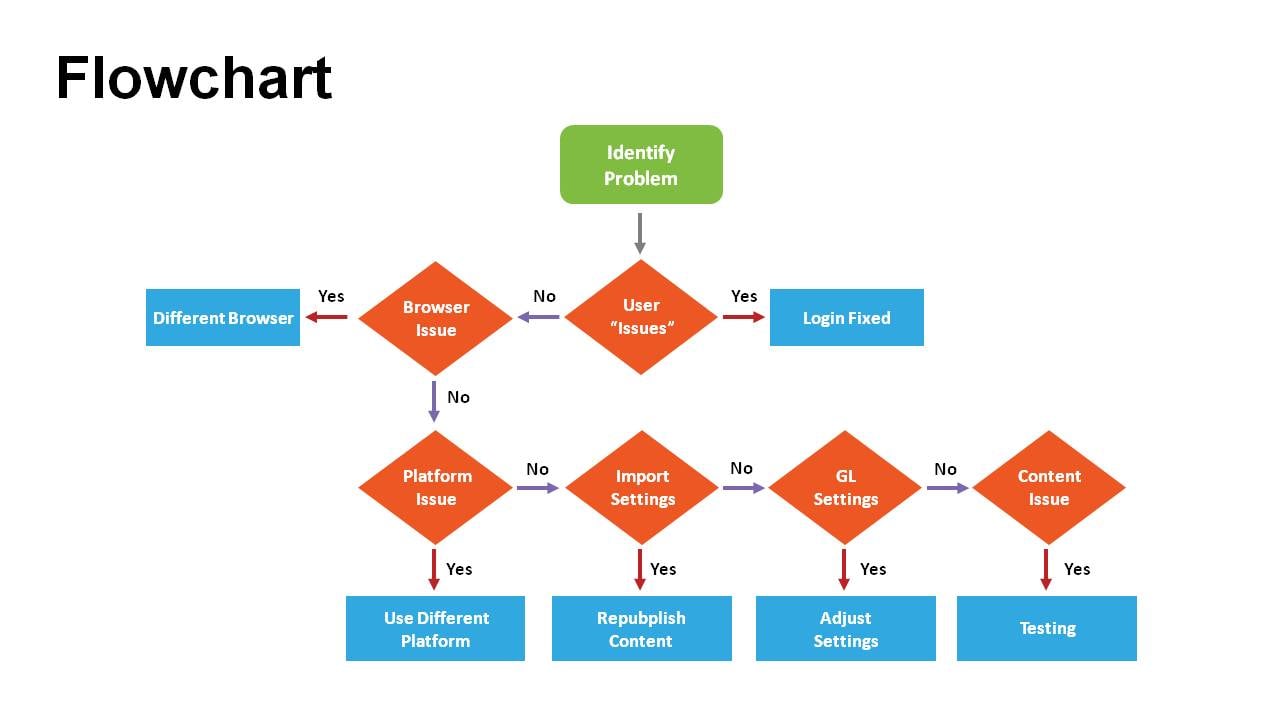
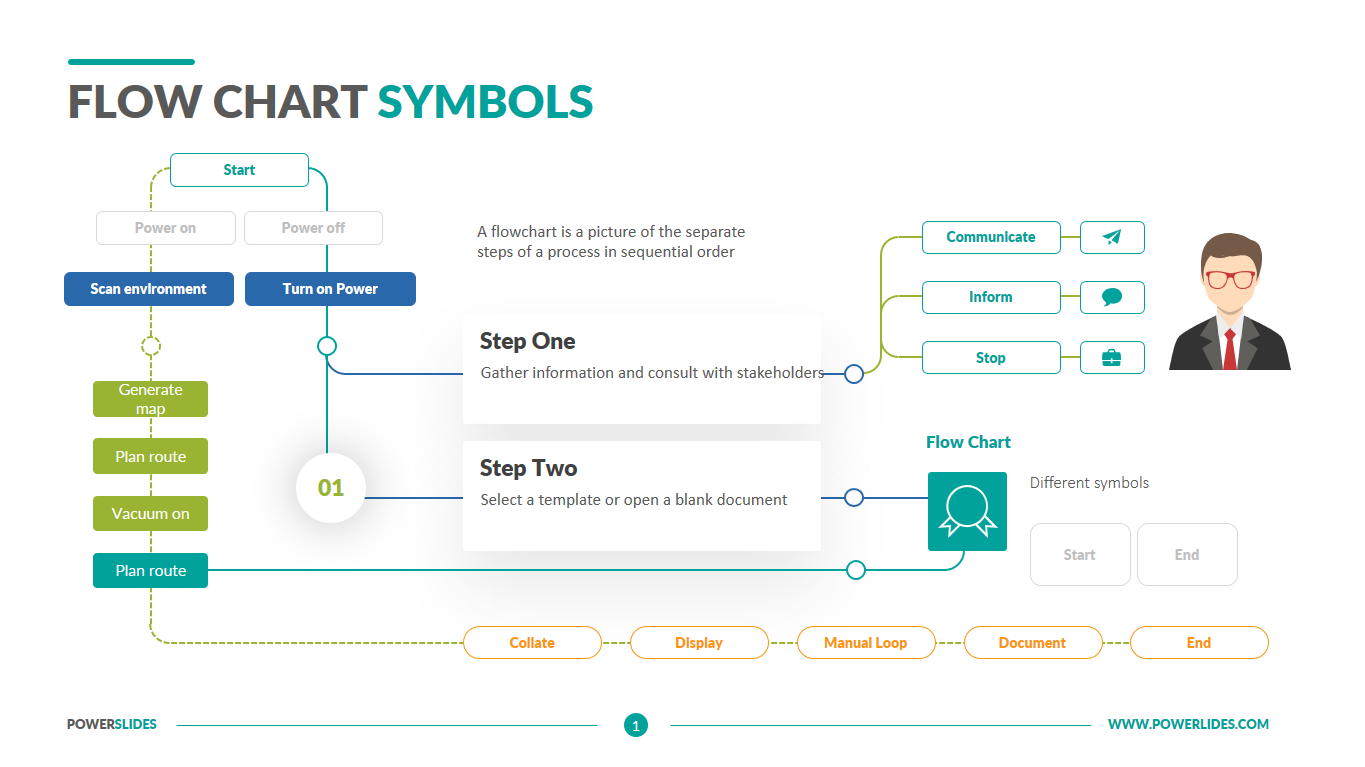
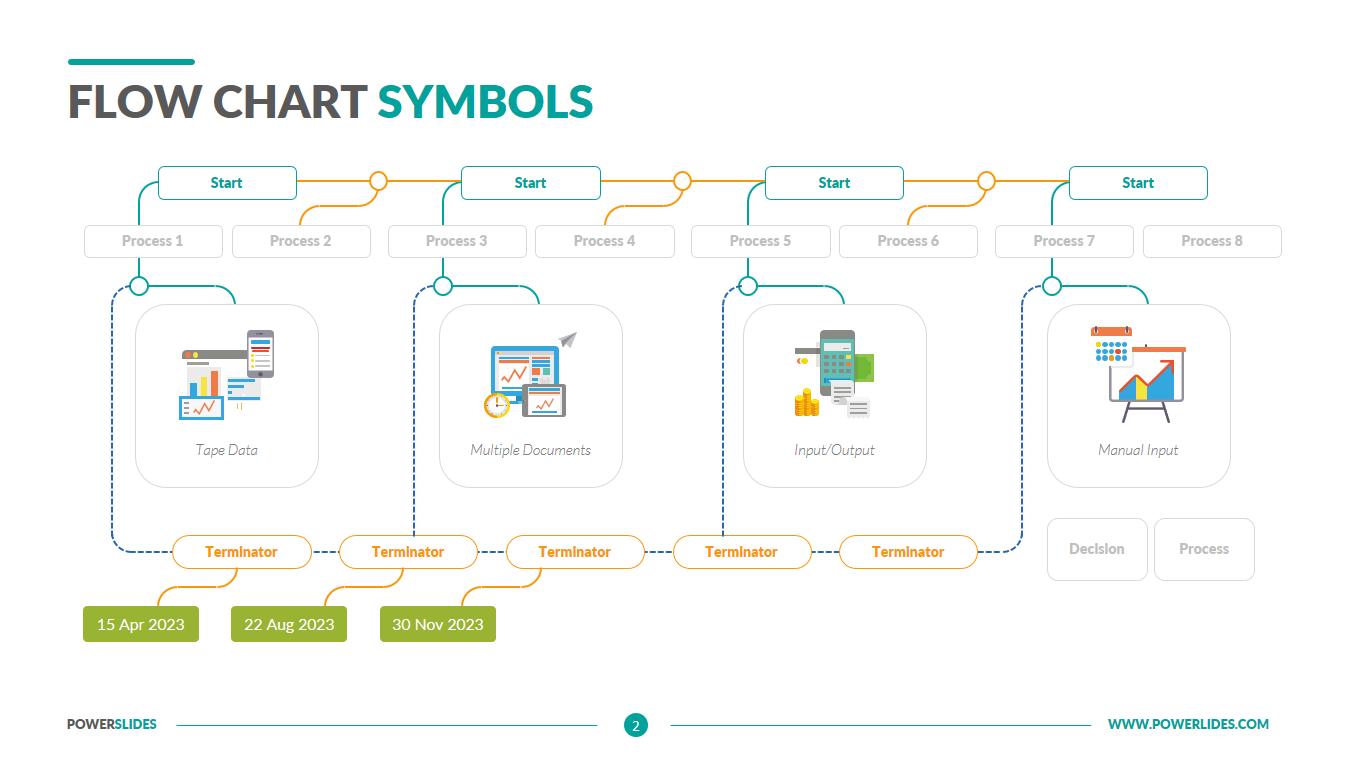
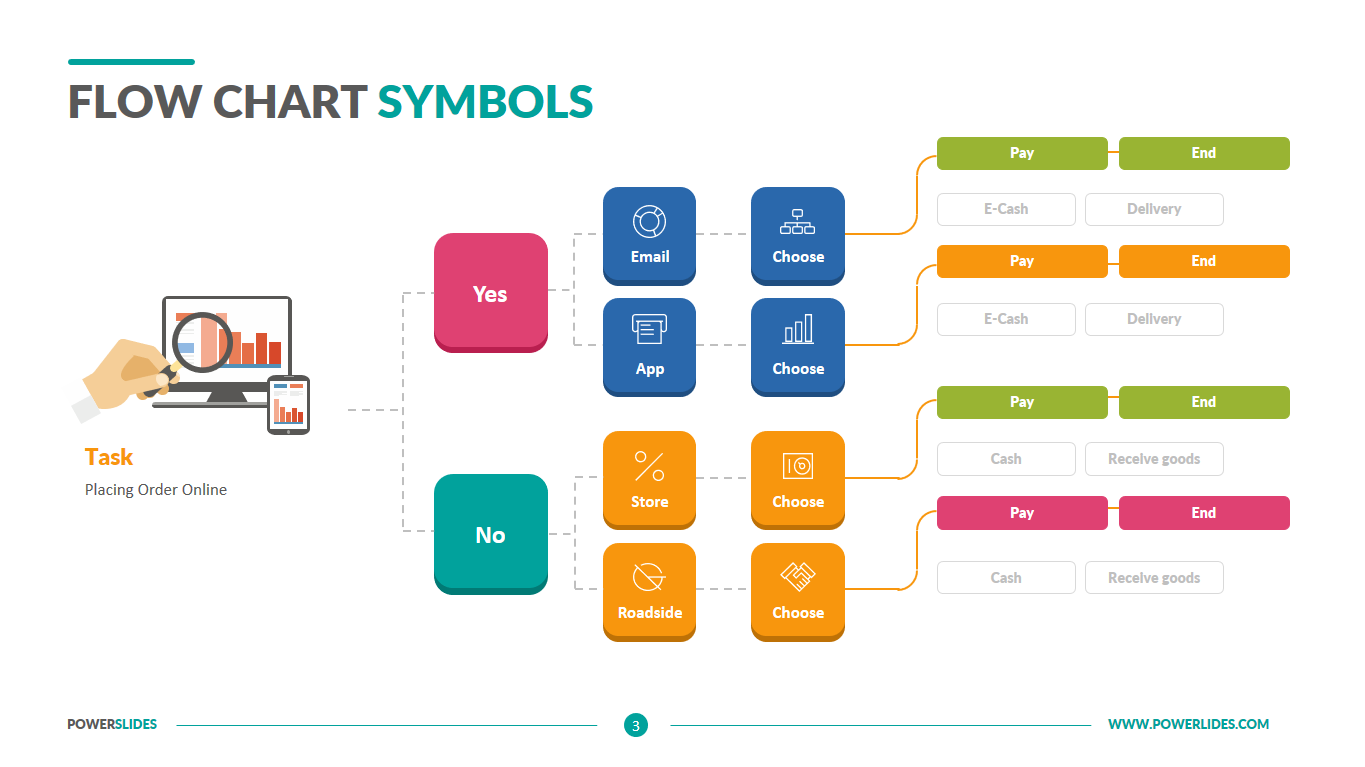
A flowchart is a diagram that depicts a process, system or computer algorithm. They are widely used in multiple fields to document, study, plan, improve and communicate often complex processes in clear, easy-to-understand diagrams. Flowcharts, sometimes spelled as flow charts, use rectangles, ovals, diamonds and potentially numerous other shapes to define the type of step, along with connecting arrows to define flow and sequence. They can range from simple, hand-drawn charts to comprehensive computer-drawn diagrams depicting multiple steps and routes.
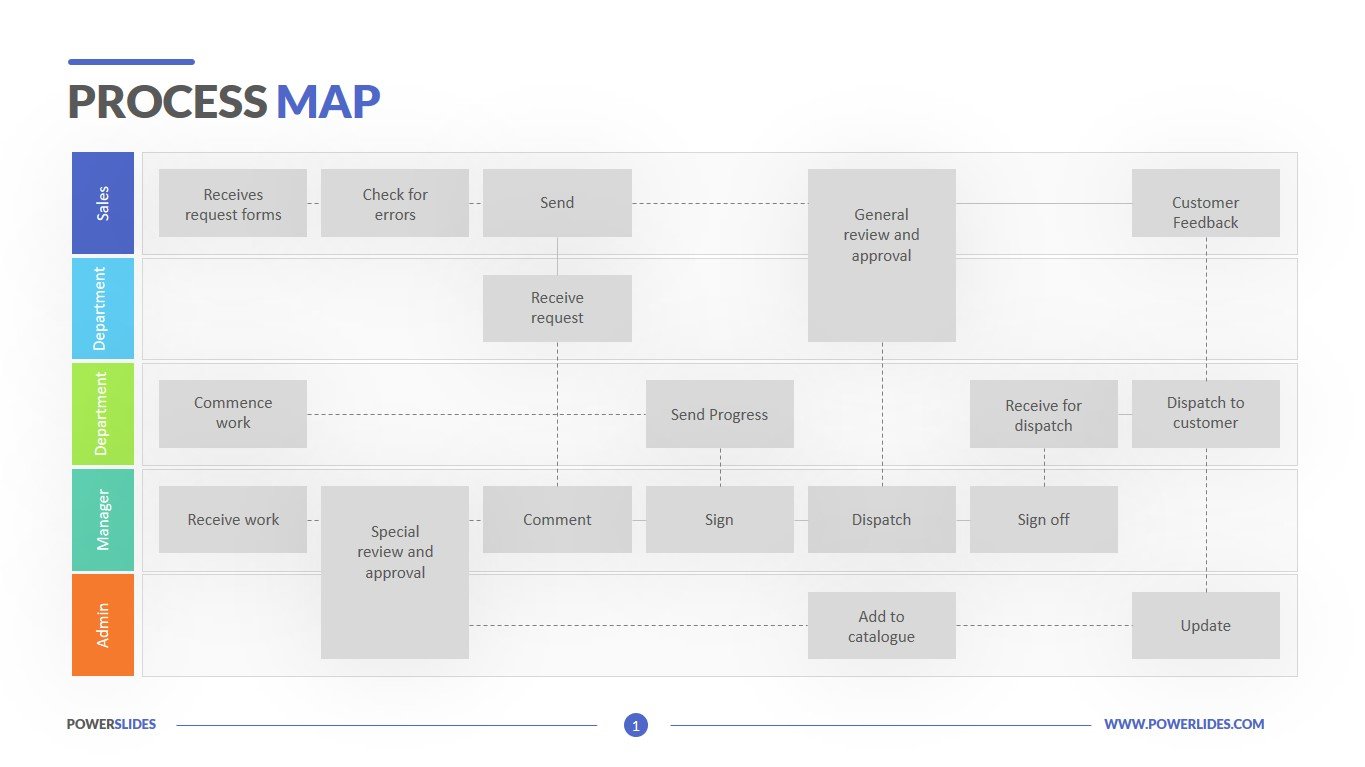
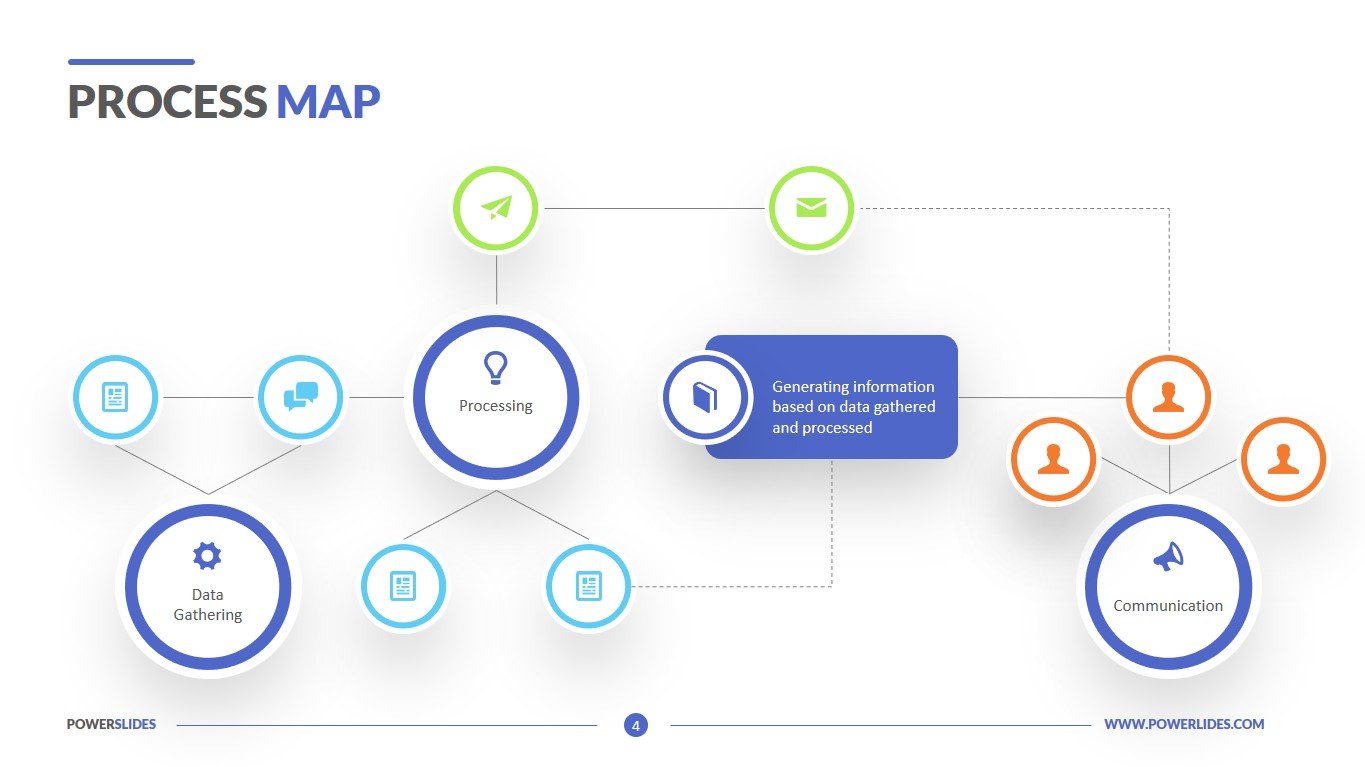
If we consider all the various forms of flowcharts, they are one of the most common diagrams on the planet, used by both technical and non-technical people in numerous fields. Flowcharts are sometimes called by more specialized names such as Process Flowchart, Process Map, Functional Flowchart, Business Process Mapping, Business Process Modeling and Notation , or Process Flow Diagram.
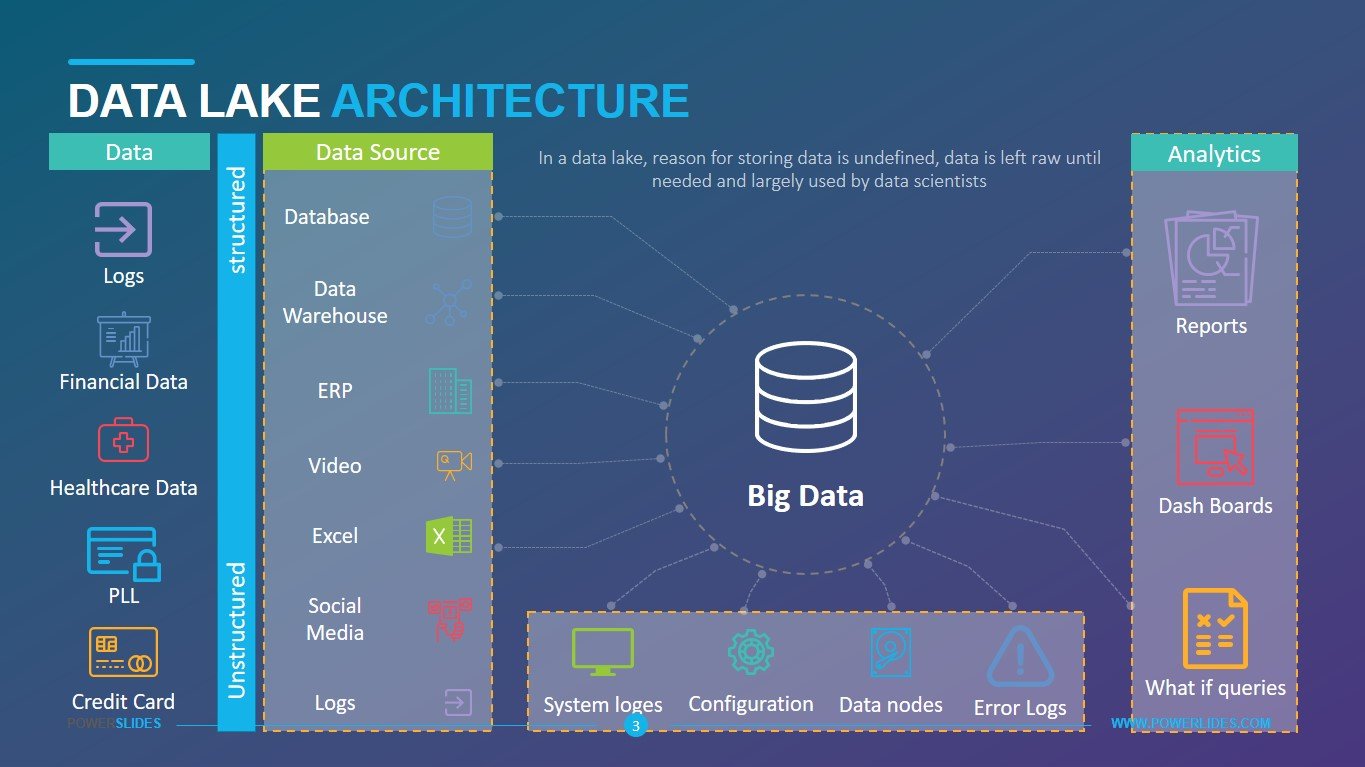
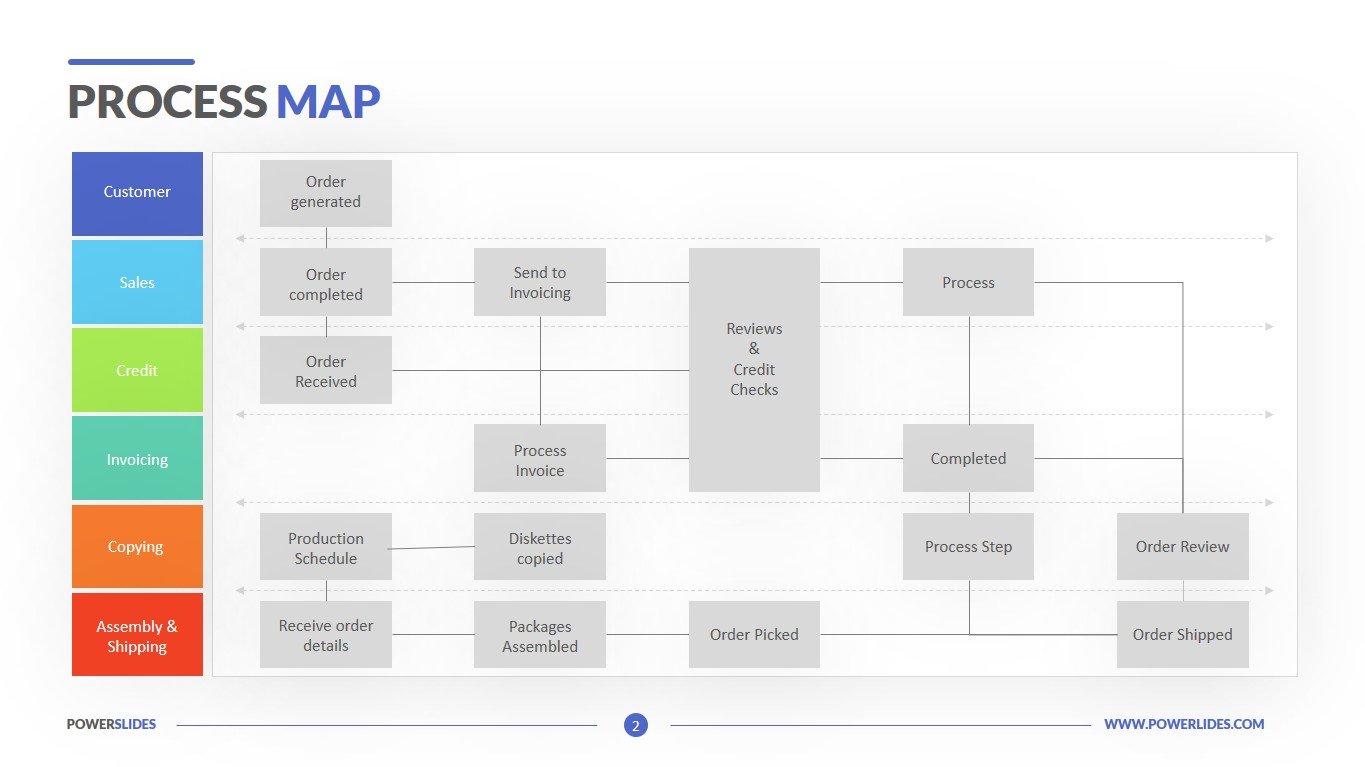
As a visual representation of data flow, flowcharts are useful in writing a program or algorithm and explaining it to others or collaborating with them on it. You can use an algorithm flowchart to spell out the logic behind a program before ever starting to code the automated process. It can help to organize big-picture thinking and provide a guide when it comes time to code.
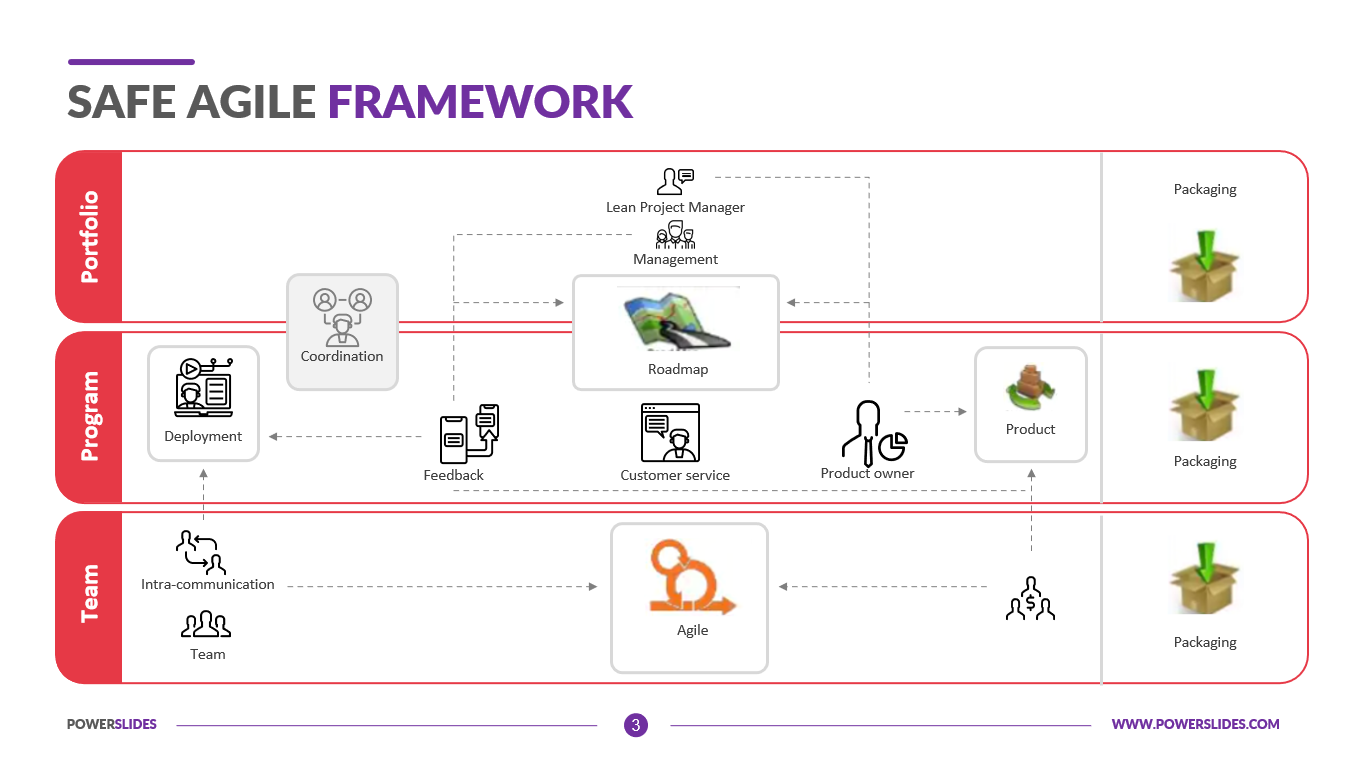
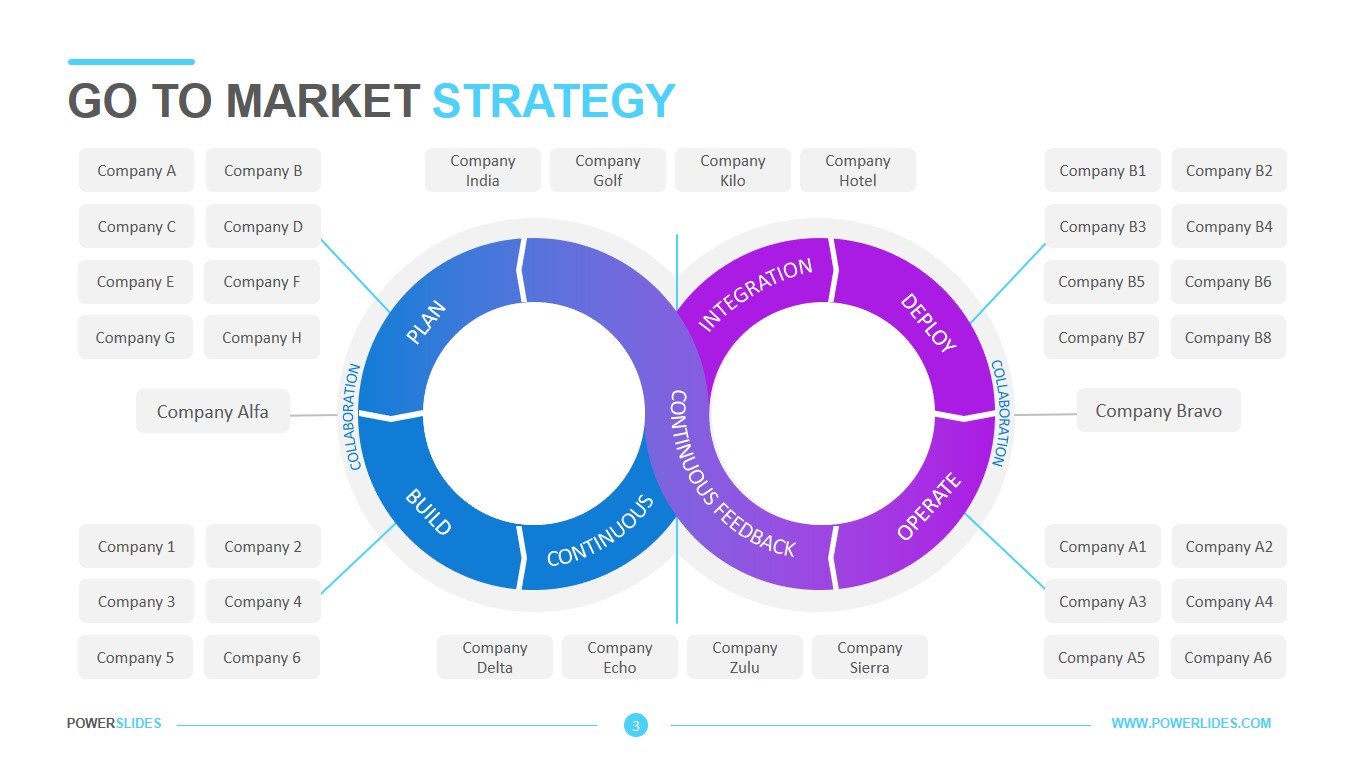
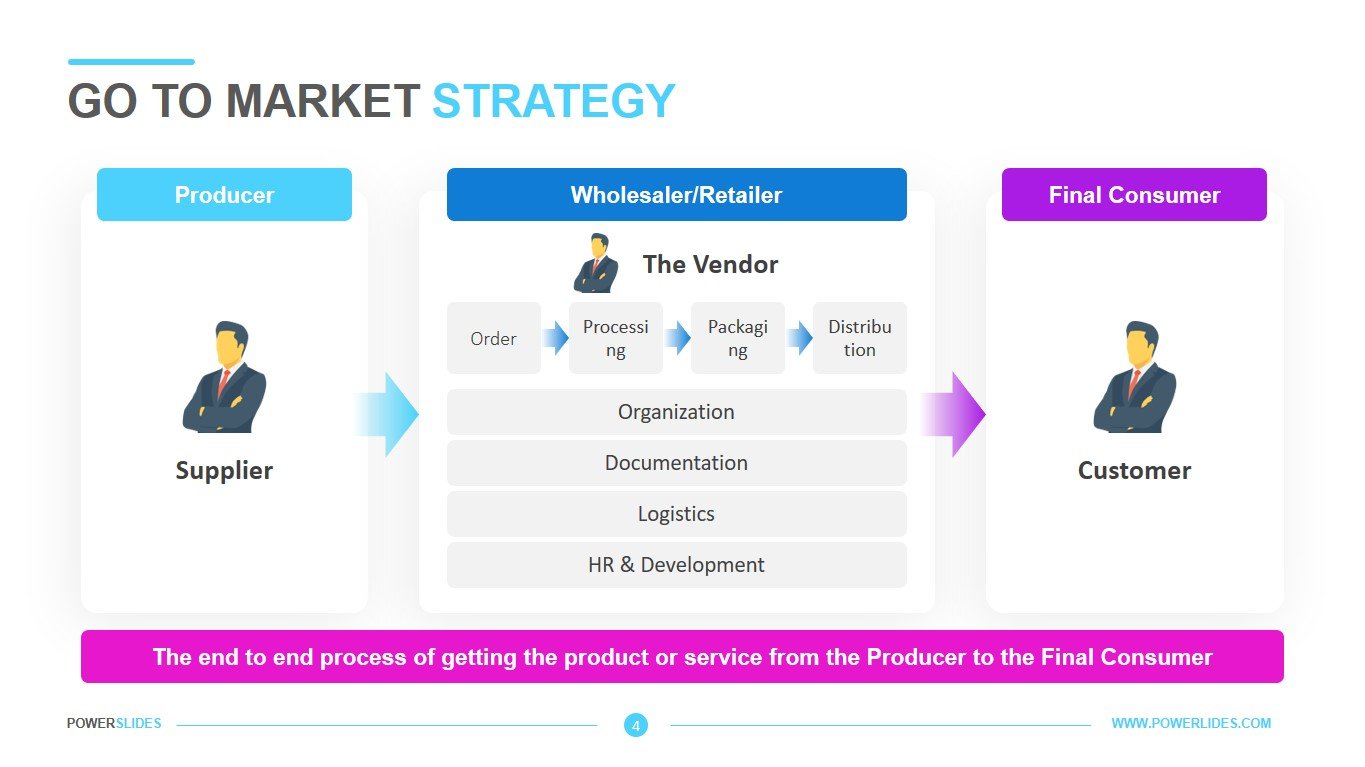
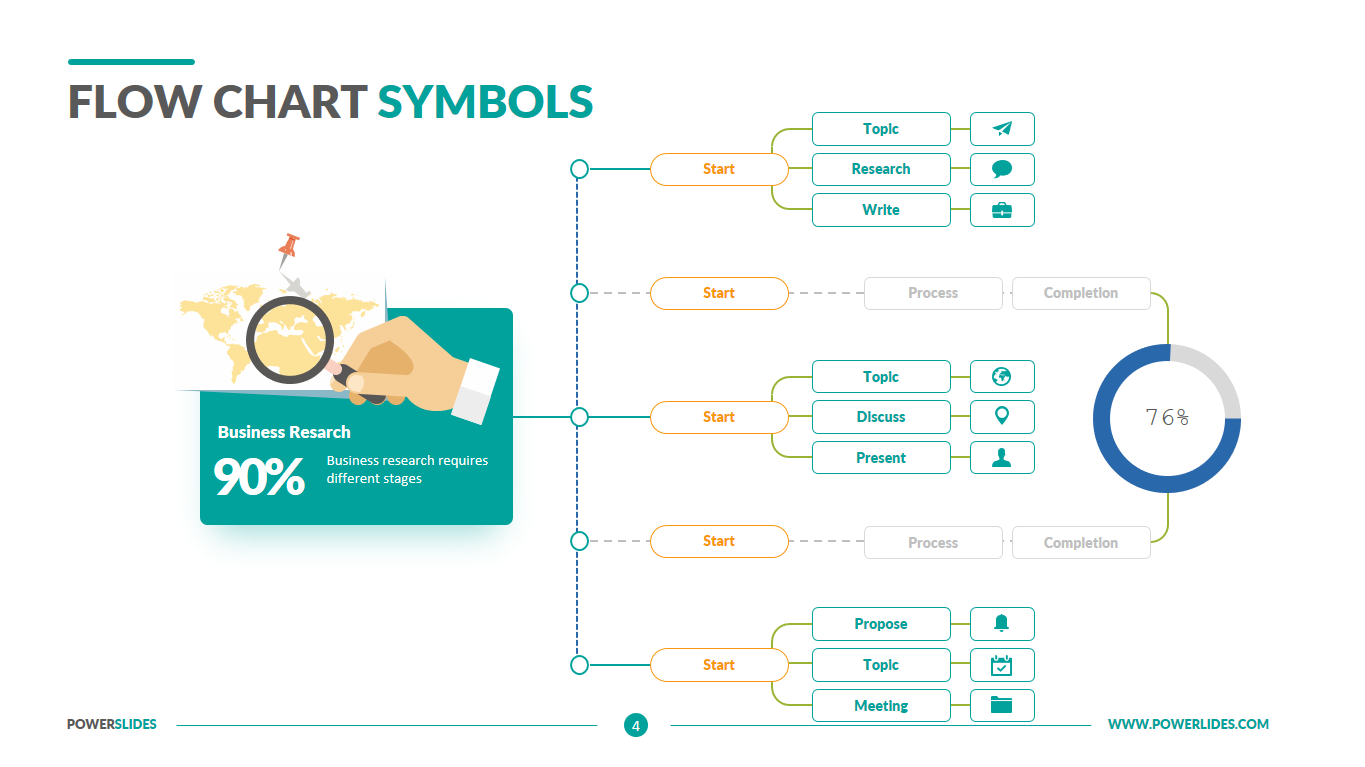
A flowchart is a visual representation of a process or workflow. Also known as a process flow diagram, this template is a great visual tool that can be adapted for a wide variety of purposes, such as a manufacturing process, an administrative or service process, or a project plan or operational flow. A good flow chart will flex to those processes and depict your ways of working. A flow chart can be a powerful tool if used the right way.
Company leaders can use this template when describing business processes and functional relationships between departments. Engineers can use this template when developing standardization for new equipment. Marketers can use the slides from this template when preparing an ad campaign. For example, you can design a survey and describe the process of interaction with a client during an advertising campaign.
Software developers can use this template when preparing a program flow diagram and algorithms. Occupational safety professionals can use this template when designing fire escape plans or preparing equipment for operation. HR managers can use this template when describing the process of storing candidate questionnaires and personal files of company employees.
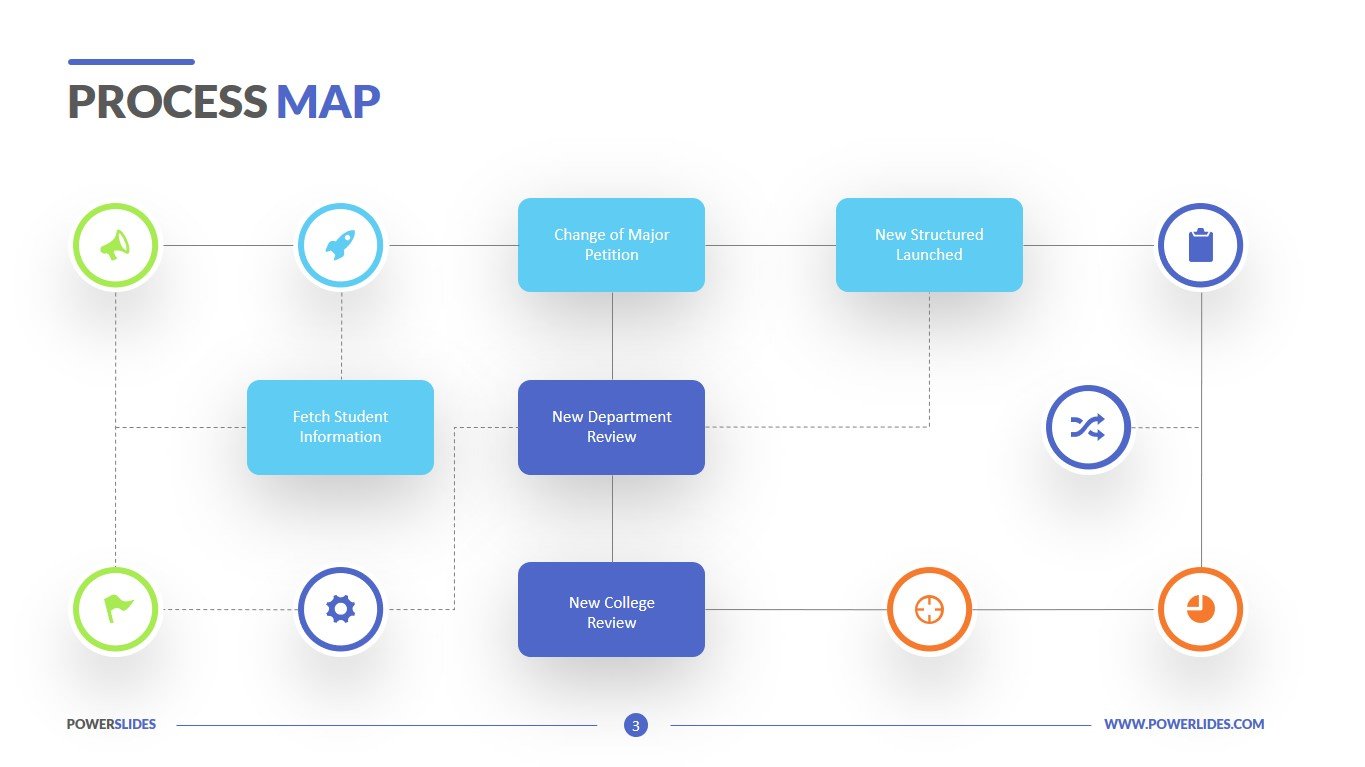
Law firm staff can use this template to prepare client information about the litigation and litigation process. Construction companies can use the slides of this template when preparing a permitting process for the construction of residential or commercial properties. Analysts can prepare a report on the possible development of events in the market using the slides of this template. You can also show what actions will be taken in each case.
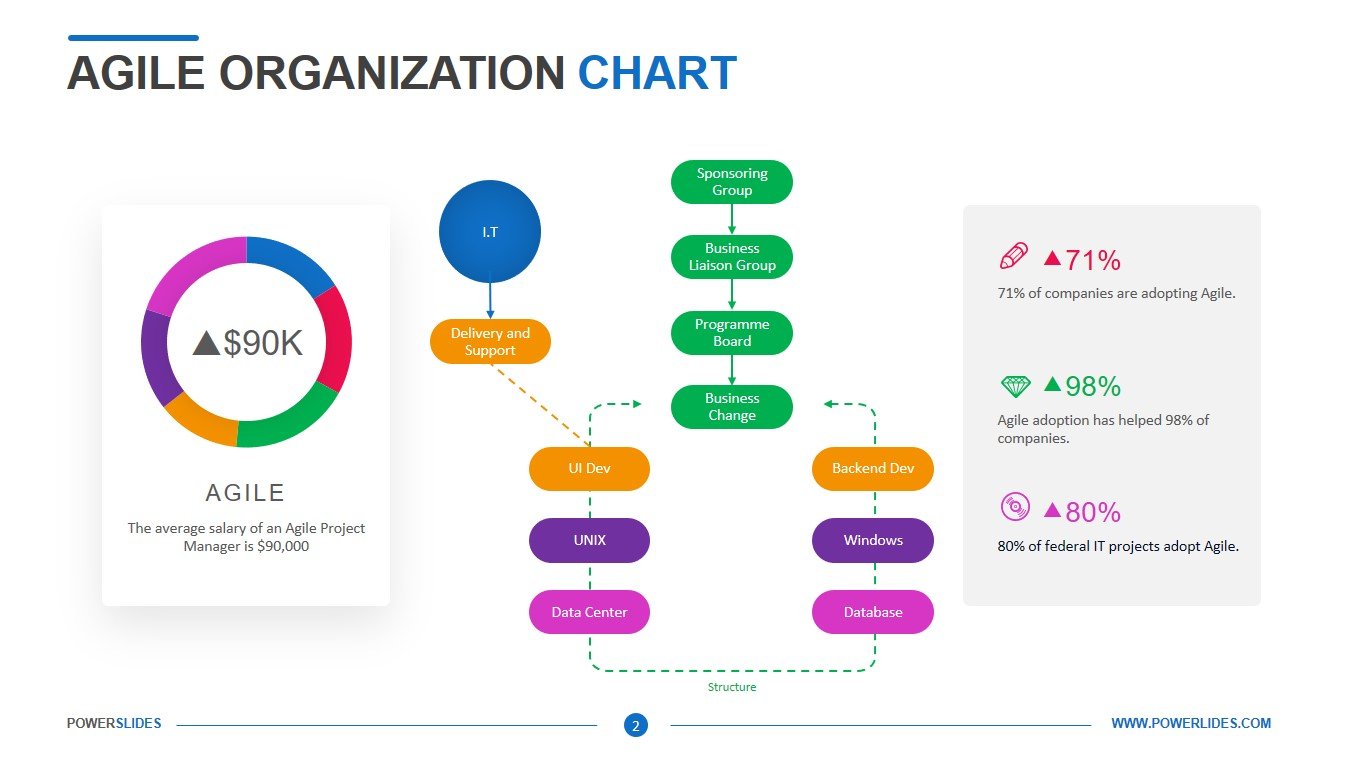
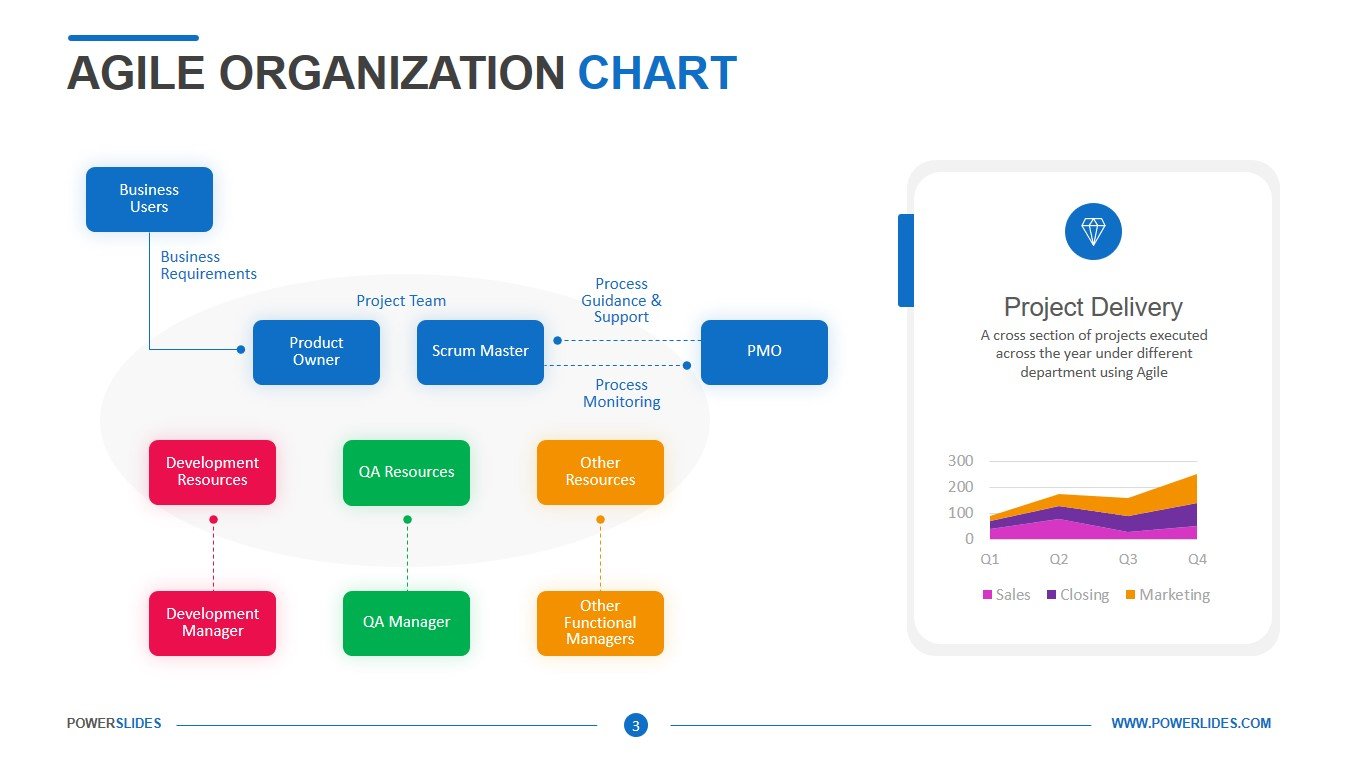
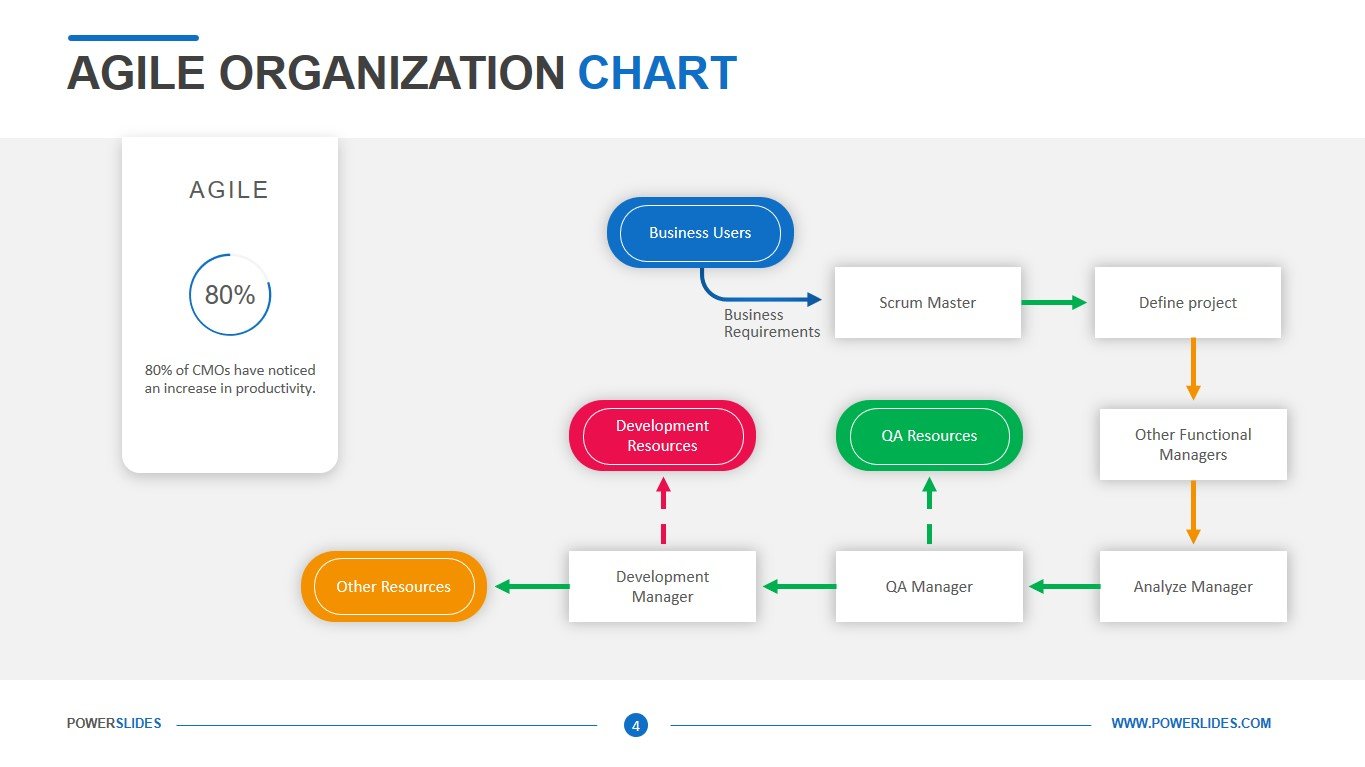
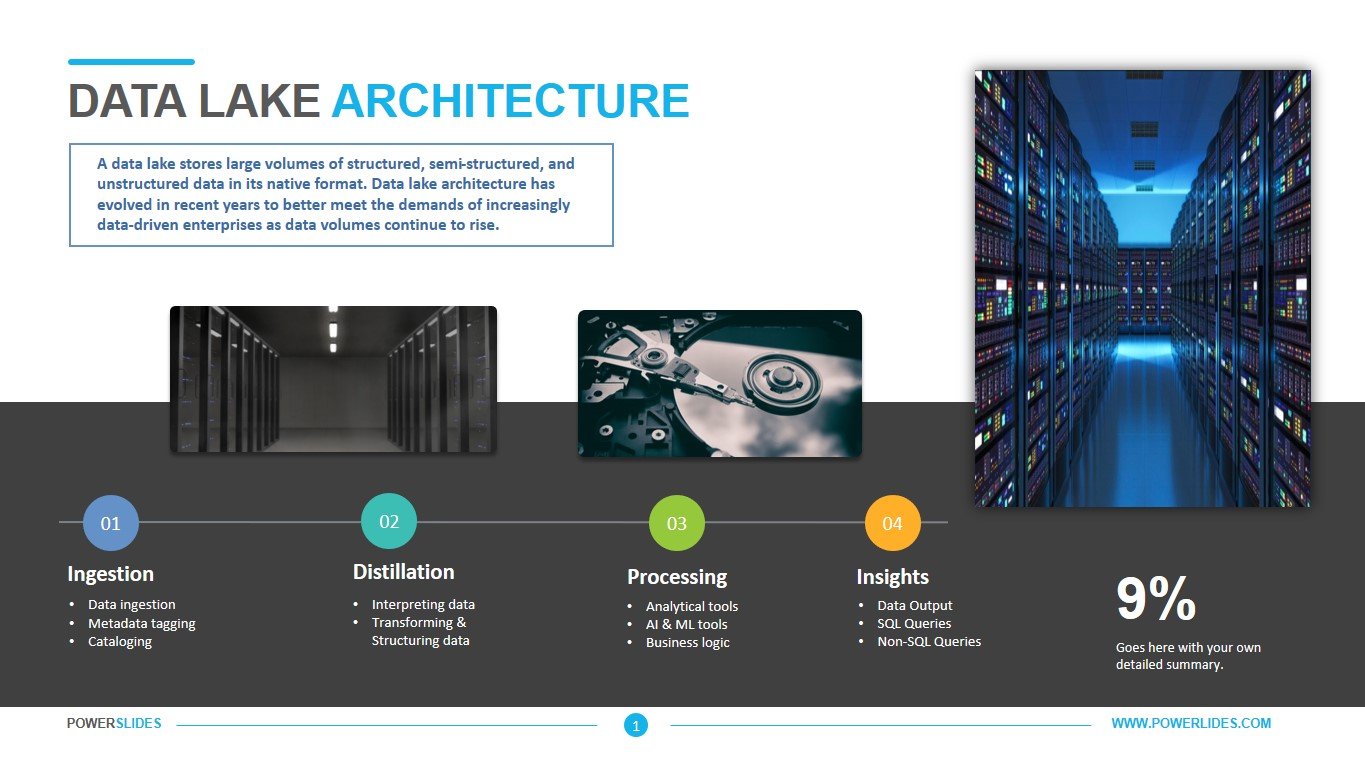
Available in four design variations, this flow chart offers a sequential view of tasks, responsibilities and steps required to complete a project. Each process is represented by a symbol, which connects multiple steps. This template provides a holistic view of your project while ensuring all stakeholders are working towards a common goal. All text, symbols, colors and graphics are editable to meet your brand aesthetic. Flow Chart Symbols template will be a worthy addition to your collection of professional presentations.


