Profit & Loss
What do you think of this template?

 (4.43/ 5)
31 ratings

 4 Slides
 File size: 16:9
 Fonts: Lato, Calibri
 Supported version
PPT 2010, PPT 2013, PPT 2016
Supported version
PPT 2010, PPT 2013, PPT 2016

Product details
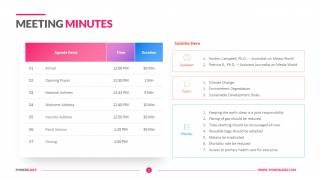
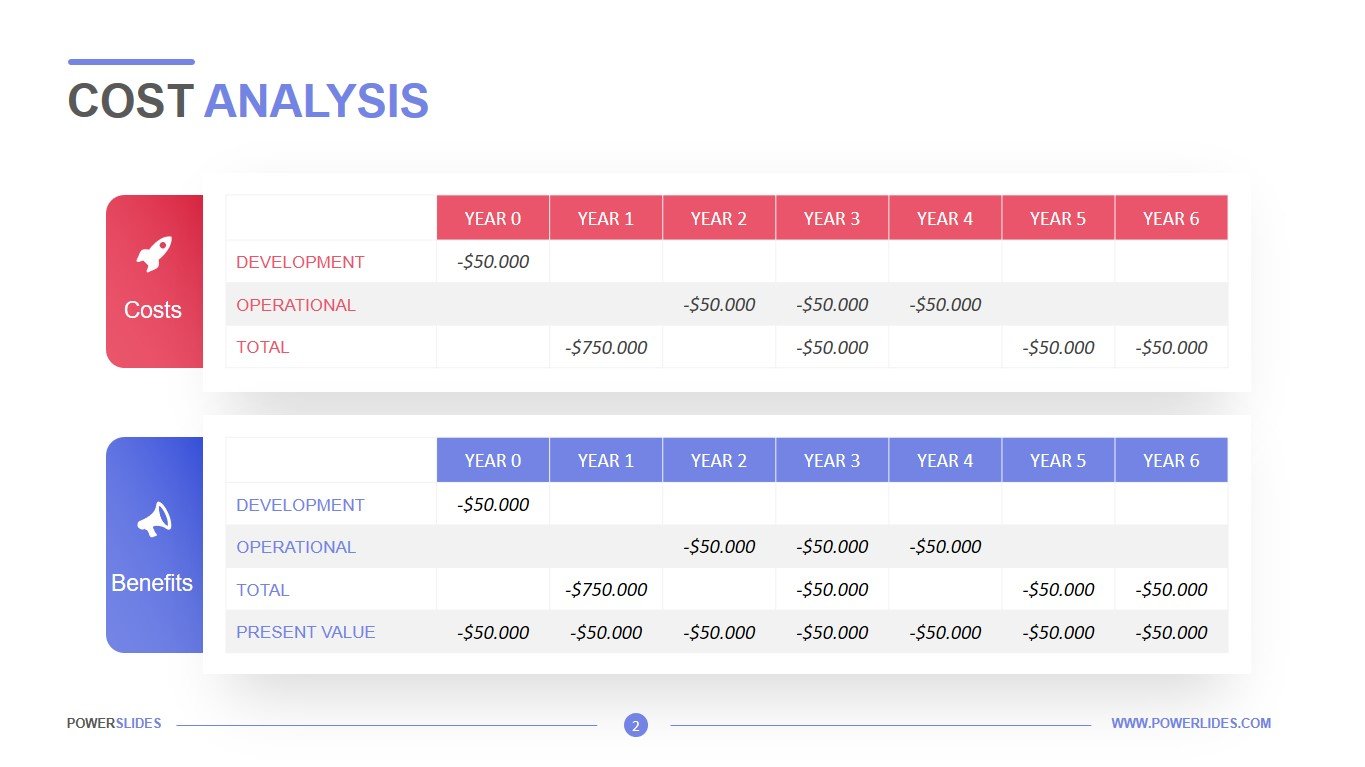
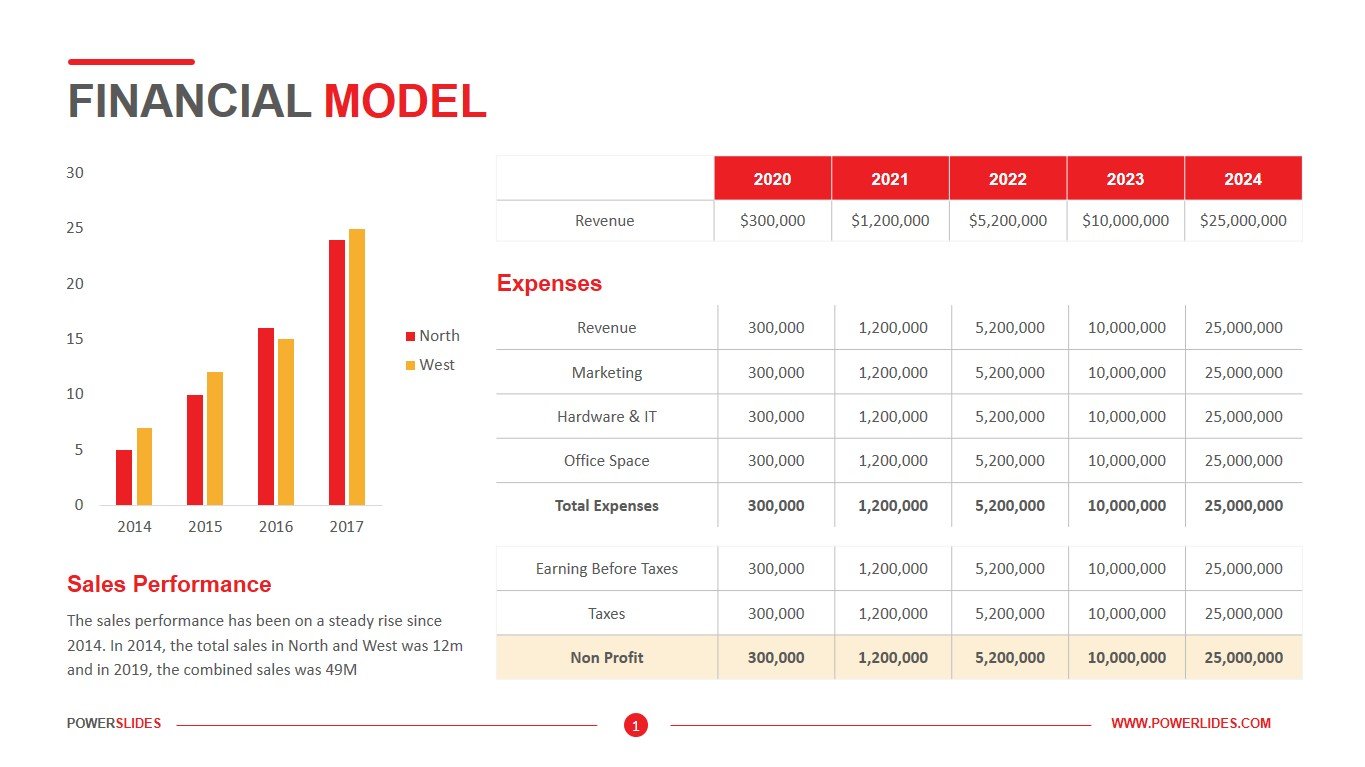
Are you preparing a profit and loss statement? Want to present your report with big financial data in an understandable form? Do you need visualization tools to better understand the information you provide? Power Slides will help you present your profit and loss report in a beautiful and understandable way. We bring to your attention our go-to Profit & Loss Template.
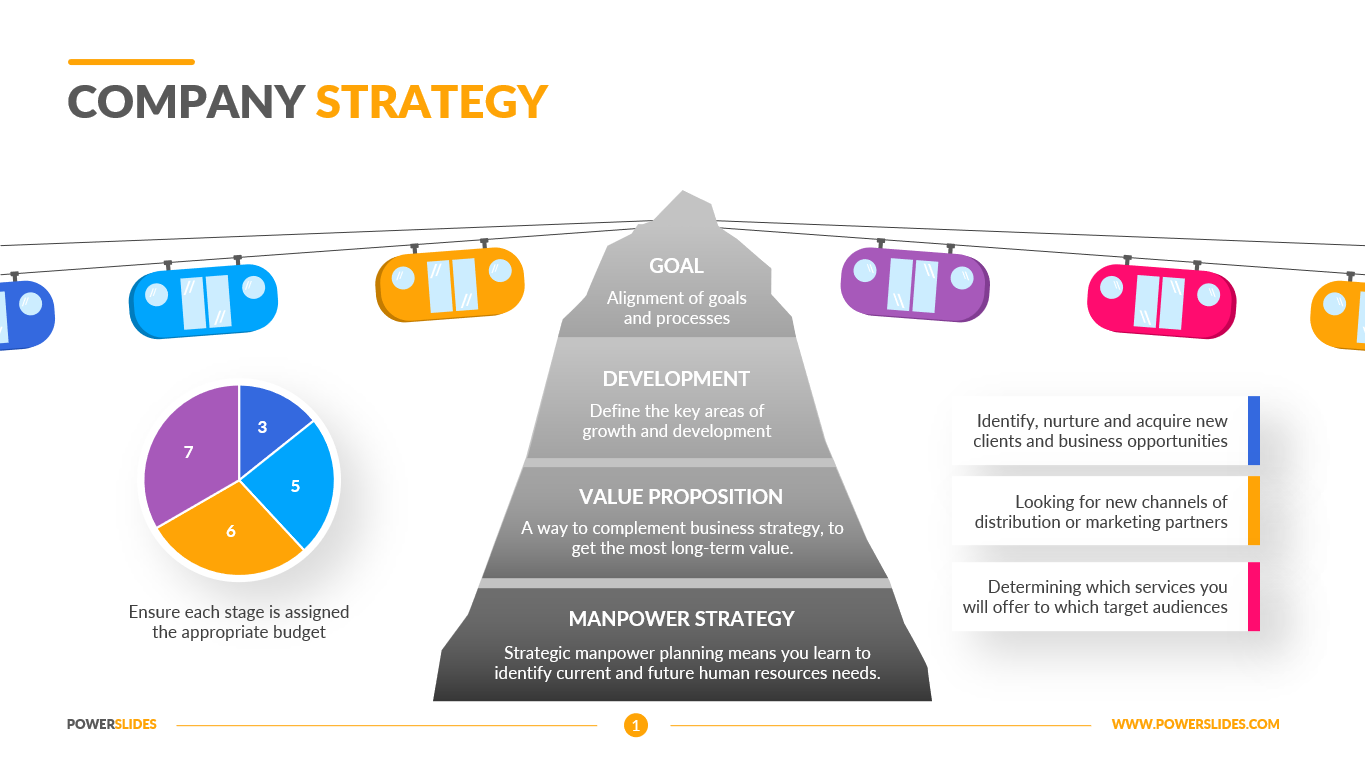
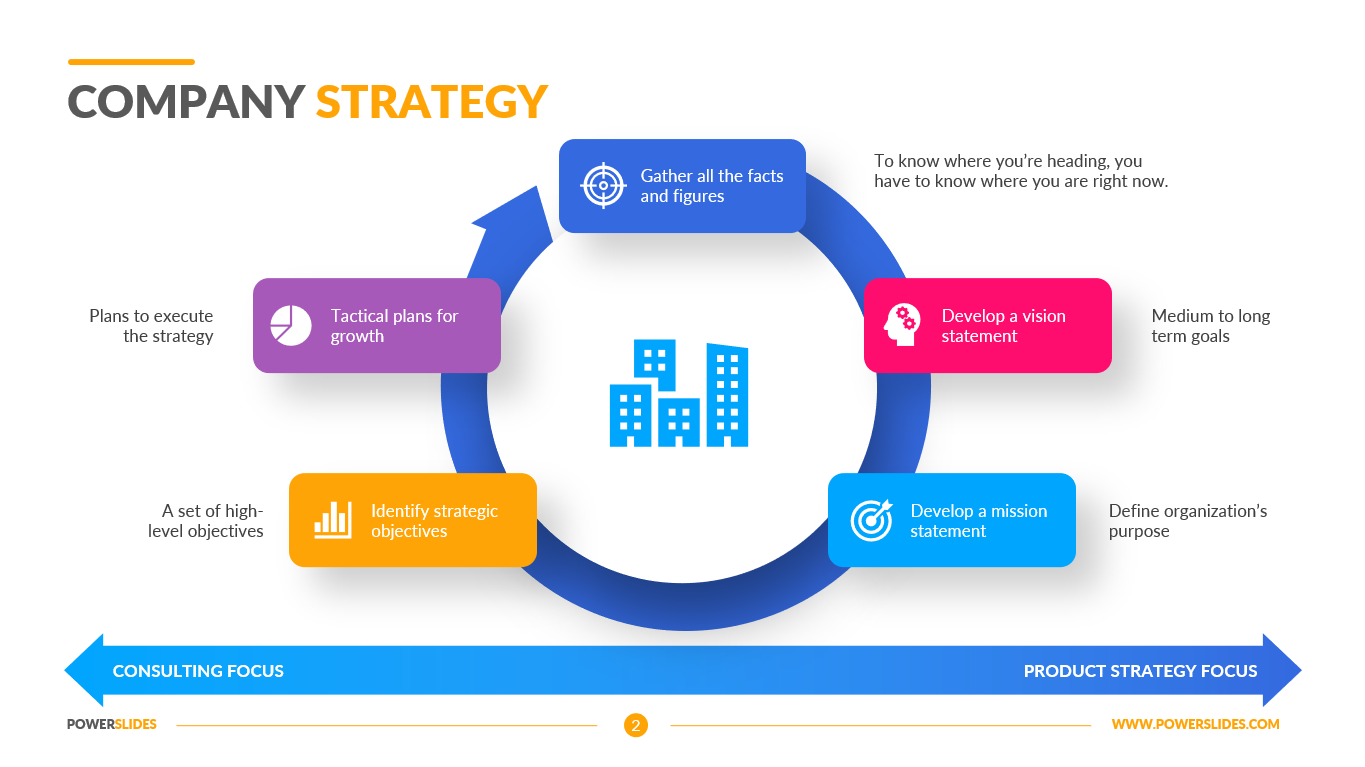
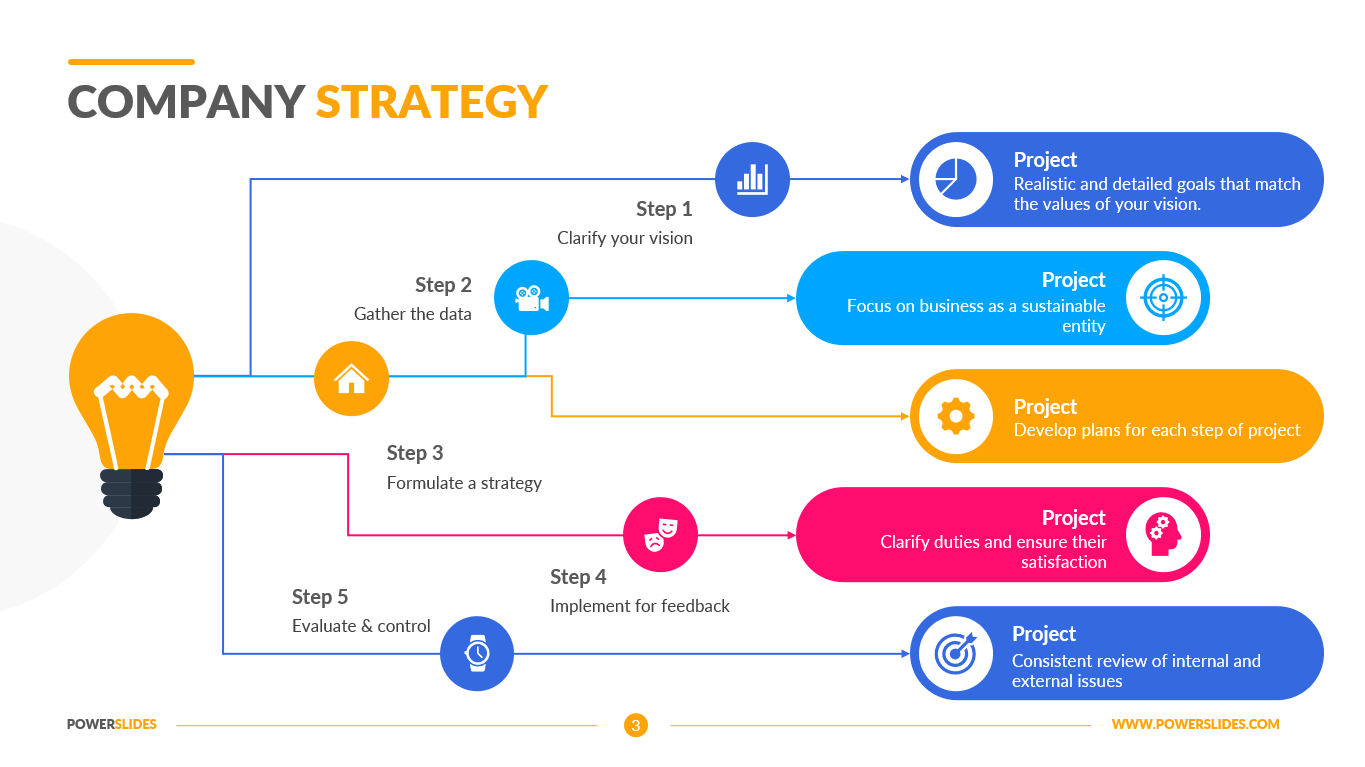
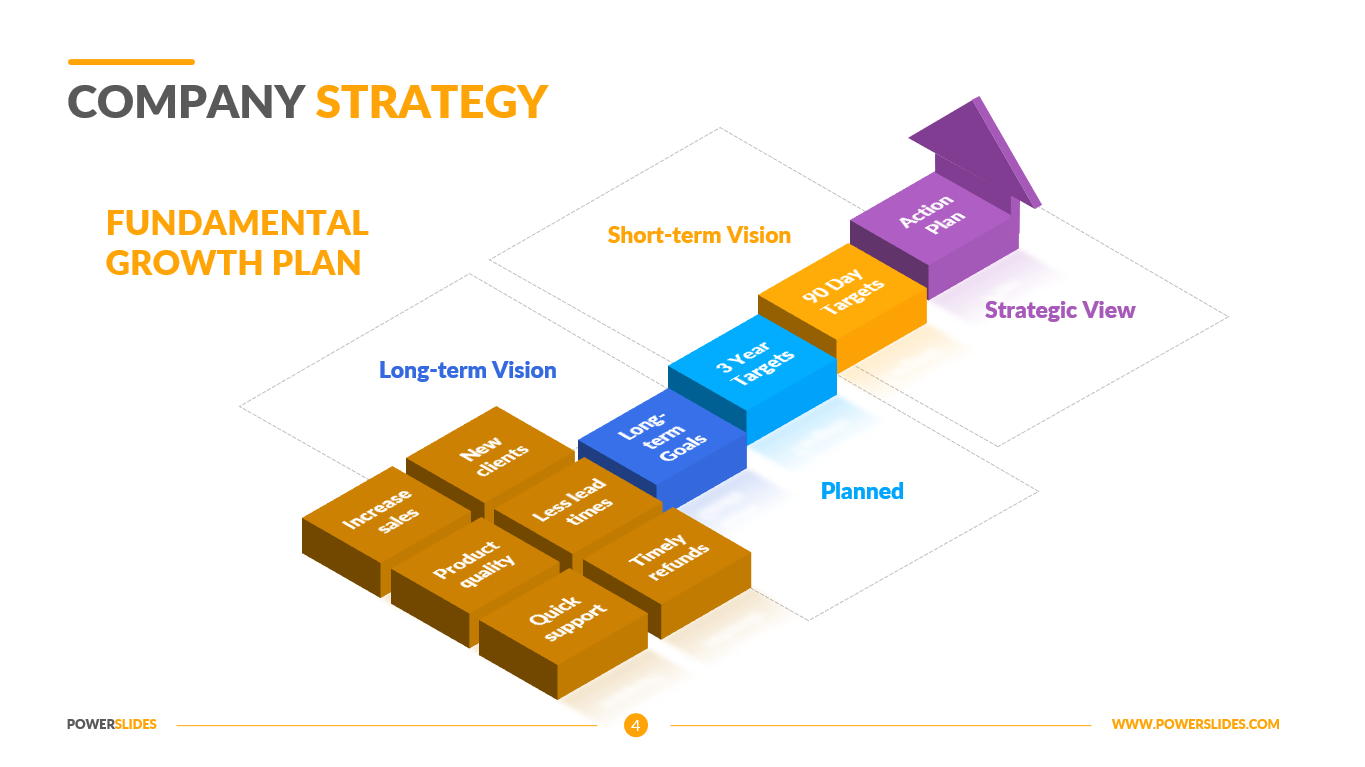
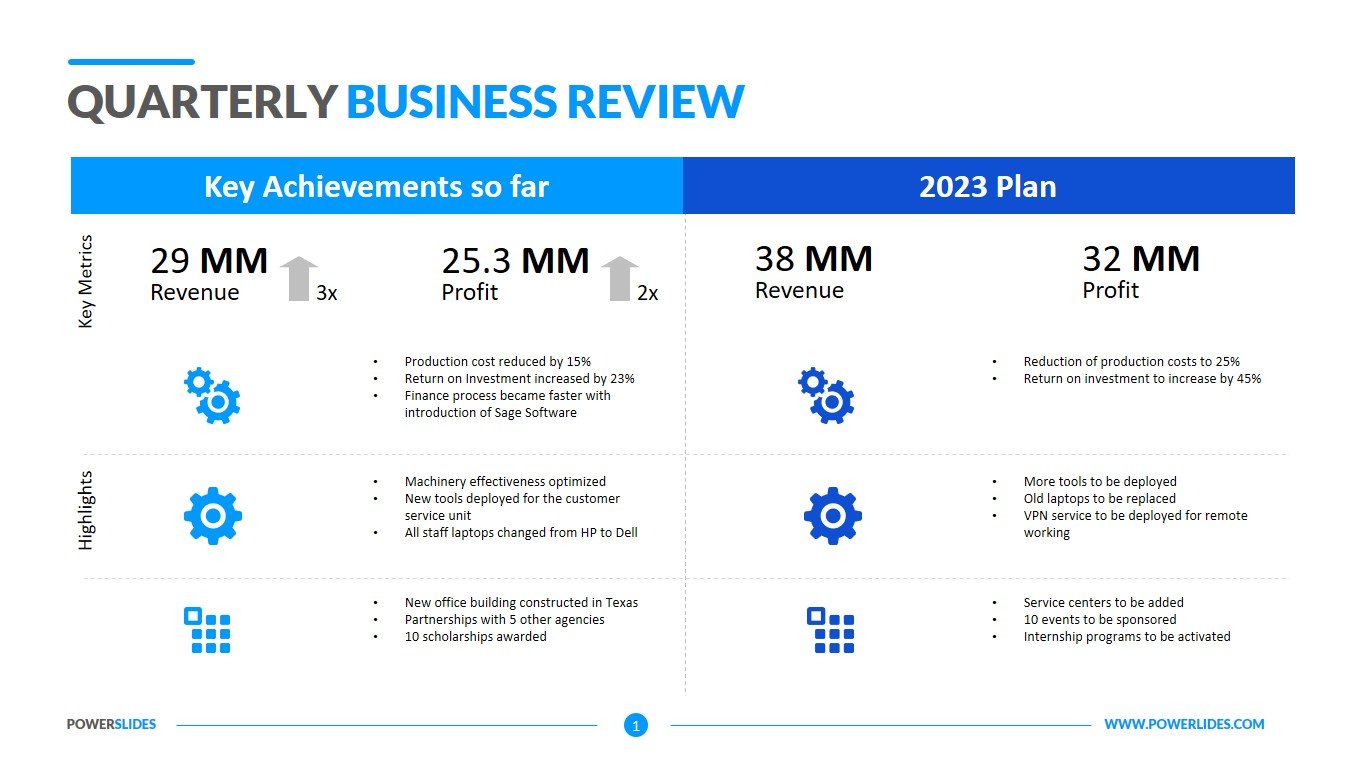
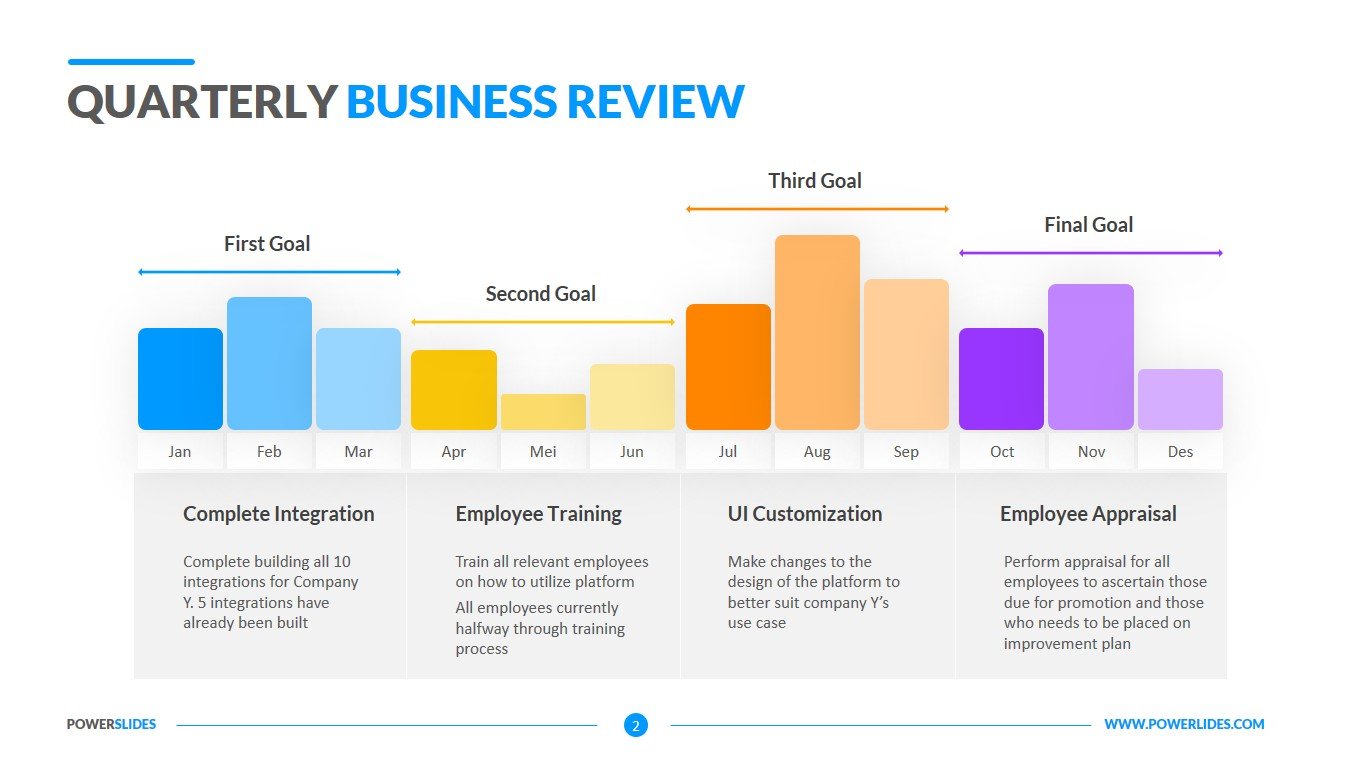
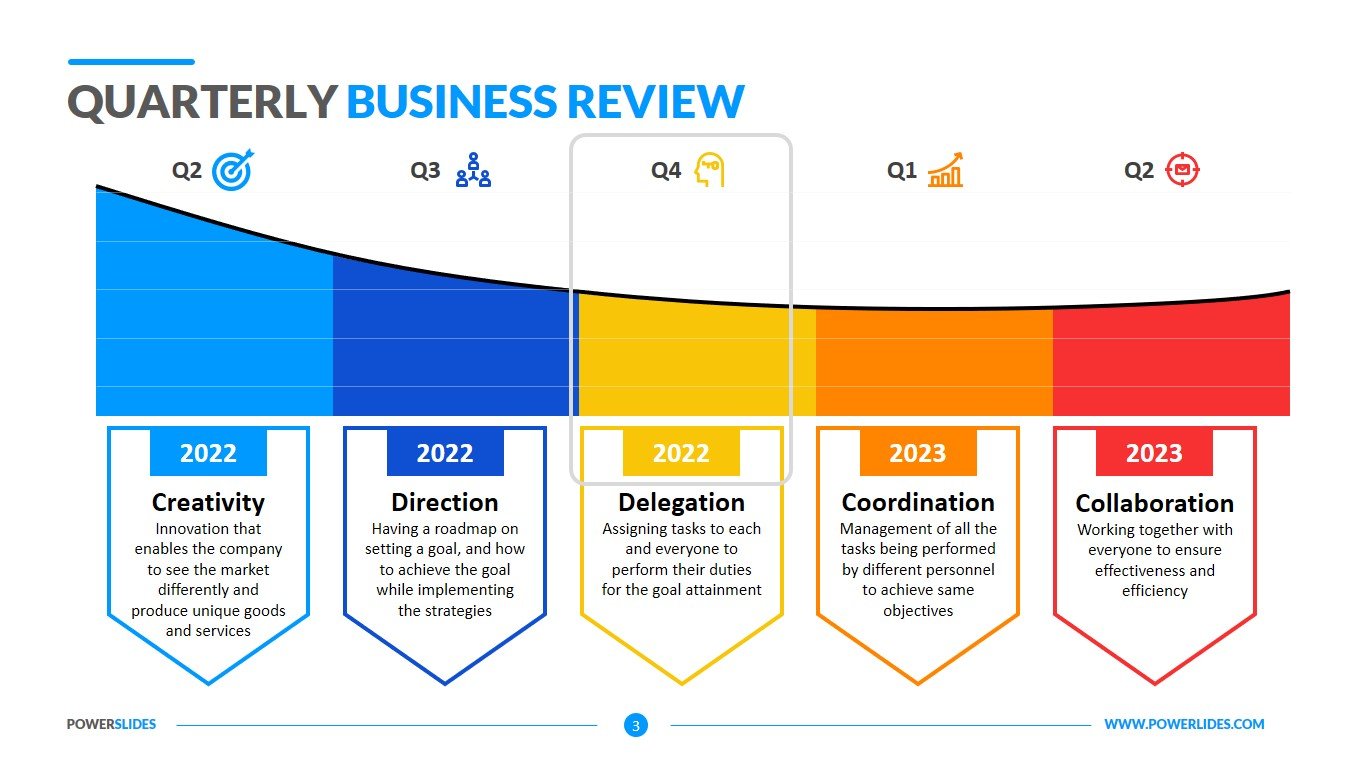
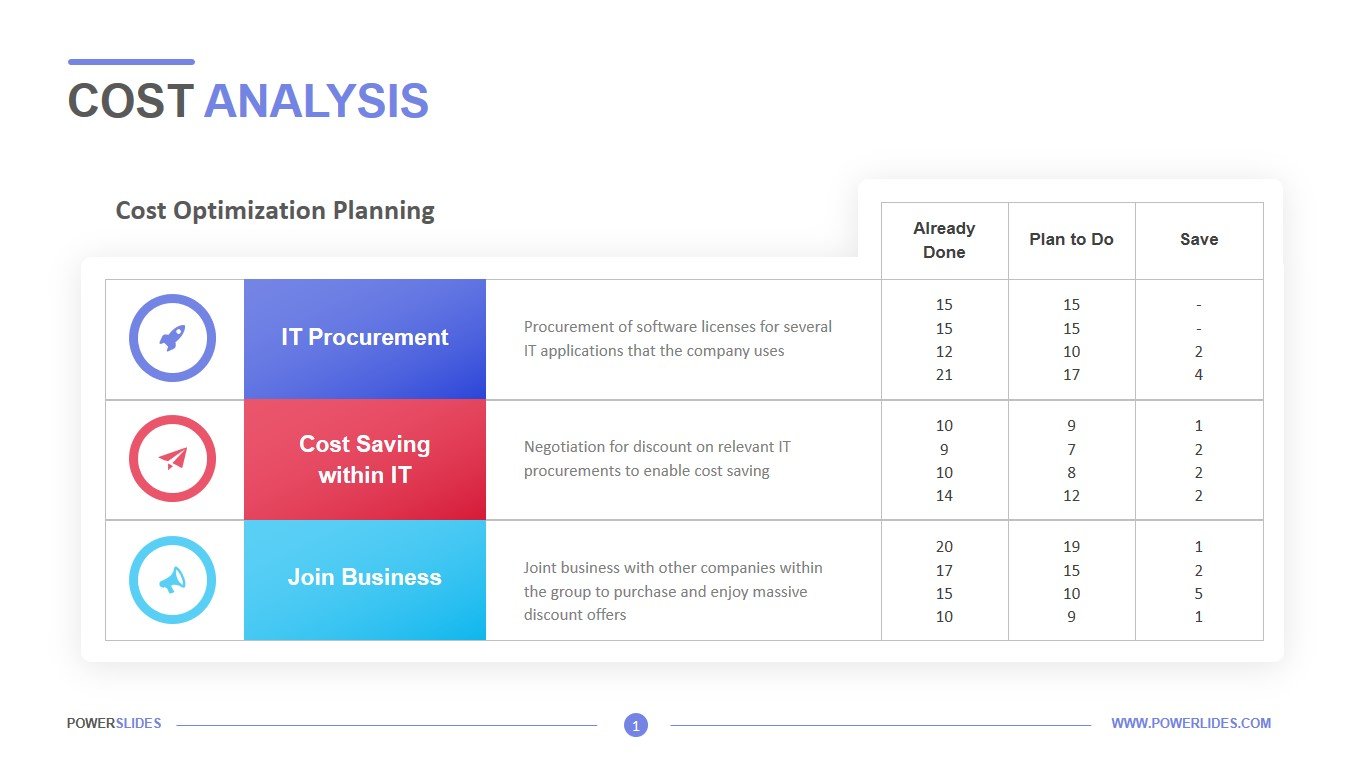
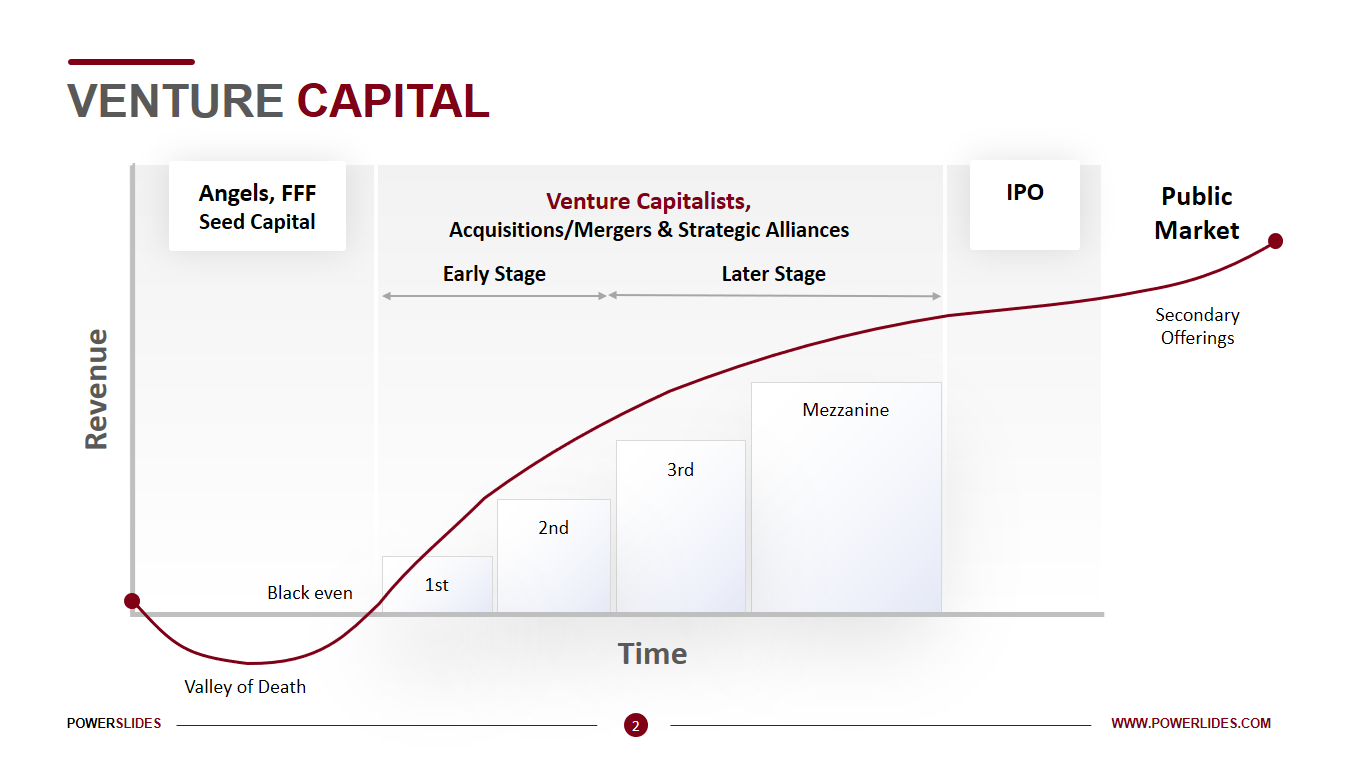
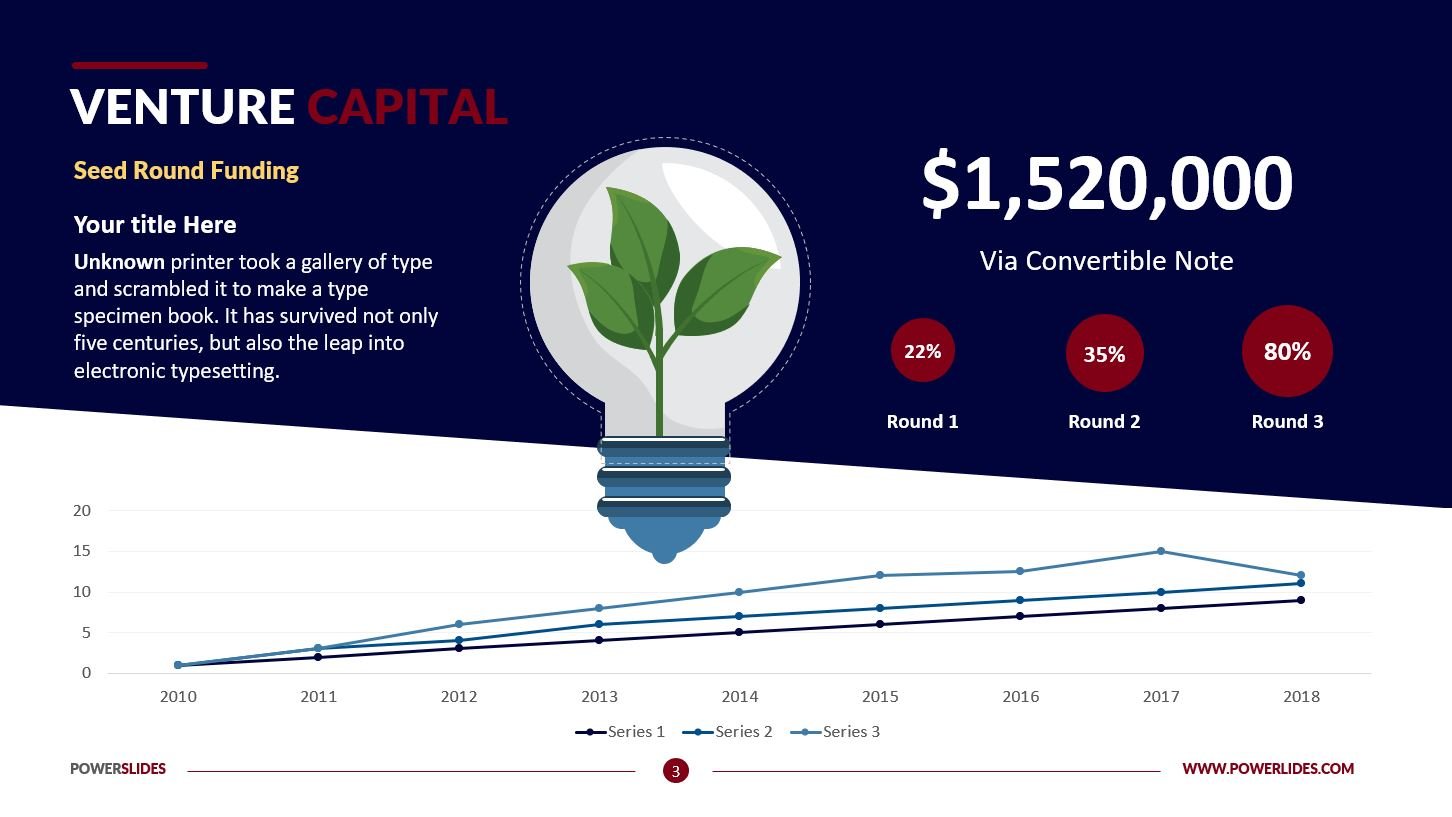
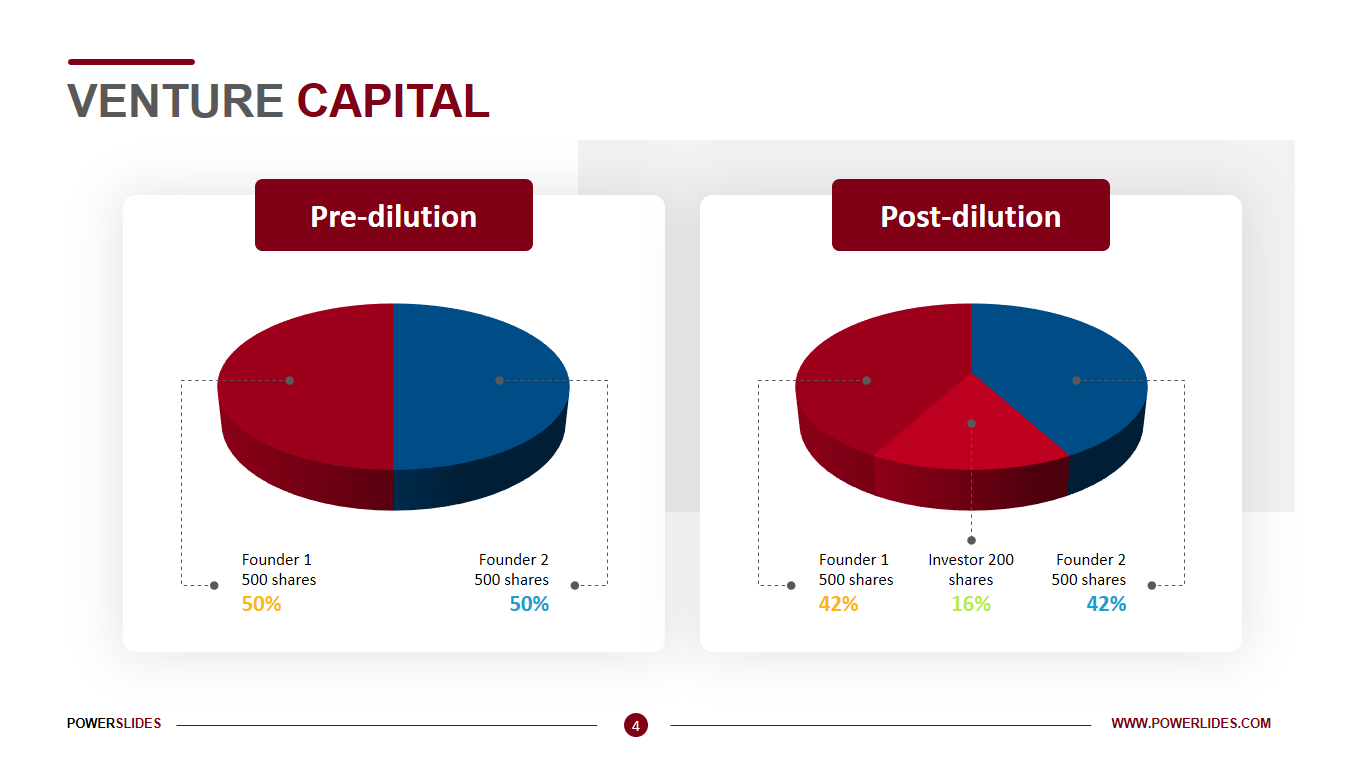
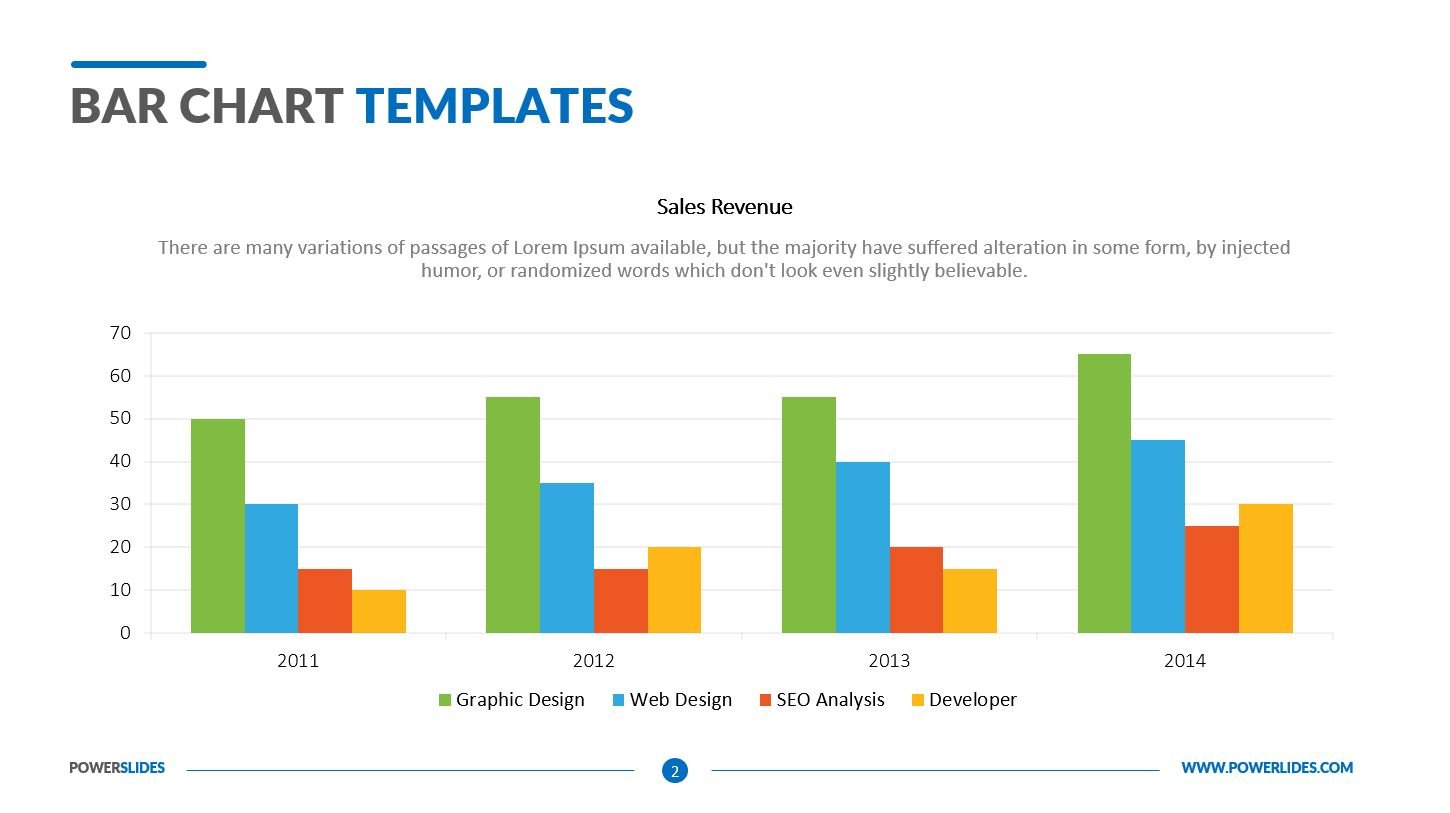
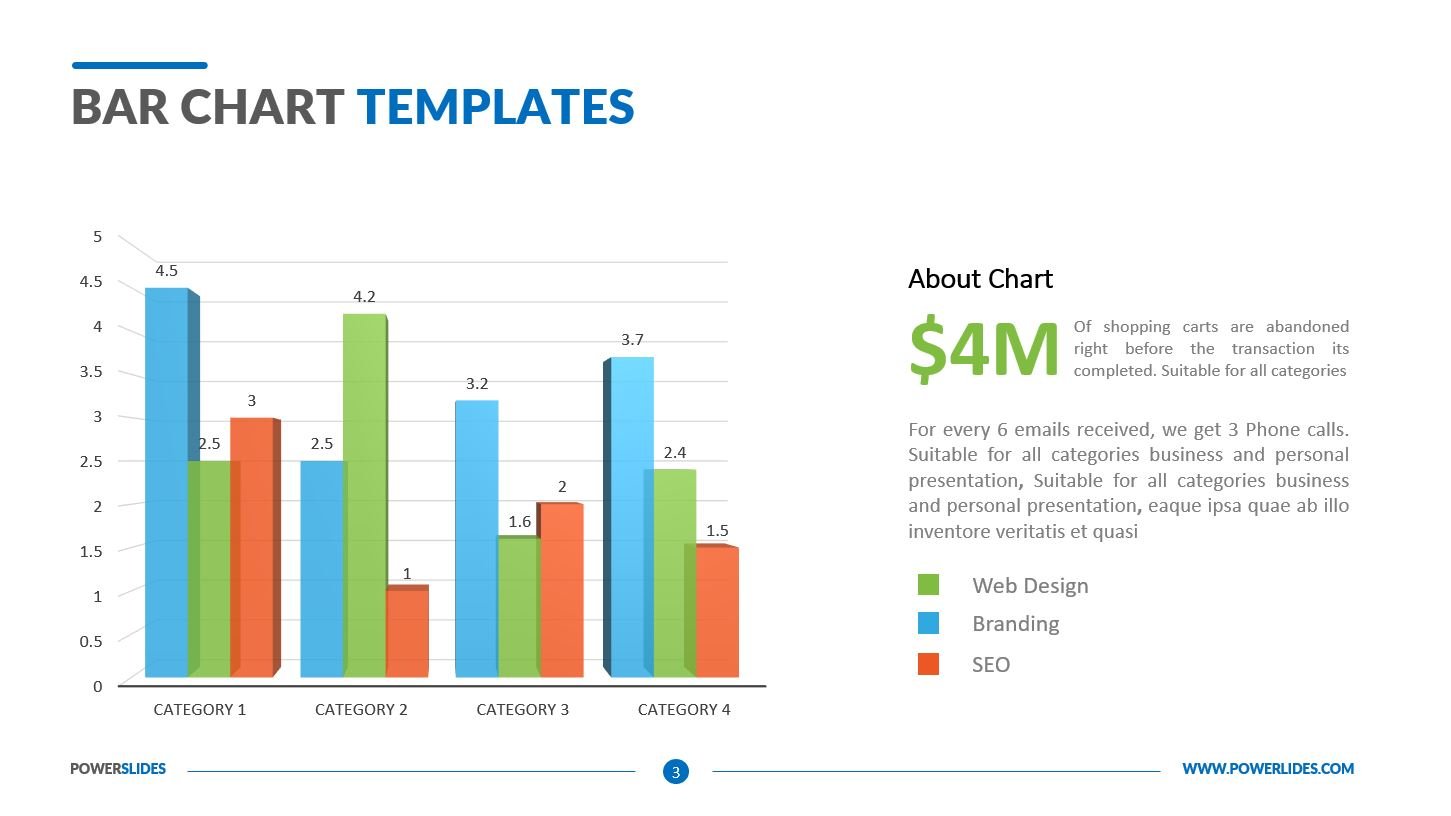
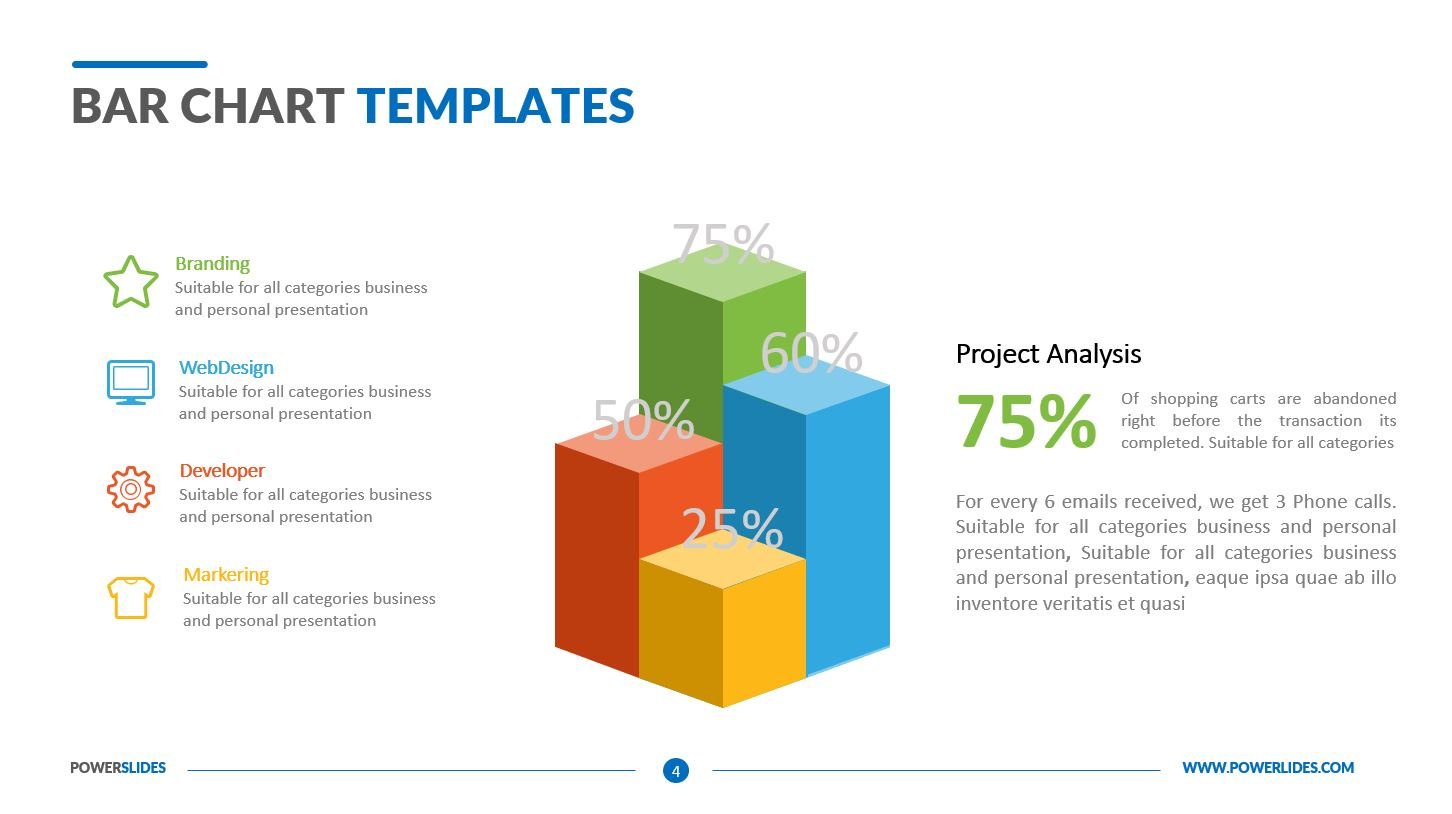
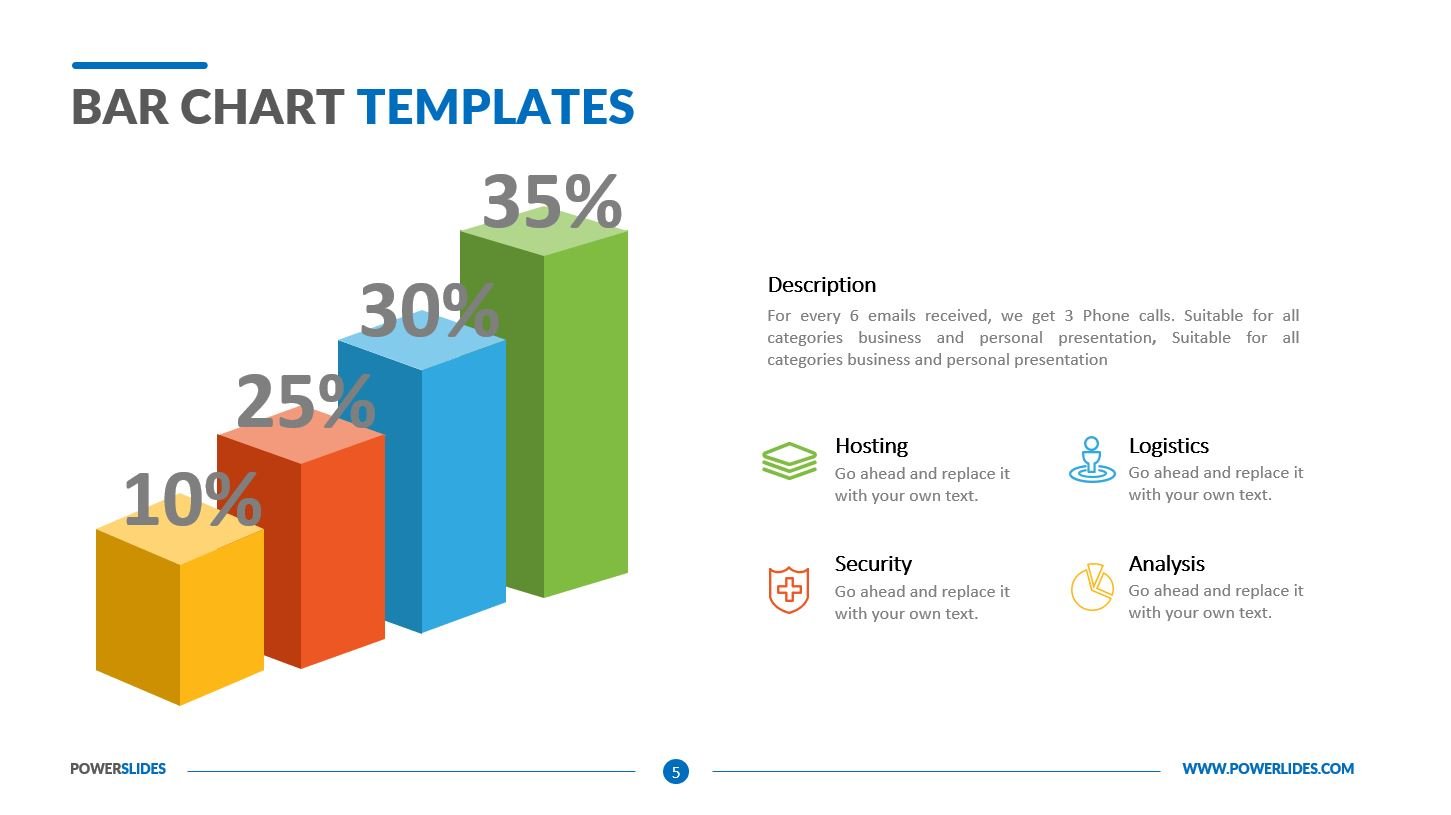
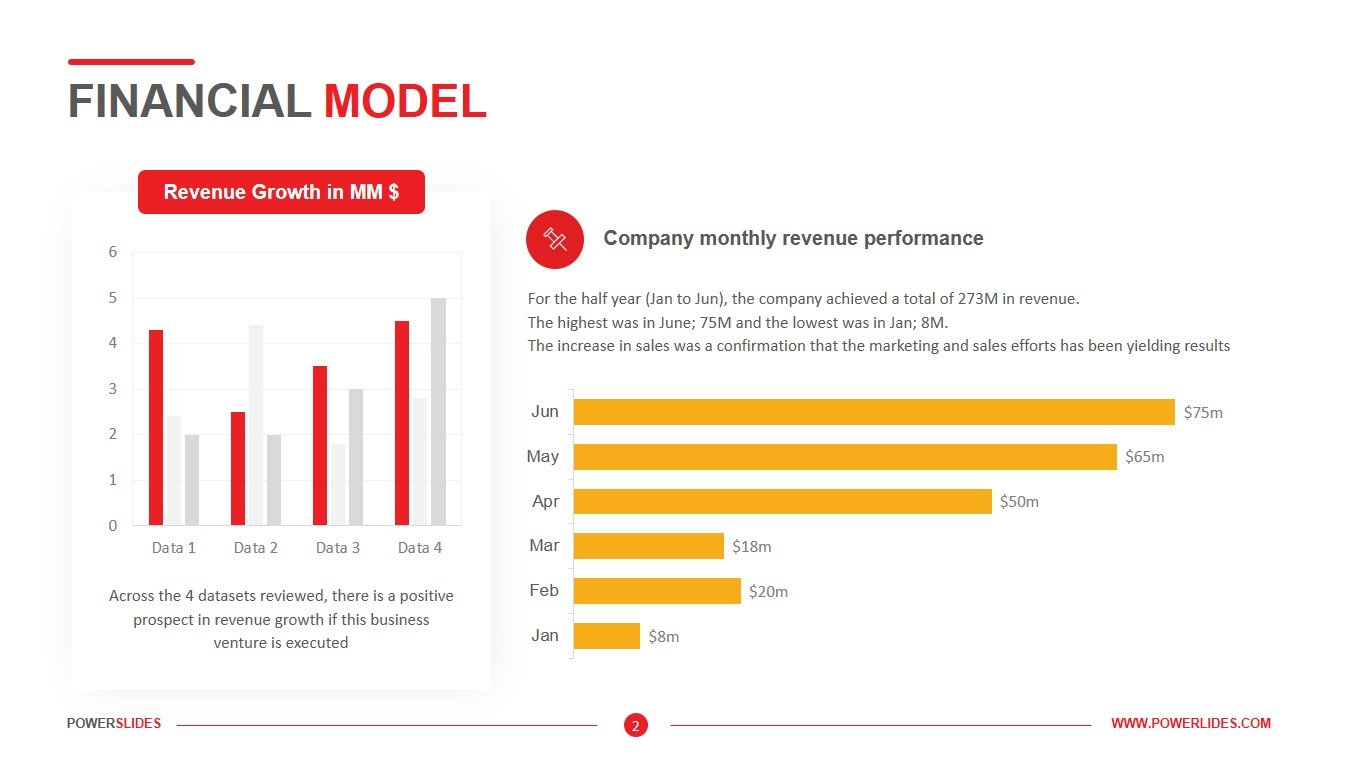
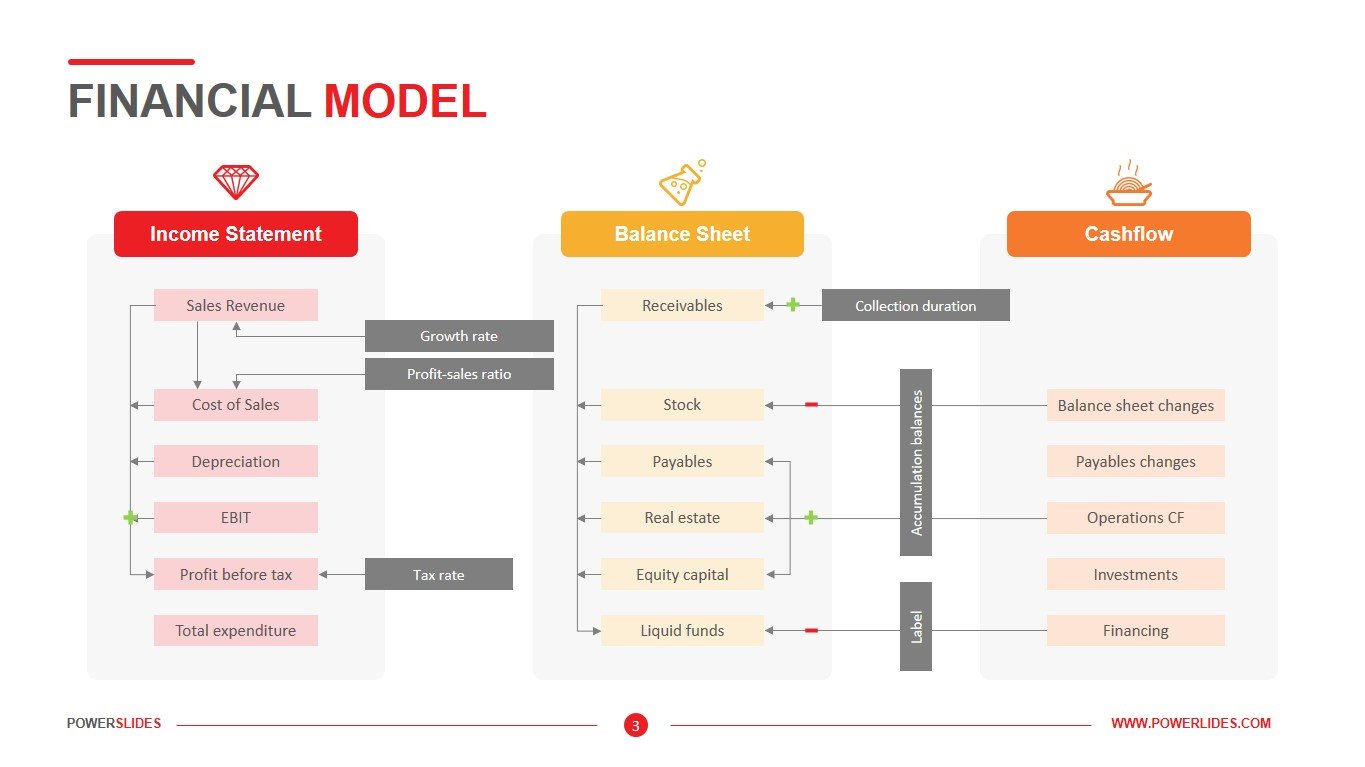
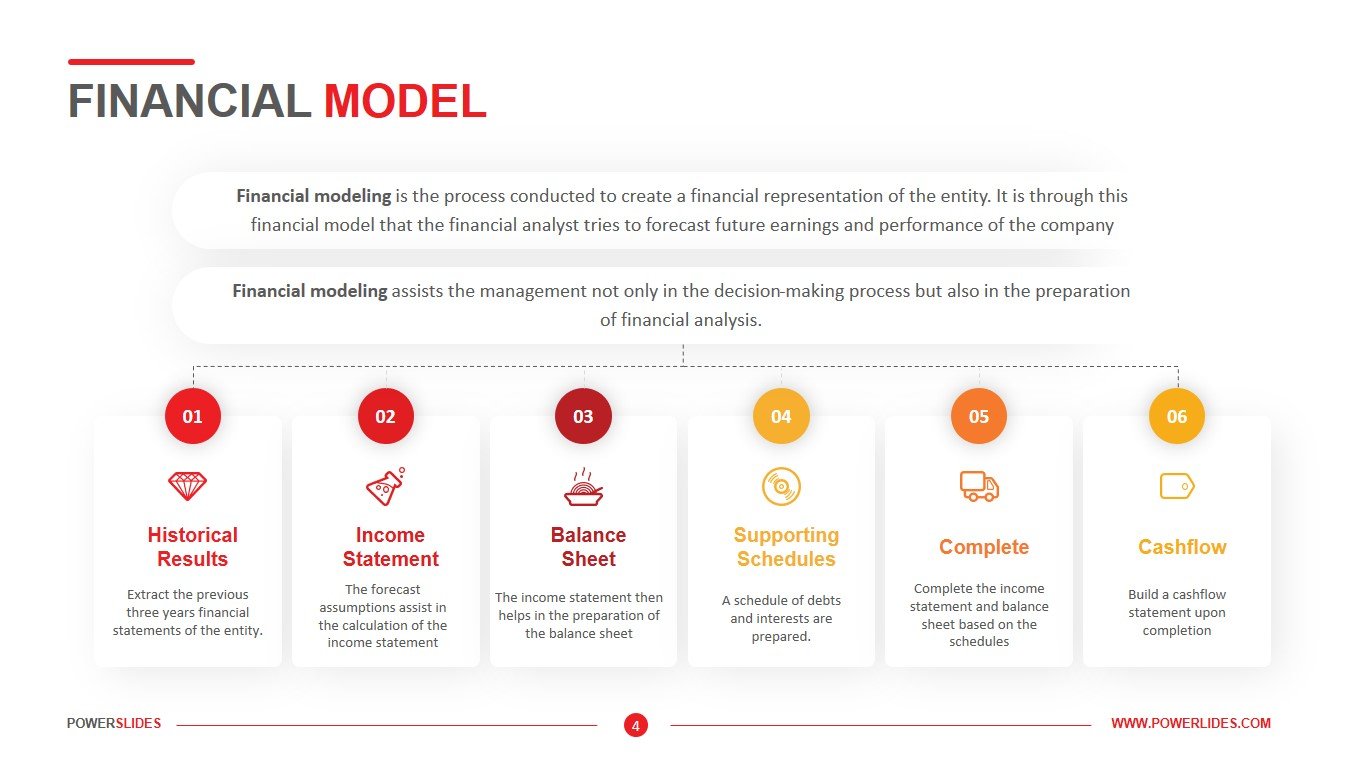
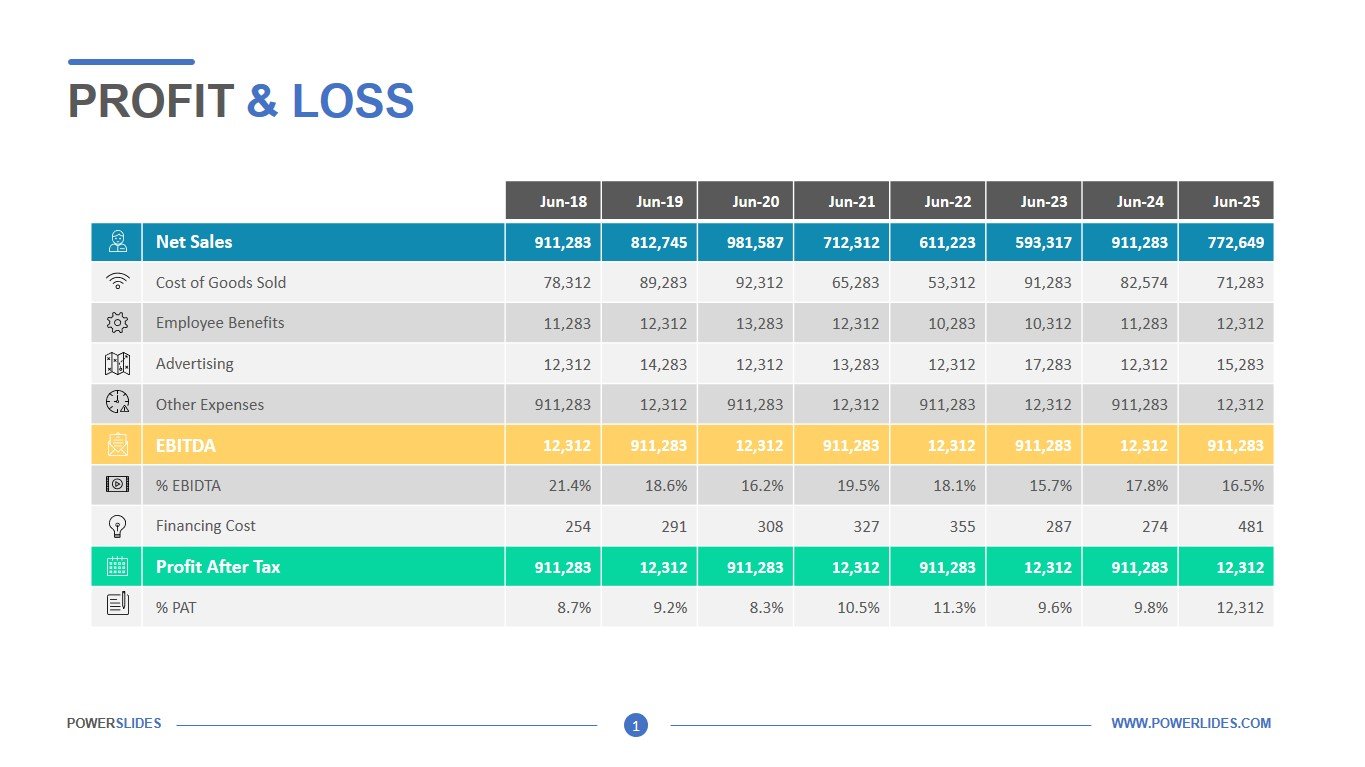
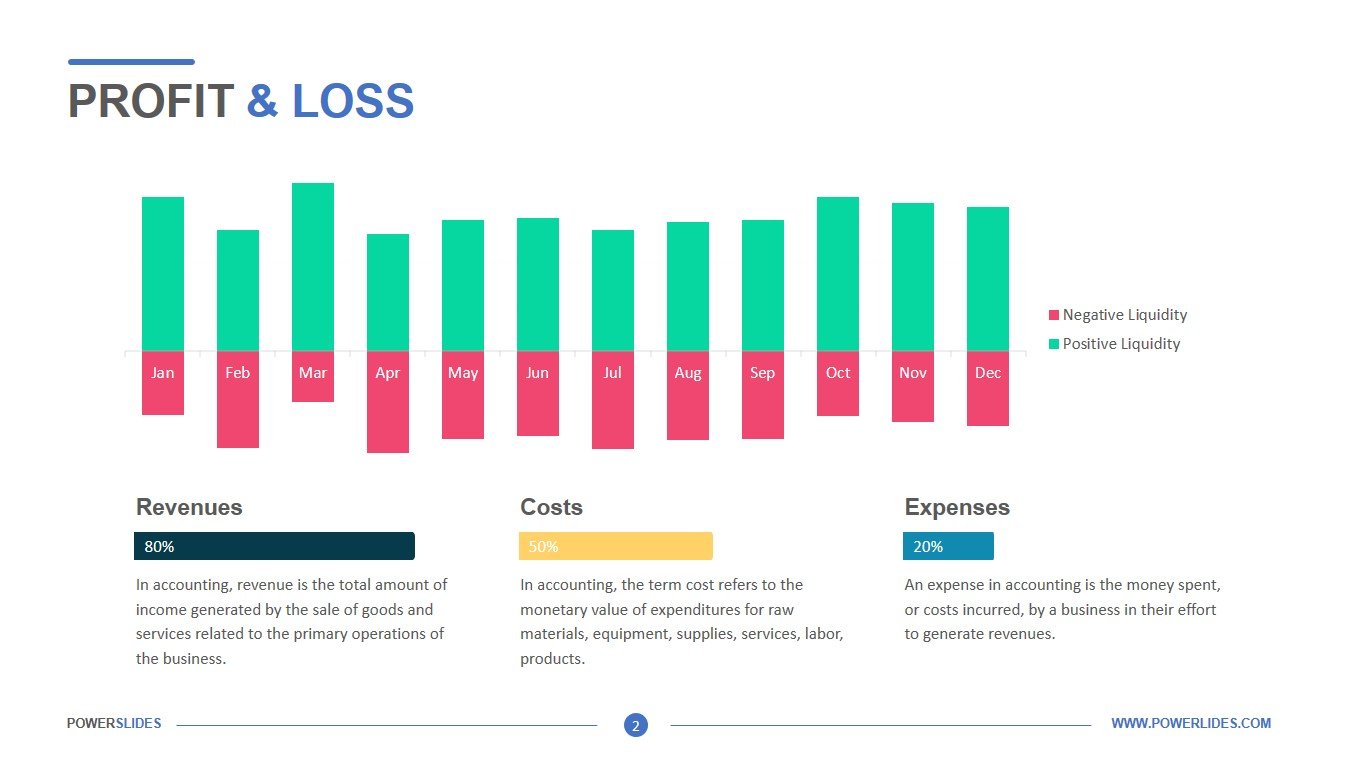
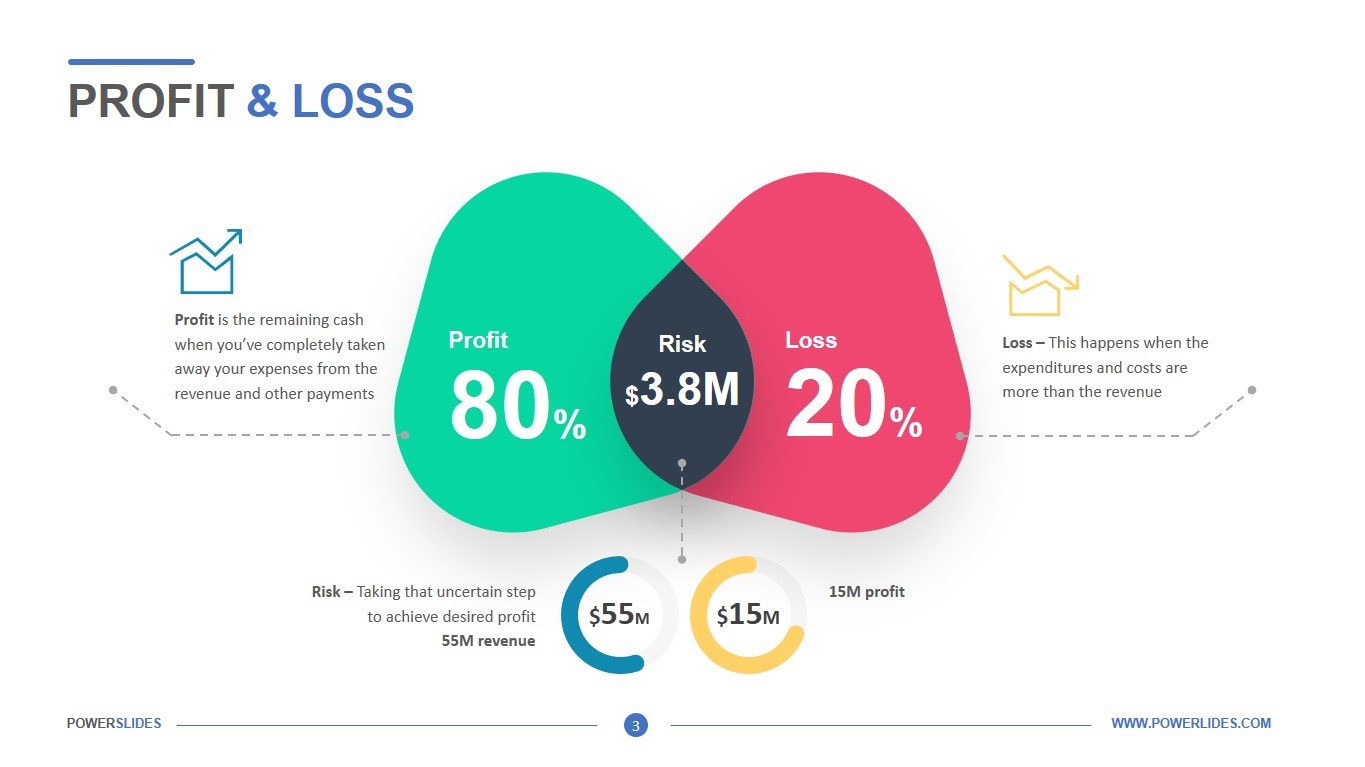
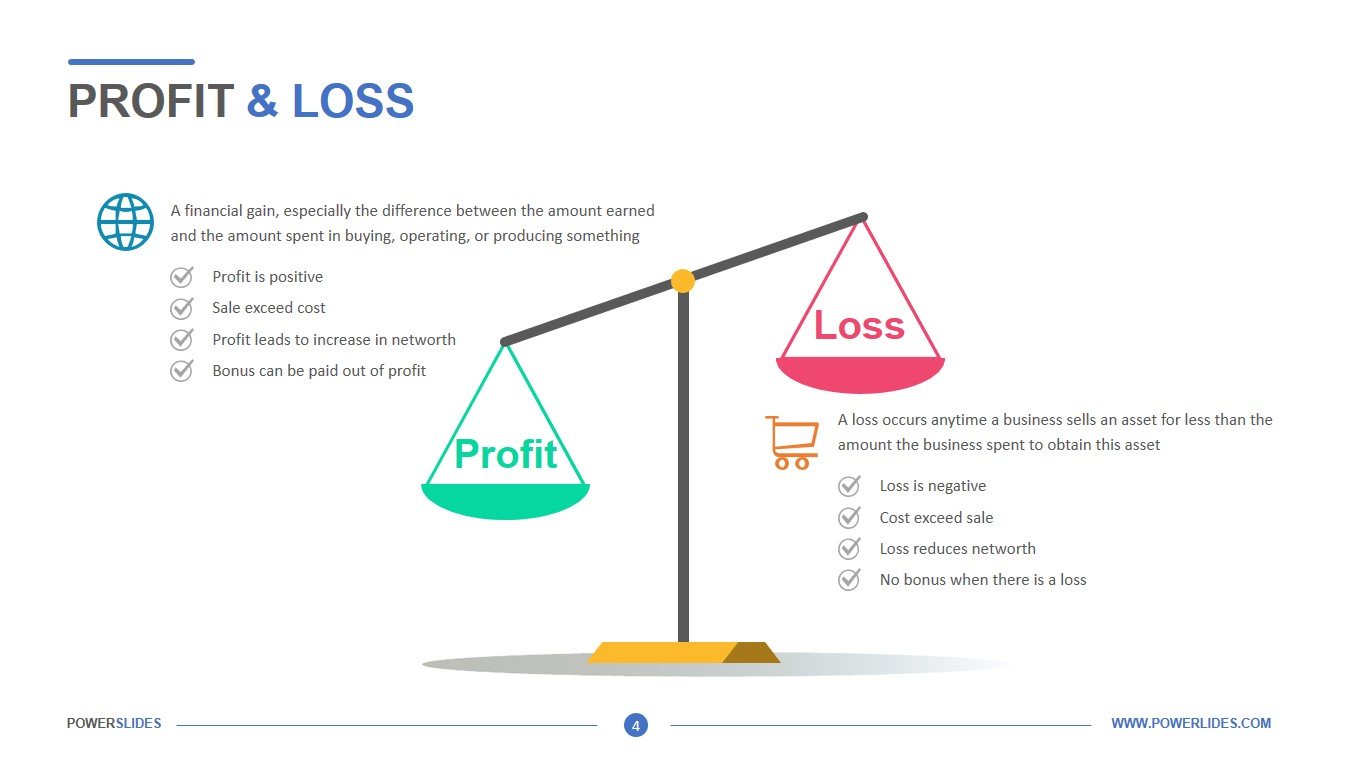
You may ask what is special about this template and why we recommend this one to you? Everything is very simple. This template fits your needs perfectly. Let’s look at it in more detail step by step. The first slide allows you to display your table with the main indicators of the report – net profit, EBITDA, Profit After Tax. Each of the main articles includes additional data. For example, you can display information about the cost of goods sold, Employee Benefits, advertising costs, % EBITDA, and so on. Stylish icons on the right side allow you to better perceive information on items of expenses and income. The second slide is a chart with explanations of the main indicators – Revenues, Costs, Expenses. The chart allows you to display both positive dynamics and negative values. Each of the columns of the diagram is divided into two parts and has its own color. This allows you to conveniently present data on expenditure and revenue. The third slide perfectly conveys to the audience information about profit, expenses, and risks. The total revenues and expenses of the company are presented in the form of two intersecting planes. Each of them has its own color and form a third color at the intersection. This is where you can display your risk information. You can add a brief explanation to each of these parameters. The fourth slide contains good infographics in the form of weights, where profits outweigh the costs. It allows you to visually present your data on profits and expenses, and give a brief explanation for each indicator. On the left side at the top, a description of the revenue side, and on the right side at the bottom a description of costs. This presentation of the data causes the audience to correctly perceive the information.
A bit about presentation design. The color scheme of the slide is neutral and combines both warm and cold colors. This will keep the attention of the audience and help to better perceive the information that you prepare. The color of tables, text, infographics does not merge with the main background. The size of the main elements is harmoniously combined with tables and brief descriptions. The main design decisions that distinguish this presentation from others, of course, are the weights and the intersection of the planes. The white background of the presentation creates a feeling of lightness and allows the audience to more easily concentrate on the presentation data. In general, the profit and loss template will be a worthy addition to your collection of financial presentation templates.


