Annual Report
What do you think of this template?
 (No Ratings Yet)
 4 Slides
 File size: 16:9
 Fonts: Lato, Calibri
  Supported version
PPT 2010, PPT 2013, PPT 2016
Supported version
PPT 2010, PPT 2013, PPT 2016

Product details
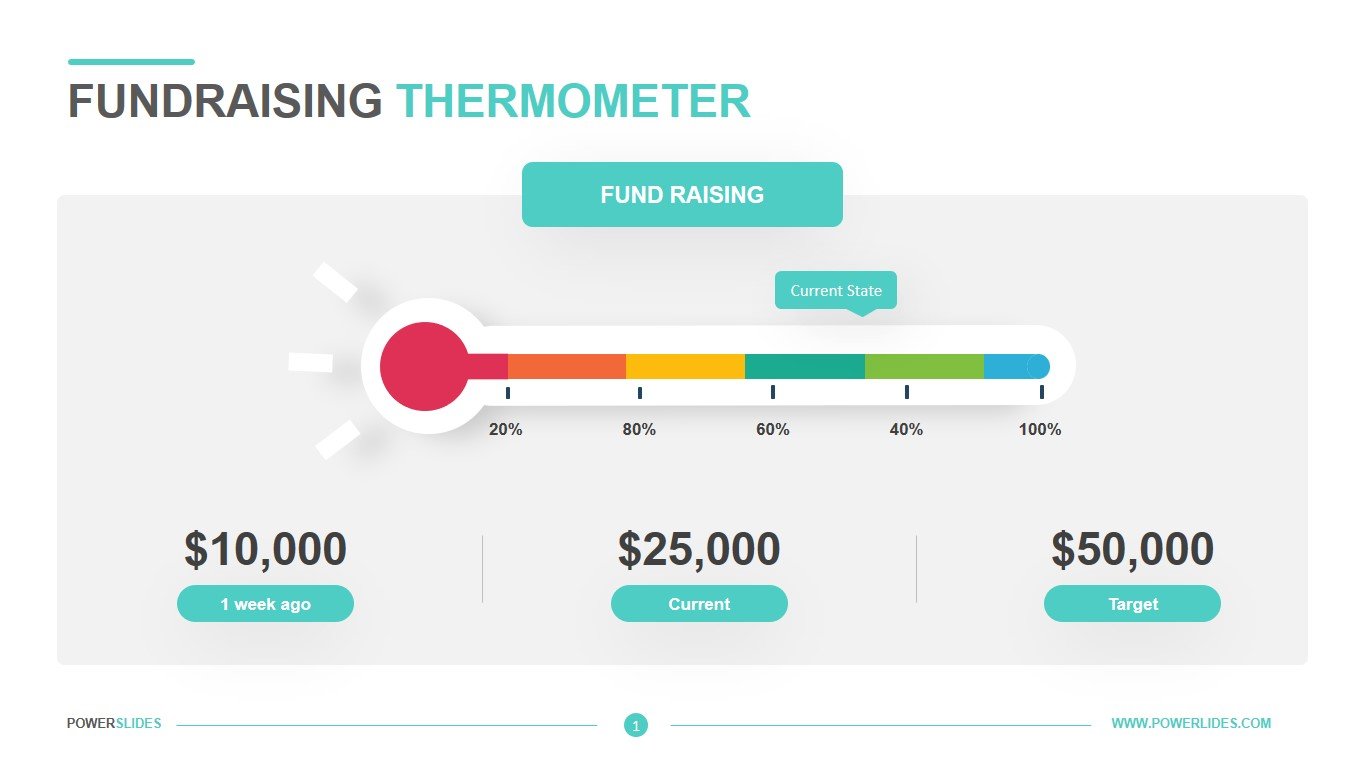
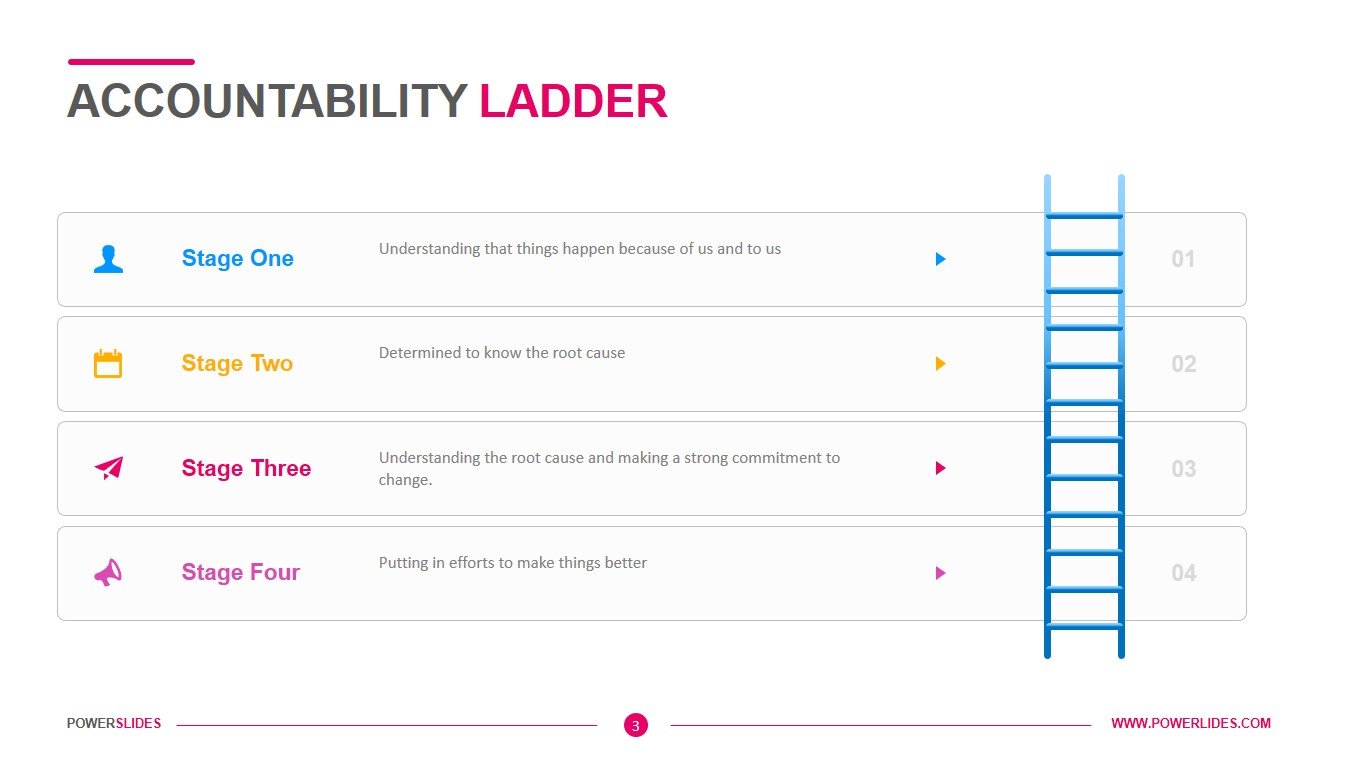
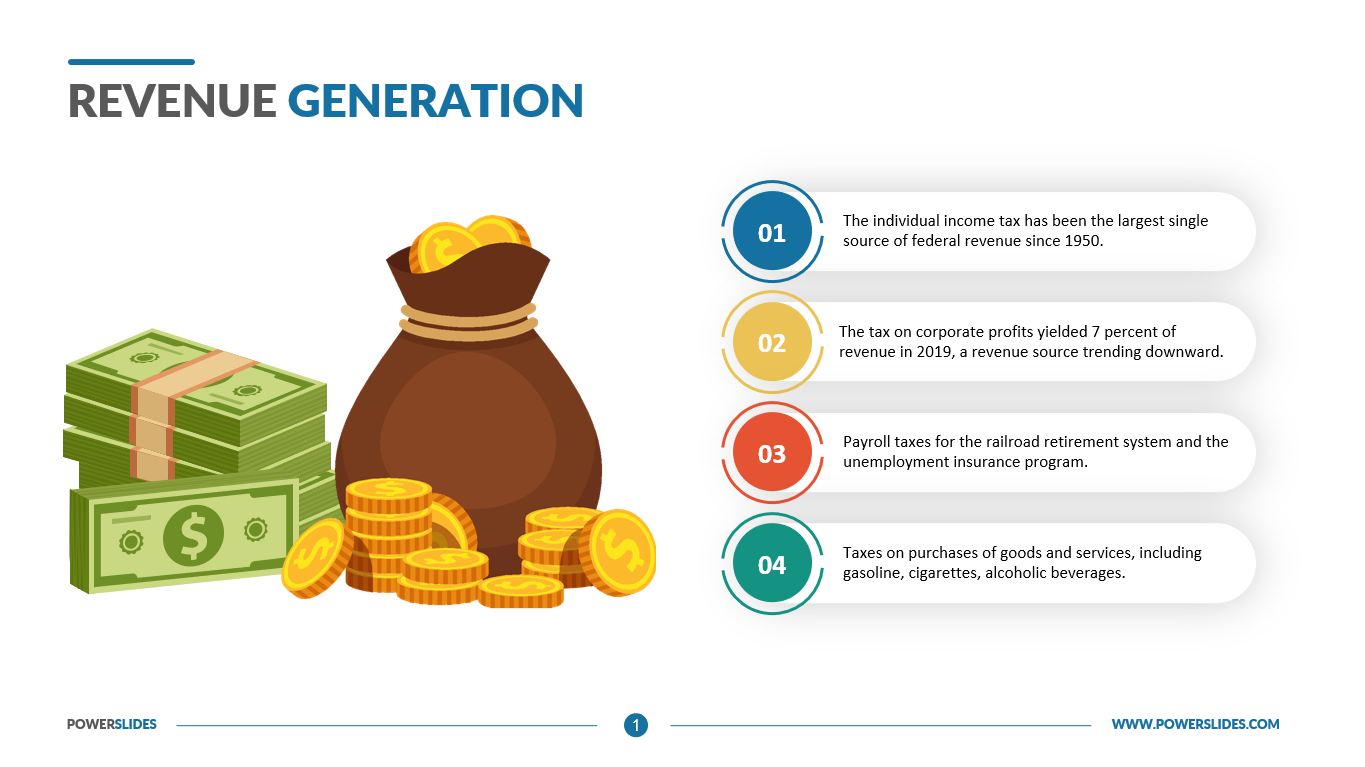
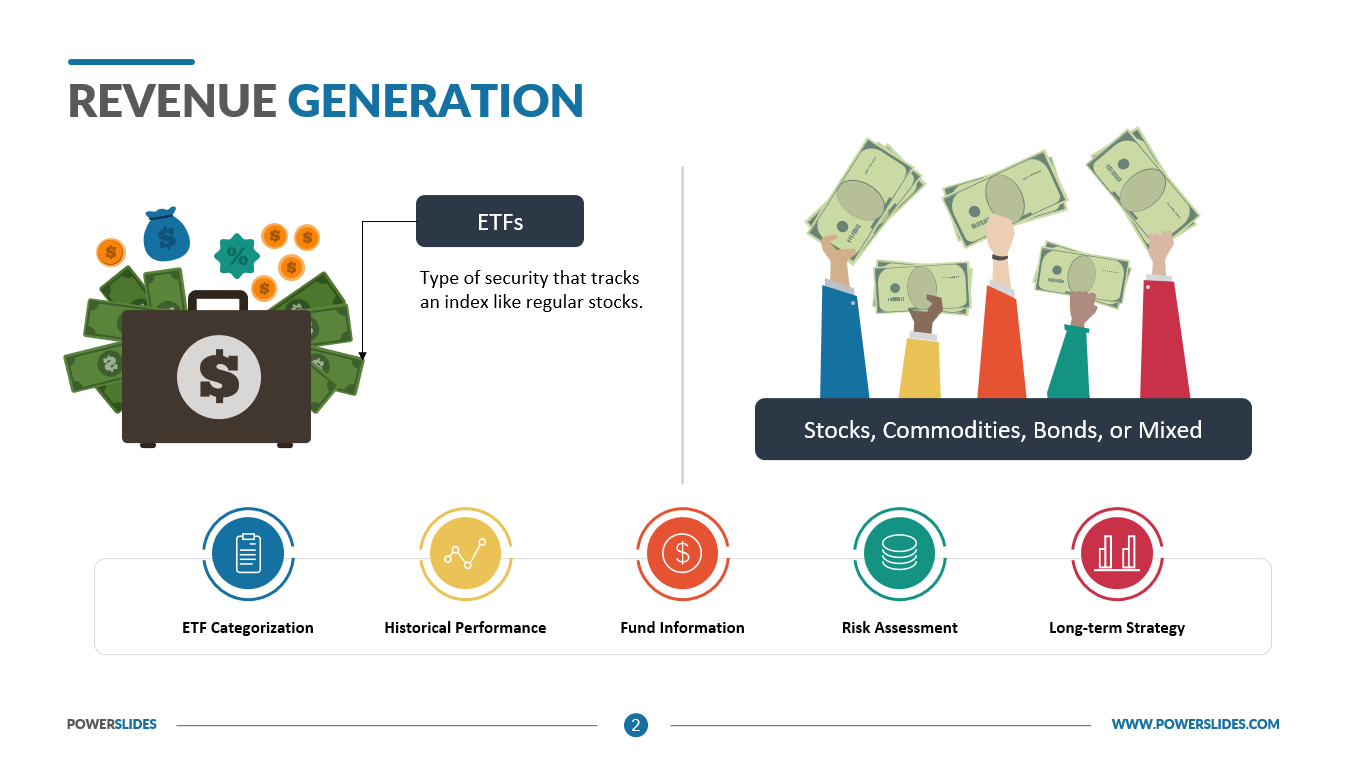
Annual Reports are the basic requirement of every business. Understanding market hold, estimating revenue generated, predicting consumer approach and evaluating future opportunities – all this is only possible through the channel of the annual report. Furthermore, these annual reports help companies to attract new customers as well as investors. By offering them a detailed analysis of the company’s year-round success rate. Since these annual reports are only used in either a presentation or uploaded online to websites, effective design is the only way to make the company’s insights interesting for the concerned people. For the very reason, this Annual Report PowerPoint template remains developed. Capable of portraying a large amount of essential information in an attractive and simple way, this template has applications for every organization. Health Sectors, Business fields, Industrial Requirements, and also for Market Research purposes.
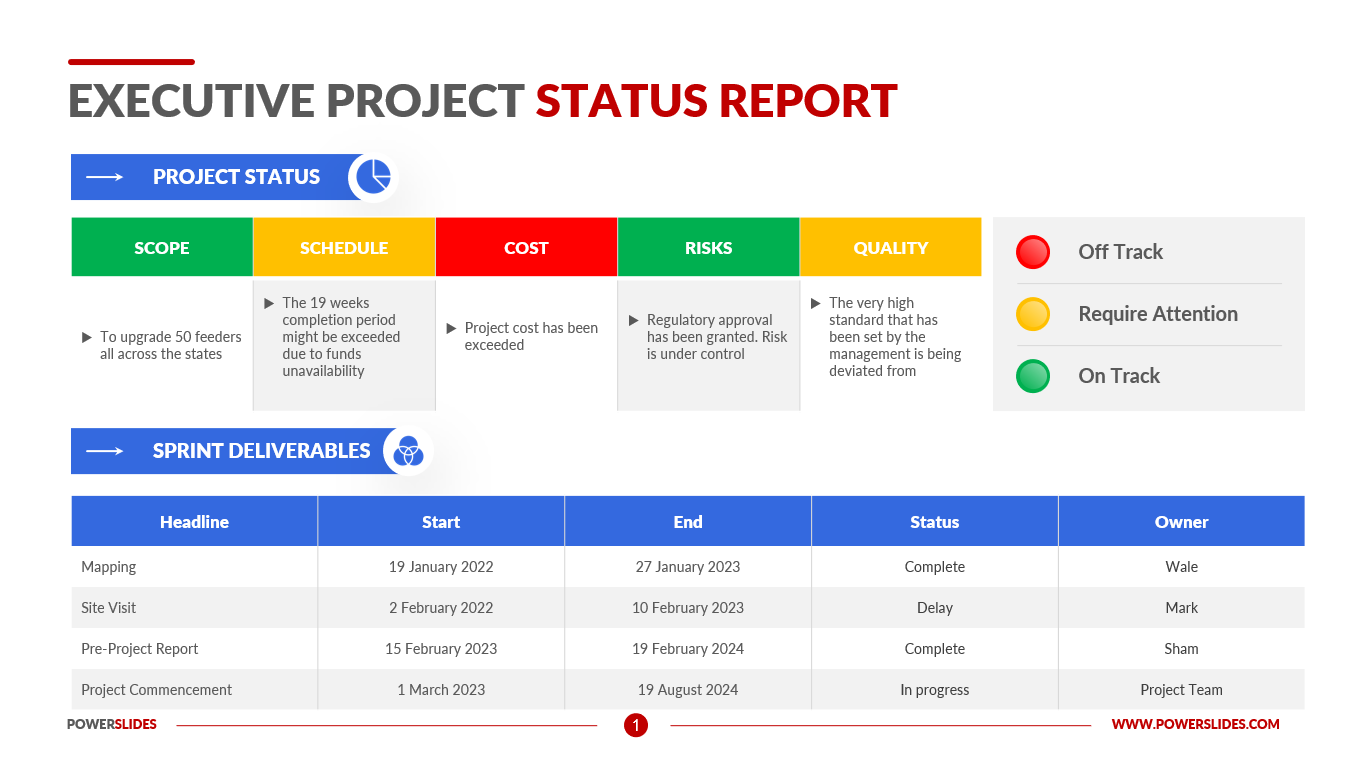
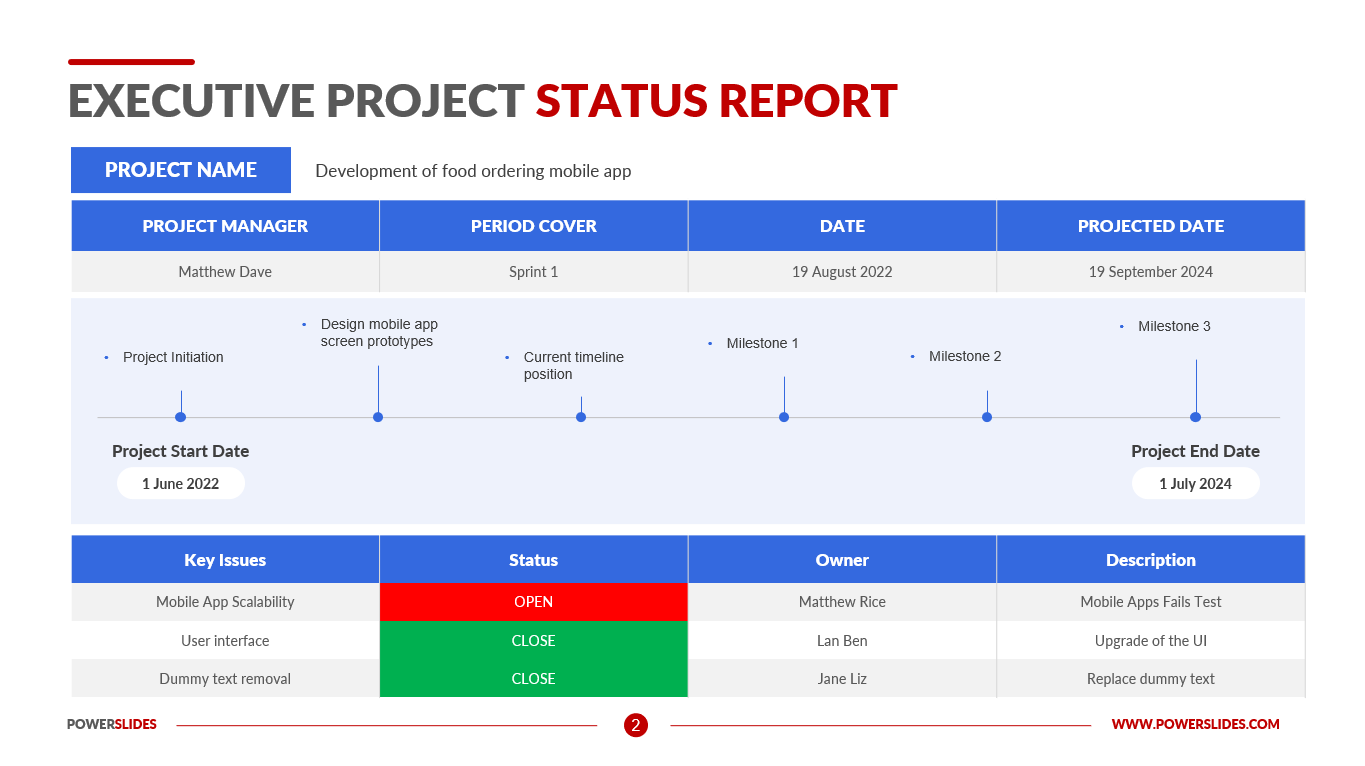
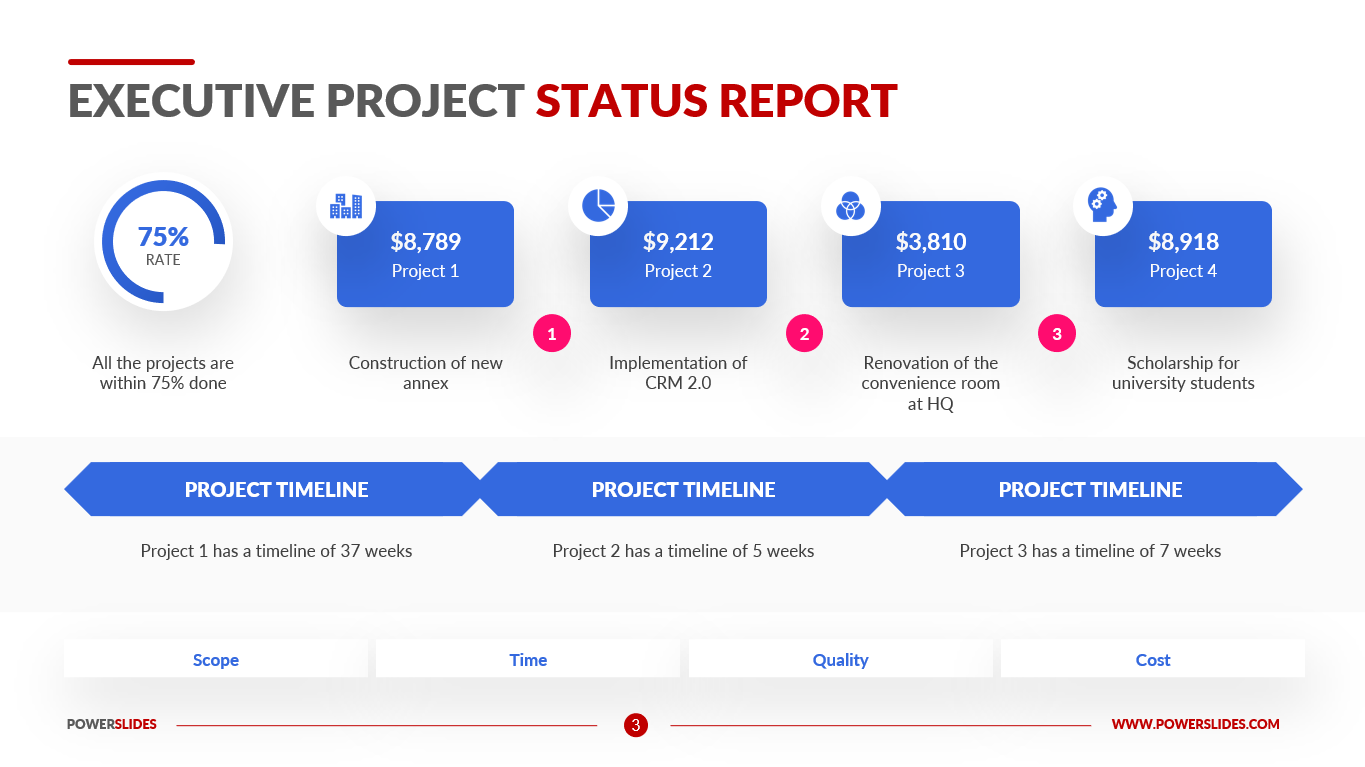
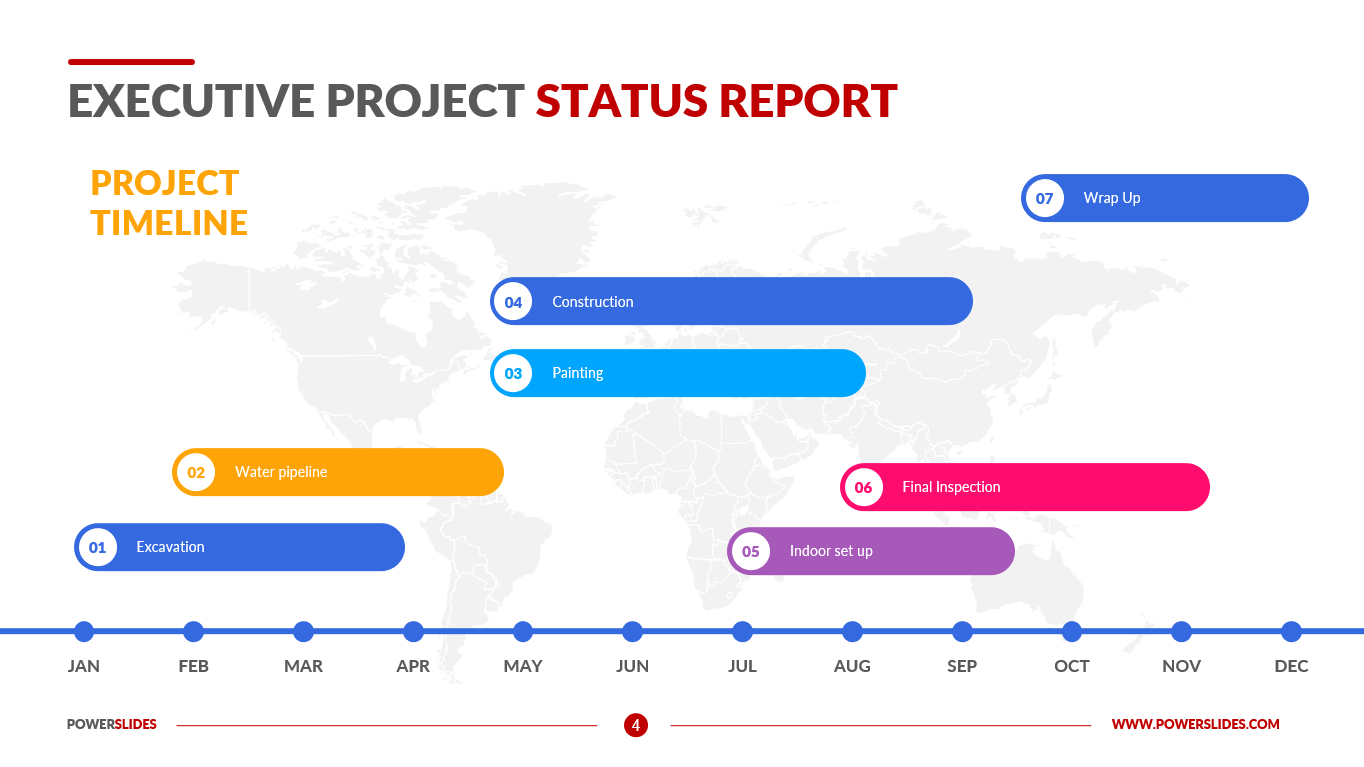
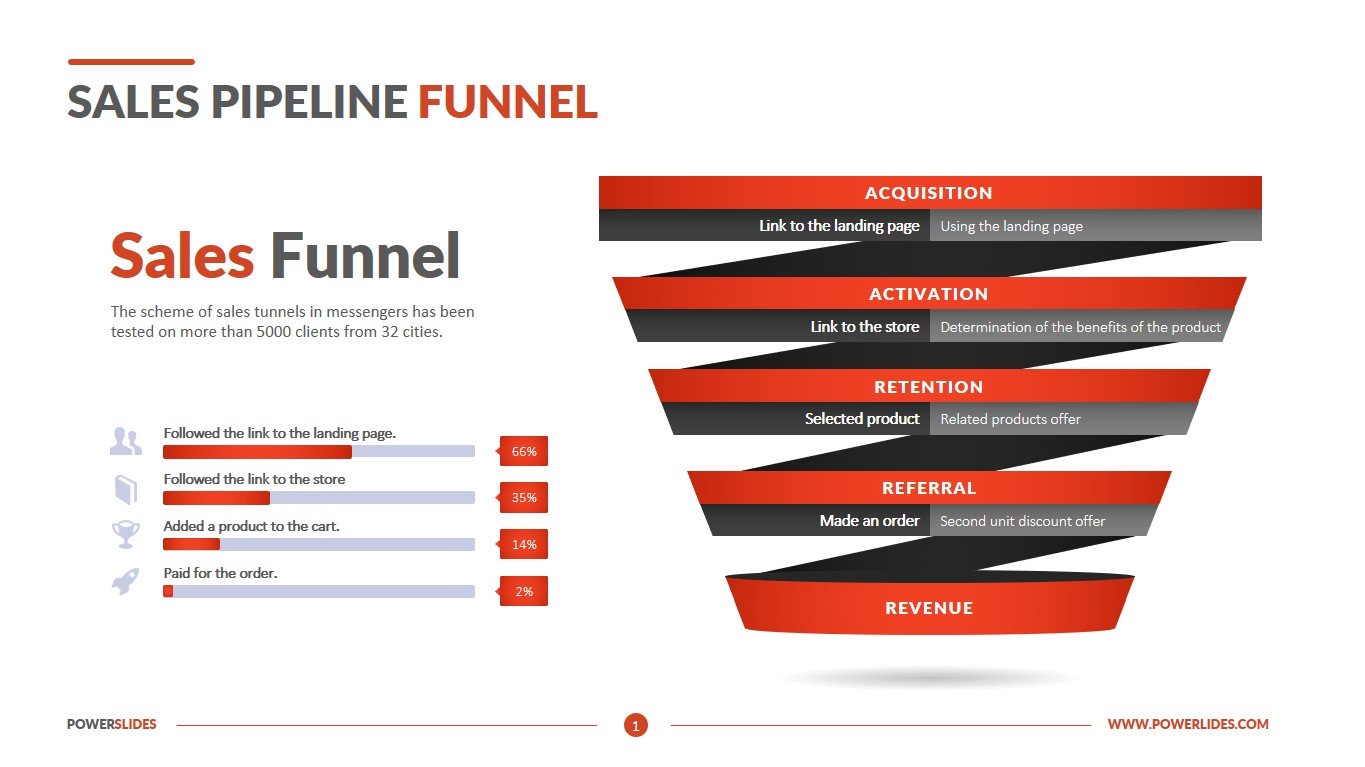
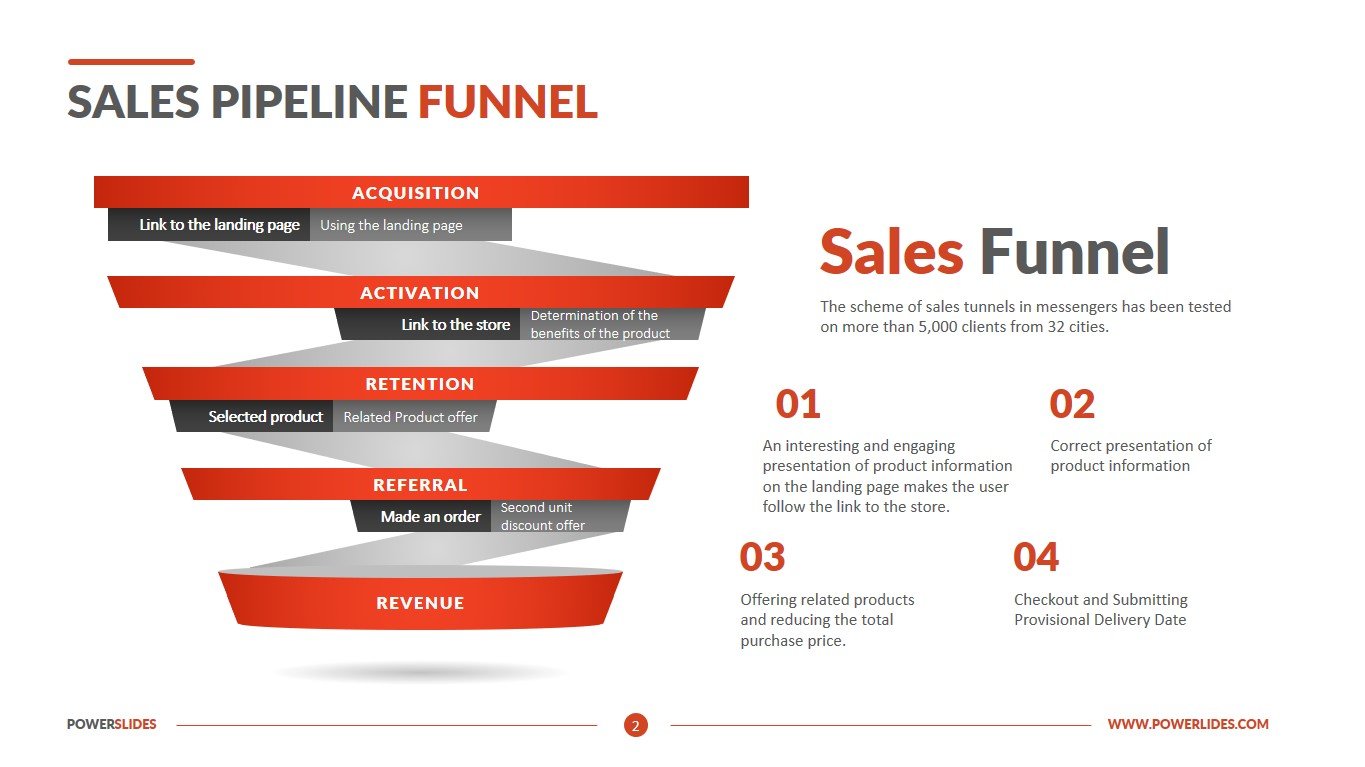
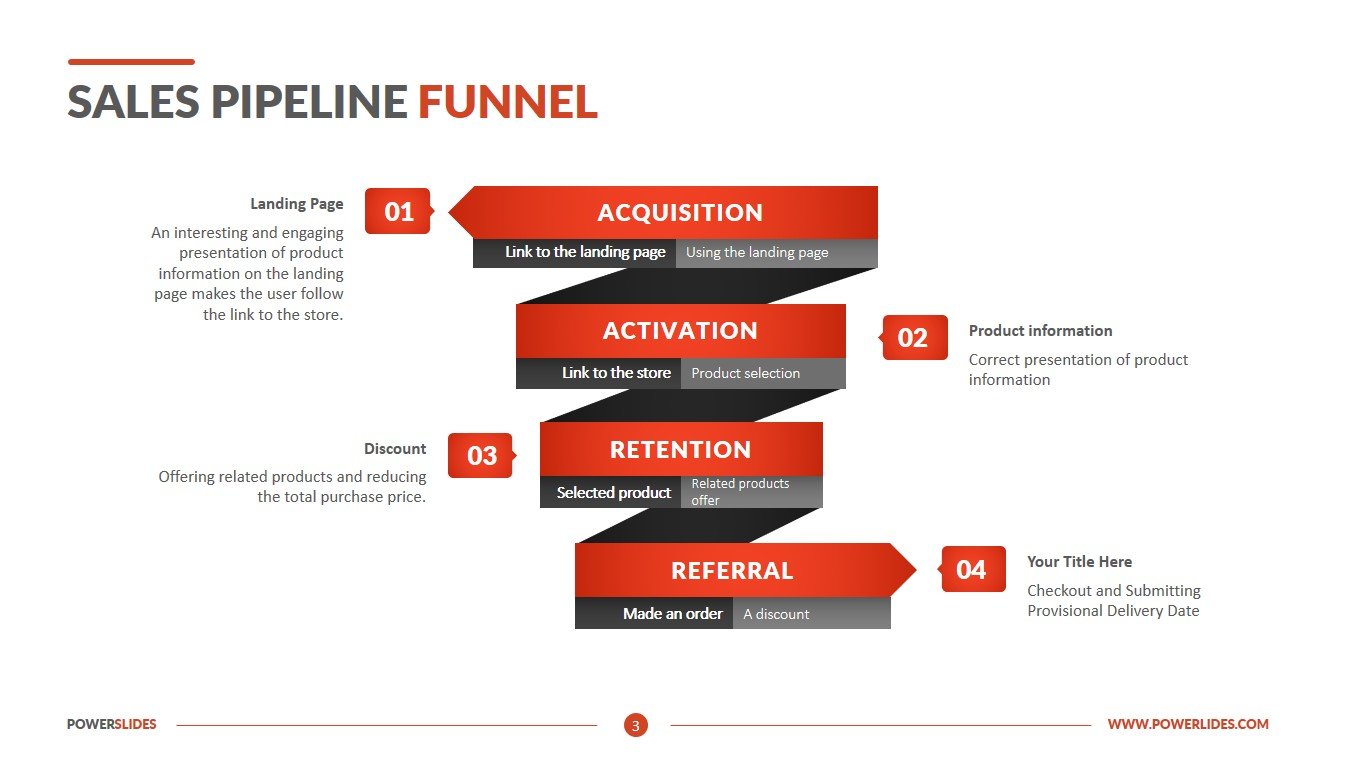
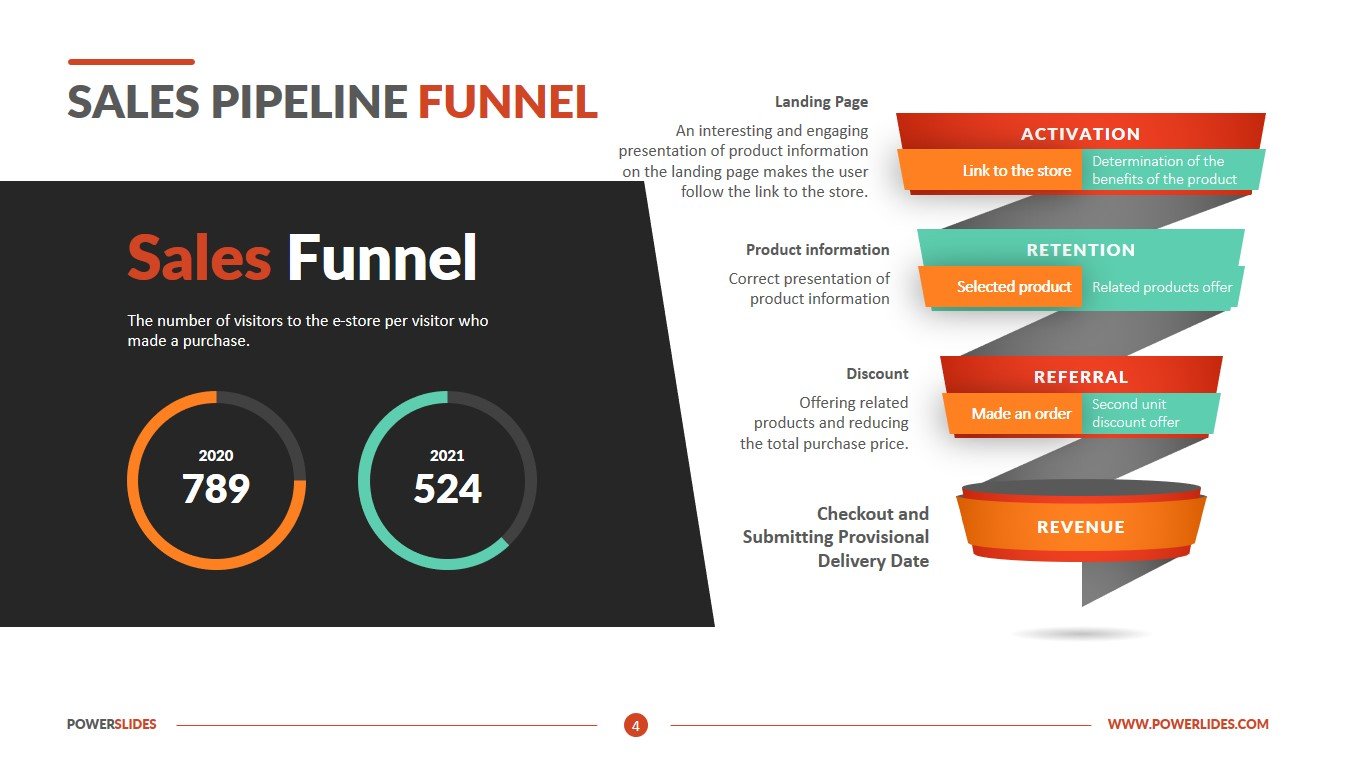
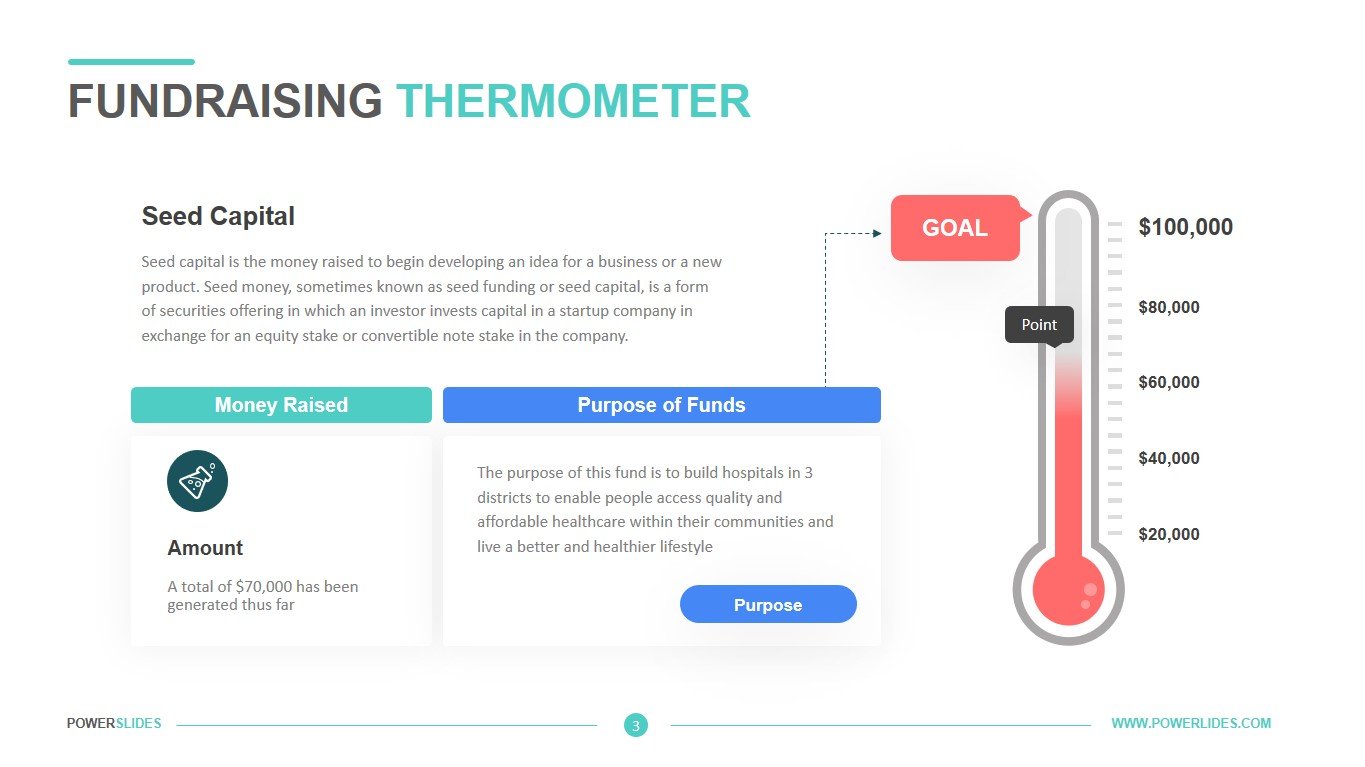
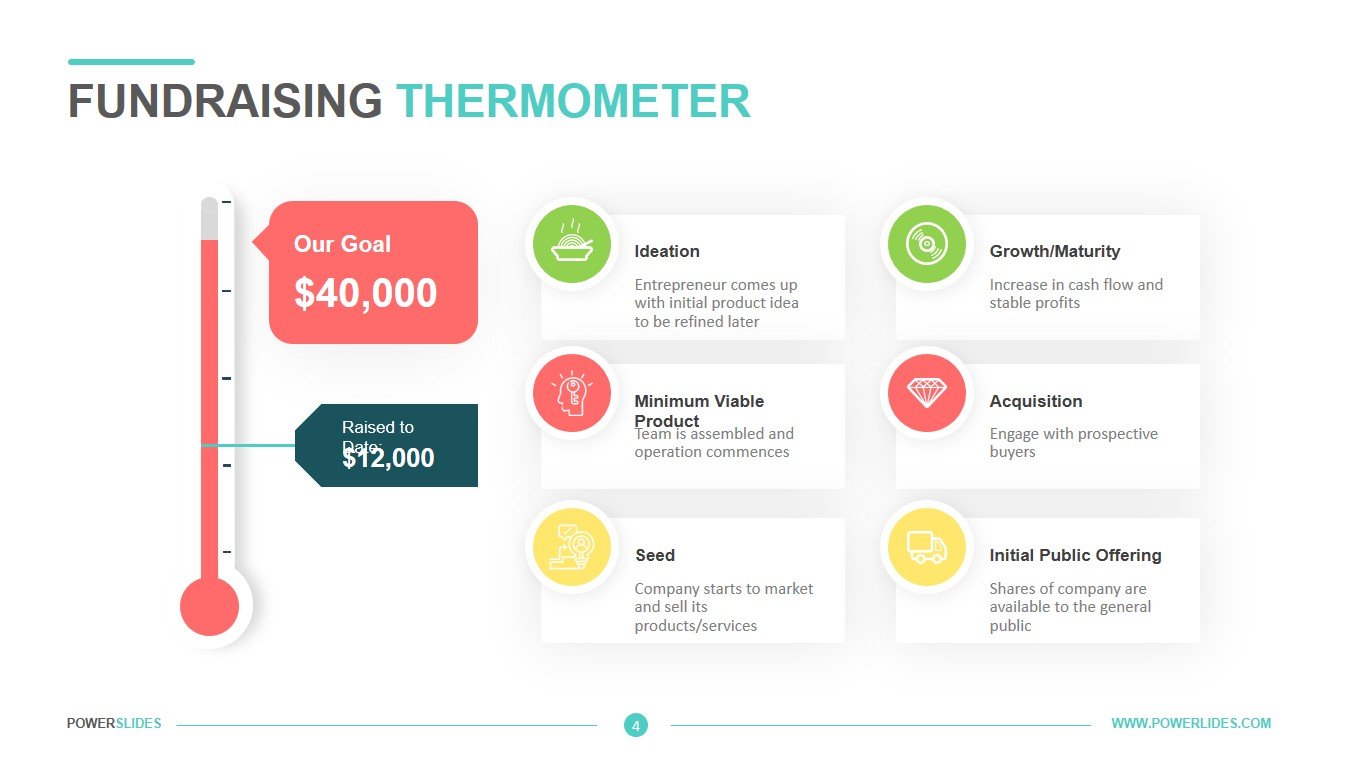
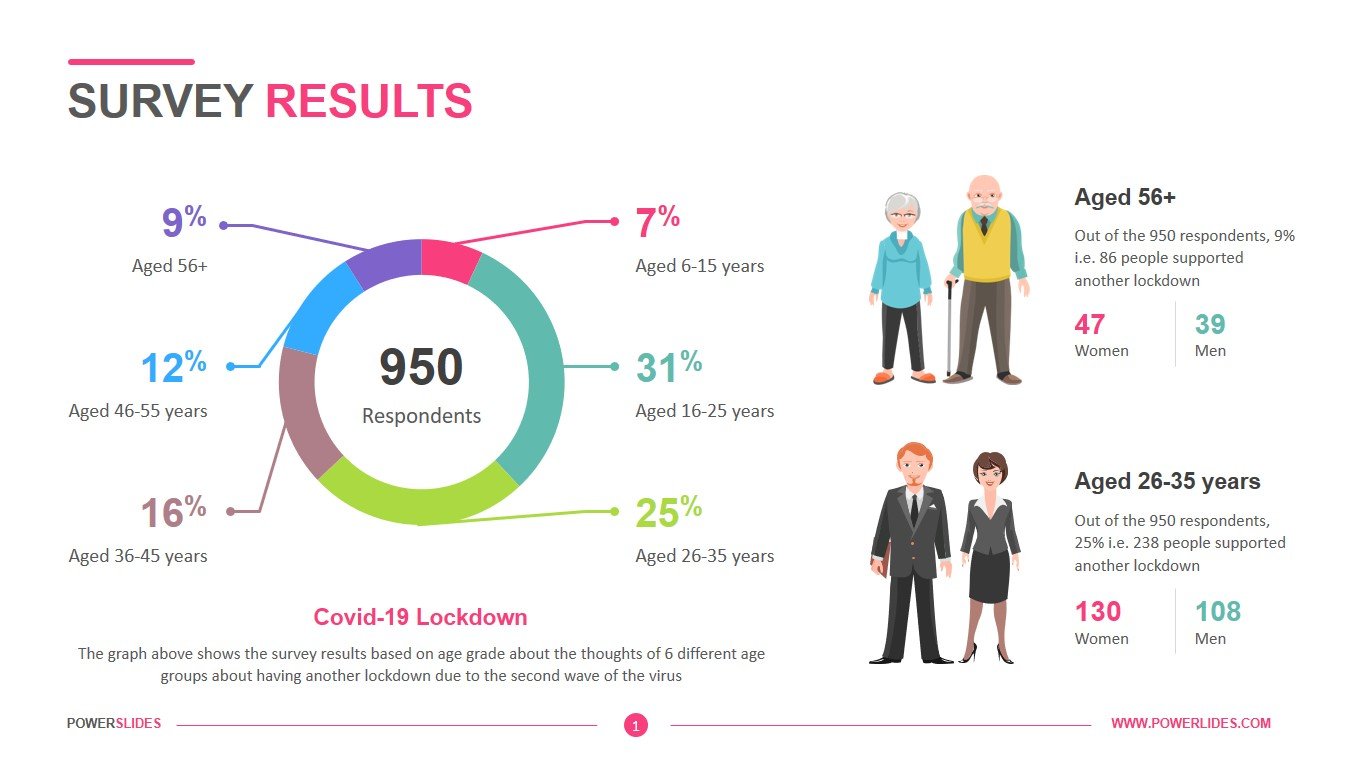
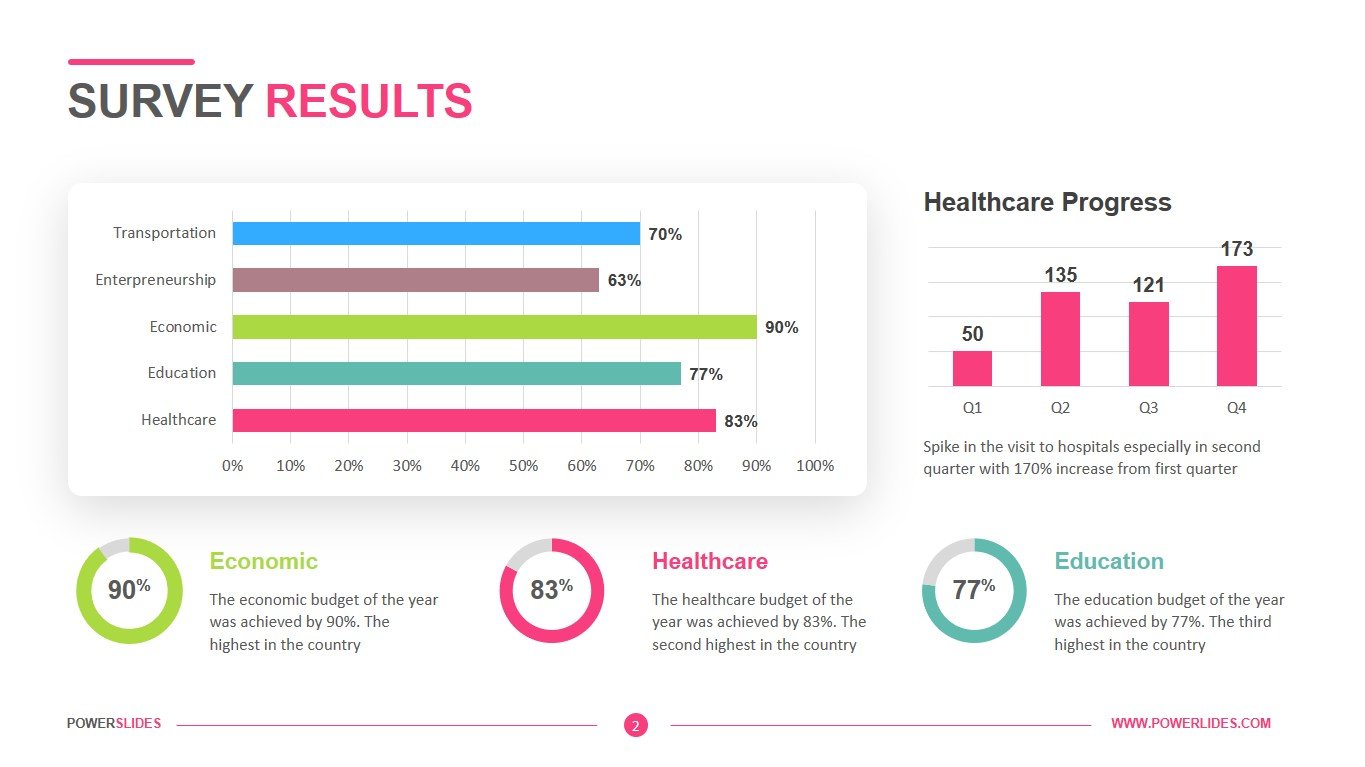
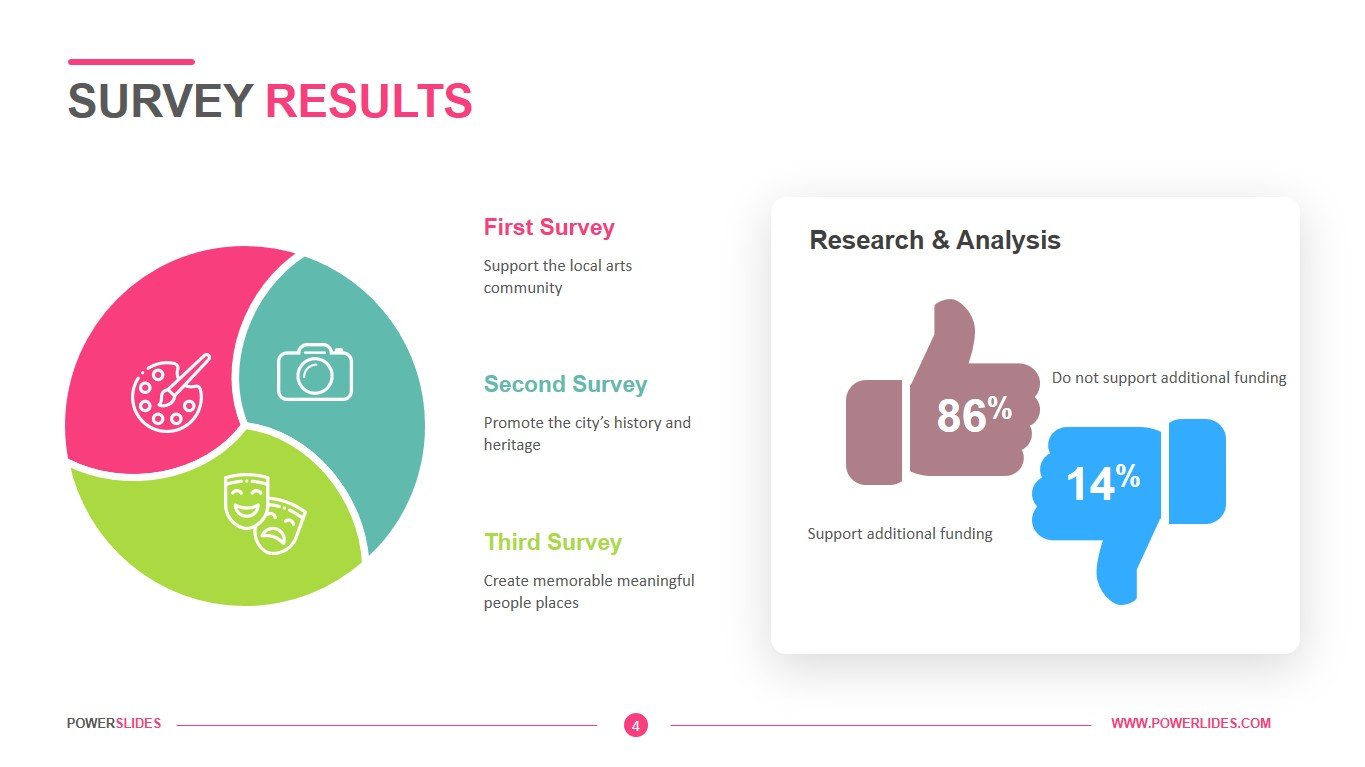
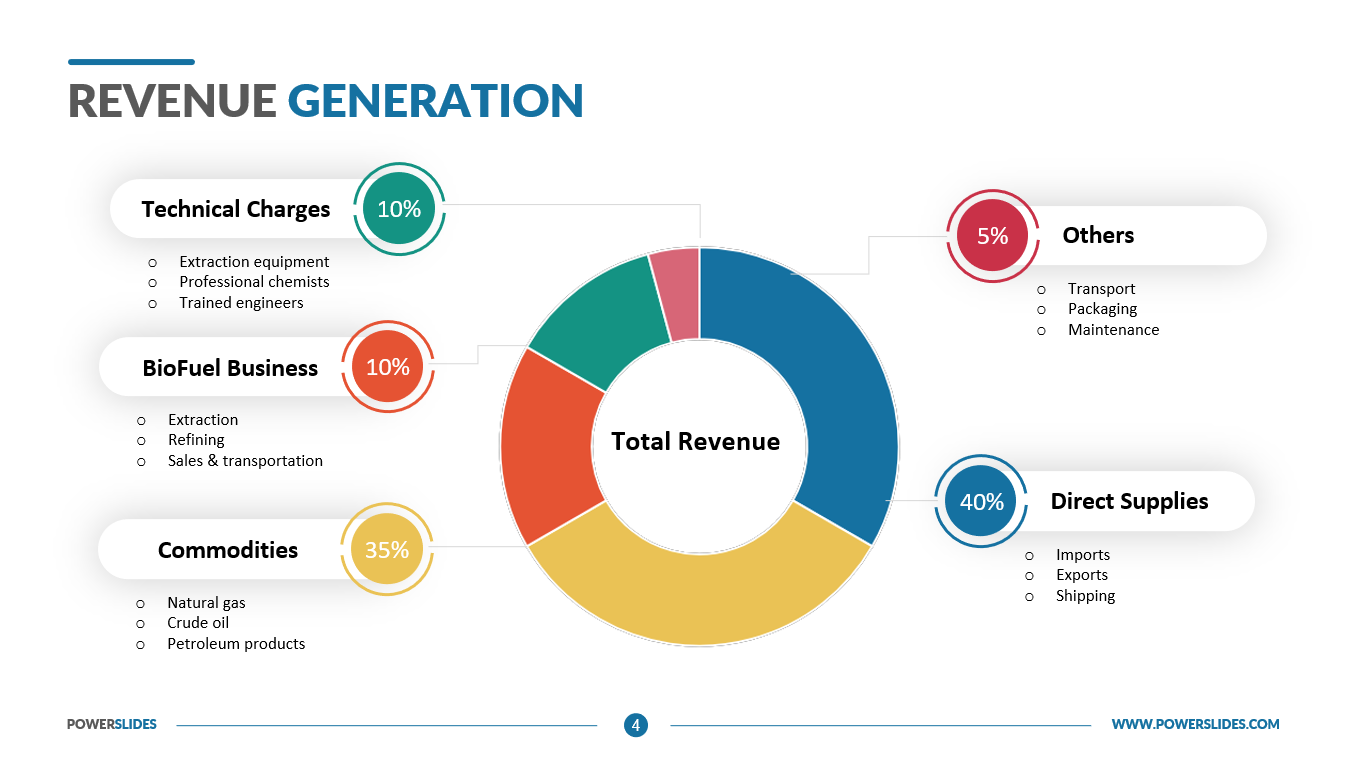
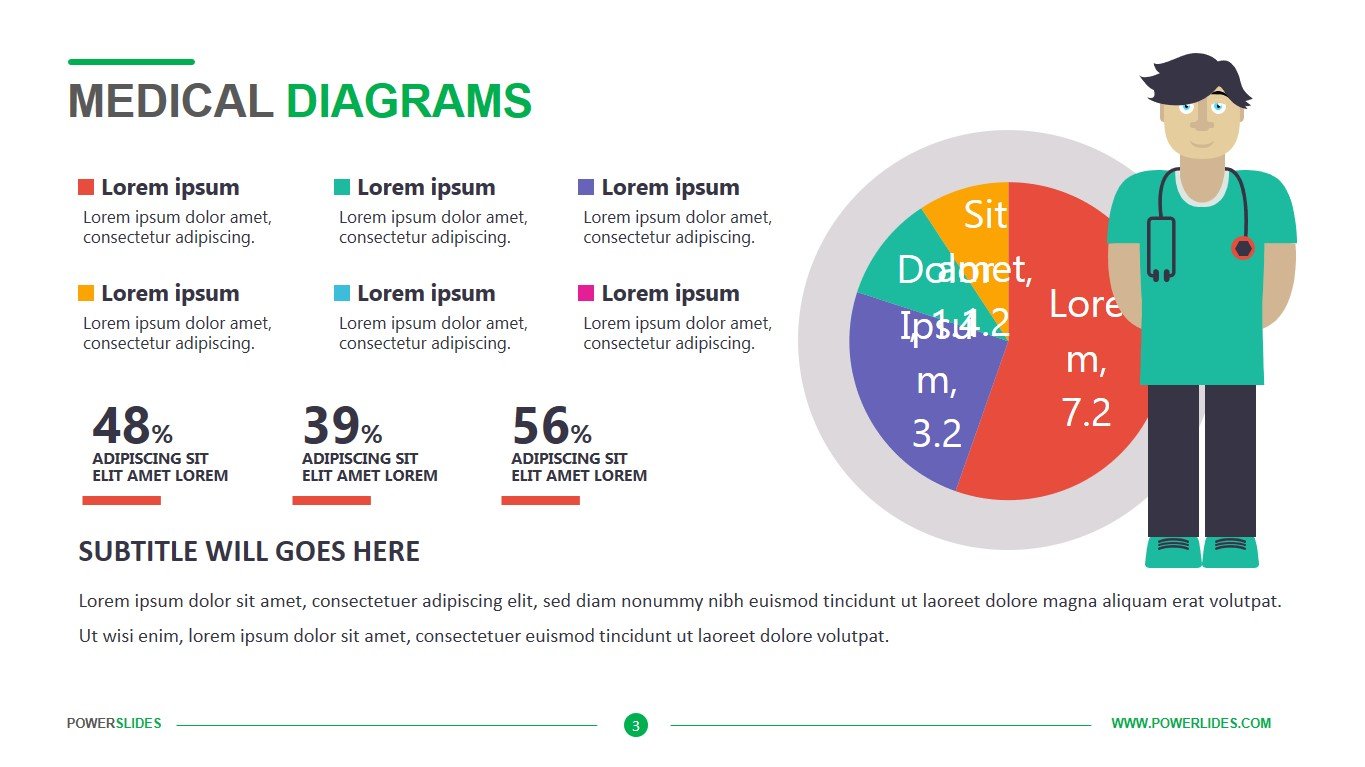
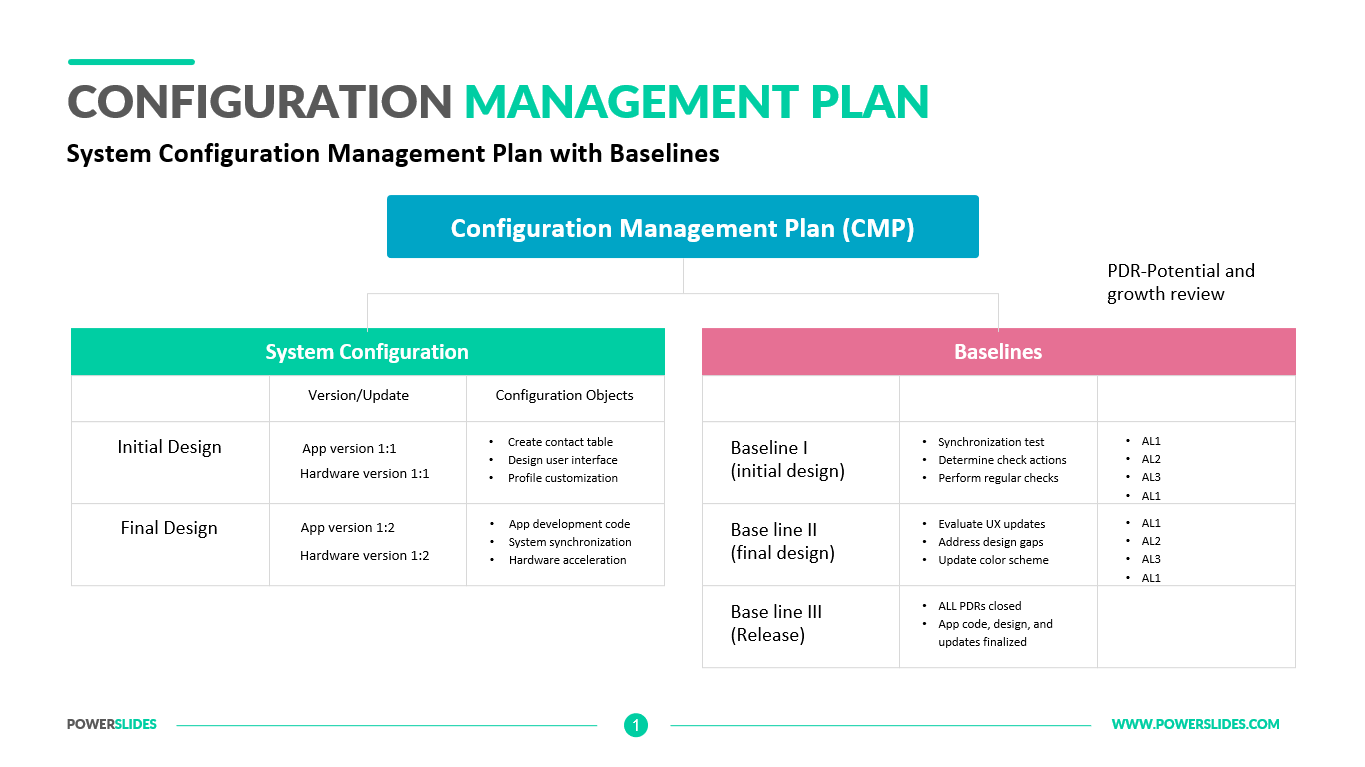
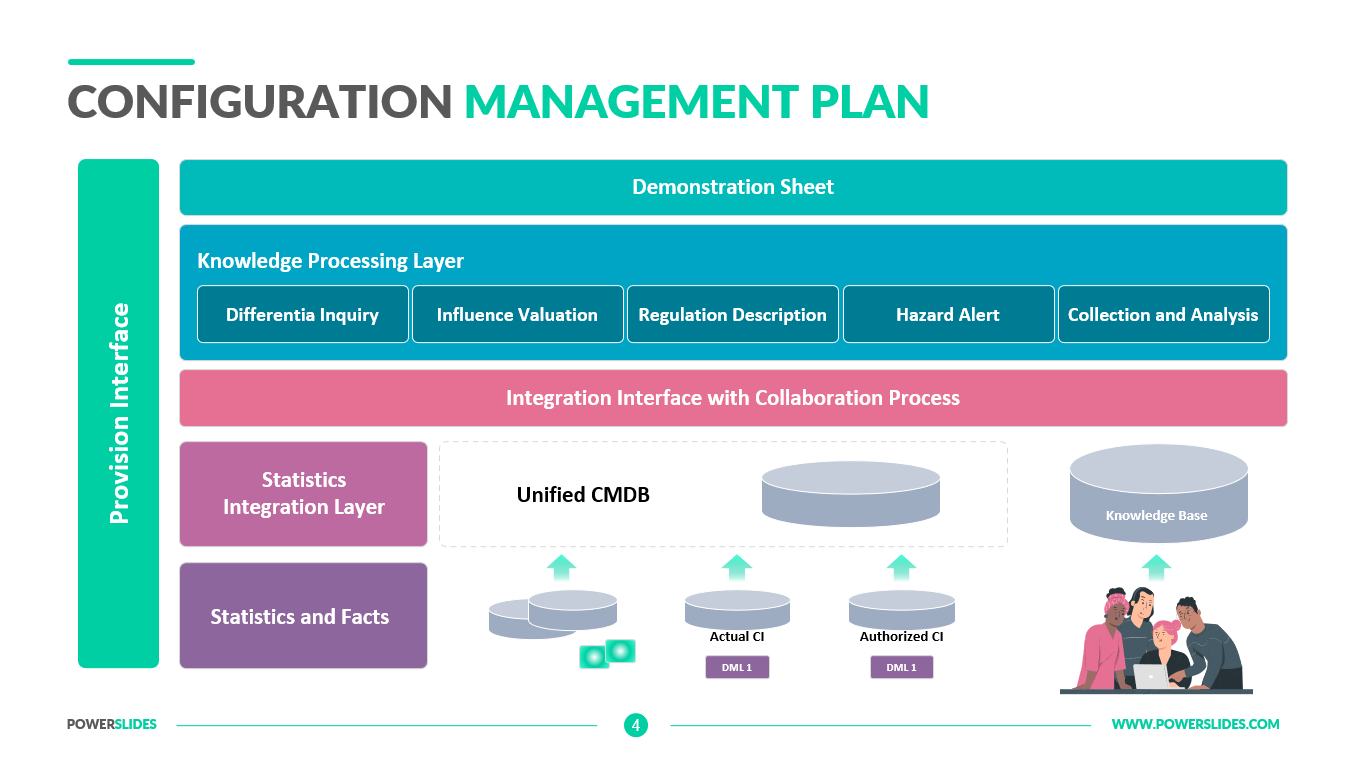
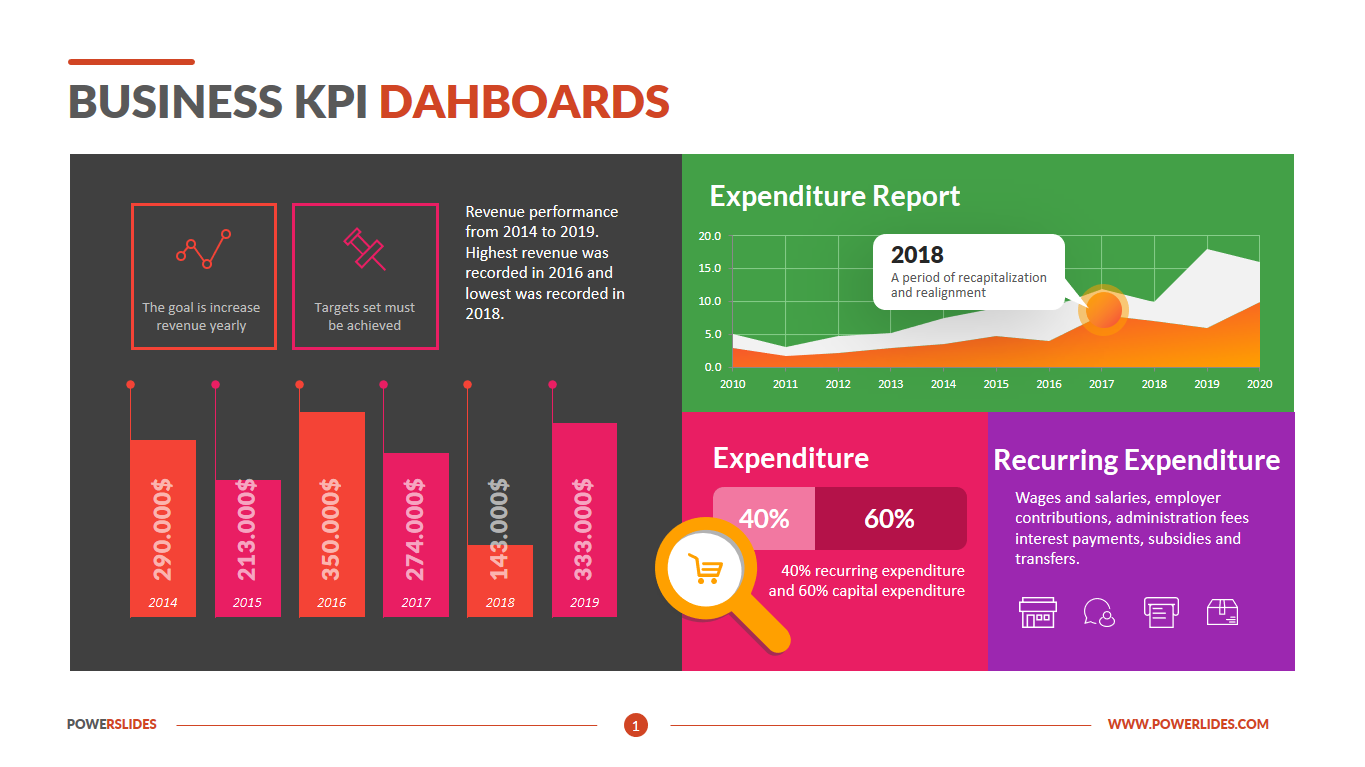
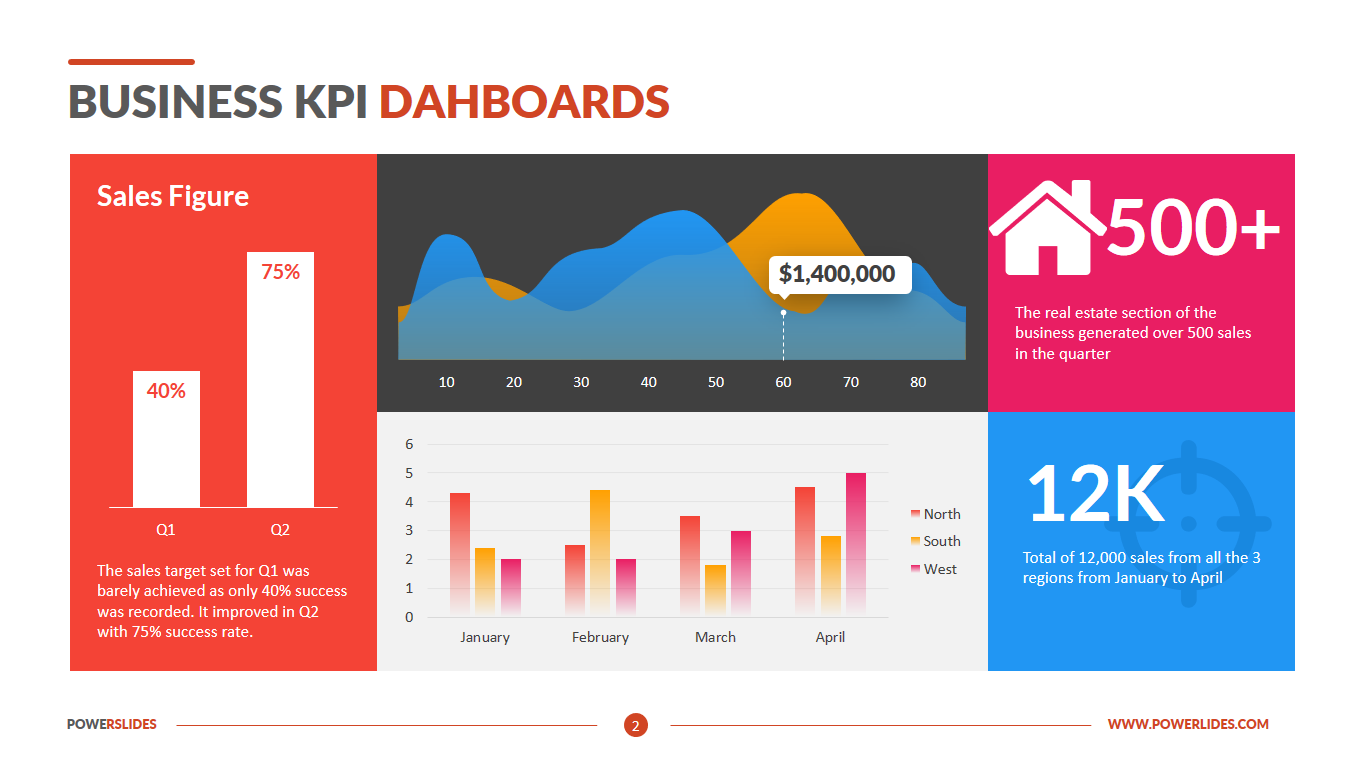
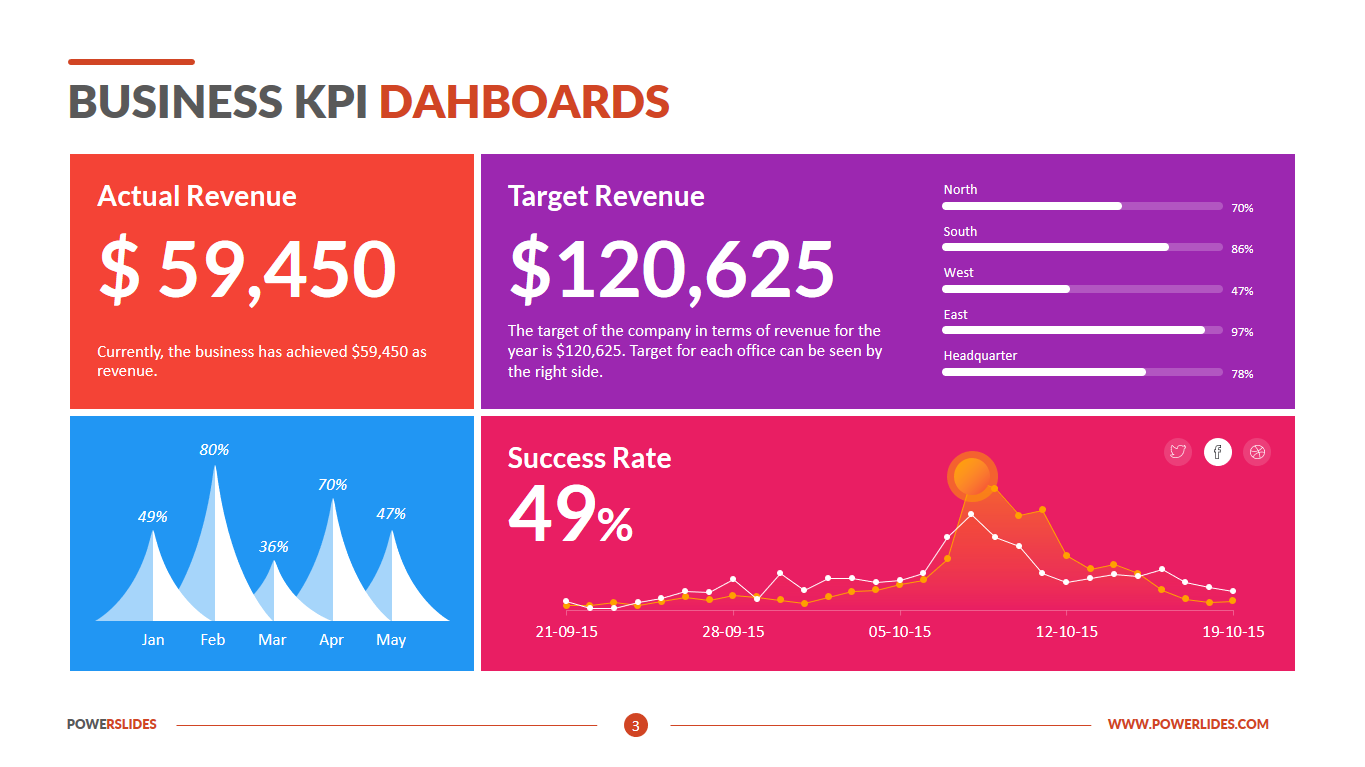
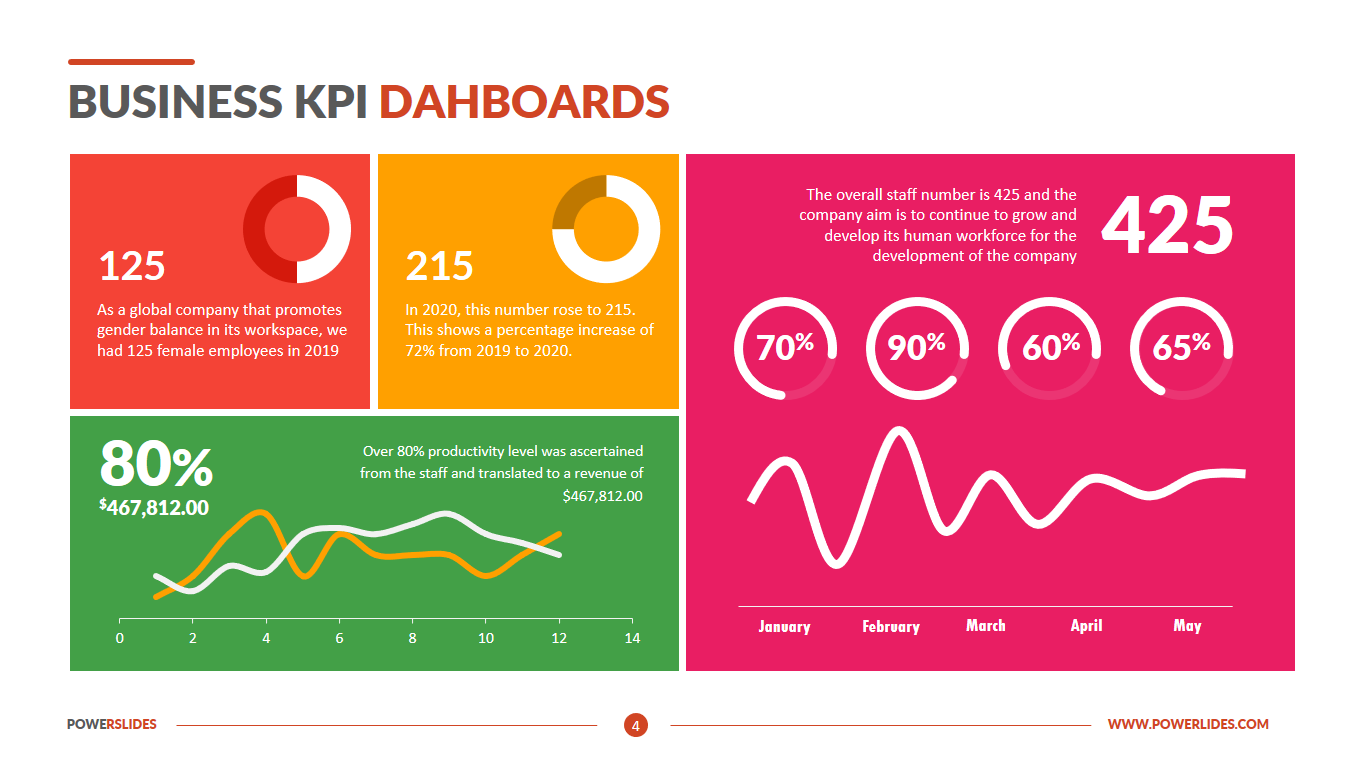
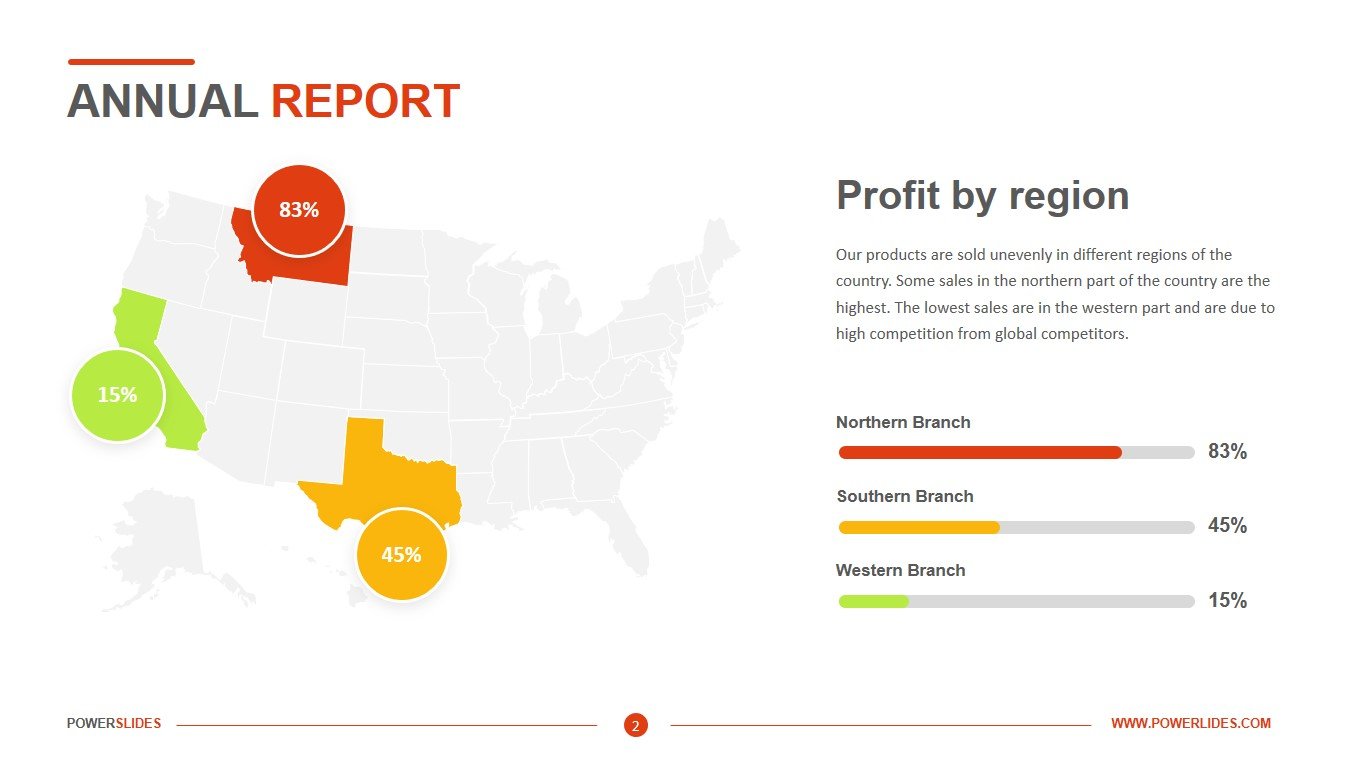
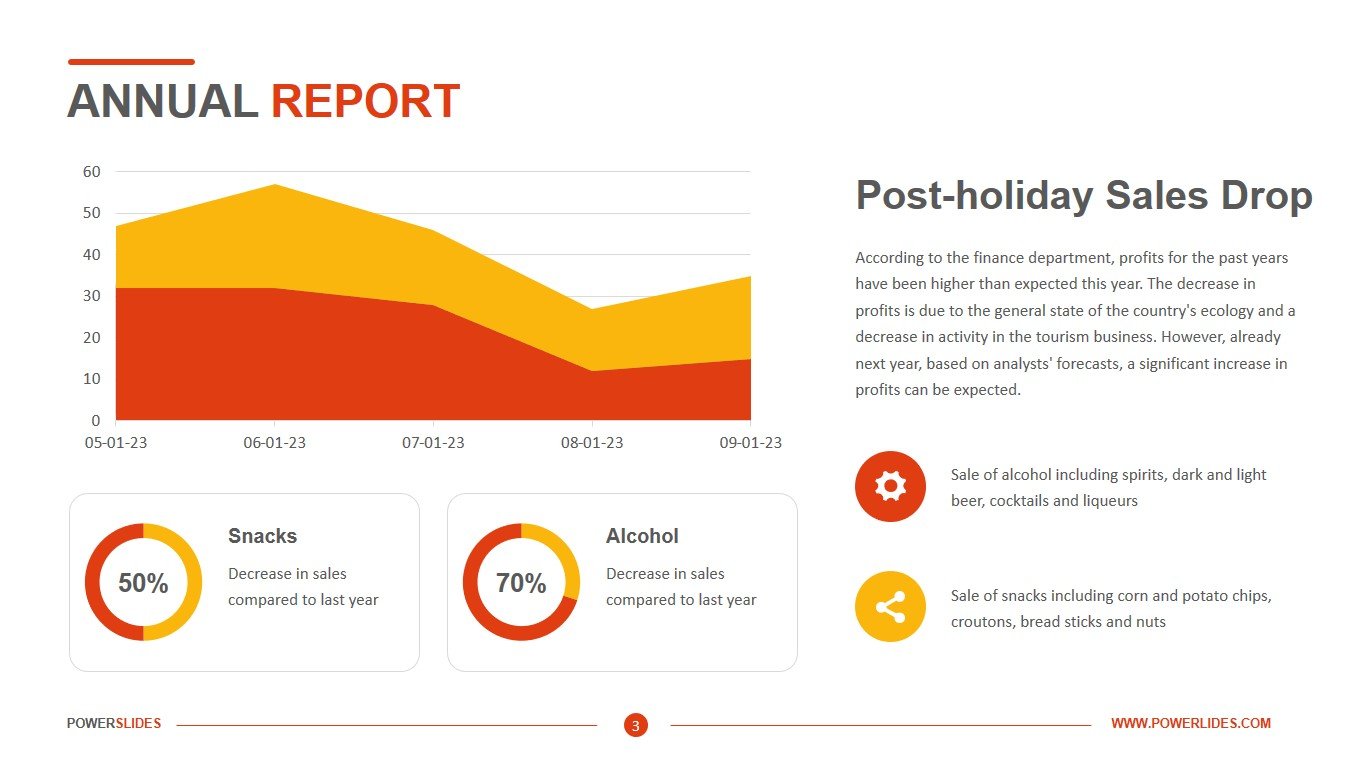
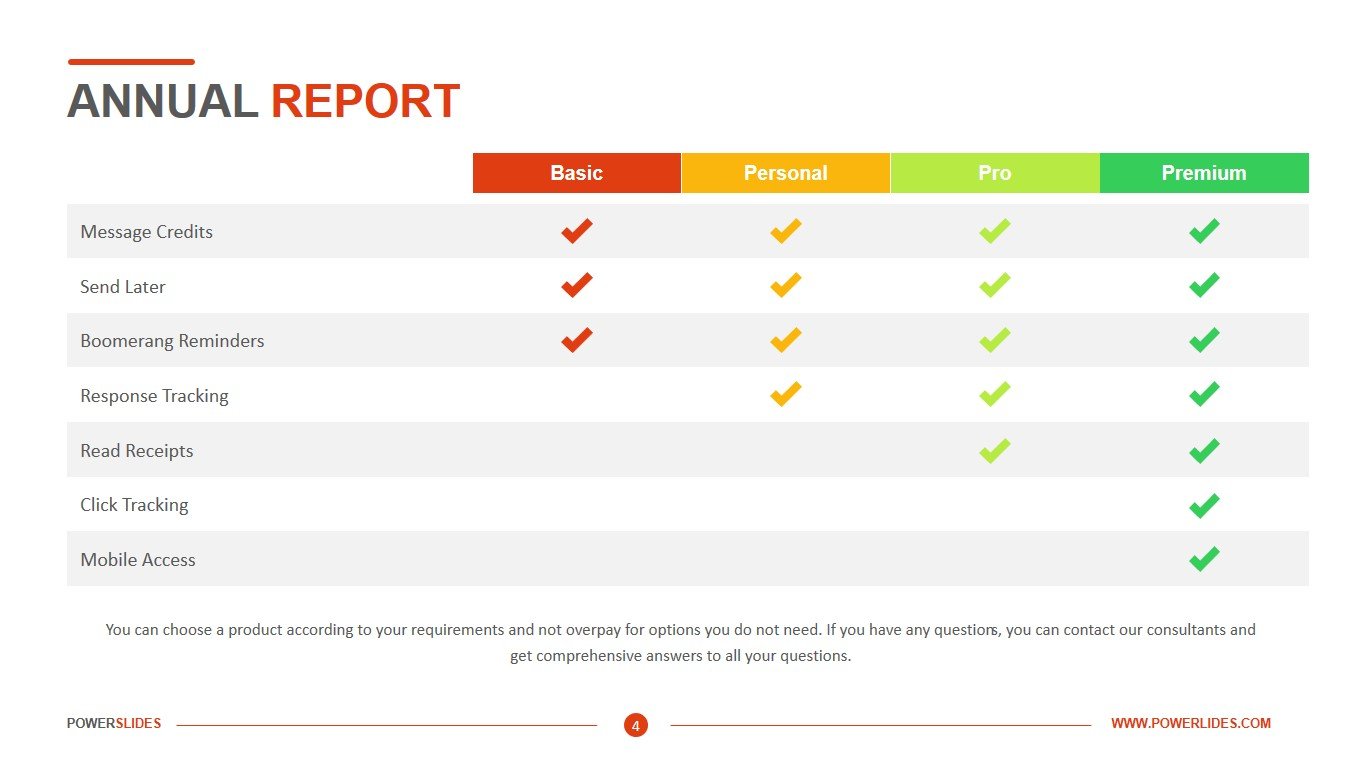
This template contains all the tools you need to prepare a professional annual report. The first slide of the annual report template contains several graphs. On the left side is a pie chart that can be used to analyze the market share of a company and its main competitors. The second graph, located on the right side of the slide, helps you compare data by year. This graph can also be used to display the actual work performed. This slide will be useful when reporting a startup team or meeting a programming team. The second slide provides an opportunity to use a map of the United States and show the market share in each state. Sales managers can use this slide to prepare their monthly, quarterly, or yearly sales plans. Also, the slide can be used by marketers when analyzing the potential increase in sales from an advertising company. The third slide provides an opportunity to present the data of the annual report in comparison with the previous period using a comparison chart. This slide also has two pie charts that can complement your annual report. On the right side of the slide, there are text blocks in which you can explain in detail the numbers presented in the graph. This slide can be used by financiers and economists in their daily work. For example, you can compare stock returns with prior periods and explain why the returns have increased or decreased. The last slide of the template is presented as a table. You can provide a brief description and benchmark analysis of how you achieve your goals for each product. This slide will be useful for product managers and team leaders.
This template follows the latest design trends and is made in warm colors. Consisting of 4 slides, the Annual Report Powerpoint template has an orange, red, green and white base. With pie charts, infographics, comparison percentage bars, City performance charts, YoY graphs, and product-wise analysis, this template is of diverse use. The description spaces remain completely editable so to better modify it according to every individual’s personal requirements. You can also change the color and font sizes so that this template can be used in your other presentations. The Annual Report template will be primarily useful for financiers and economists of all levels, sales managers, and regional representatives. This template can also be used by marketers and investment managers to prepare their reports.


