PERT Chart
What do you think of this template?


 (2.67/ 5)
8 ratings

 4 Slides
 File size: 577.86 KB
 Fonts: Lato, Calibri
 Supported version
PPT 2010, PPT 2013, PPT 2016
Supported version
PPT 2010, PPT 2013, PPT 2016

Product details
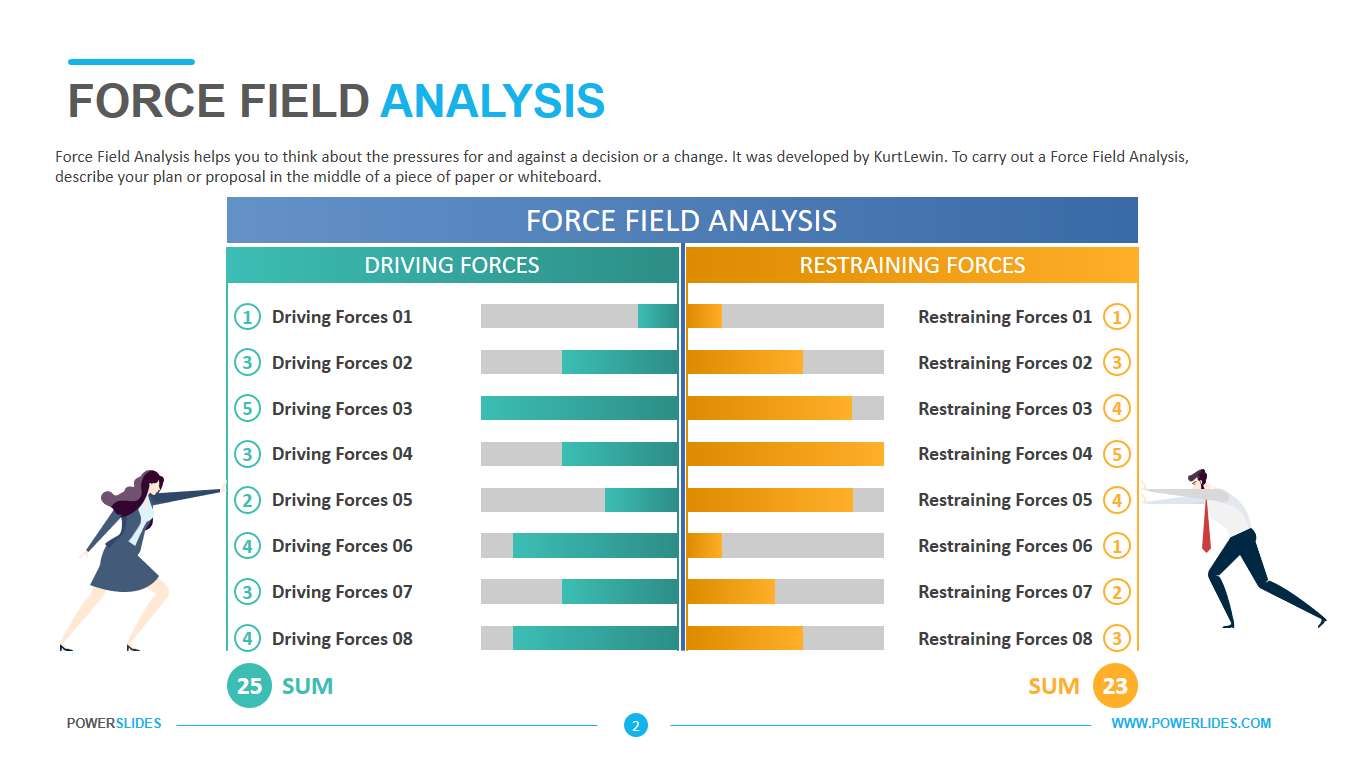
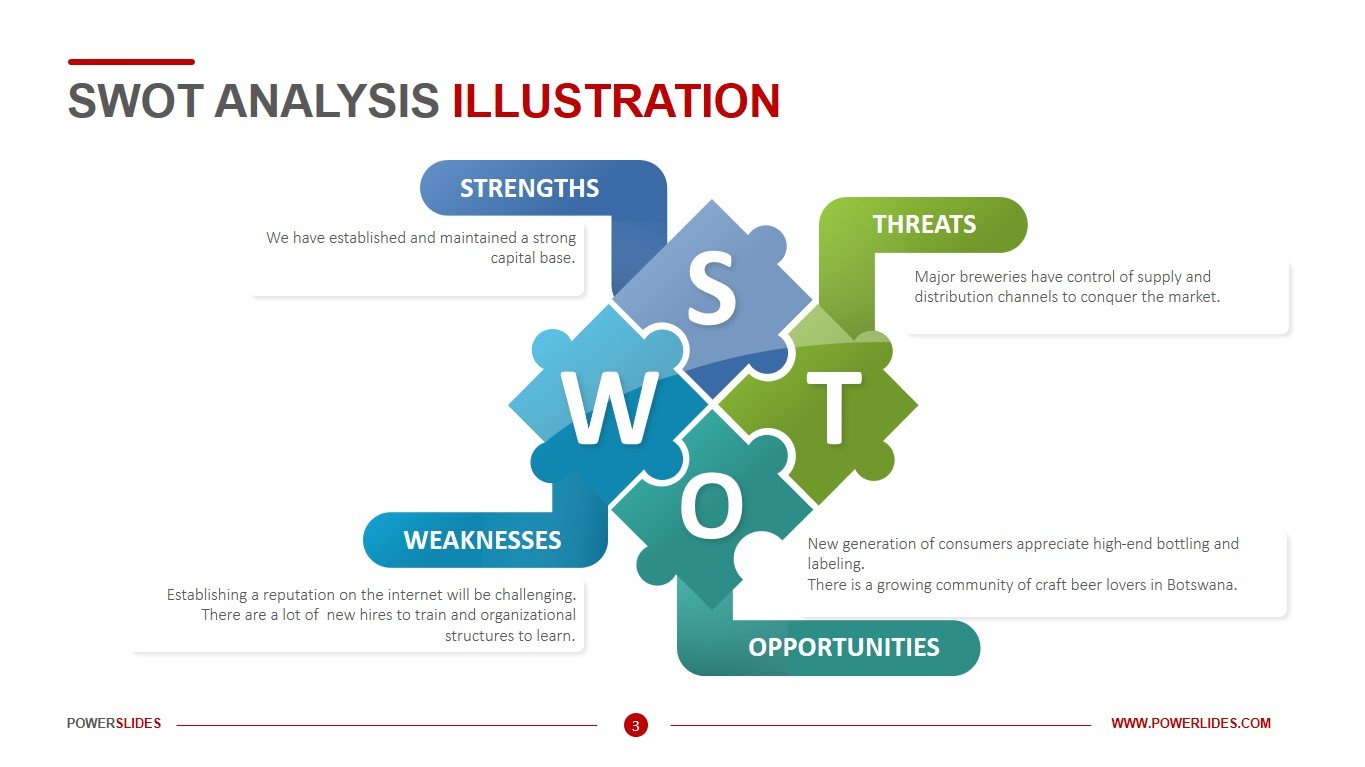
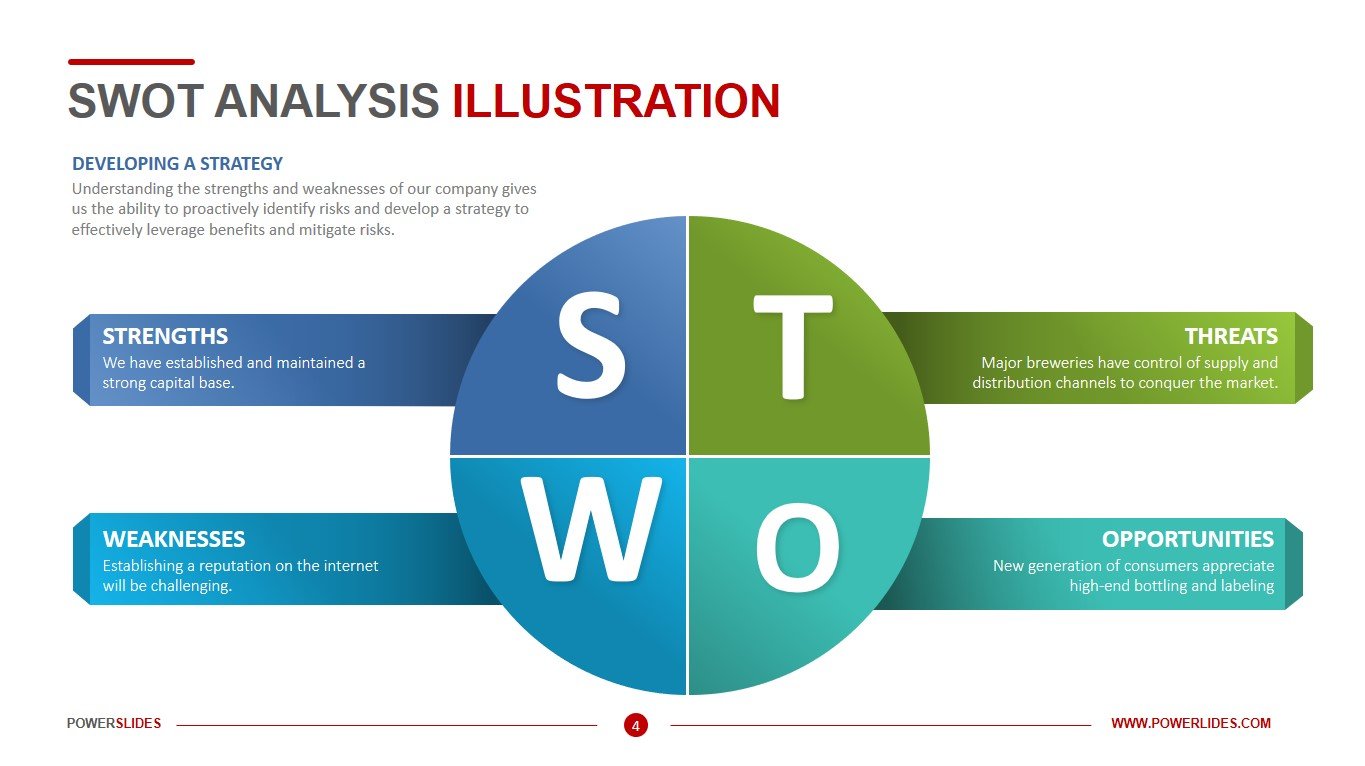
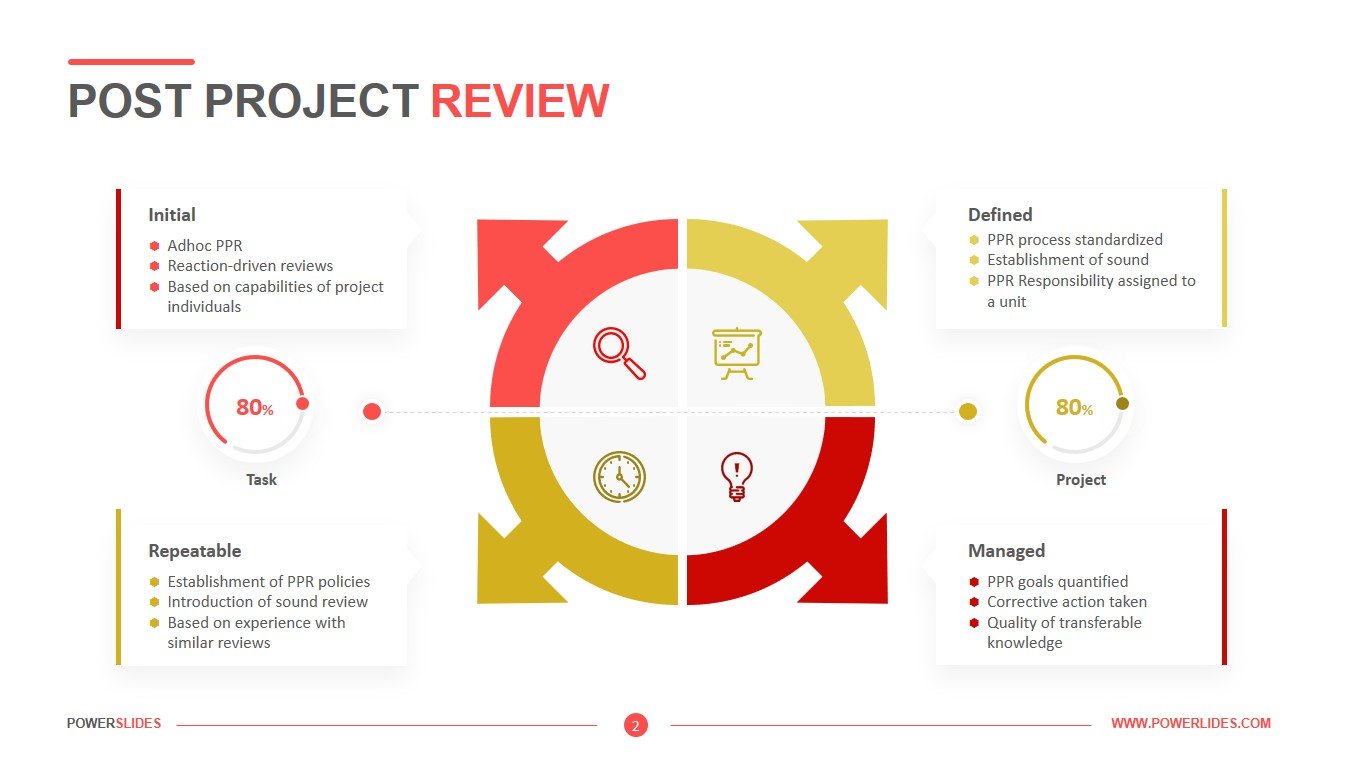
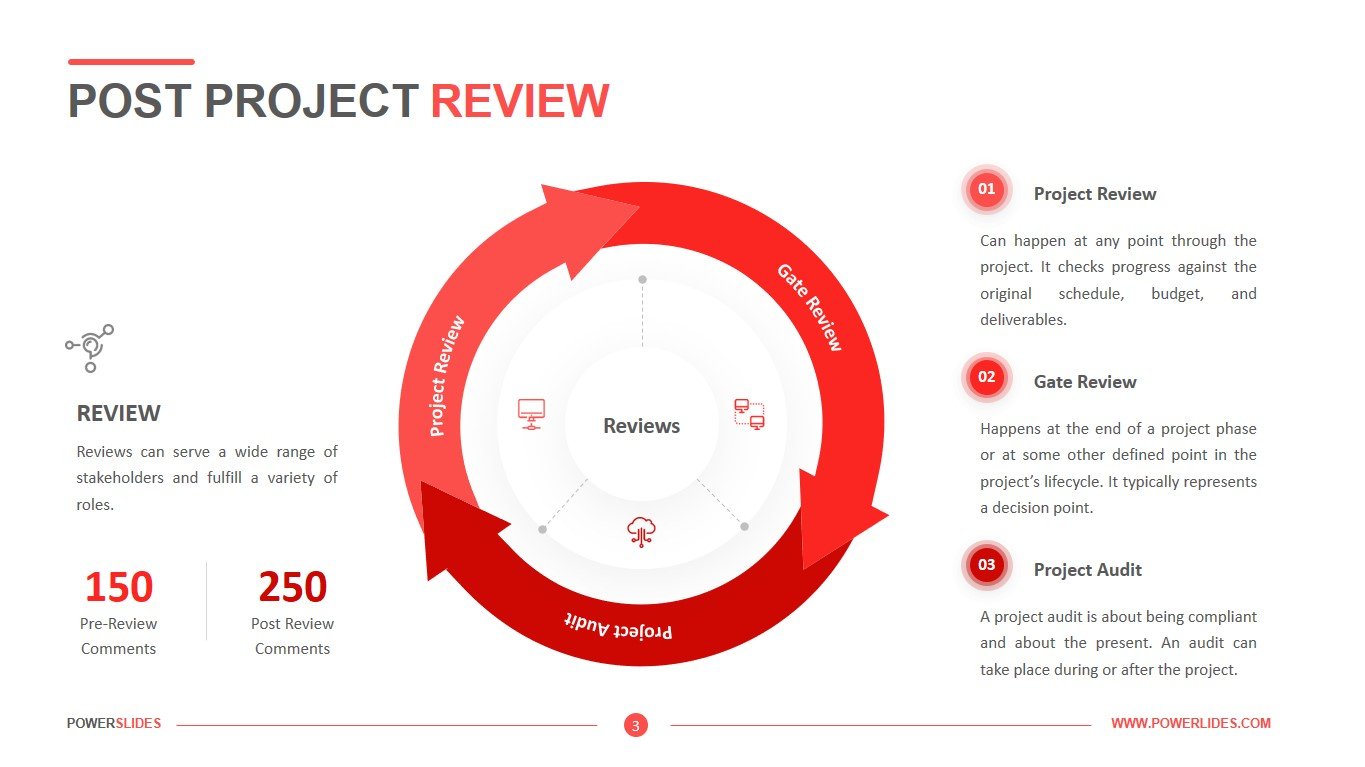
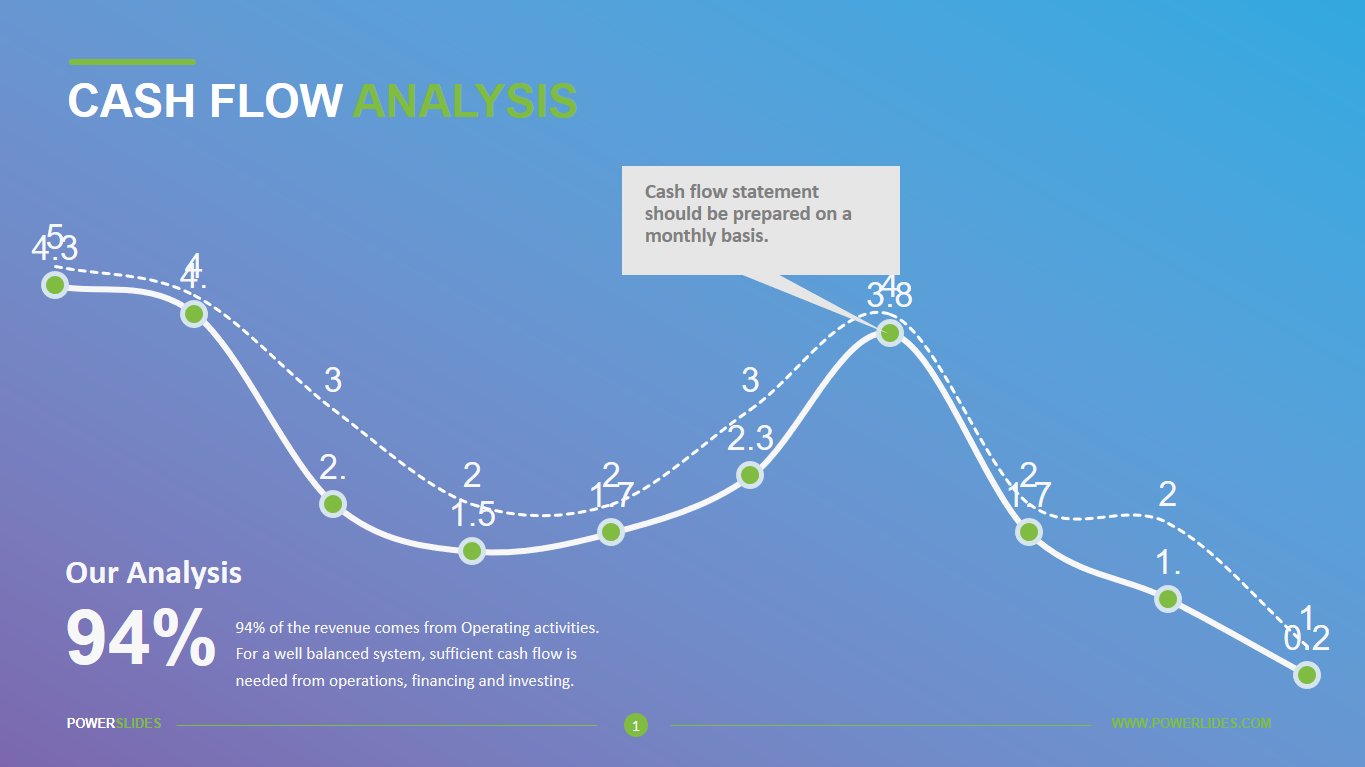
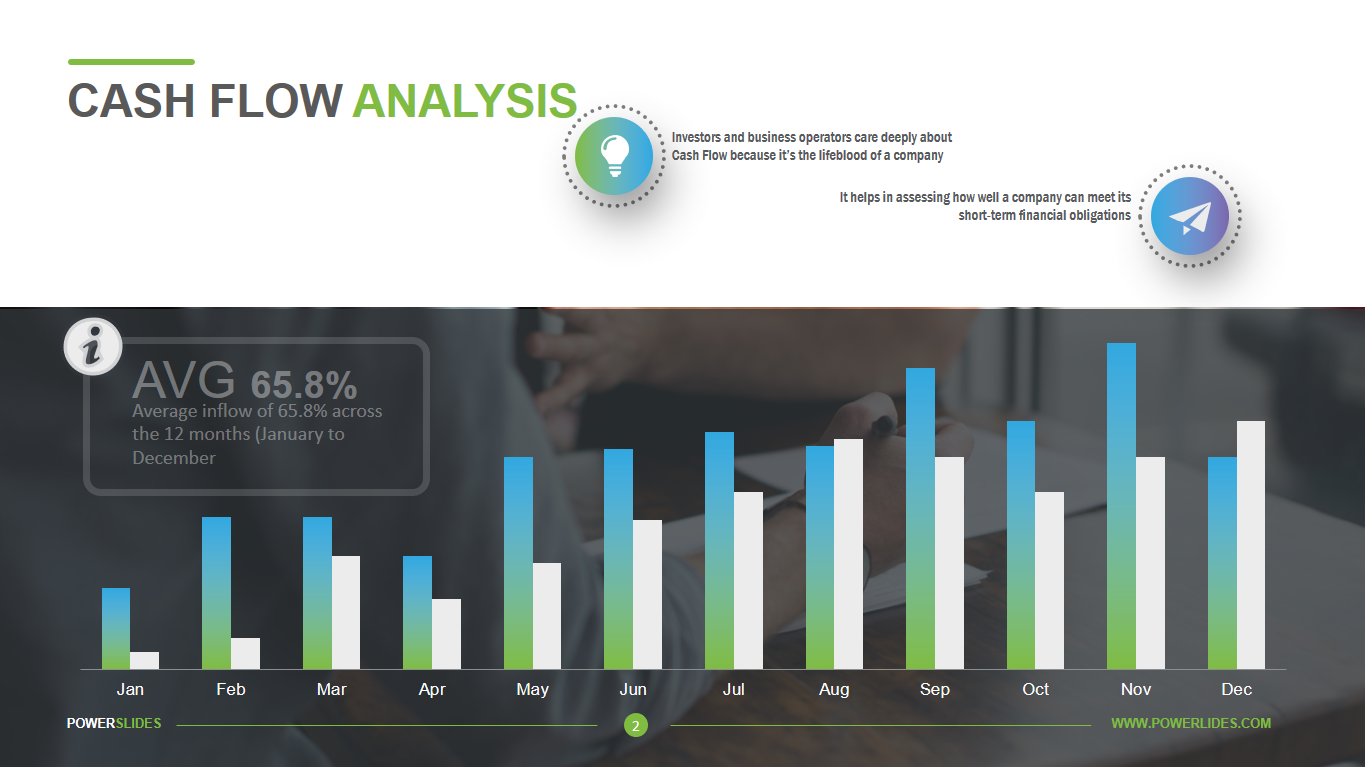
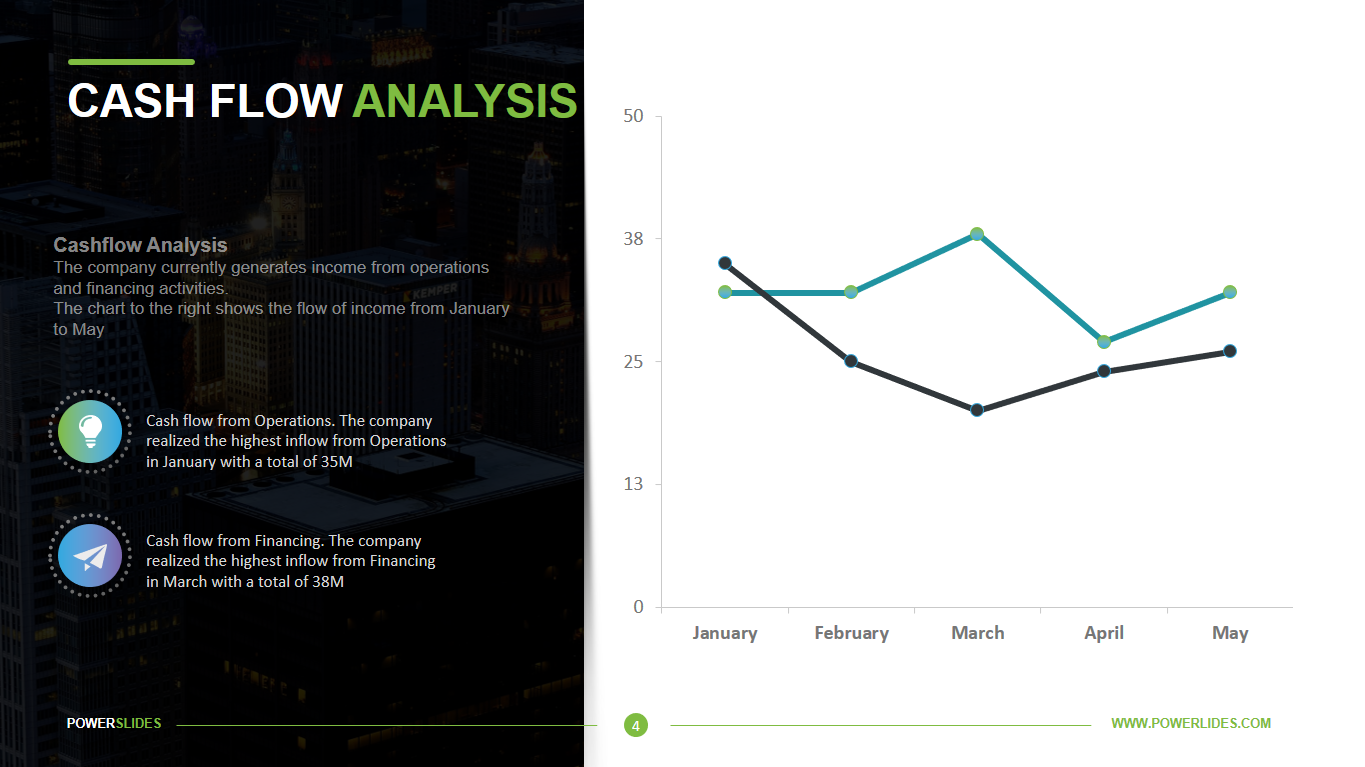
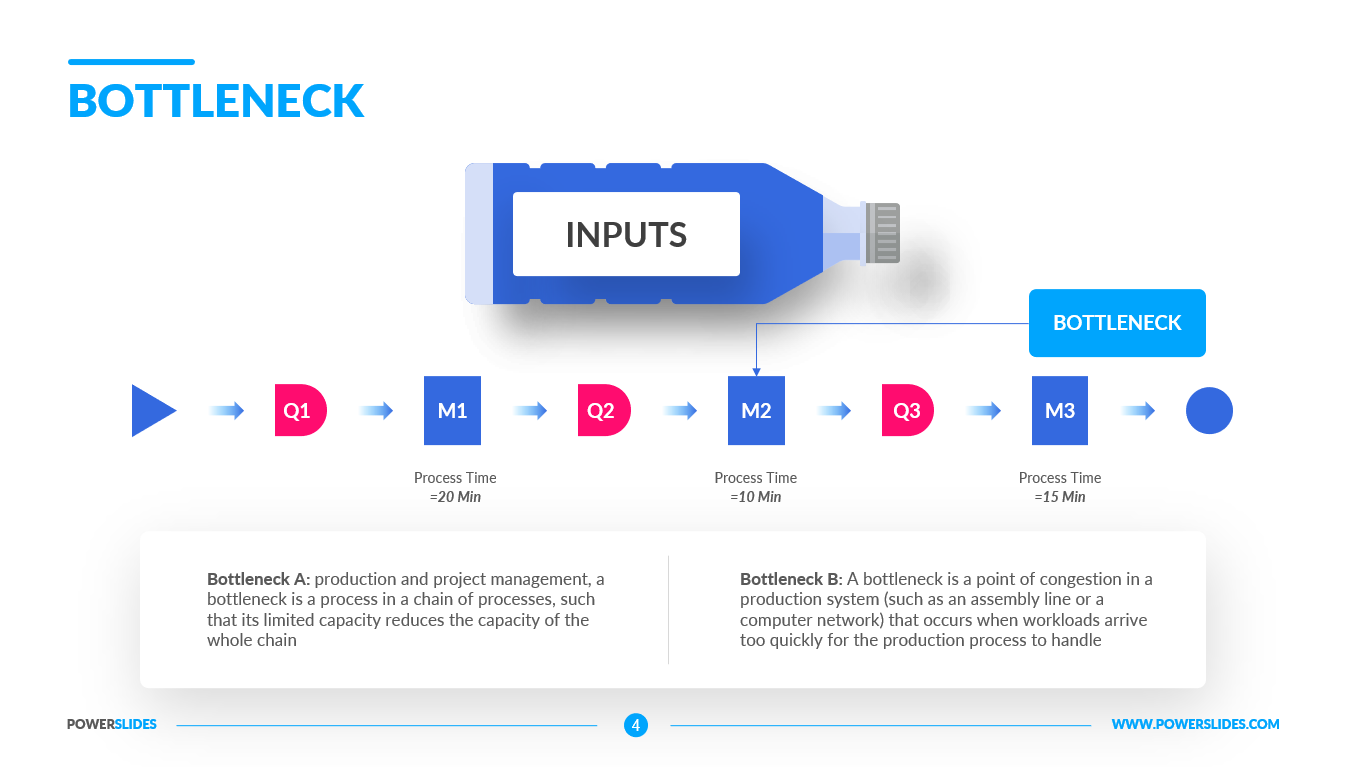
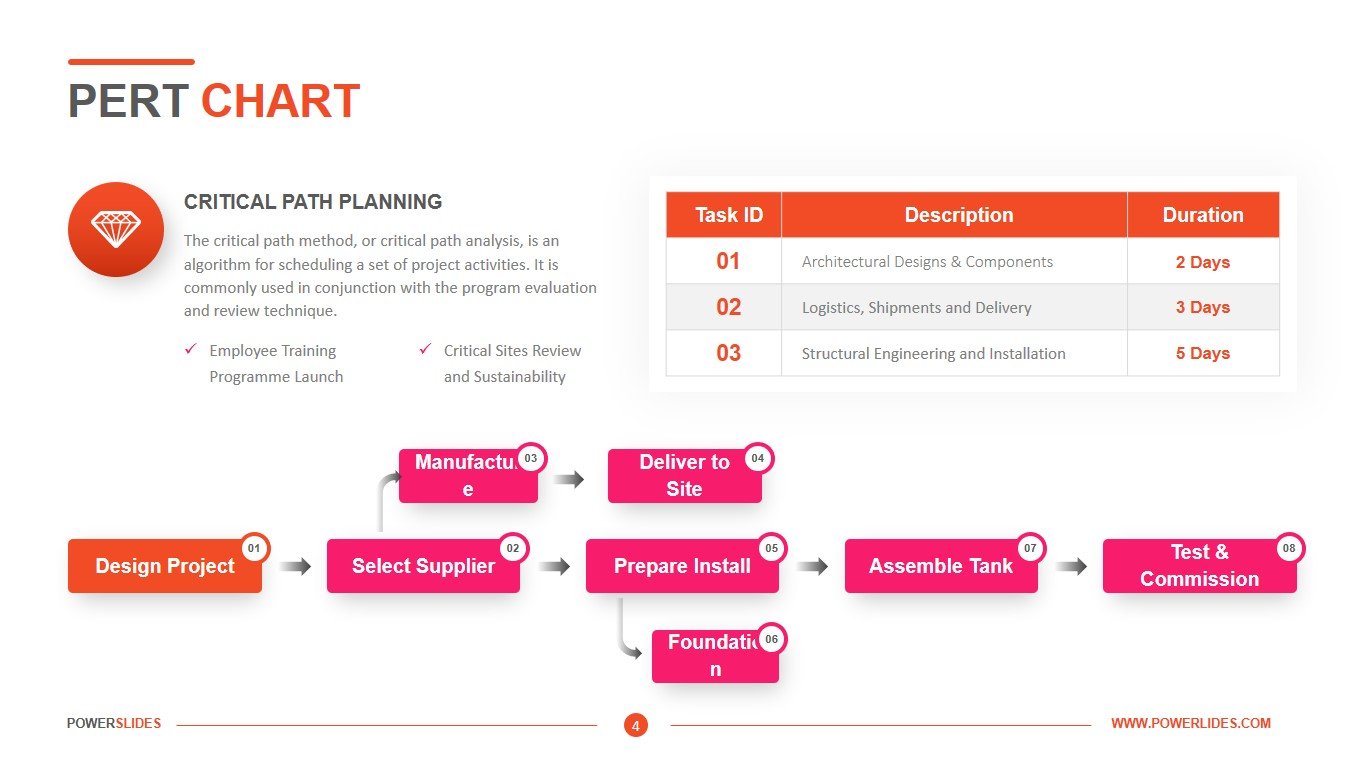
PERT Chart is a project management tool that provides a graphical representation of a project’s timeline. The Program Evaluation Review (PERT) methodology breaks down individual project tasks for analysis. The PERT chart allows managers to estimate the time and resources required to manage a project. This assessment includes the ability to track the required assets at any stage of production throughout the entire project. The PERT chart template will be useful not only for project managers but also for everyone involved in planning. Startups can use the template to analyze the cash flow for each stage of the project implementation. A purchasing manager can use this template when reporting on the supply of raw materials from different countries or different suppliers.
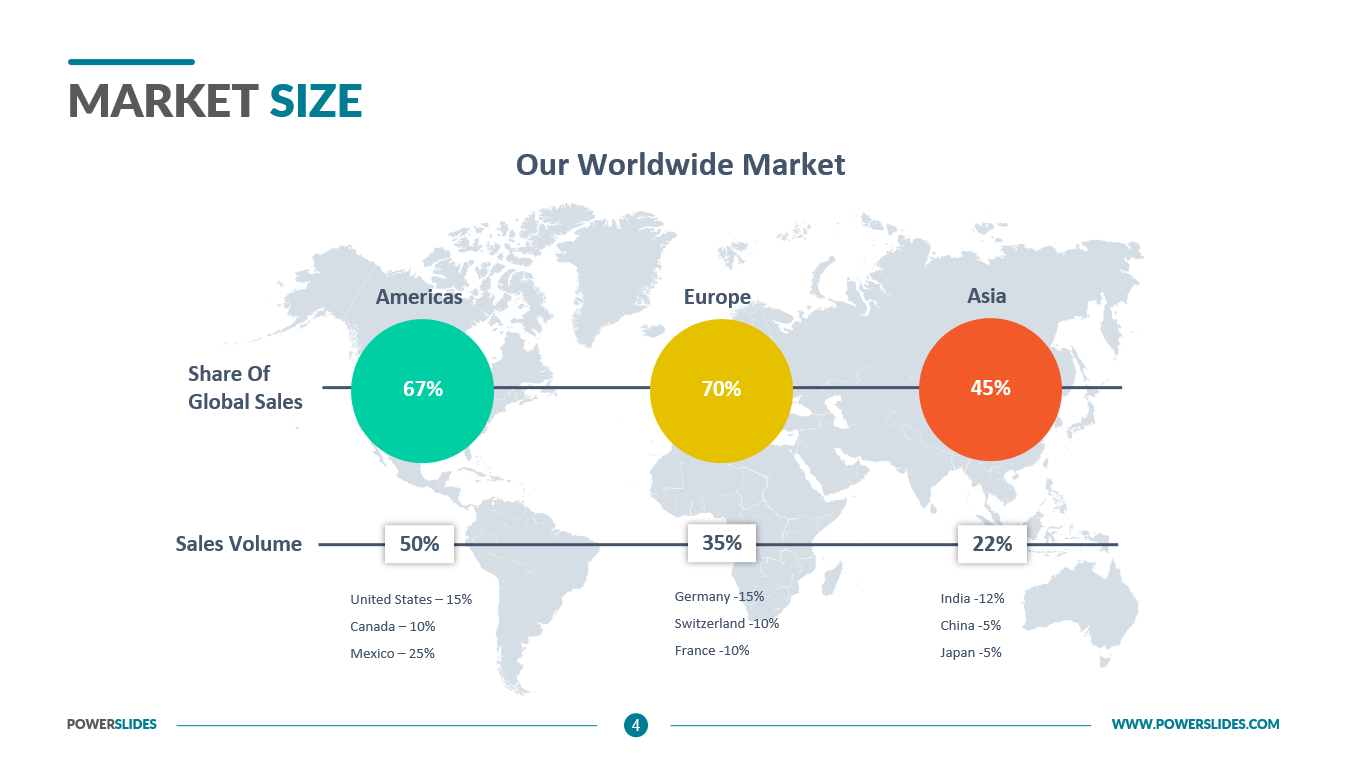
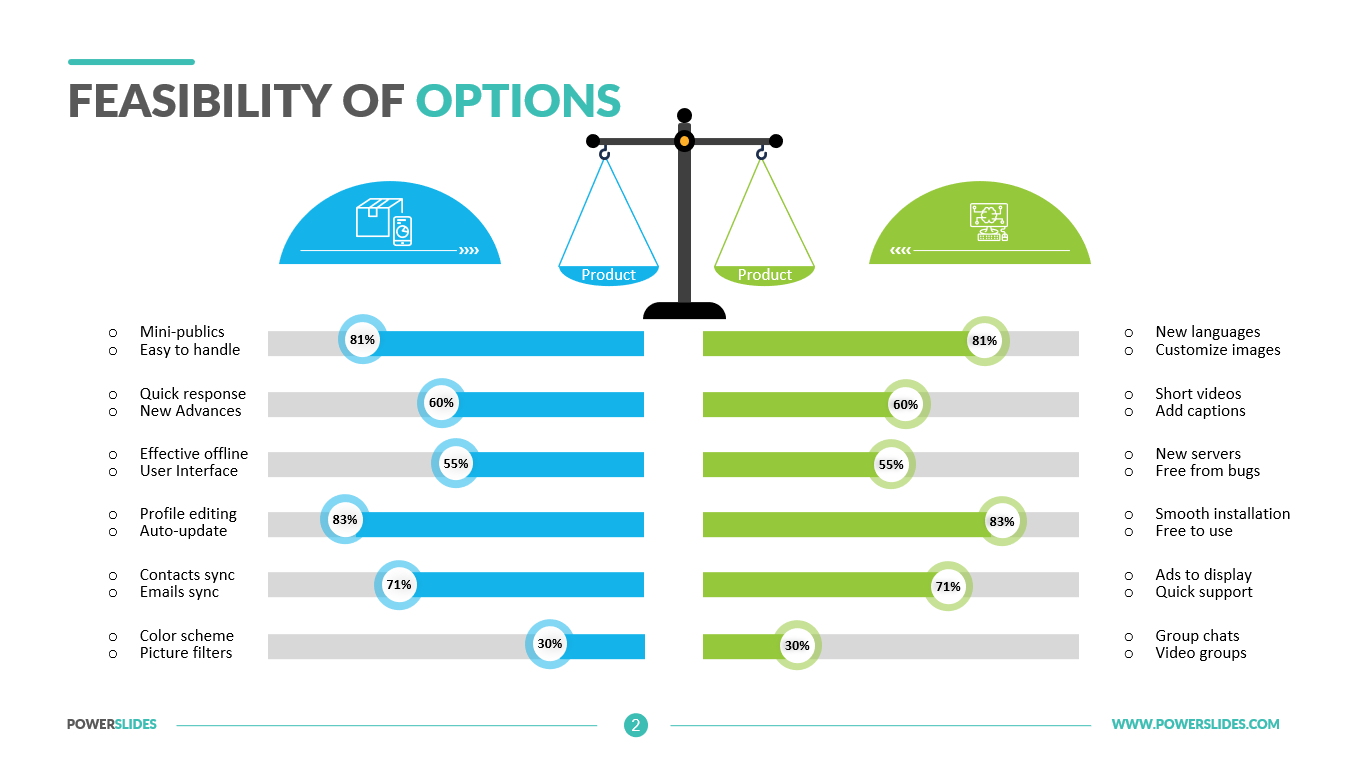
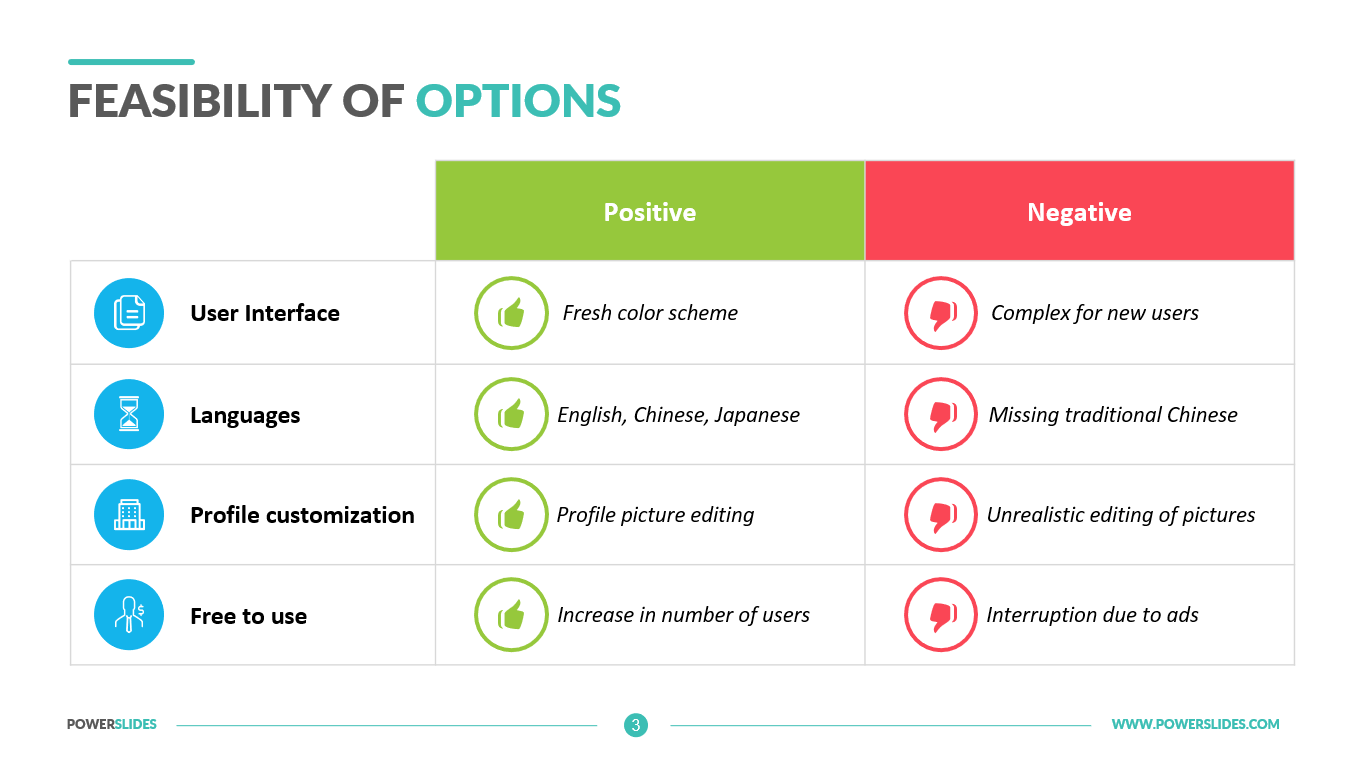
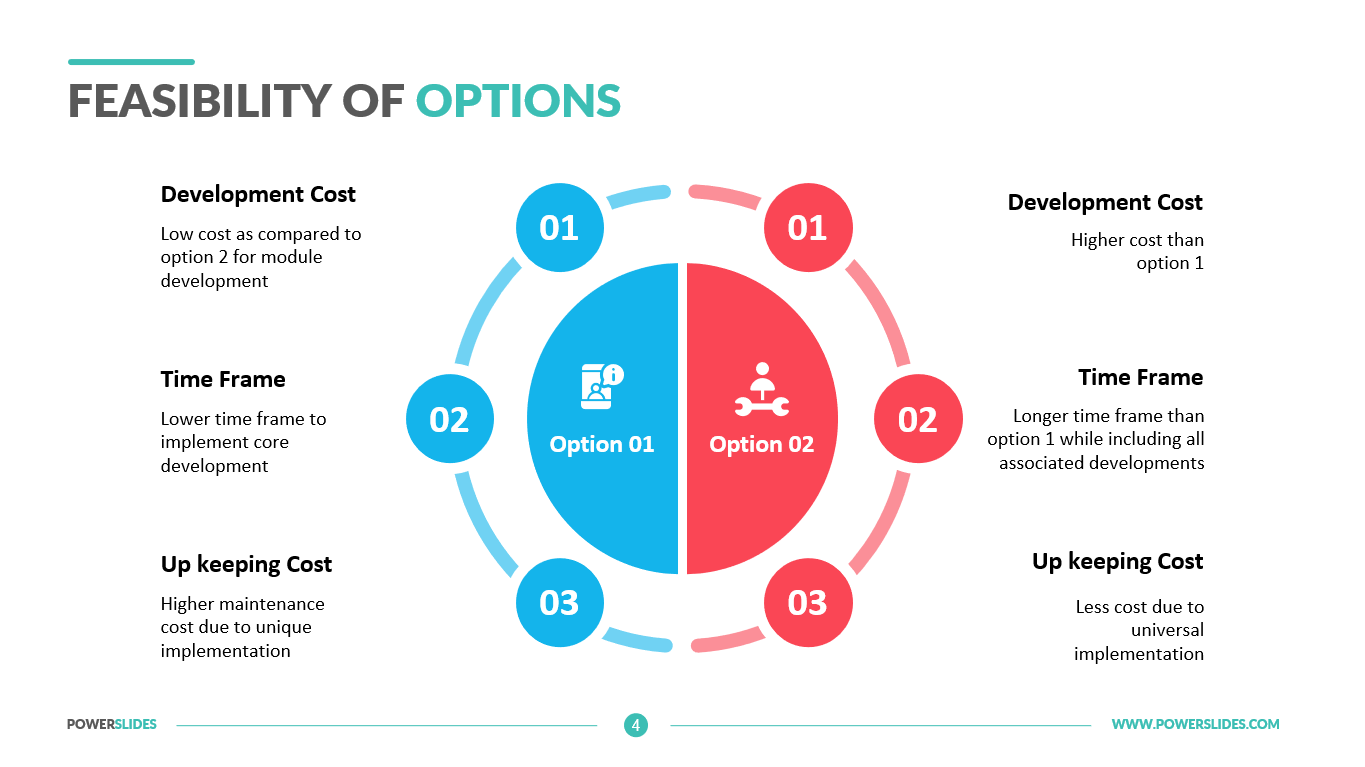
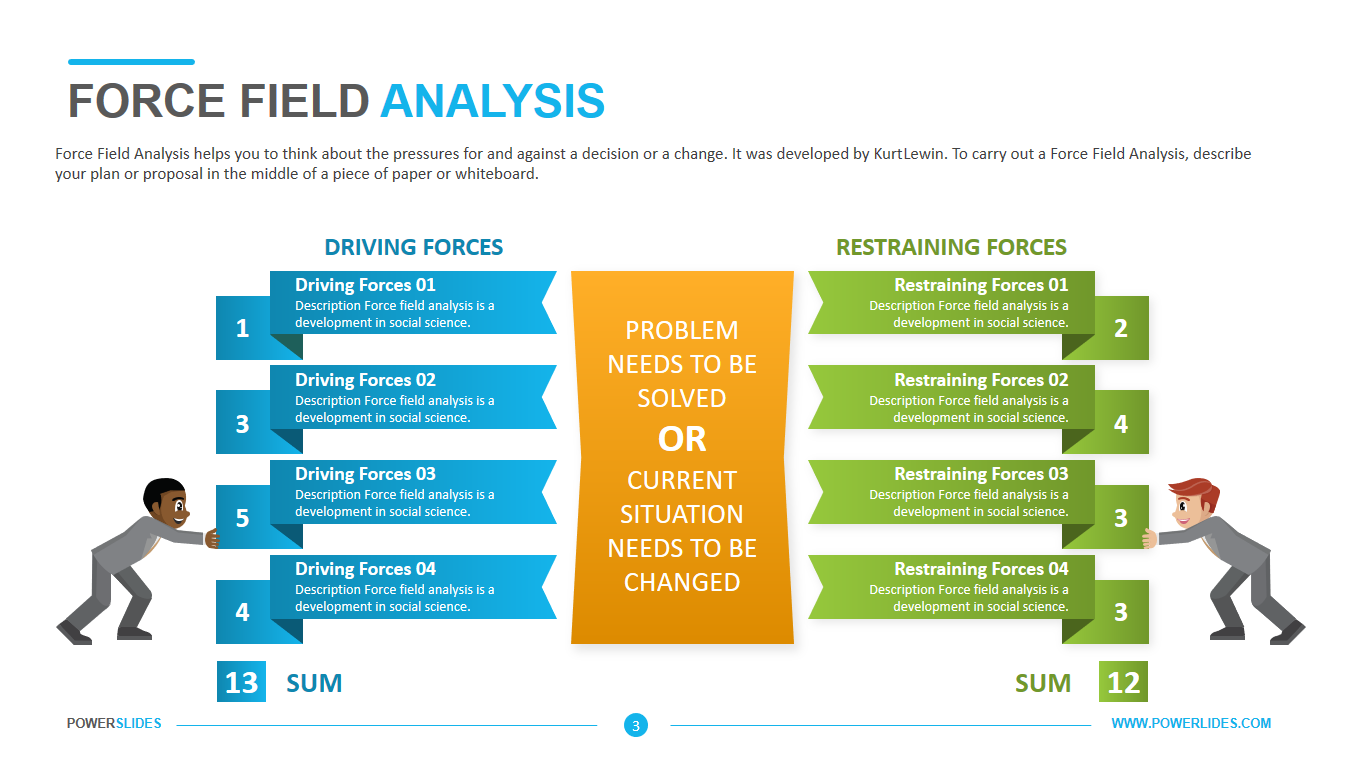
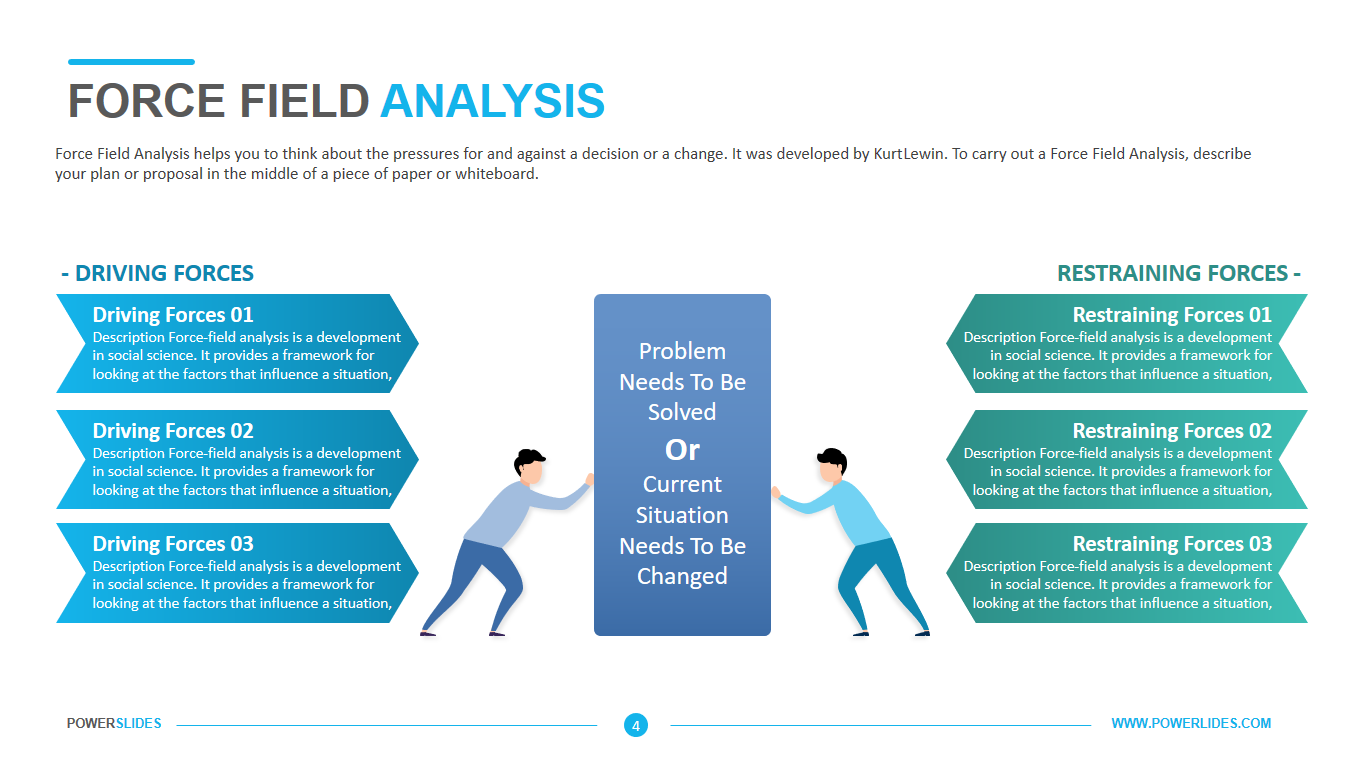
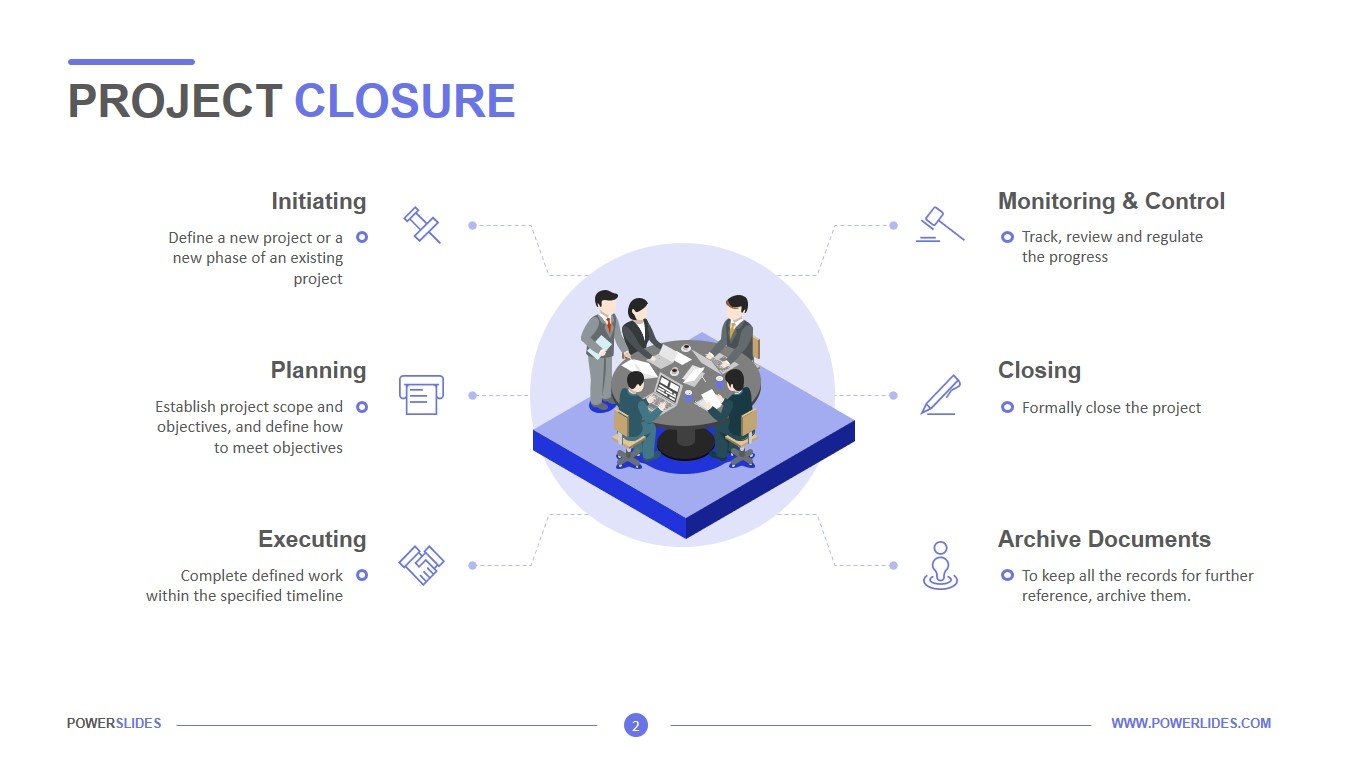
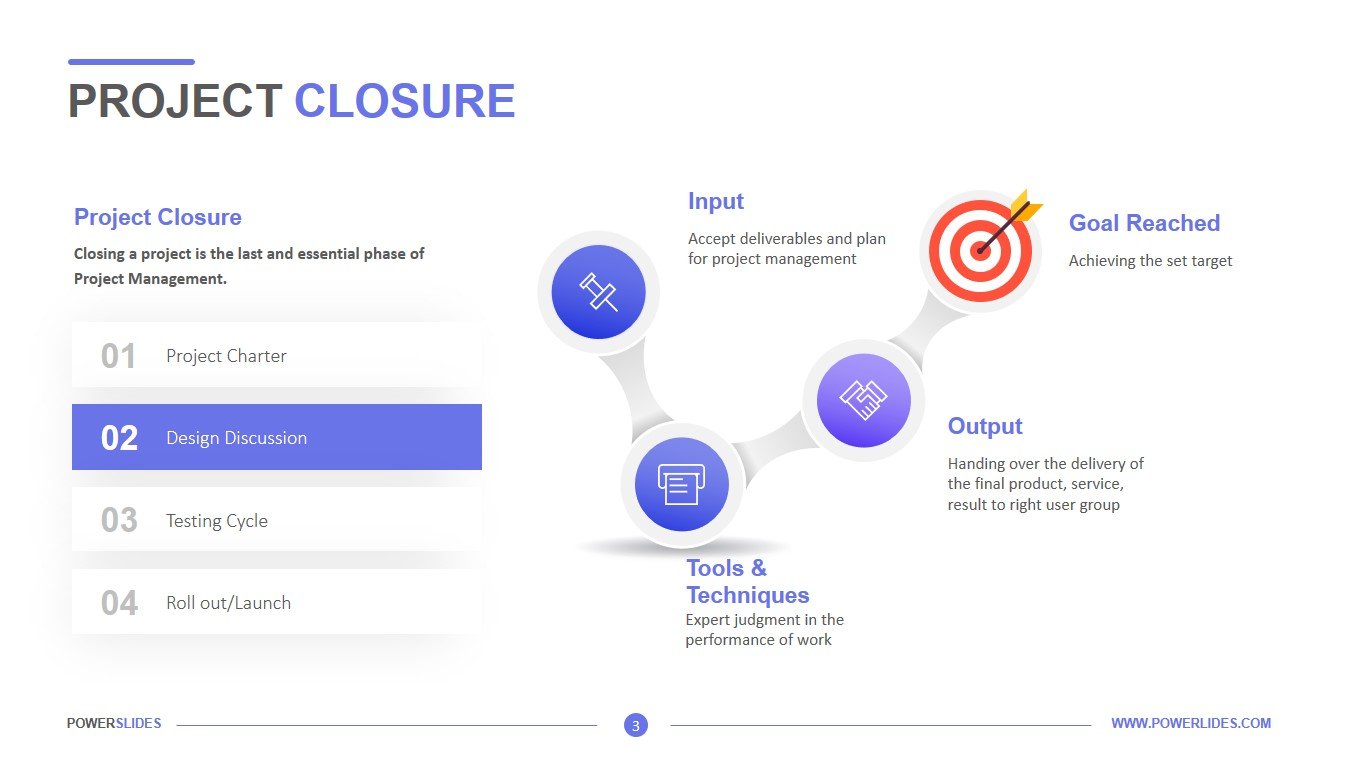
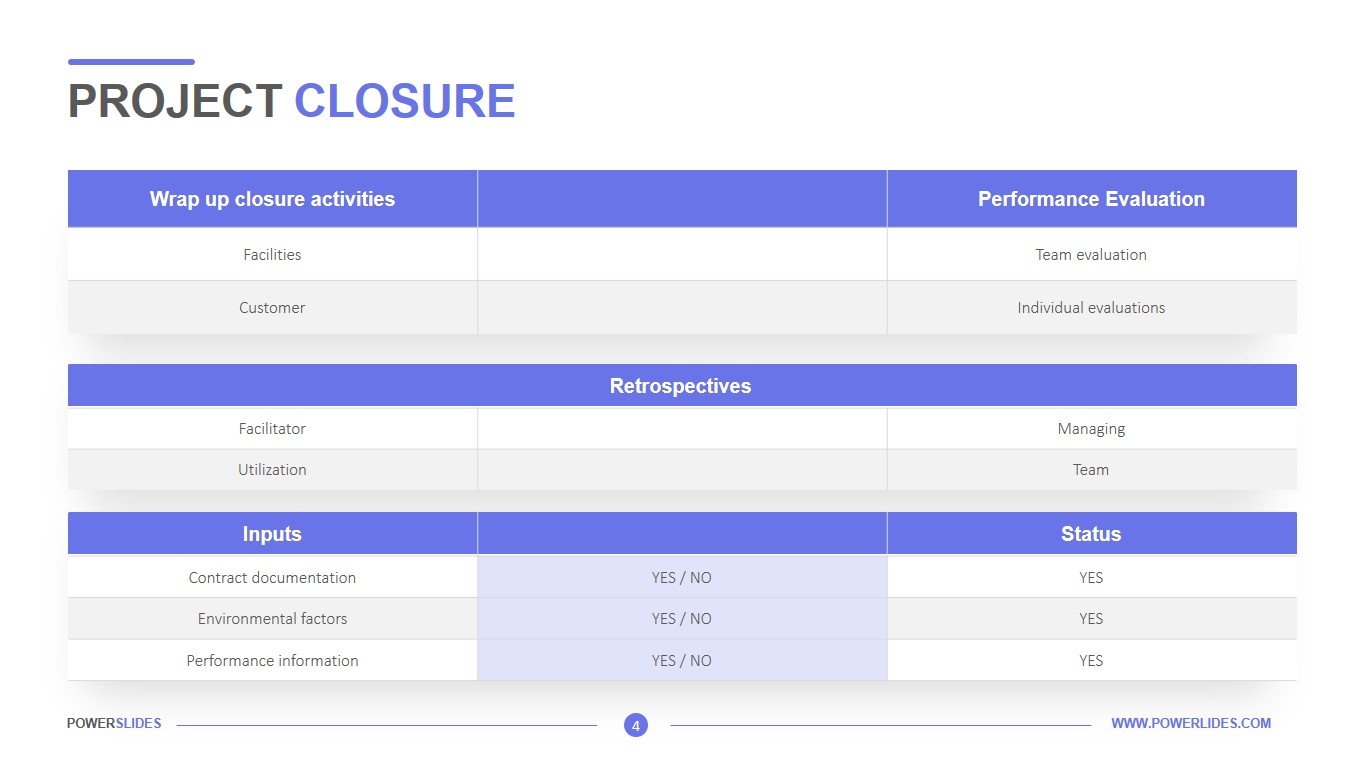
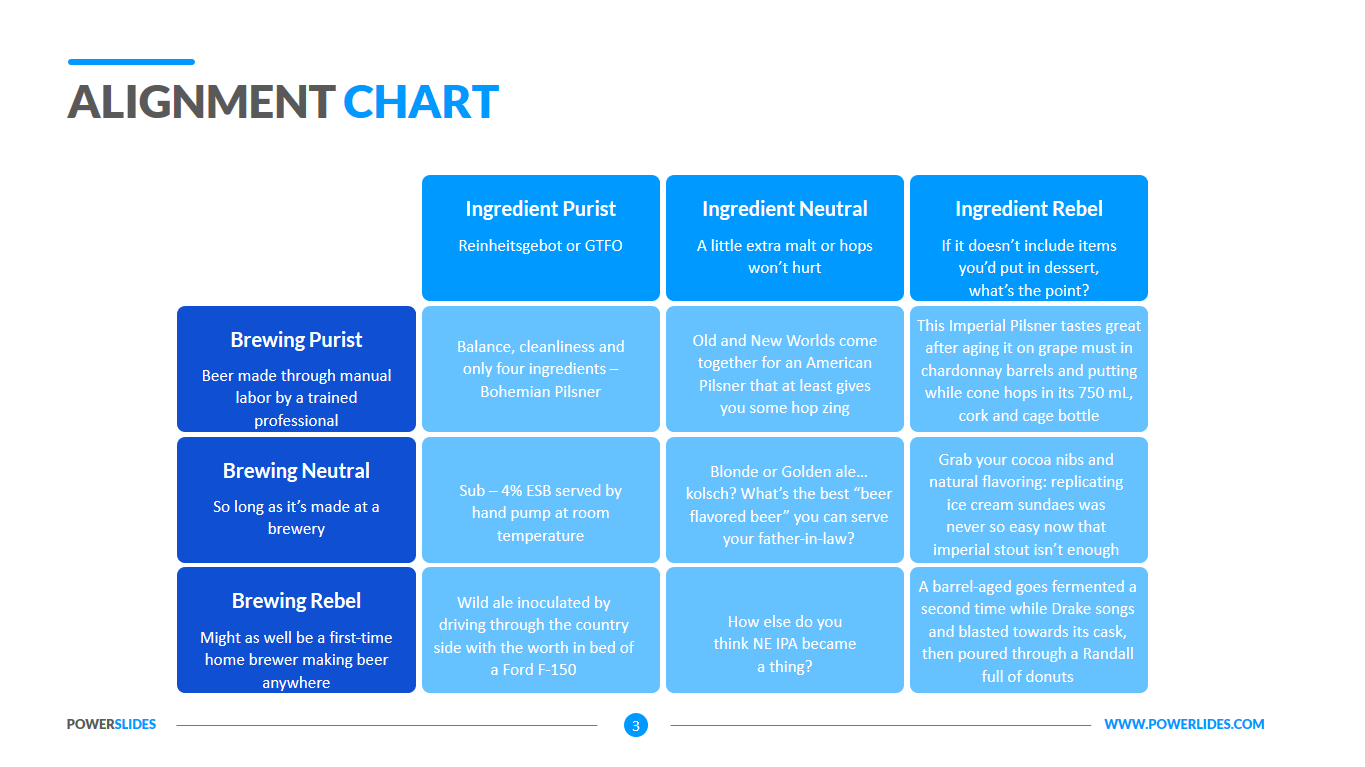
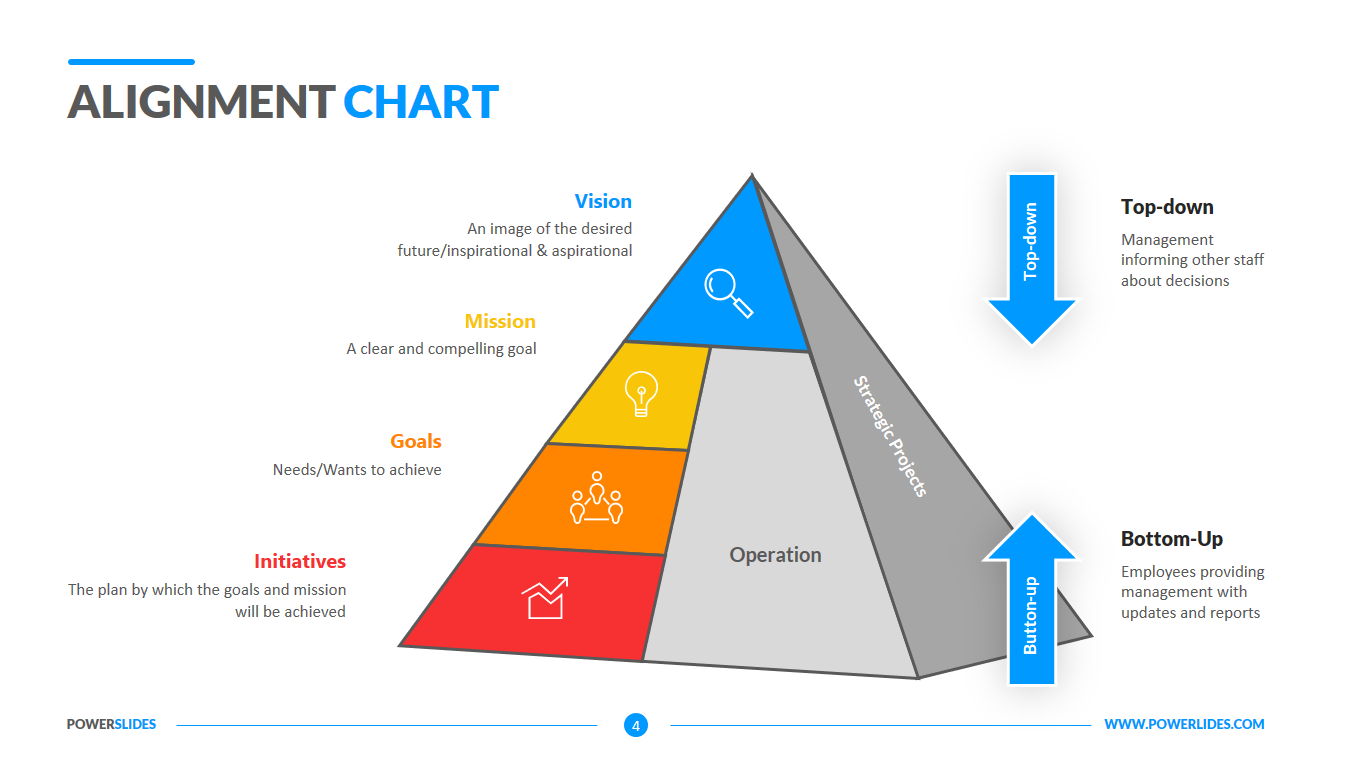
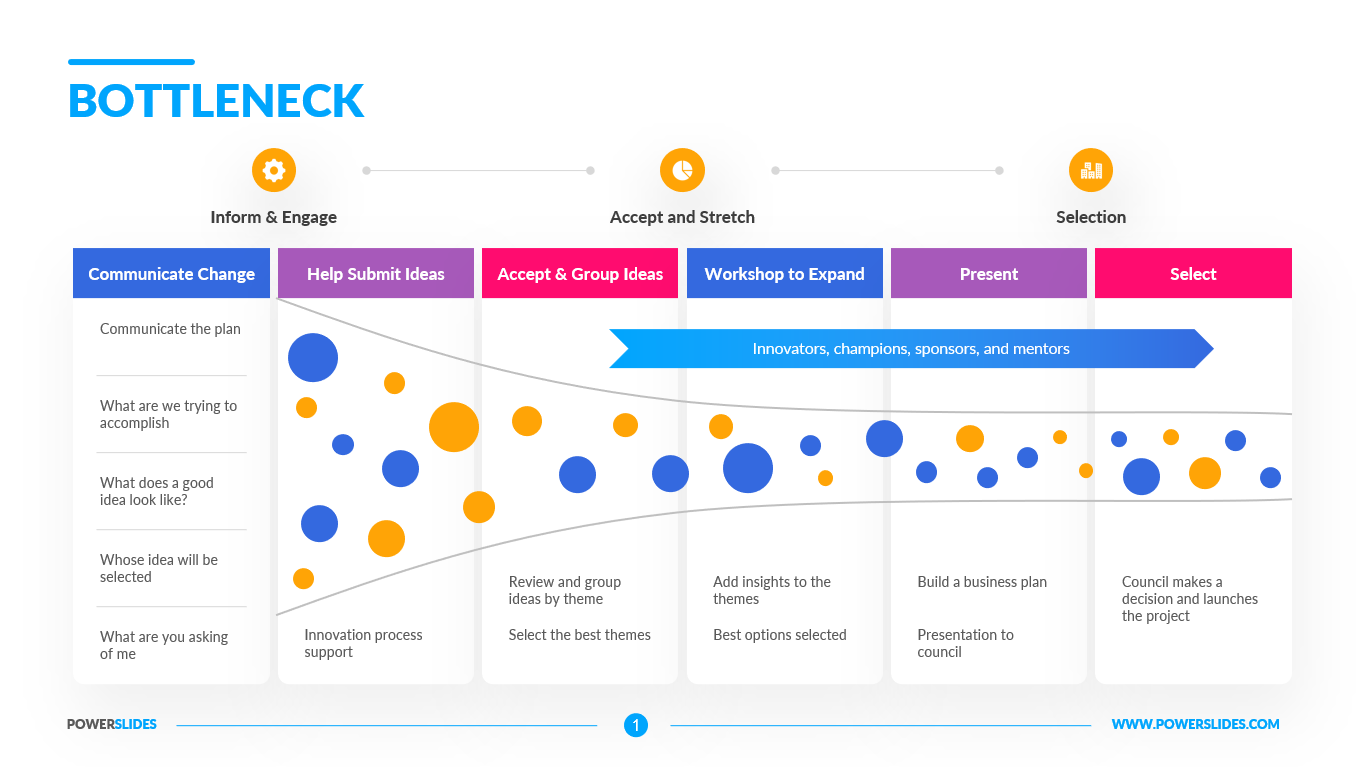
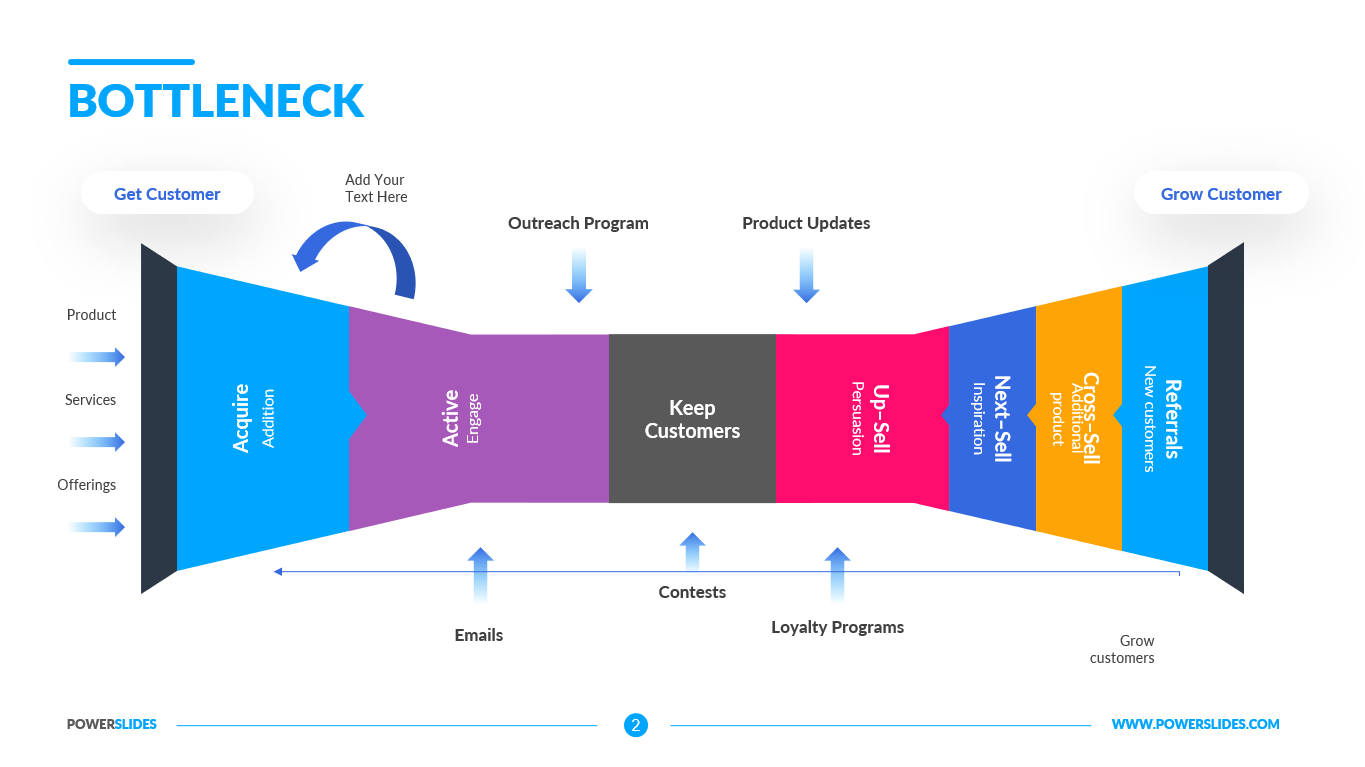
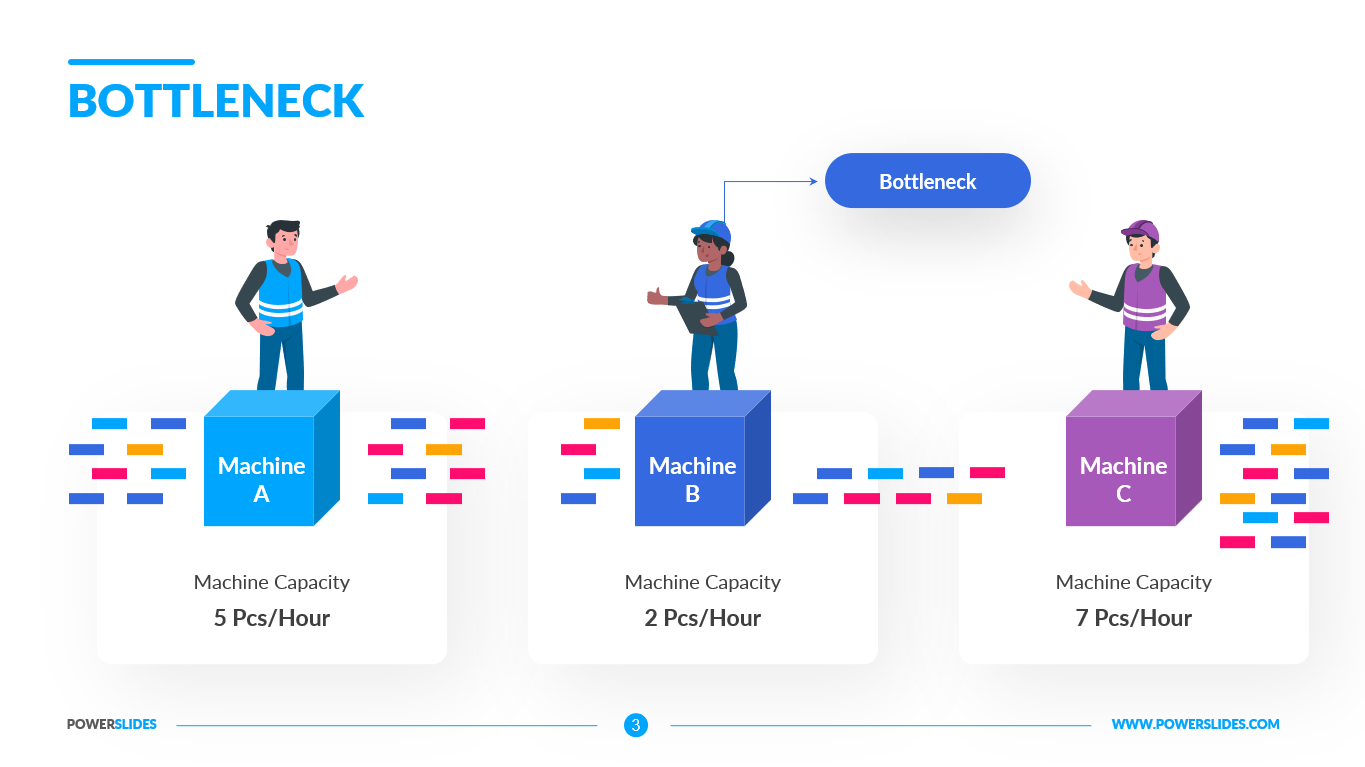
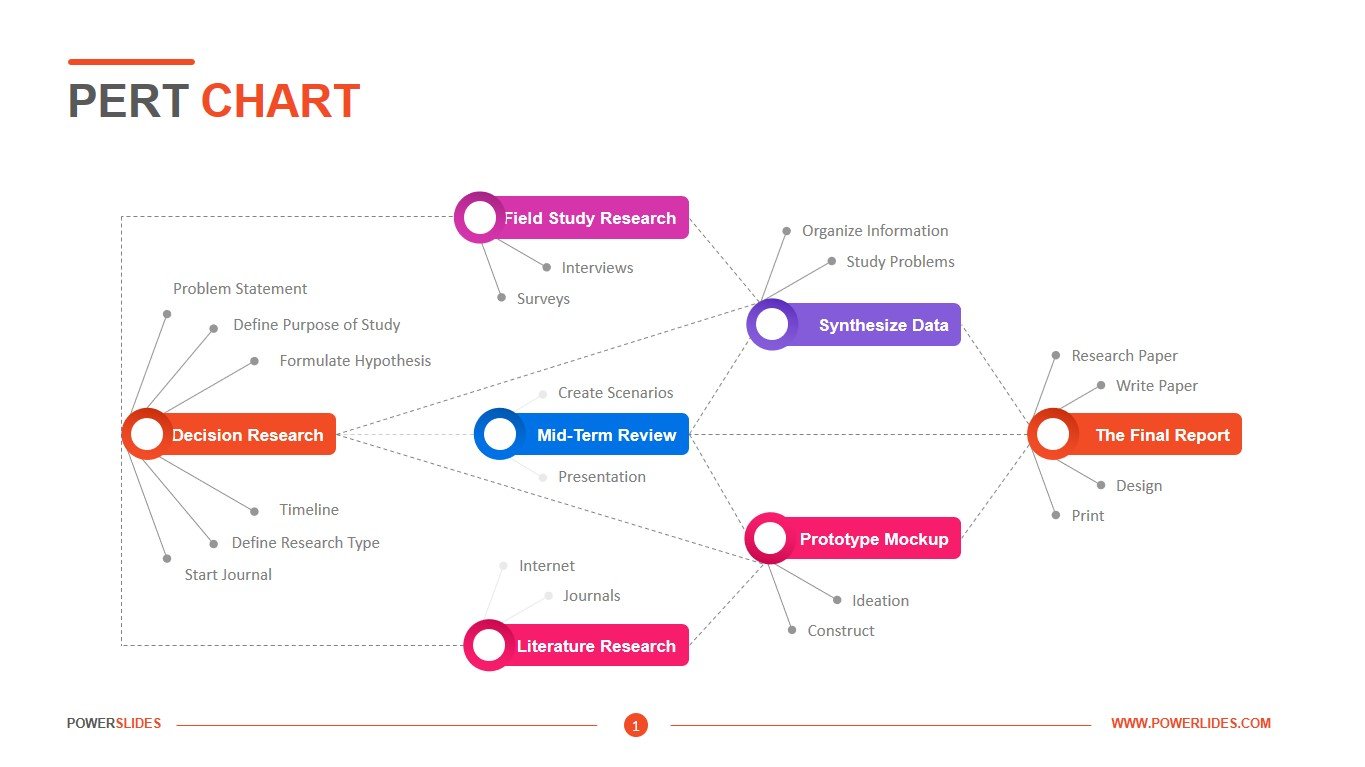
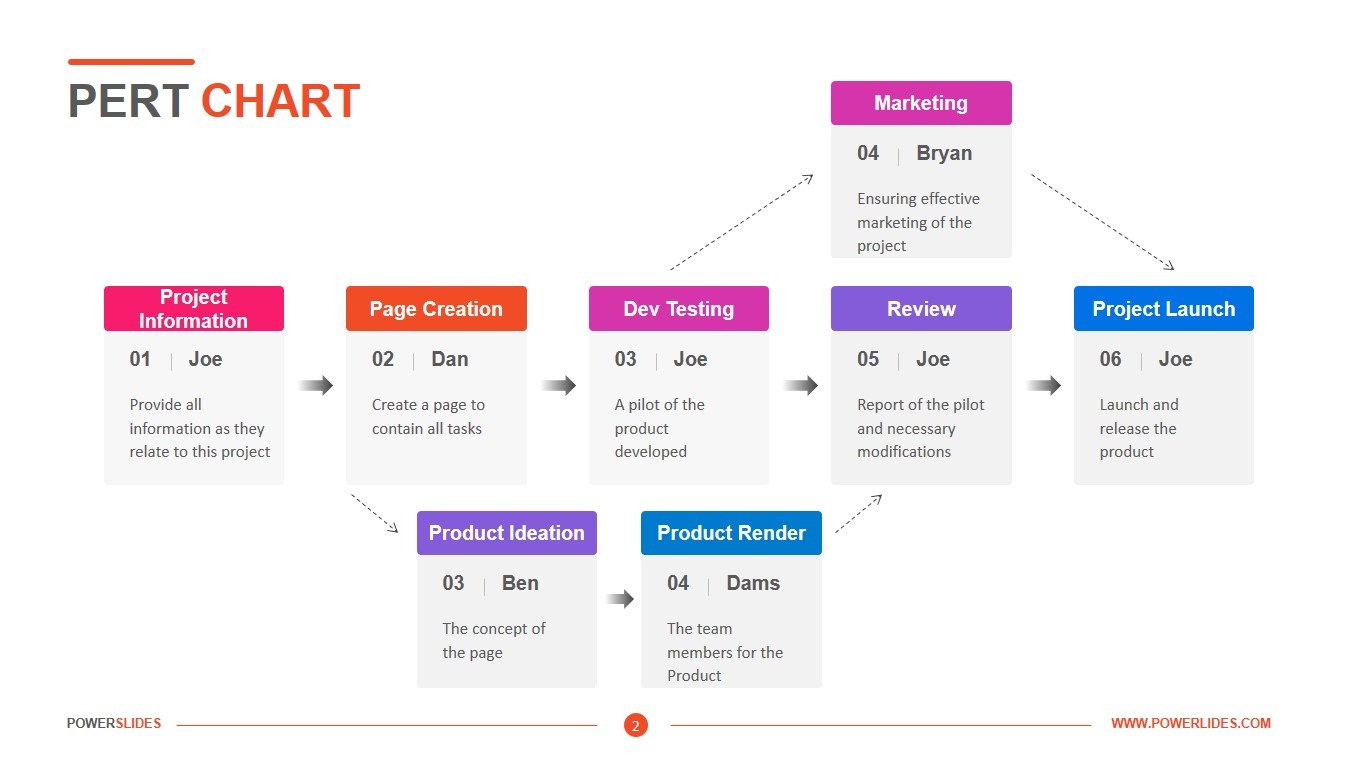
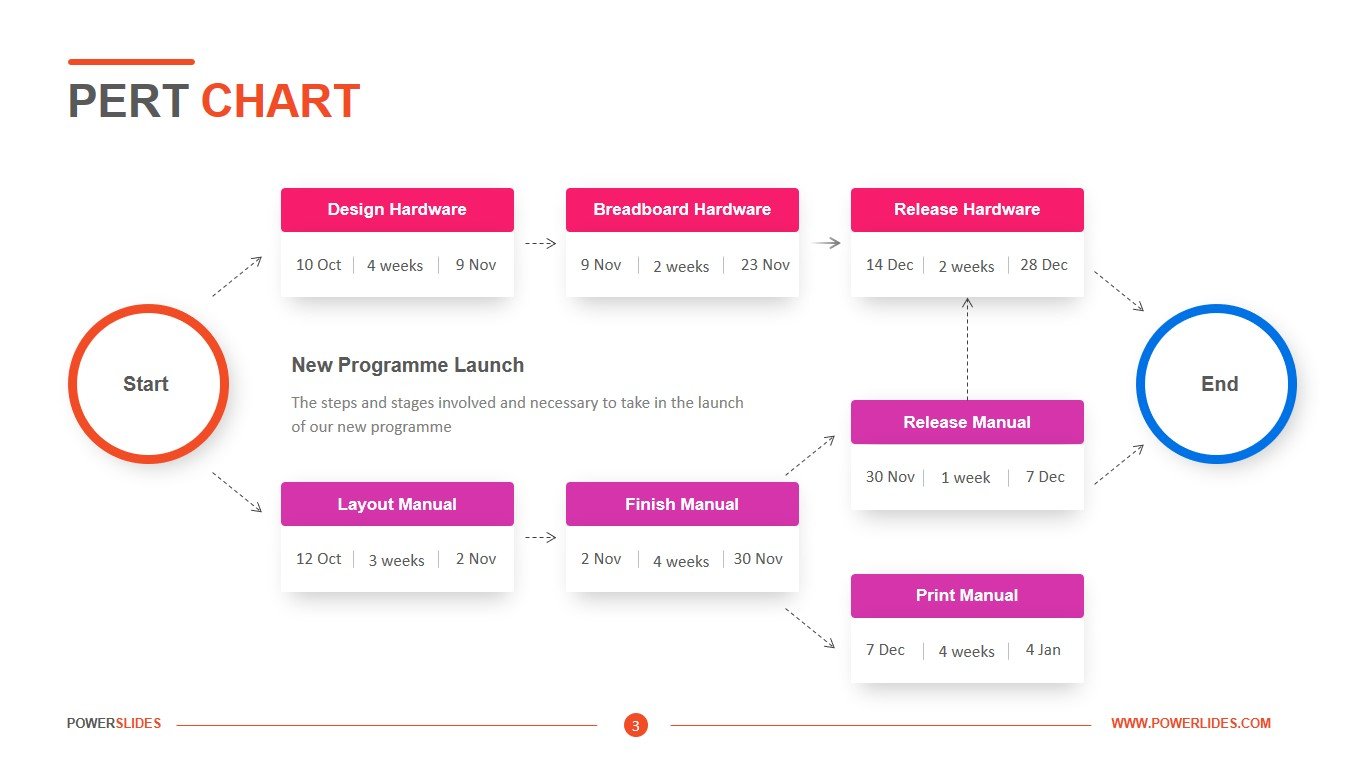
The PERT Chart Template has four slides. The first slide consists of seven main stages. These stages can take place in parallel and sequentially, which provides ample opportunities for describing your project. The dotted lines show the relationship between the steps, and the dotted lines provide a brief description of each stage. This slide can be used to create a supply chain from purchasing raw materials to unloading finished products to a customer. The second slide provides an opportunity to describe in more detail each of the stages of the project. This slide will also be useful for team leaders in preparing the staff structures for this project. The next slide can be used when comparing two options in solving a problem. Each of these options is broken down into sub-tasks and includes time periods for execution. The last slide allows you to describe the project and indicate on the right side of the slide the due date for each stage. At the bottom of the slide, you can break the project down into smaller tasks, indicating the possibility of their parallel execution. This slide allows economists, product managers, and logisticians to present their complex projects as simple tasks and show connections to each task.
PERT chart template is a modern and stylish slide set. You can make the changes you need yourself. For example, change the number of small tasks and their relationship, change the size and color of the font. This template will be useful for investors and construction organizations and plant managers. For example, you can easily use the supply of materials for the construction of a large facility. It will be easy for your audience to understand the complex interaction between suppliers and contractors, and estimate the deadlines for work at every stage. This template will be useful to software developers. They can describe the work of each of the team on their subtask easily, indicate the due date and the number of employees. The presentation will help provide timelines and resources for the product owner and scrum master. A PERT chart template is a must-have for every project manager and everyone who wants to visualize the time and resources needed to complete the task.


