Social Media Report
What do you think of this template?


 (2.50/ 5)
5 ratings

 4 Slides
 File size: 16:9
 Fonts: Lato Black, Calibri
 Supported version
PPT 2010, PPT 2013, PPT 2016
Supported version
PPT 2010, PPT 2013, PPT 2016

Product details
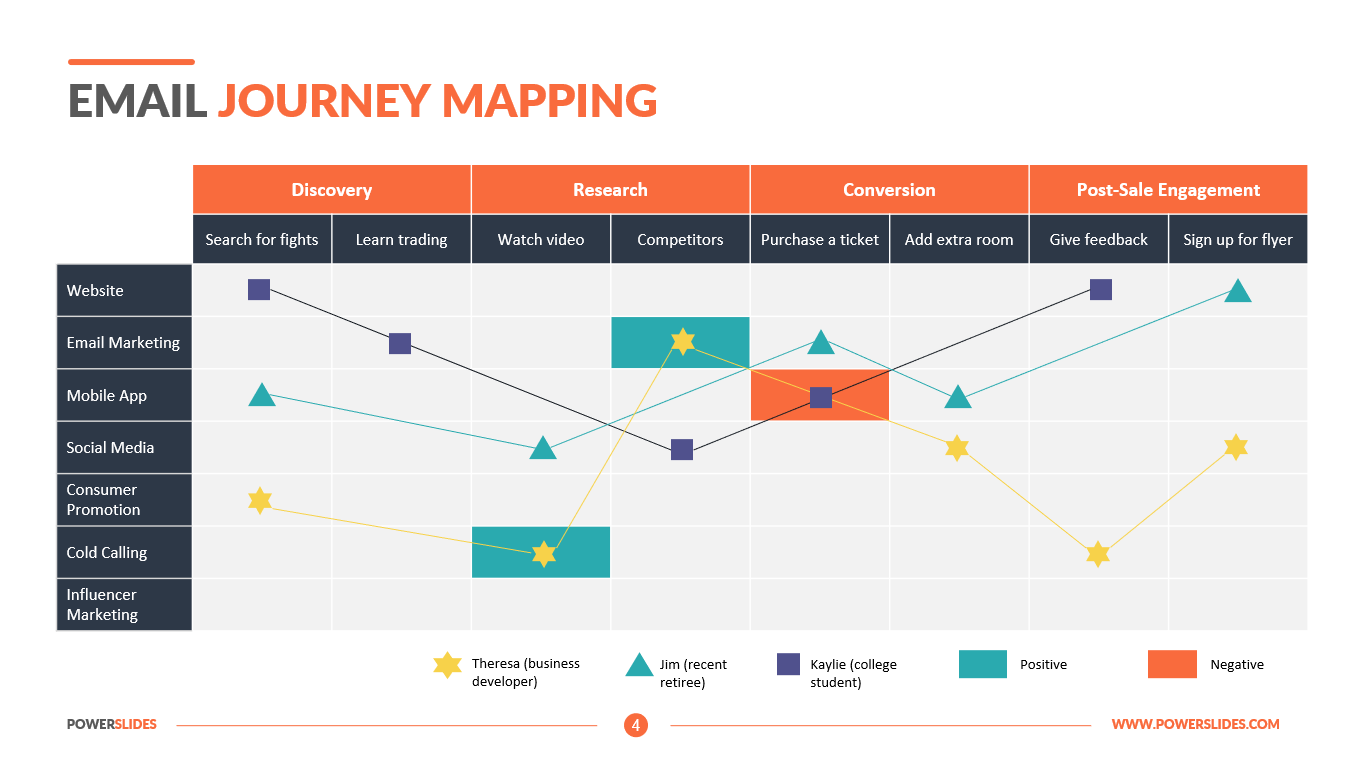
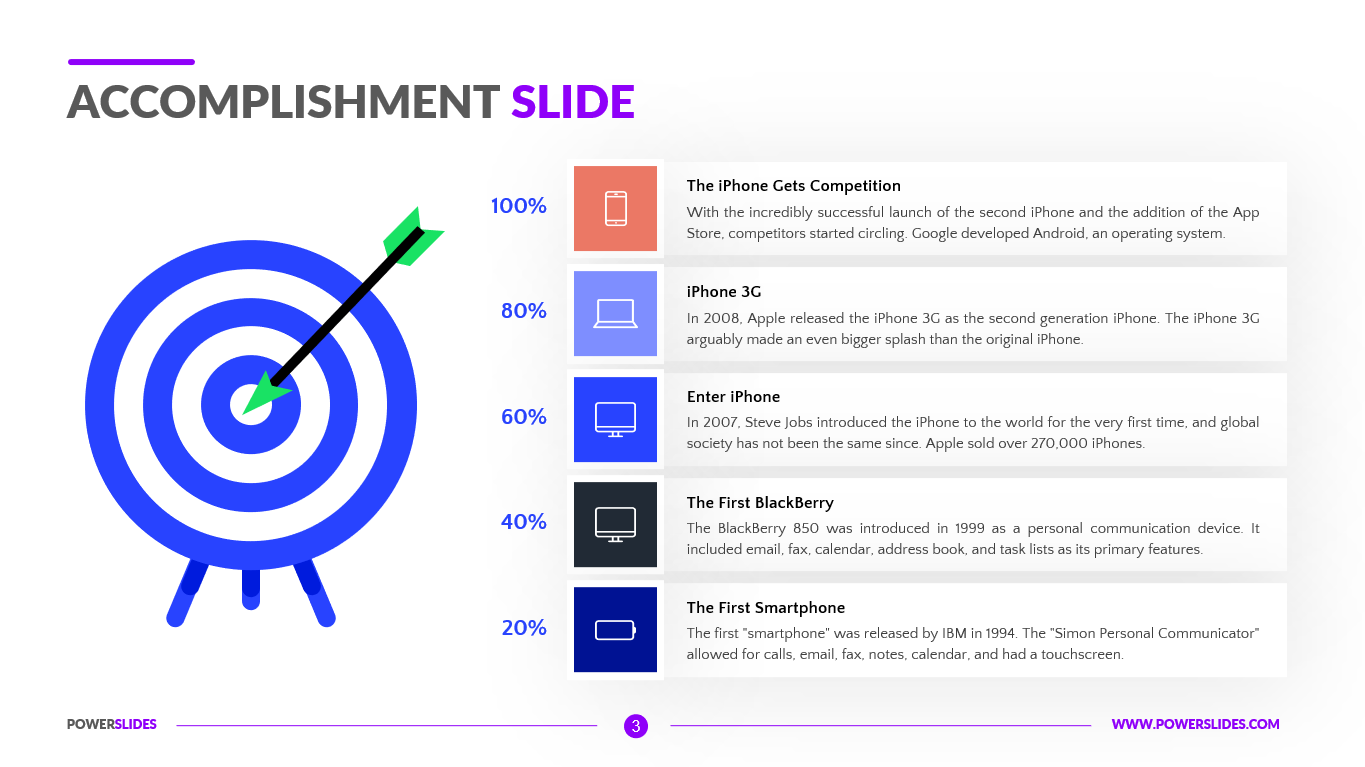
Creating a social media report can be key to explaining your progress on social media. You can choose the stats that matter and deliver it in an easy-to-understand way. There are tons of personal insights to gain as well as valuable info for your boss or client. A social media report is simply a collection of data and stats. Which data and stats should be on there? And why? The answer likely depends on your specific social media strategies and goals. Followers tell you the number of people who wish to connect with your brand. The benefits of followers are for the reach of your content, the social proof of your brand’s popularity. Clicks tell you that the content you’re sharing is of personal interest to the user. Retweets tell you that the content you’re sharing is perceived as potentially interesting to one’s followers. The benefits of retweets are for advanced exposure to people who aren’t your followers. Favorites are somewhat of a wild card. The benefit of favorites is as a social proof metric. How do you want to track your progress and growth? Snapshot – a look at the numbers for a chosen period, with no previous history considered. Week over week, period over period – a comparison of stats for a chosen period with stats for the previous period, or even from the previous year. When your boss or client looks at followers, they could draw lots of conclusions: popularity, reach, brand awareness, etc. As you grow the followers on your social media profile, your influence gets a little wider, both in the number of people you will potentially reach and in the perceptions, others have of you. A growth report is a great way to capture these two ideas. The practical value of having influencers among your followers is that any social media update of yours has the chance to take off big time. And influencers among your tribe is great social proof for others to see that you’re being taken seriously by big-time users. Total engagement can mean different things to different people. In general, engagement is the sum of likes, comments, clicks, and reshares — basically every interaction one can take on a social media update. What this information tells you is the overall effectiveness of your post. Did people like what you shared?
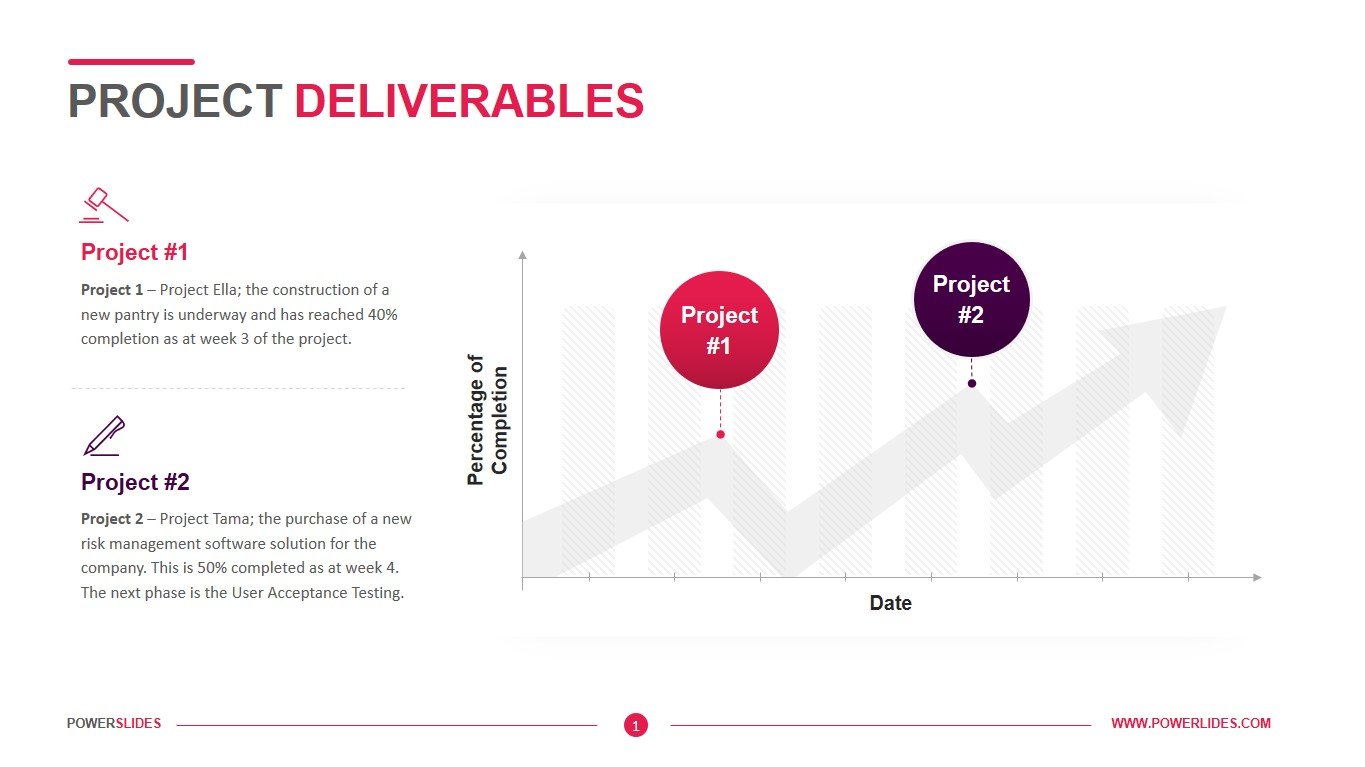
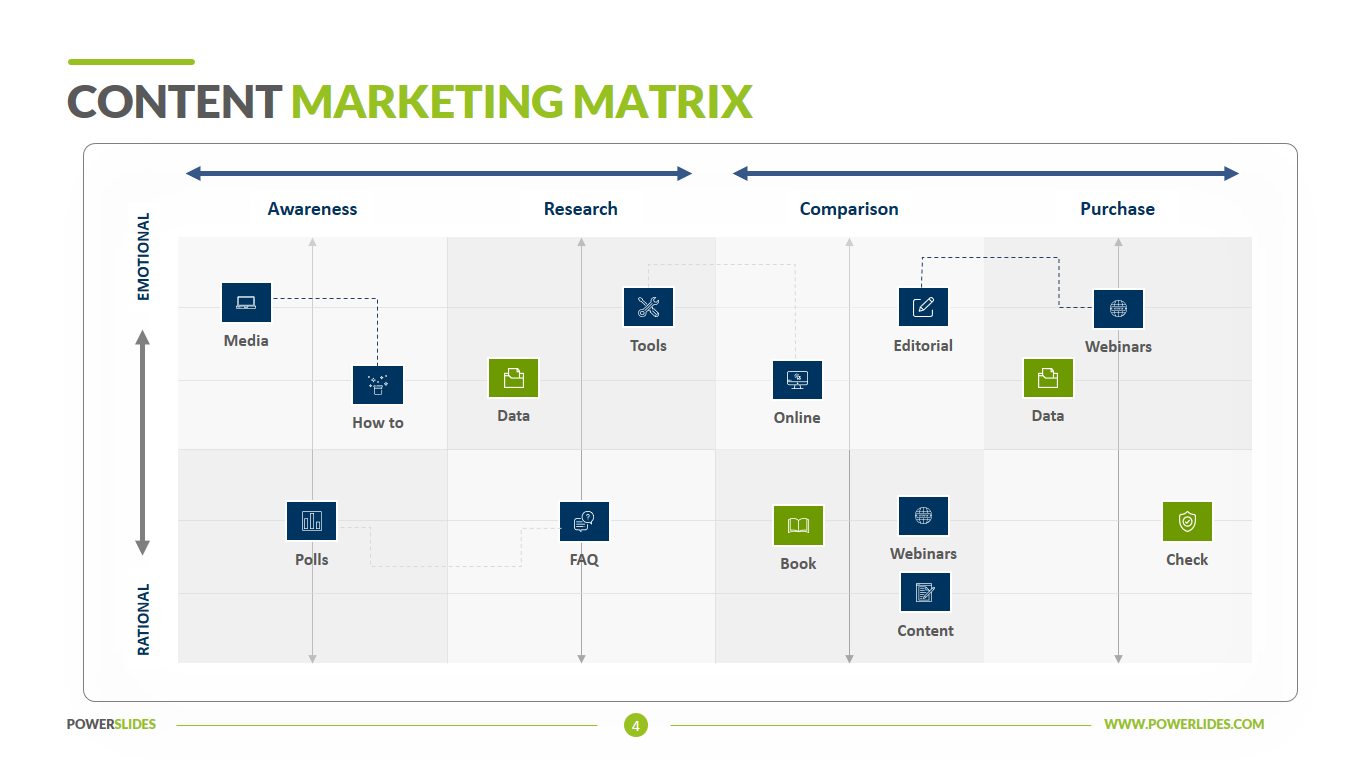
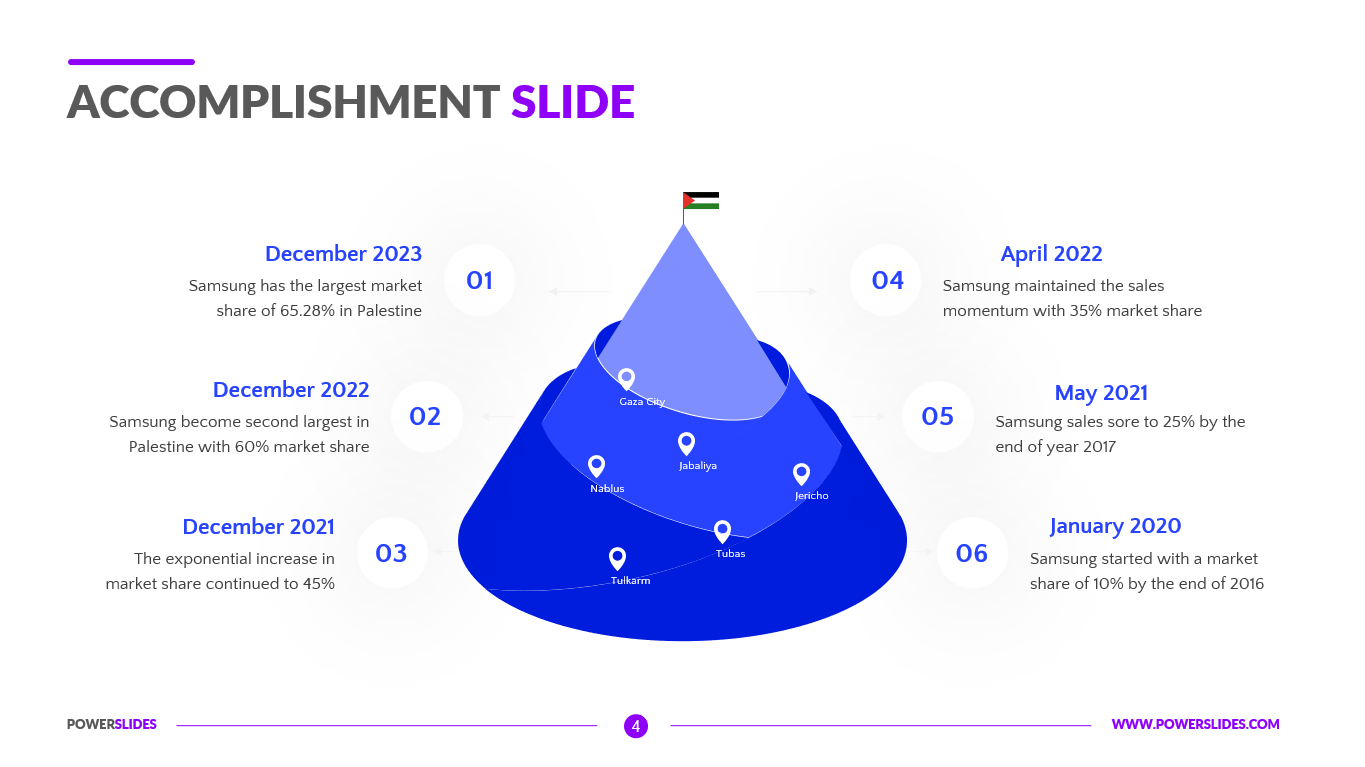
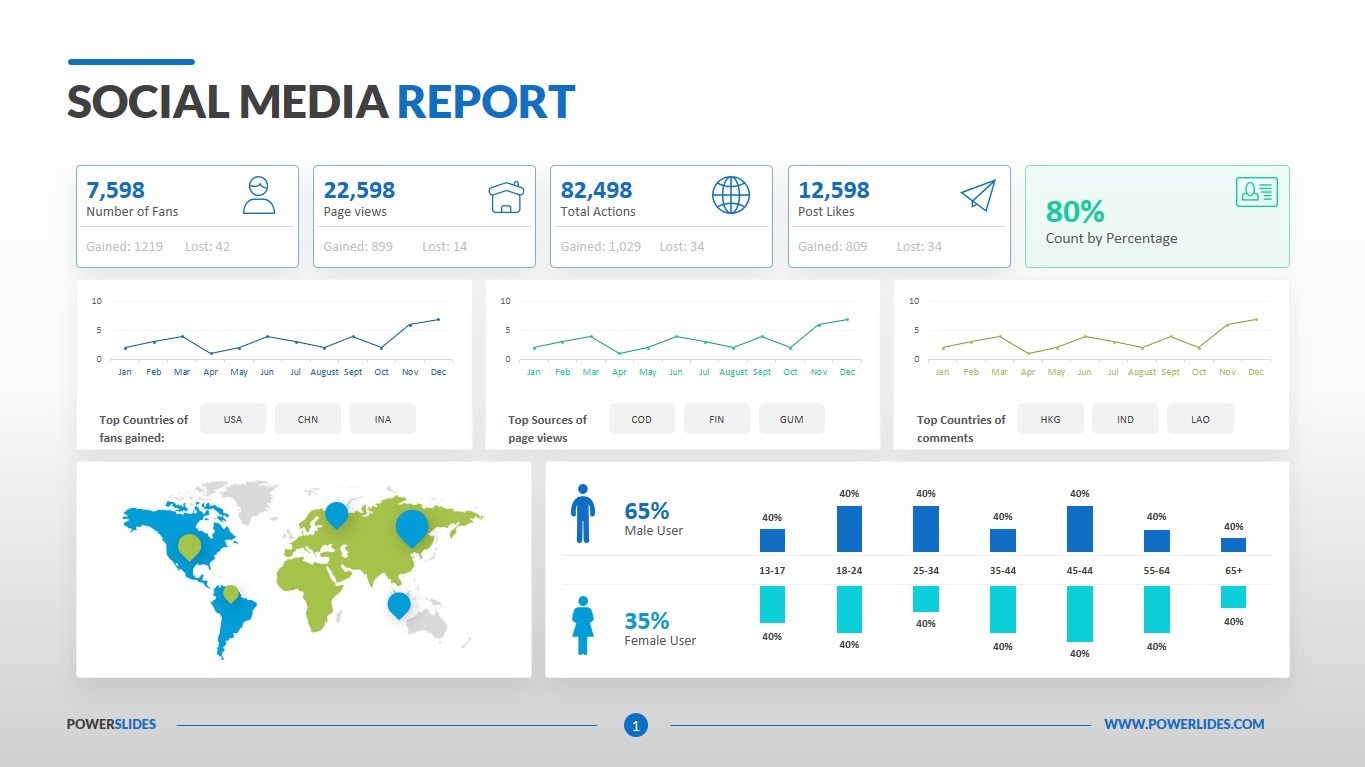
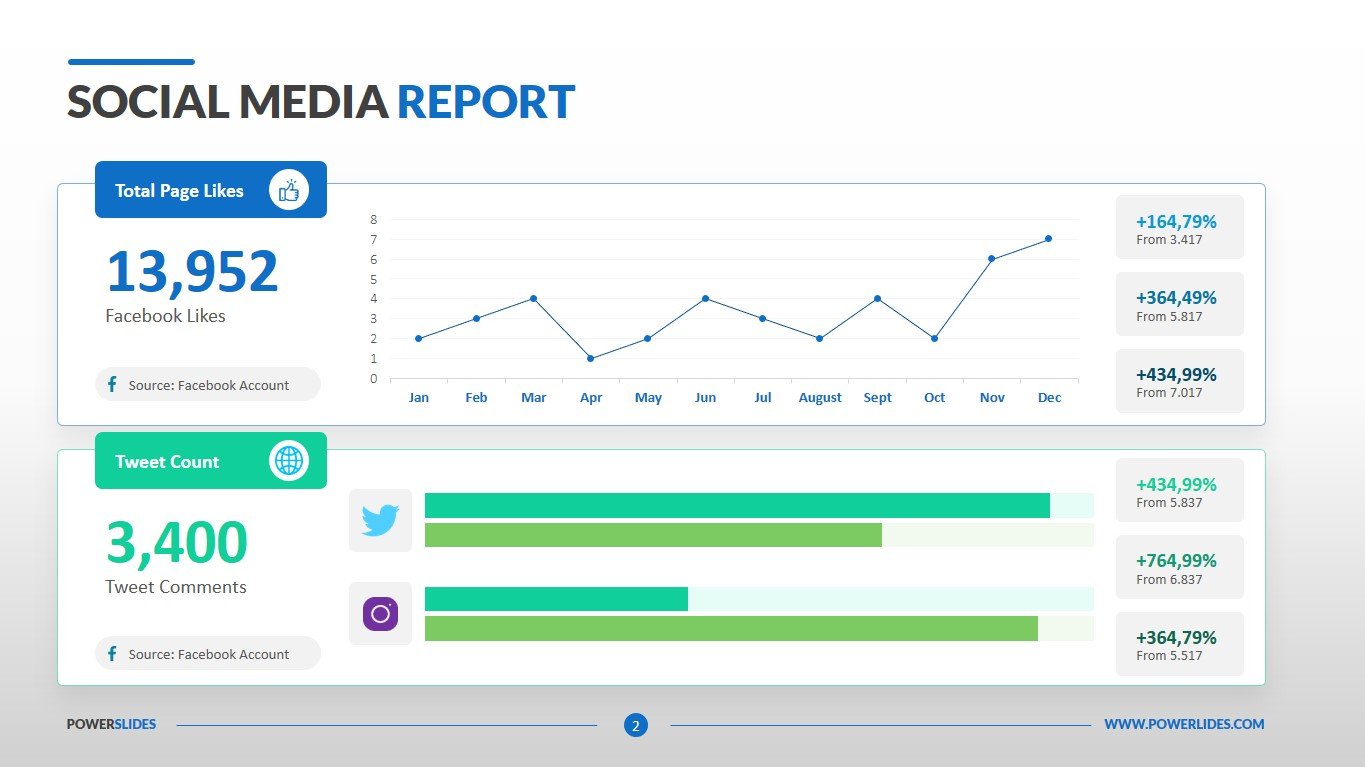
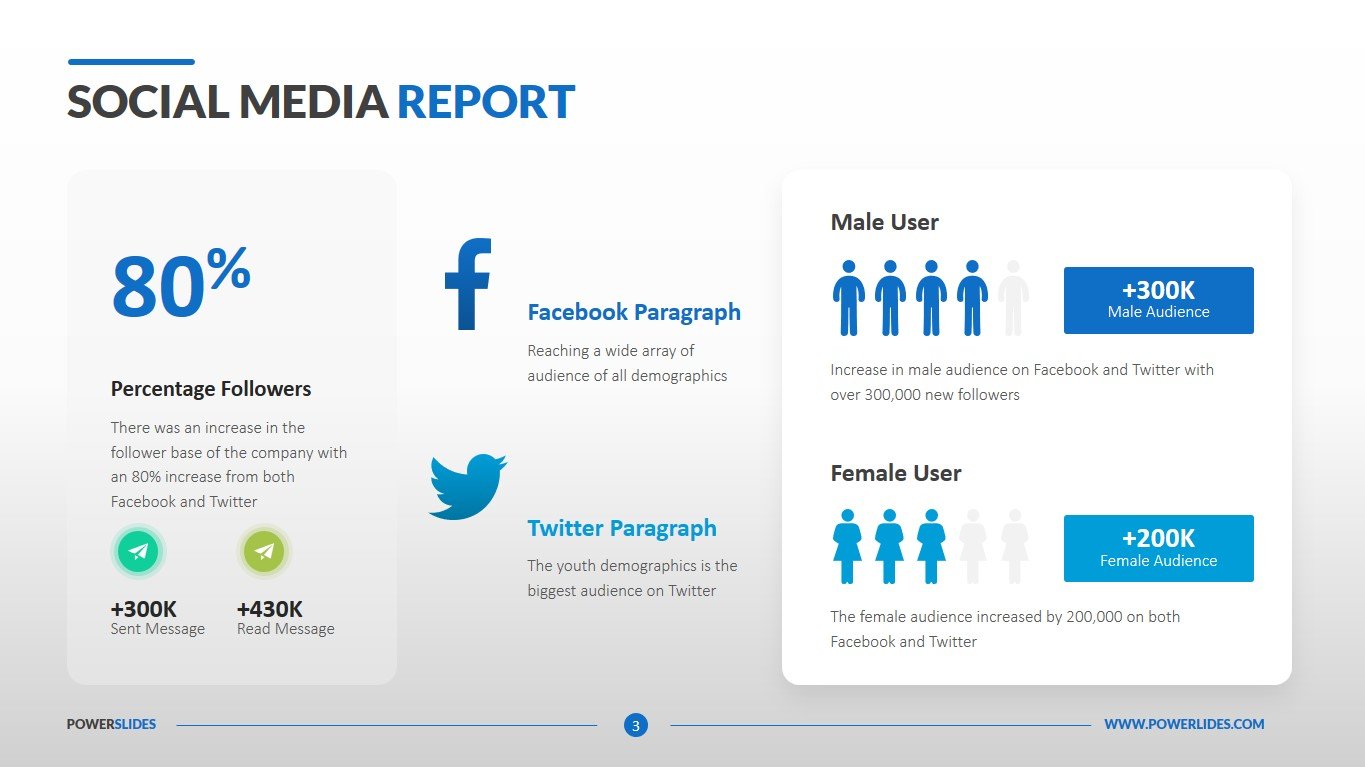
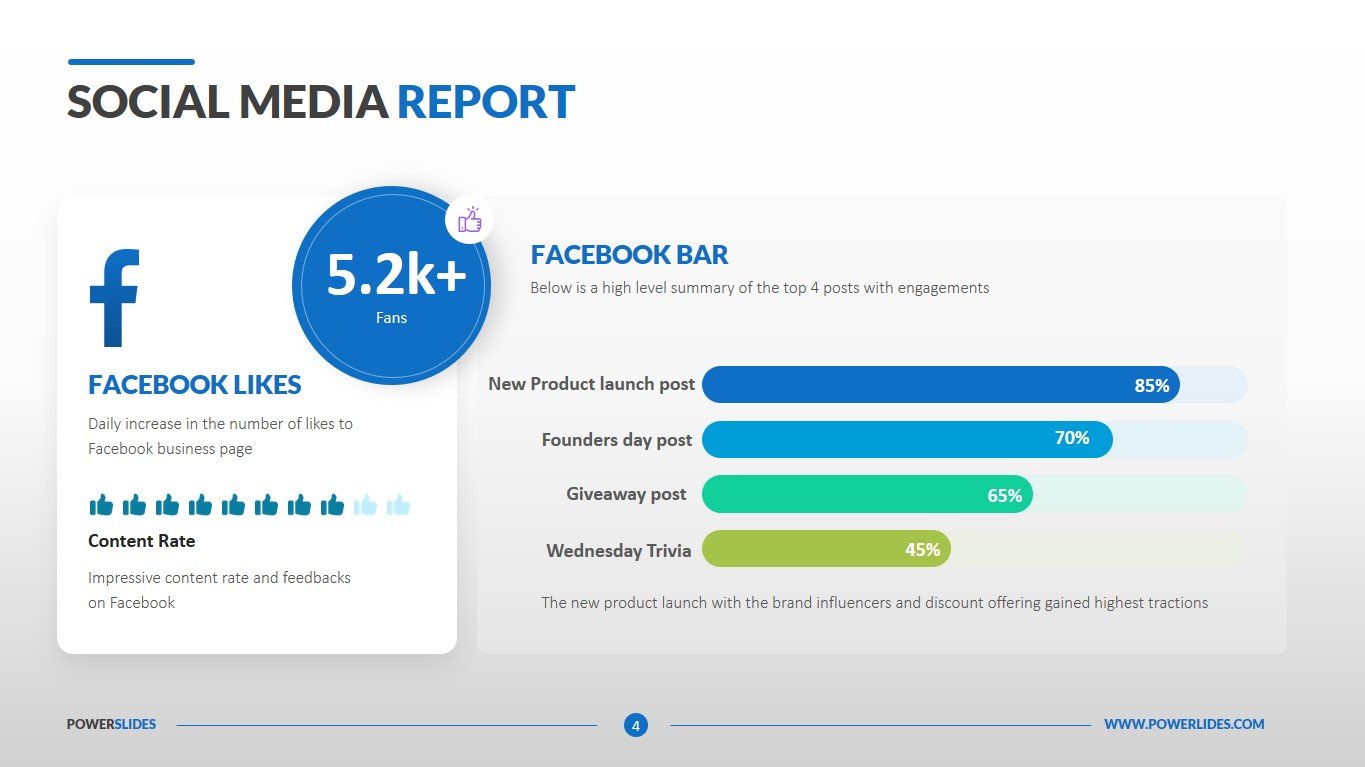
Social Media Report template consists of four slides. The first slide gives you the ability to display all the possible metrics for your report. For example, you can specify the number of subscribers, the number of views, the number of likes. You can display subscriber charts by region. You can also provide an analysis of the gender groups of subscribers, breaking it down by age group. The next slide gives you the opportunity to add your analytics across multiple social channels. You can include information about your Facebook, Tweeter or Instagram followers. The slides of this template will be useful to all social content professionals, marketers, and ad agencies. Also, startups and investment companies can use this template when analyzing the presence of their products on social networks.


