Sprint Burndown Chart
What do you think of this template?

 (4.20/ 5)
21 ratings

 4 Slides
 File size: 16:9
 Fonts: Lato, Calibri
 Supported version
PPT 2010, PPT 2013, PPT 2016
Supported version
PPT 2010, PPT 2013, PPT 2016

Product details
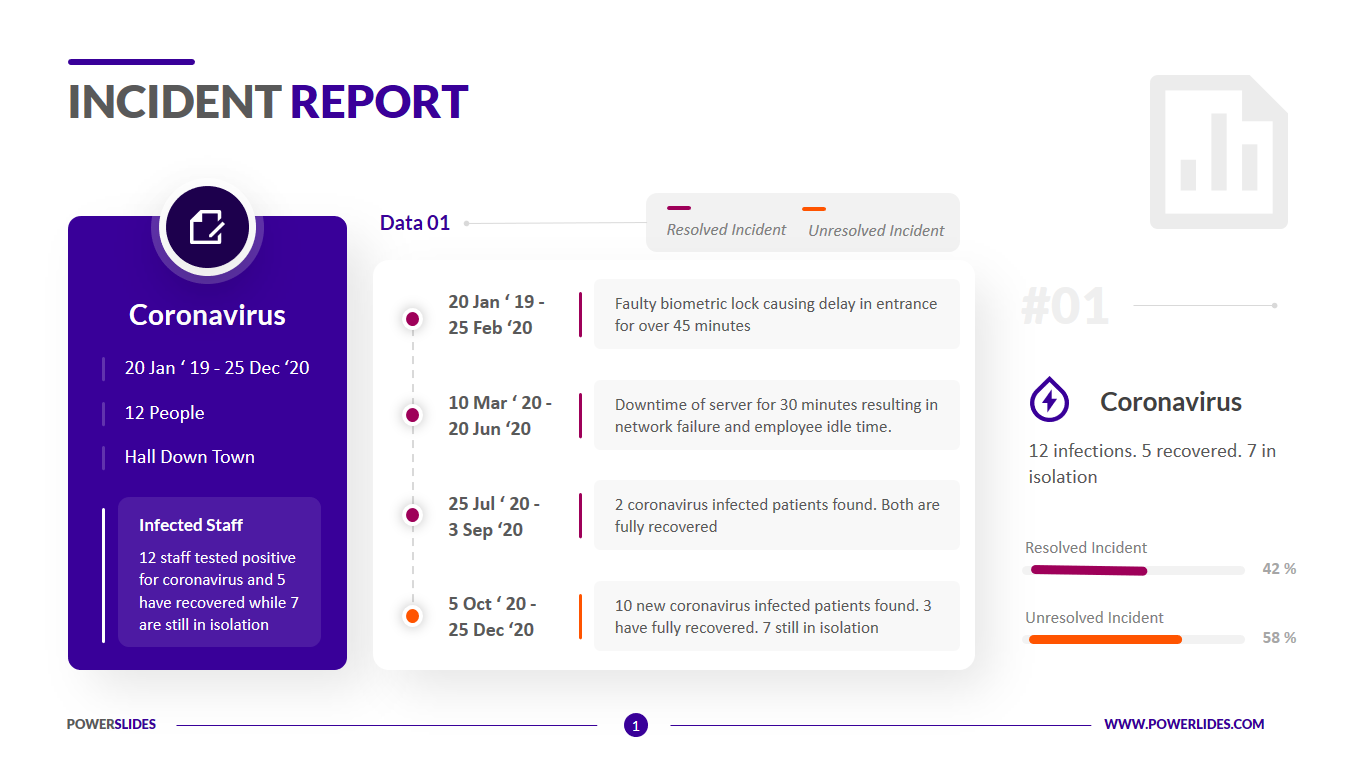
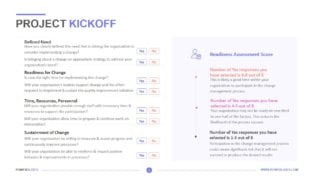
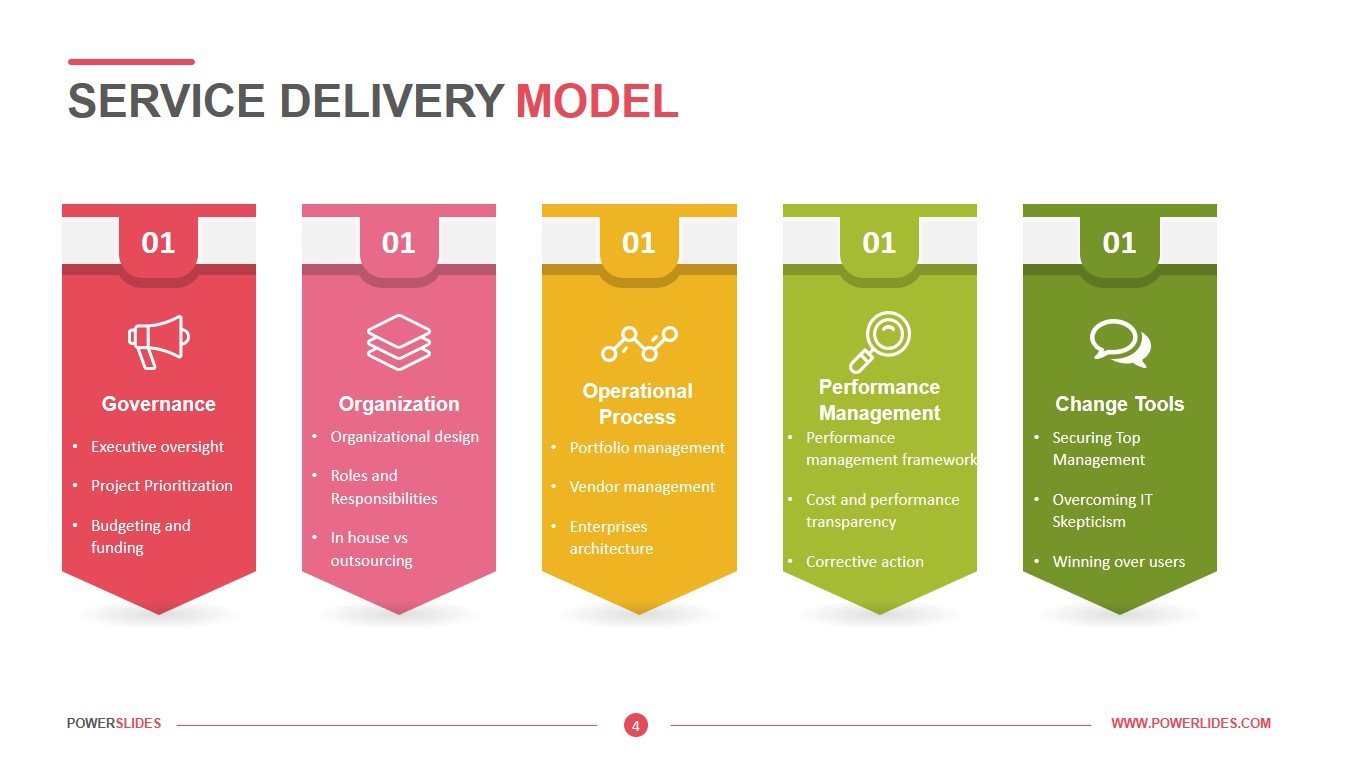
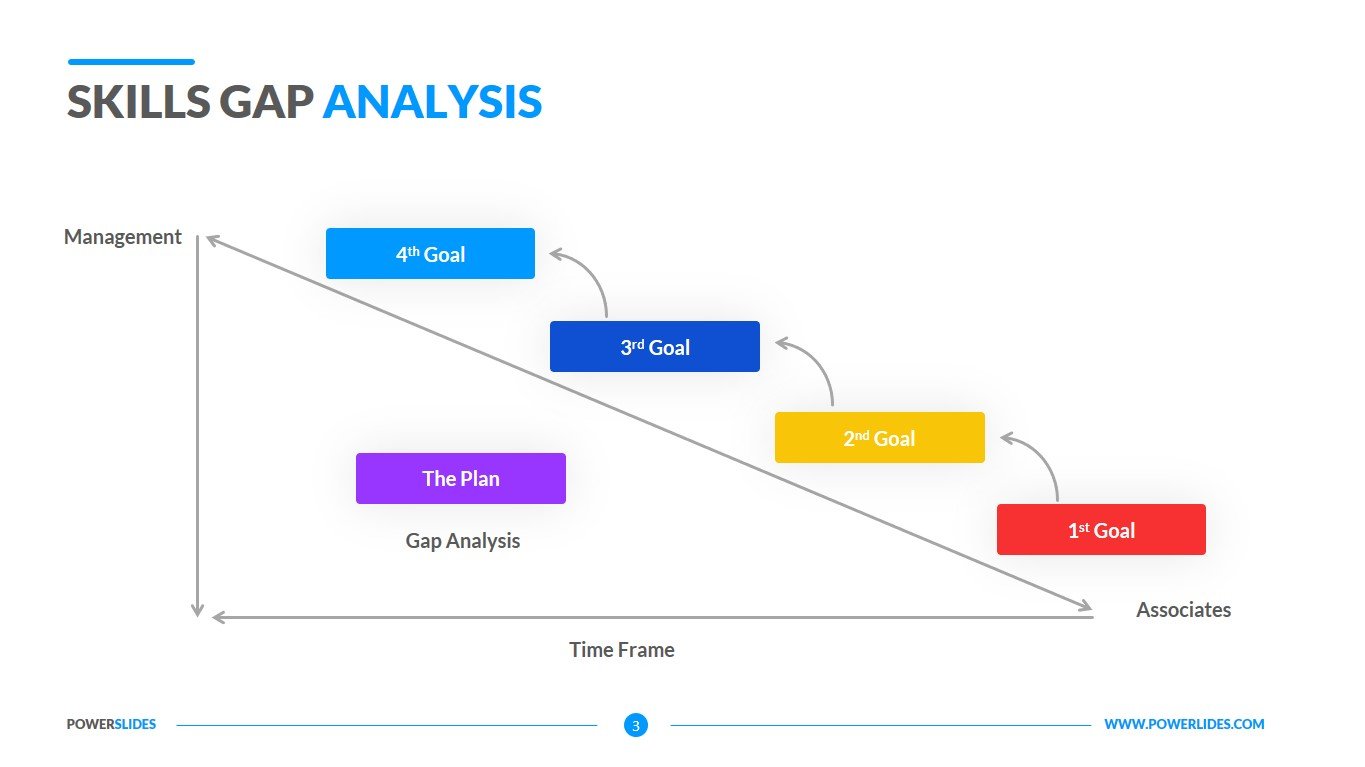
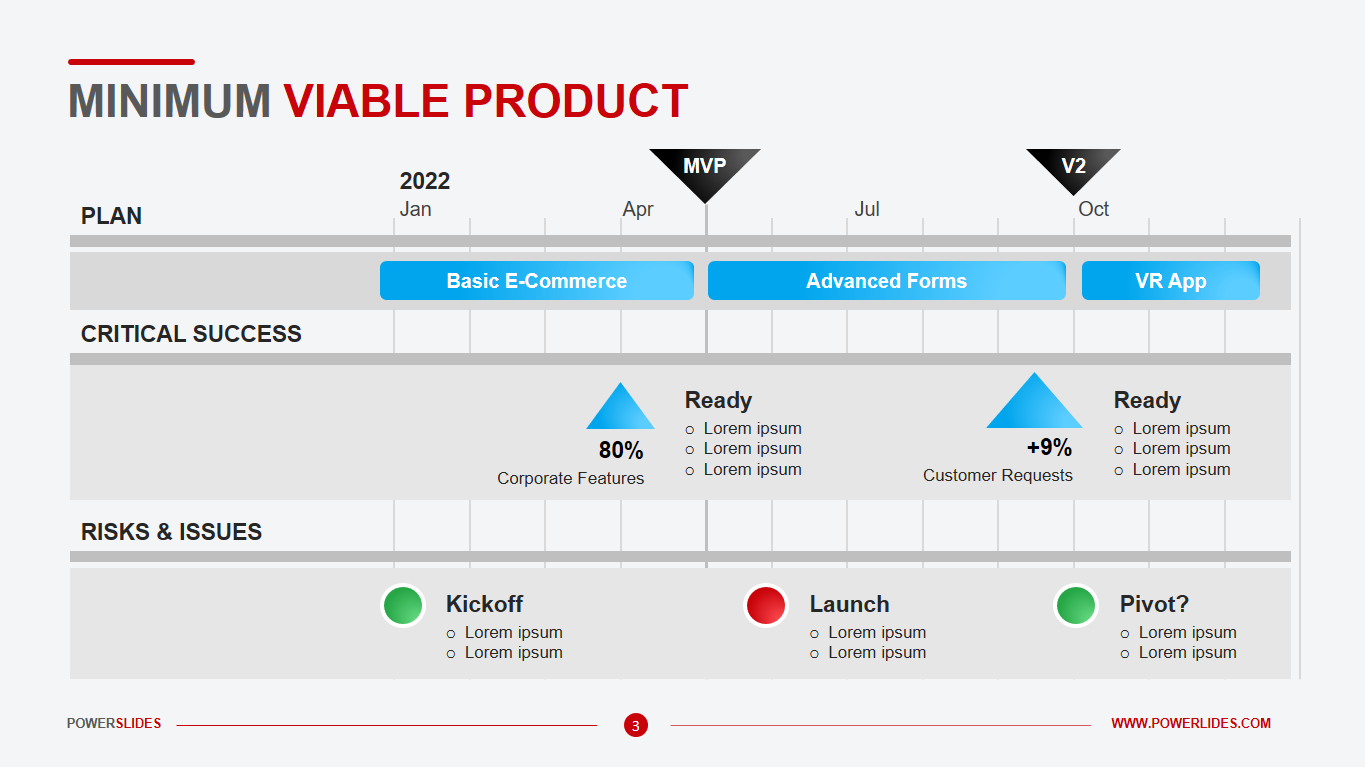
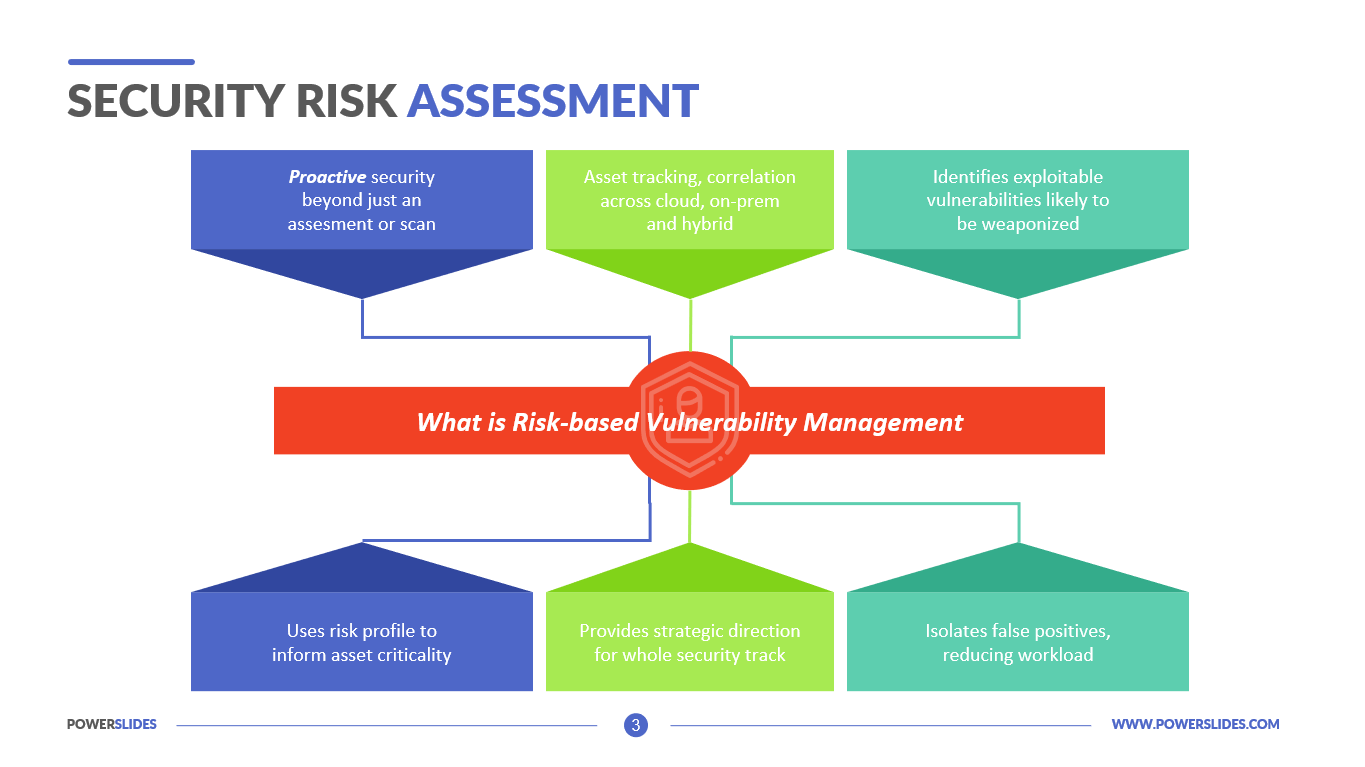
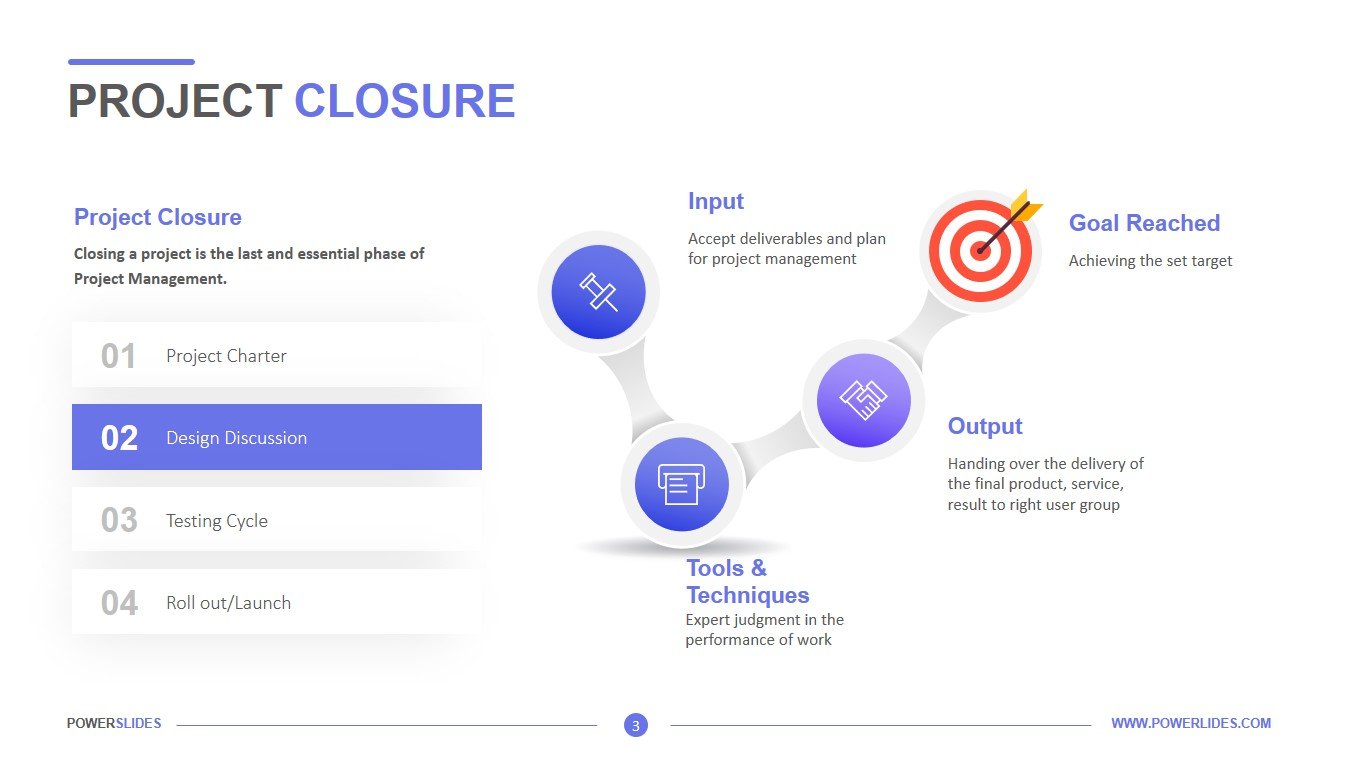
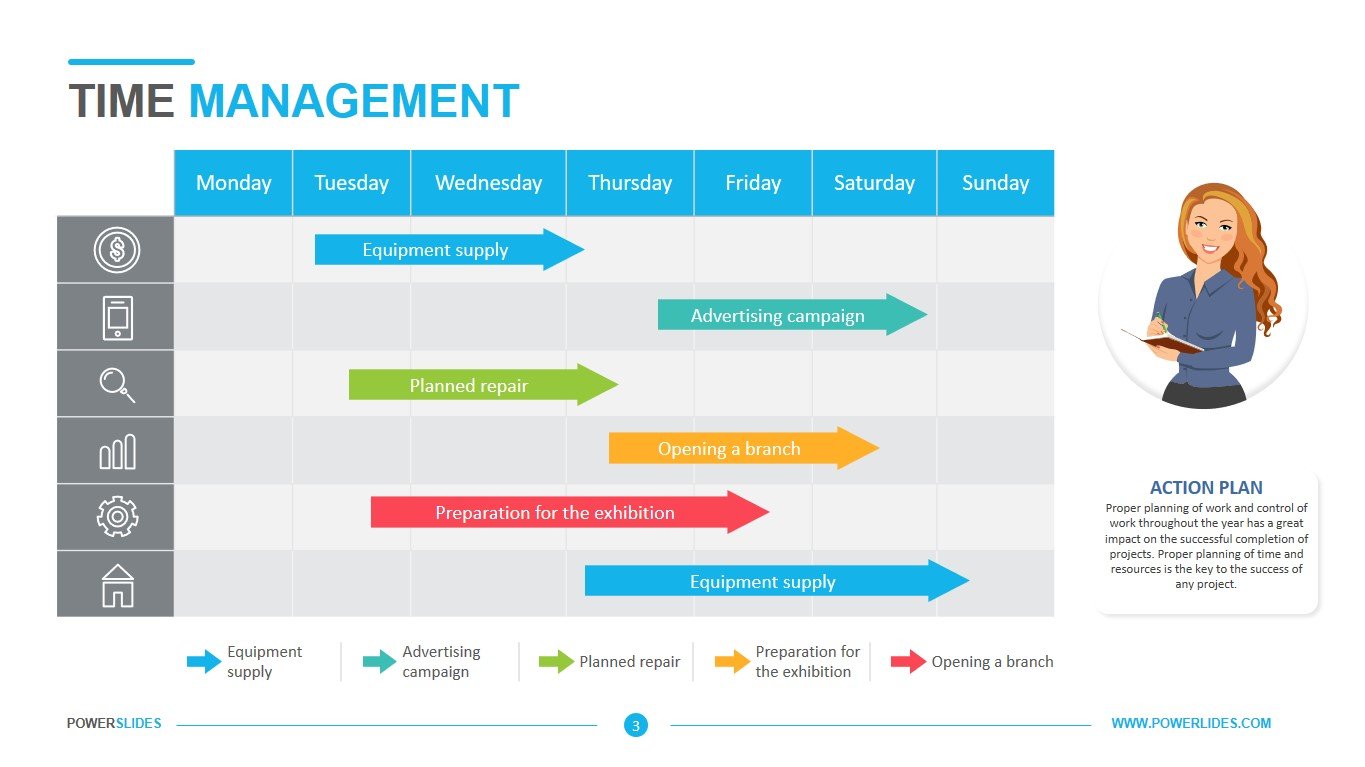
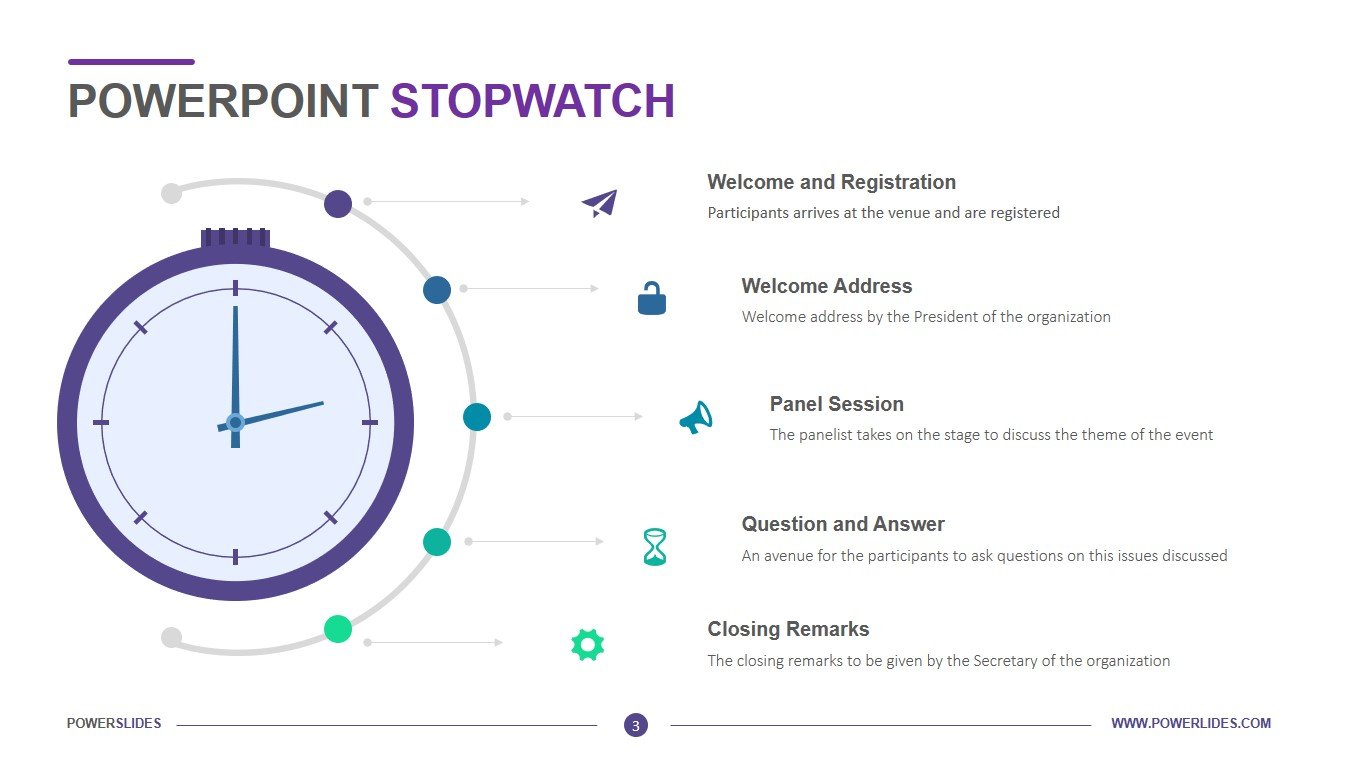
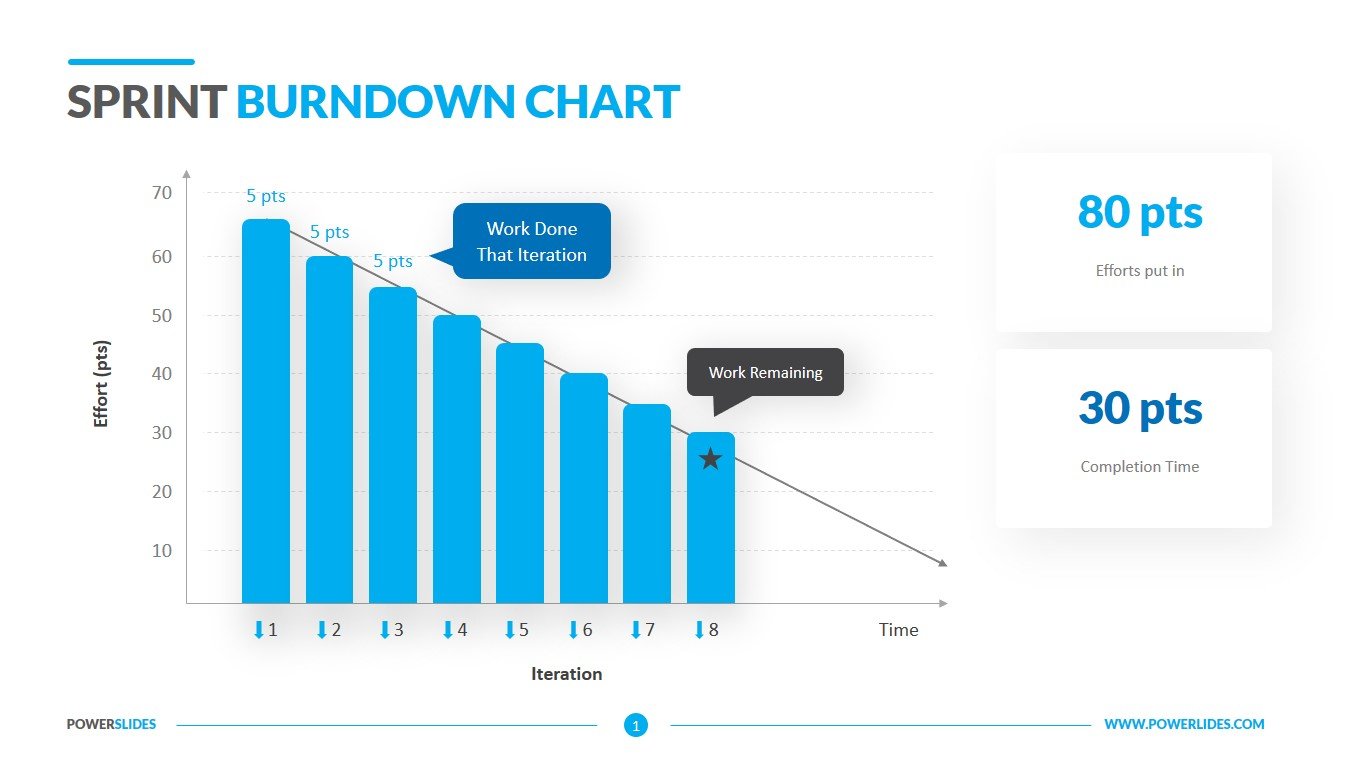
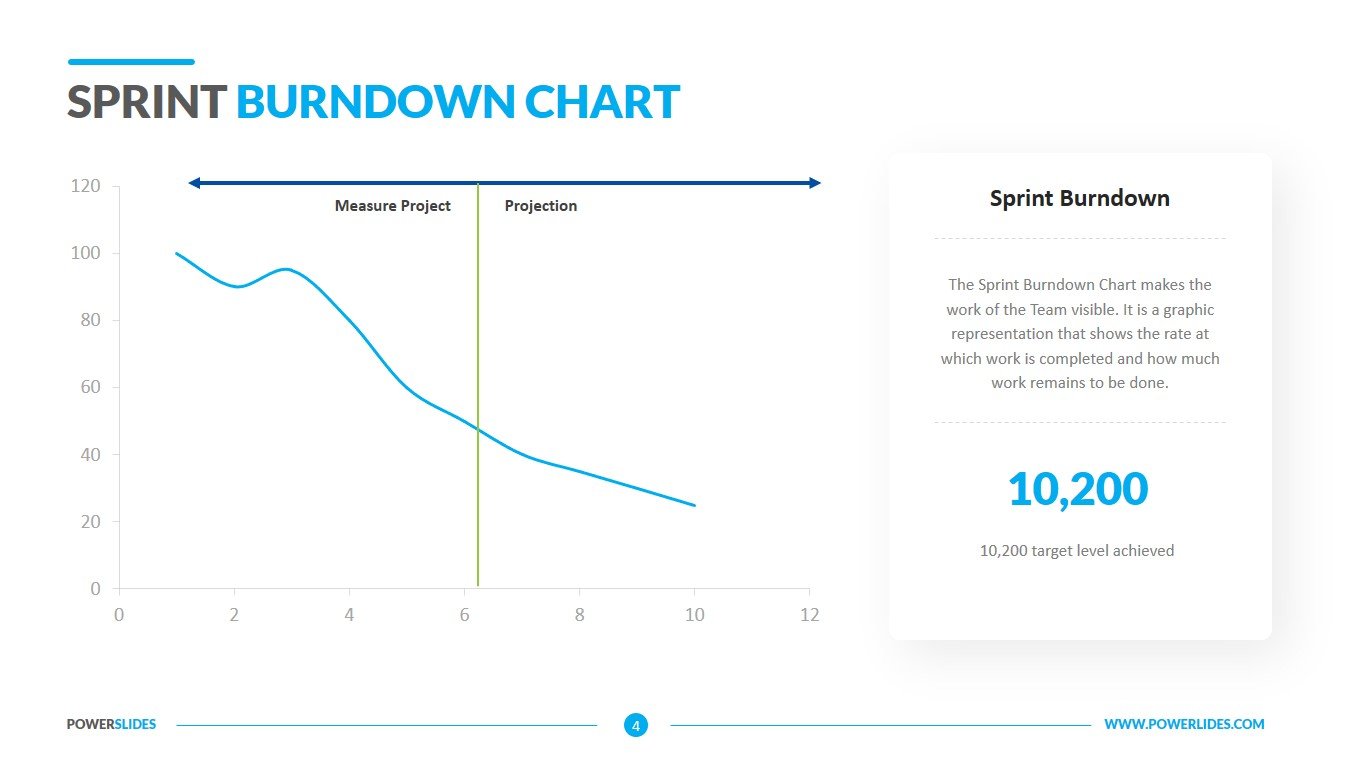
For the most part, we are used to charts going up, which means positive dynamics. However, they can go down and also show positive dynamics. Burndown Chart is one such striking example. This graph is the main tool for tracking completed tasks in a sprint or throughout a project. Sprint Burndown Chart usually consists of two charts. The first graph shows how the process should go, the second graph how it actually happens. If you learn to read these charts correctly, you can make timely decisions. For example, if the actual project execution schedule is shifted to the left of the planned schedule, then the team completes the project faster than planned. If the actual schedule is shifted to the right relative to the planned schedule, then the team will not have time to complete the project on time. Action must be taken immediately. For example, to strengthen the team by adding a few more people to the development team. At the start of the project, the actual schedule was shifted to the left, but at the end of the project, the offset to the left was less. This suggests that the team initially worked in full force, and then decided not to rush to finish the project. All project managers should be fluent in this tool.
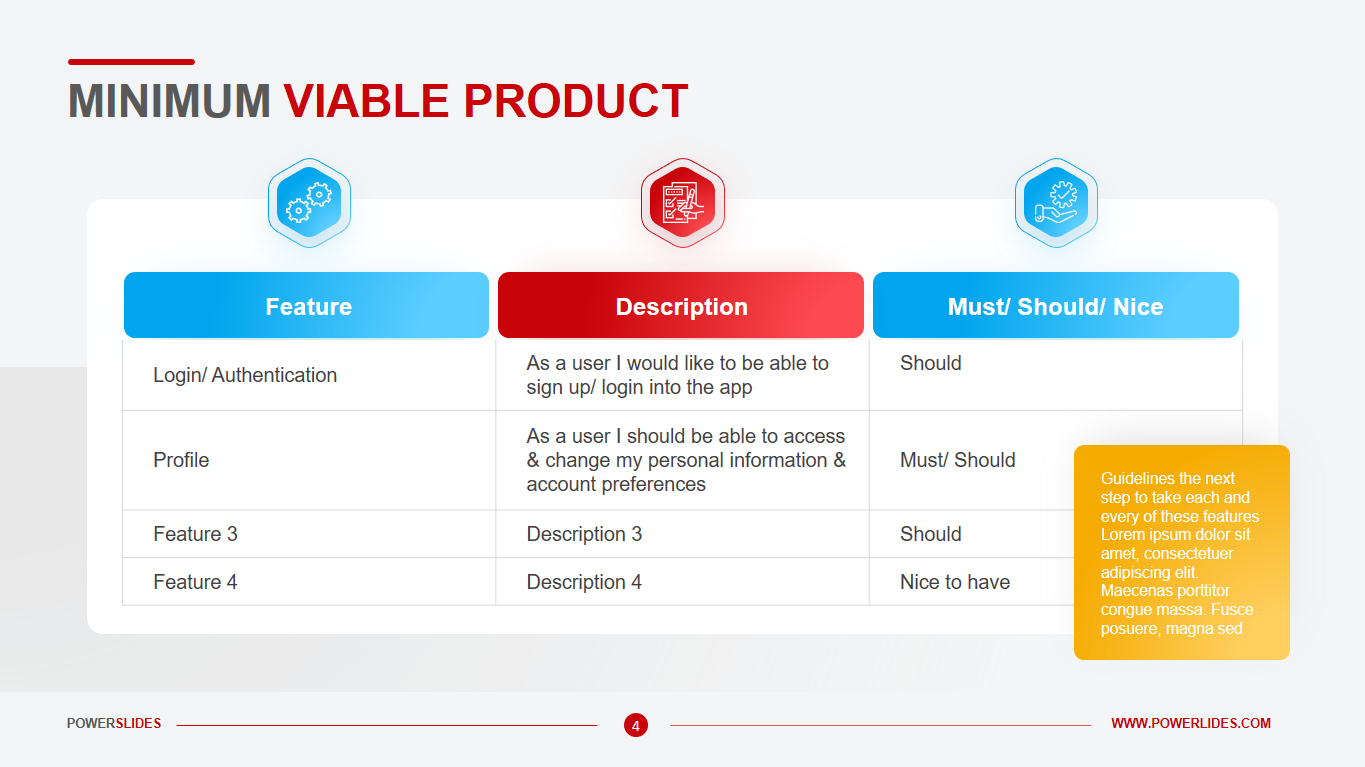
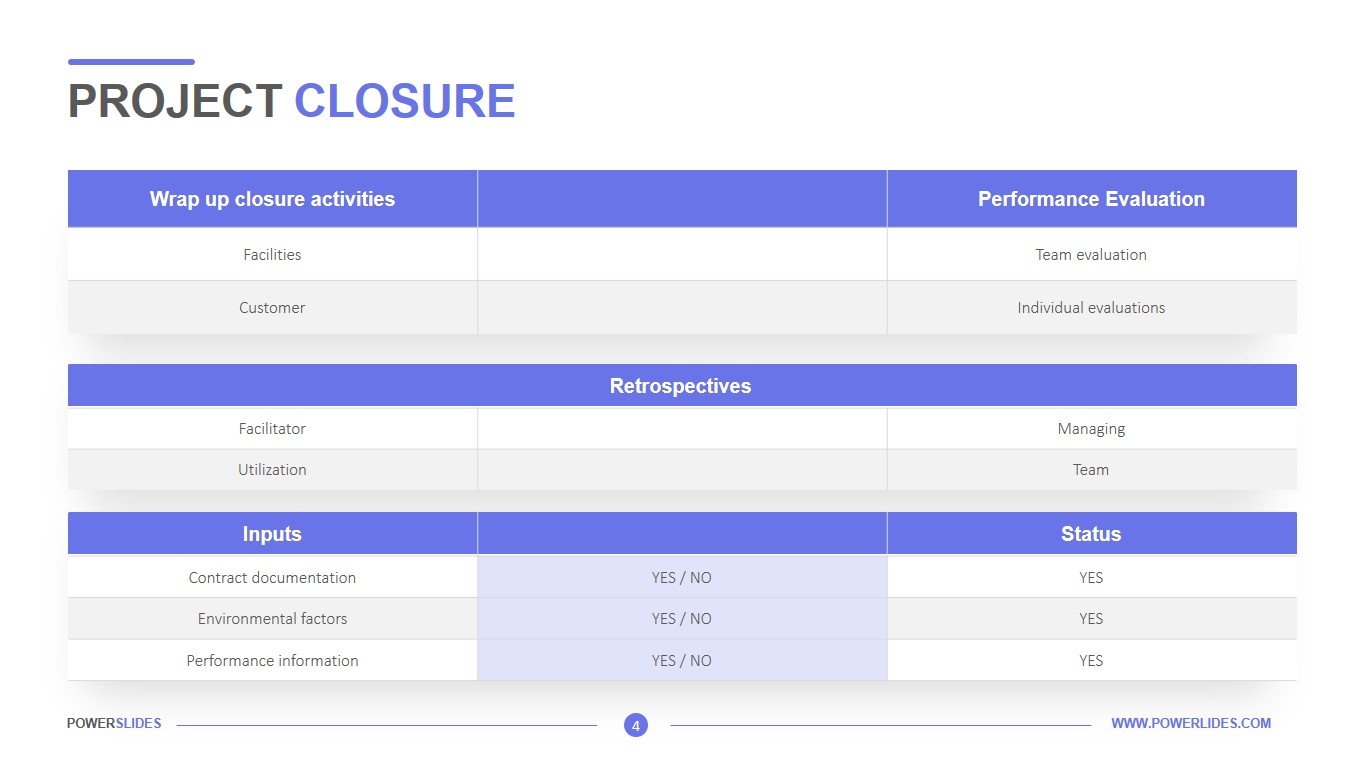
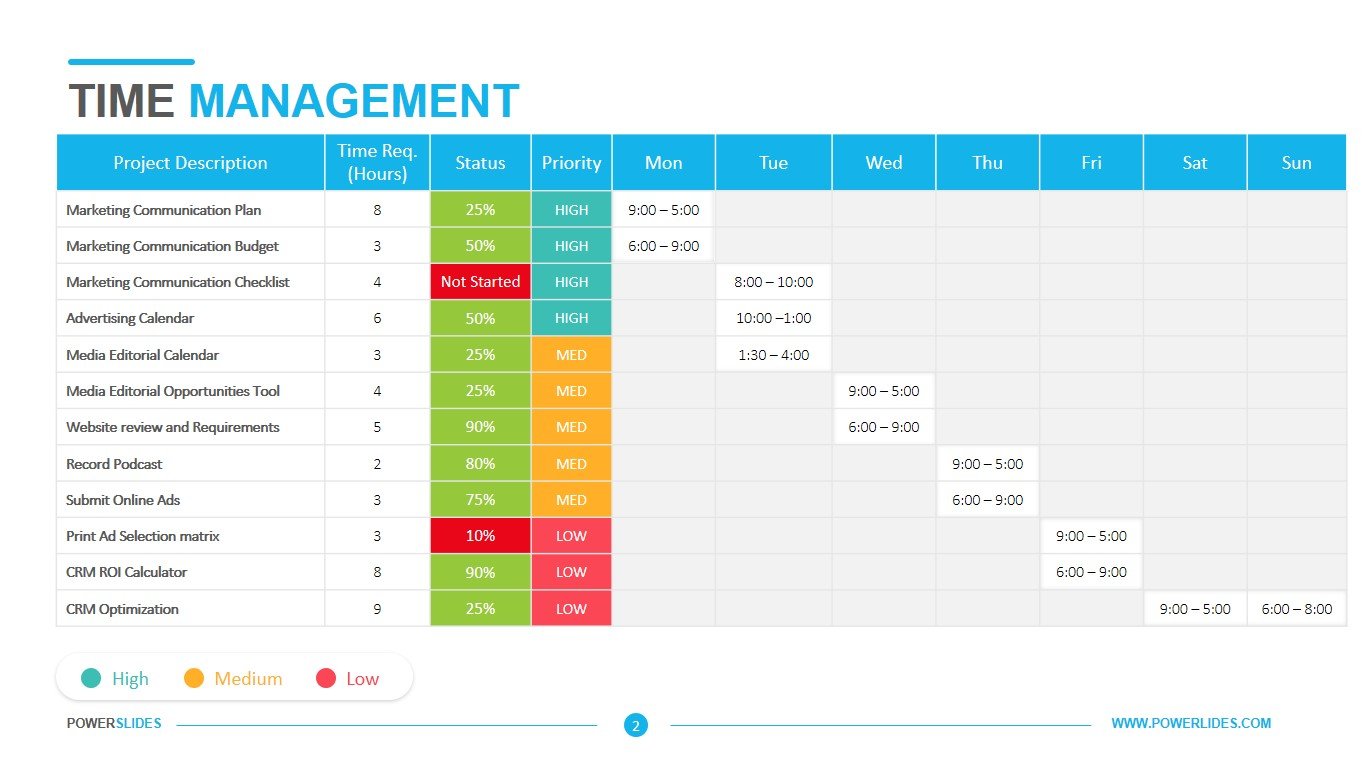
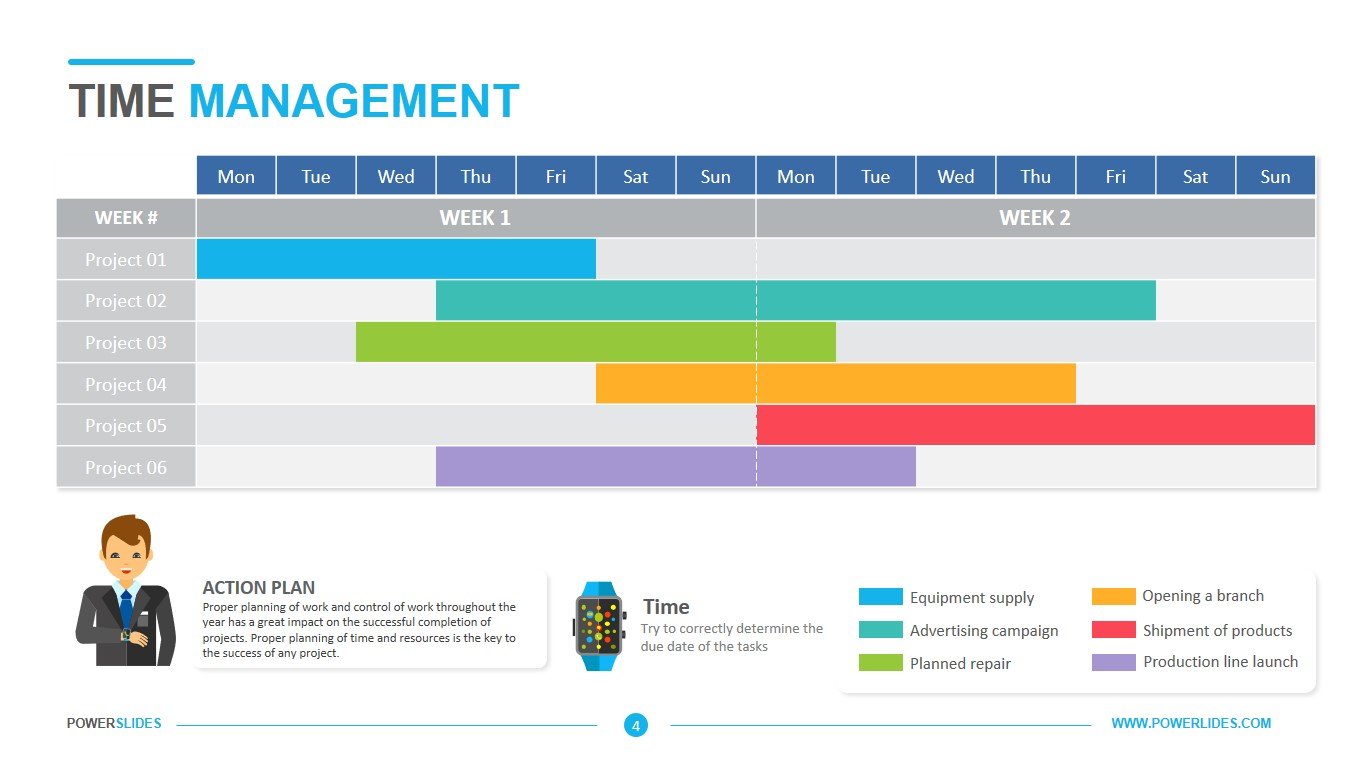
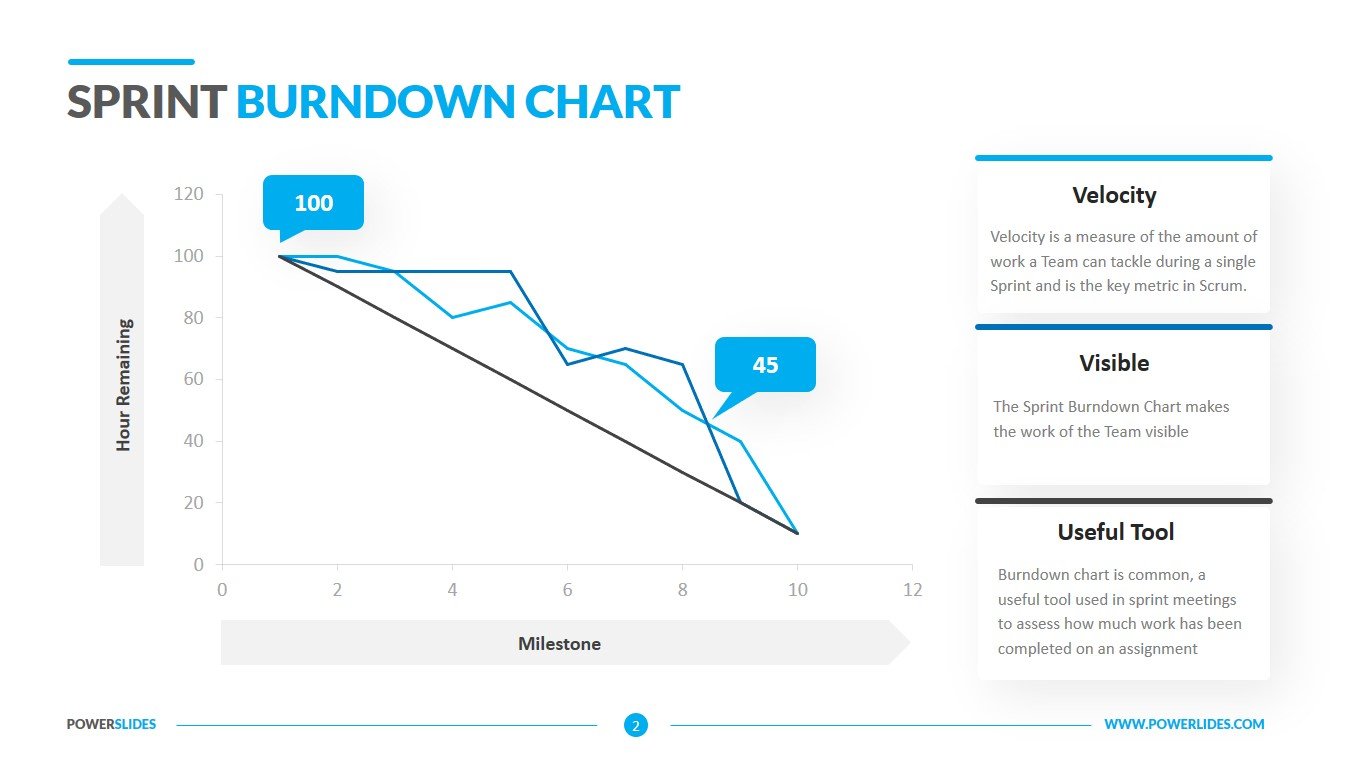
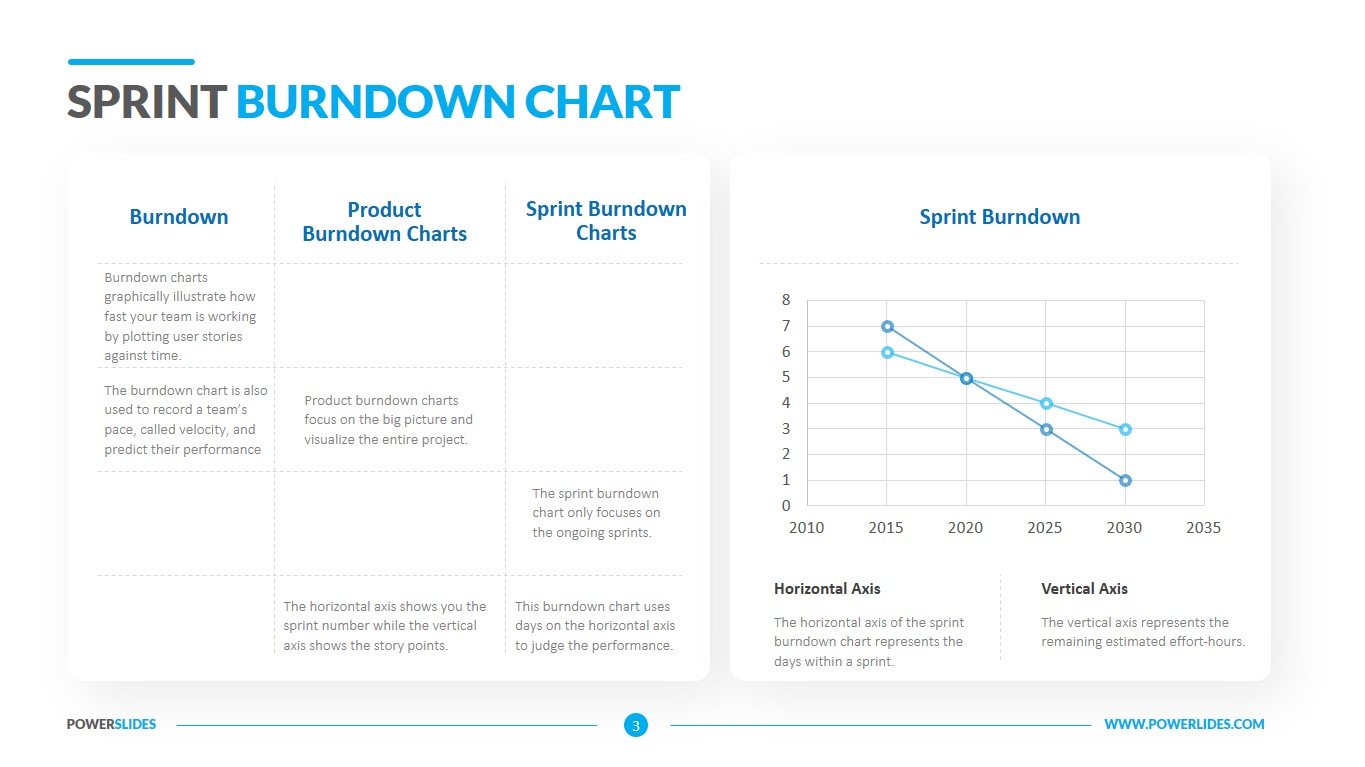
Sprint Burndown Chart helps you stay on top of how your projects are going. The first slide shows the dynamics of the project and compares it with the planned indicators. The required amount of time is indicated here and how much time is left. This slide will help the development team understand how their project is progressing. The second slide additionally shows the number of tasks that have been completed. This template will also be useful for construction companies. You can always see the overall progress of the project. If necessary, you can make several charts for smaller tasks. The next slide shows the general progress of the project and additionally has a table on its left side. In this table, you can indicate the tasks that have already been completed, which are in progress and the remaining tasks. This slide will help the scrum master run the weekly sprints. The last slide shows how the project is progressing and how it is expected to be completed in the future. Based on the actual data on the implementation of the project, you build a further execution plan. This tool gives you the ability to quickly manage the project deadline.
If necessary, you can easily change the arrangement of graphs, text boxes, chart colors, and font sizes. The slides of this template can be used by you when building a business plan, launching a new product, tracking the educational process, controlling the supply of raw materials, building houses, conducting advertising campaigns. Sprint Burndown Chart is a great tool for preparing your project performance reports. The template provides you with all the modern tools for building a work plan and its further control.


