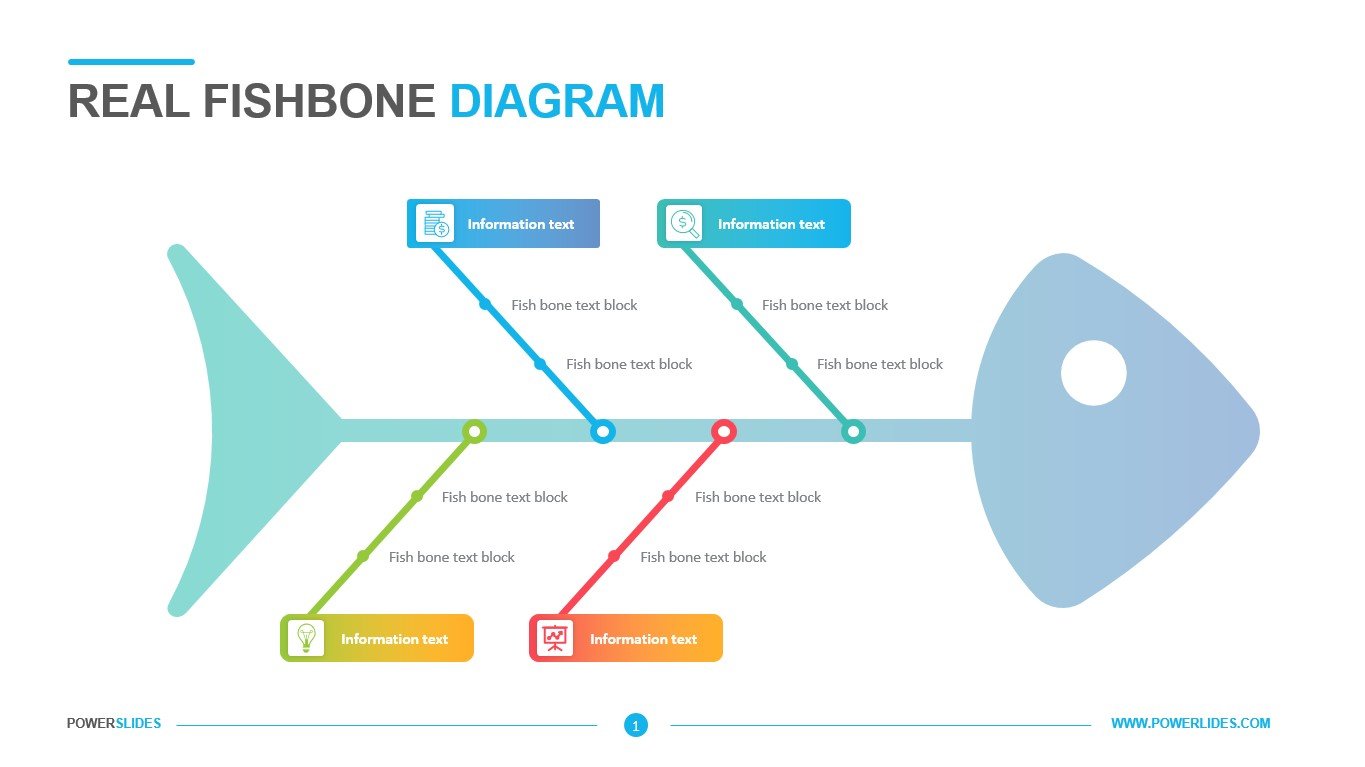
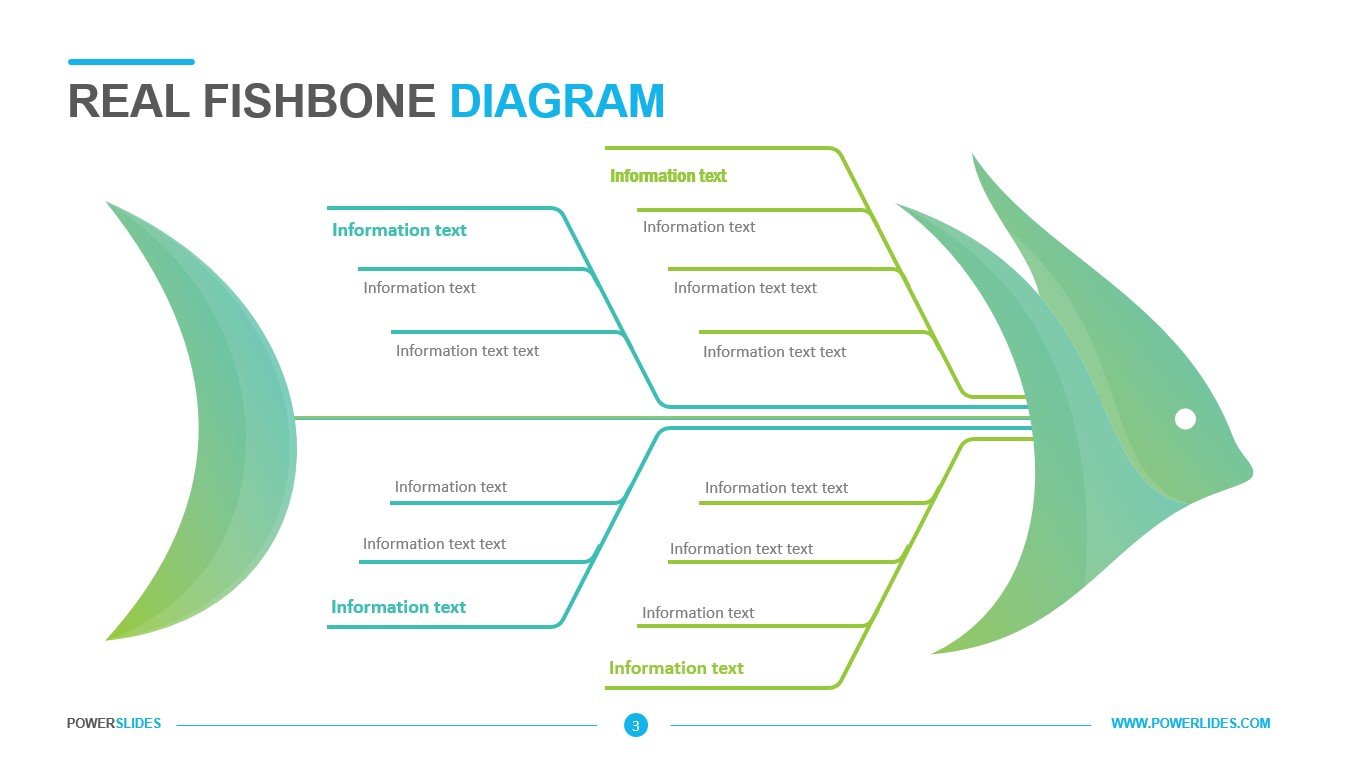
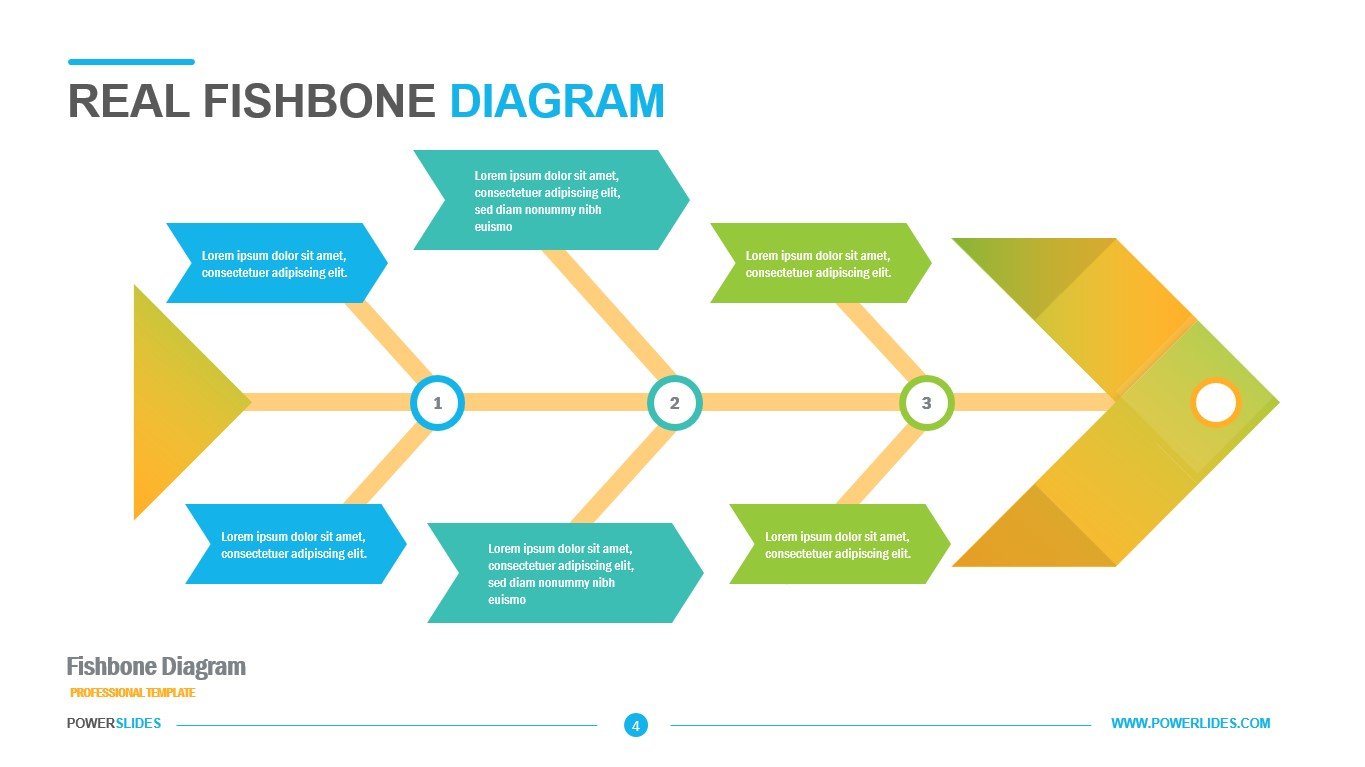
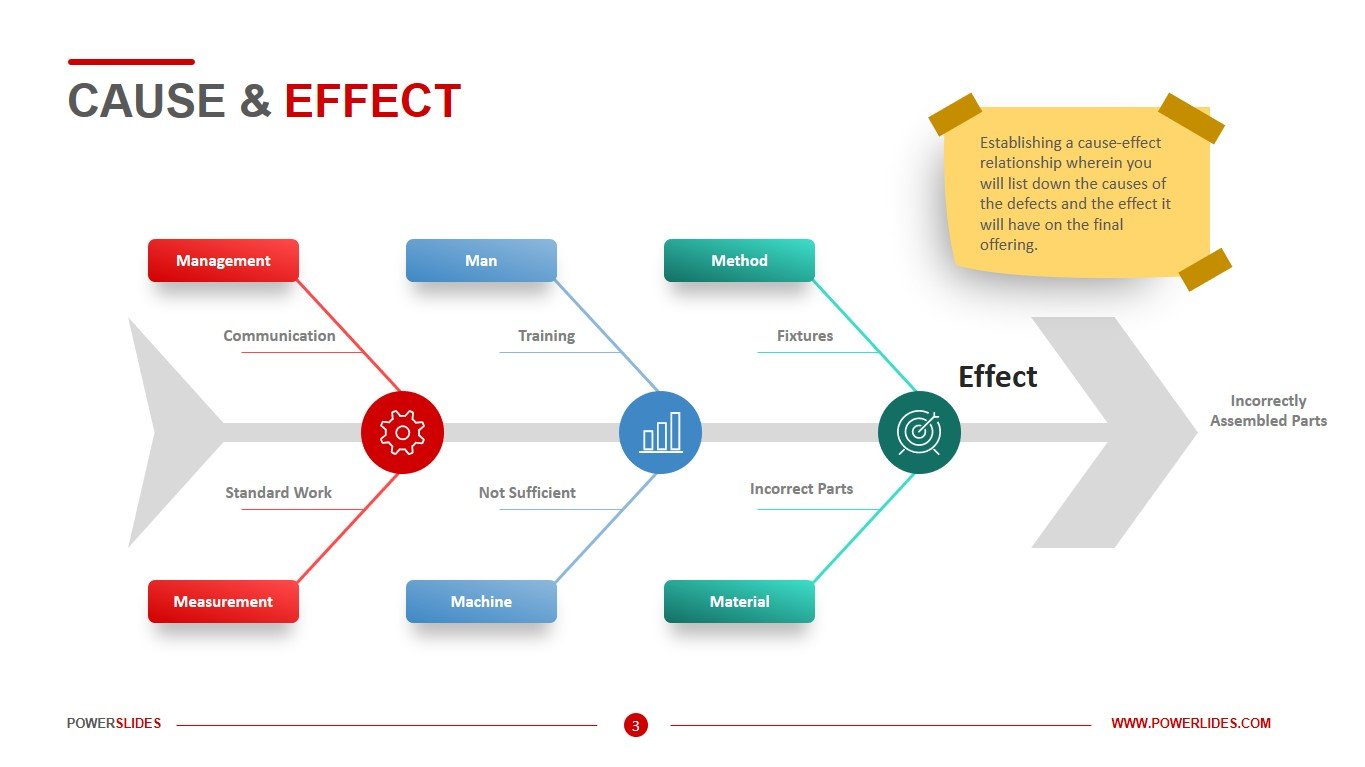
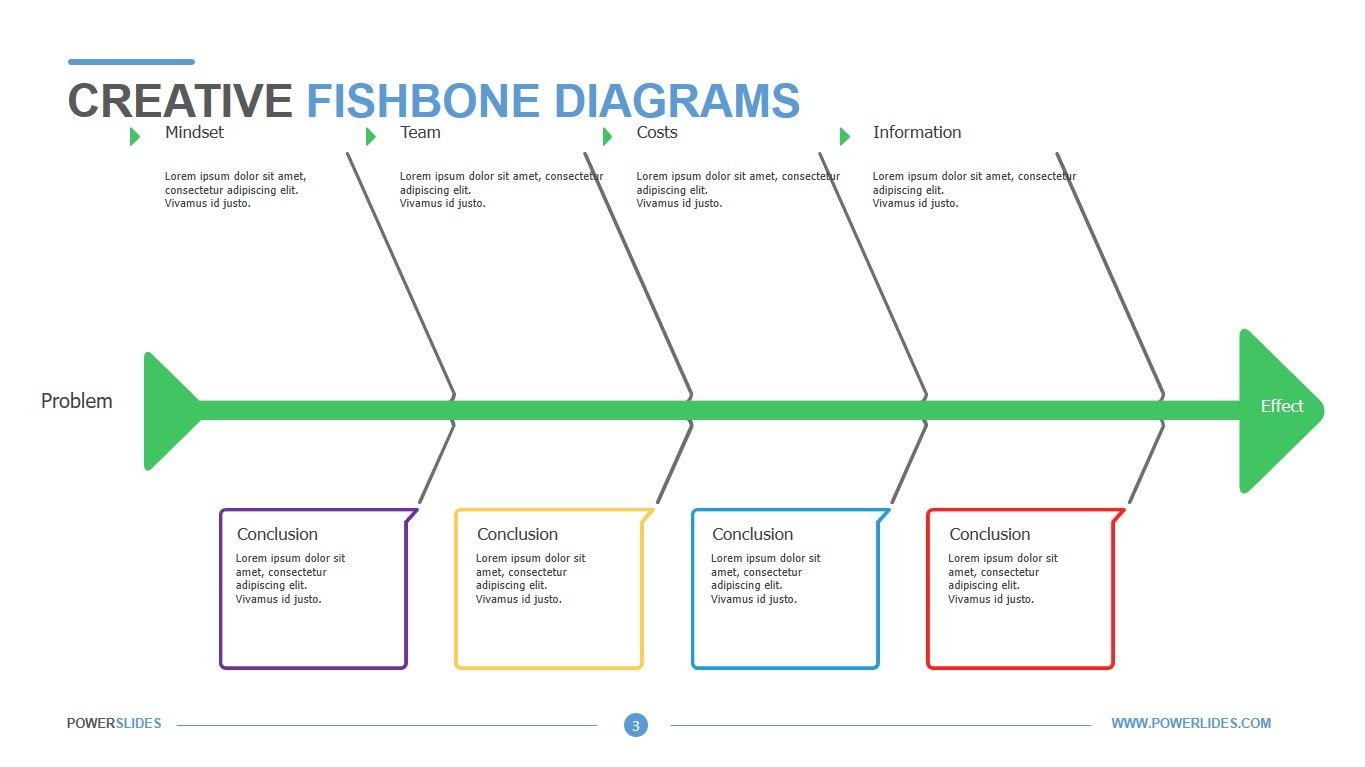
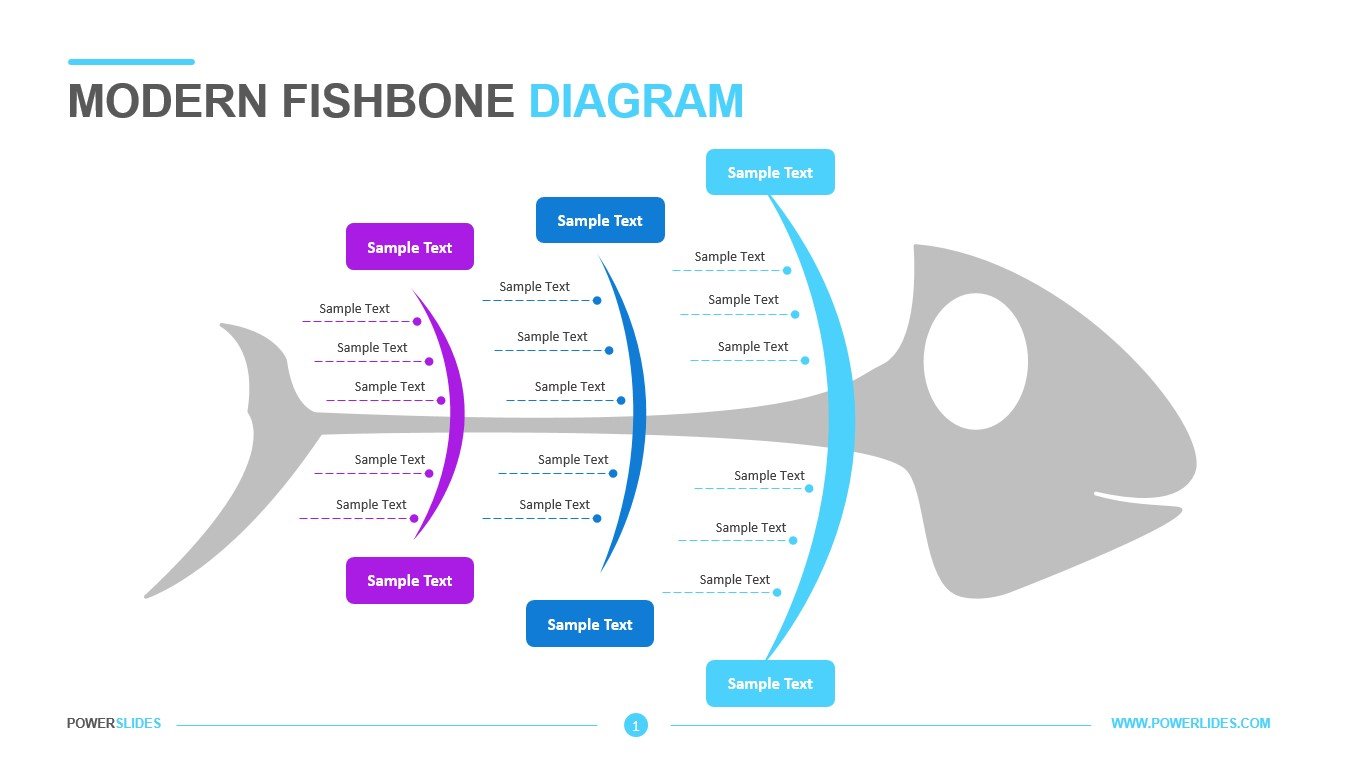
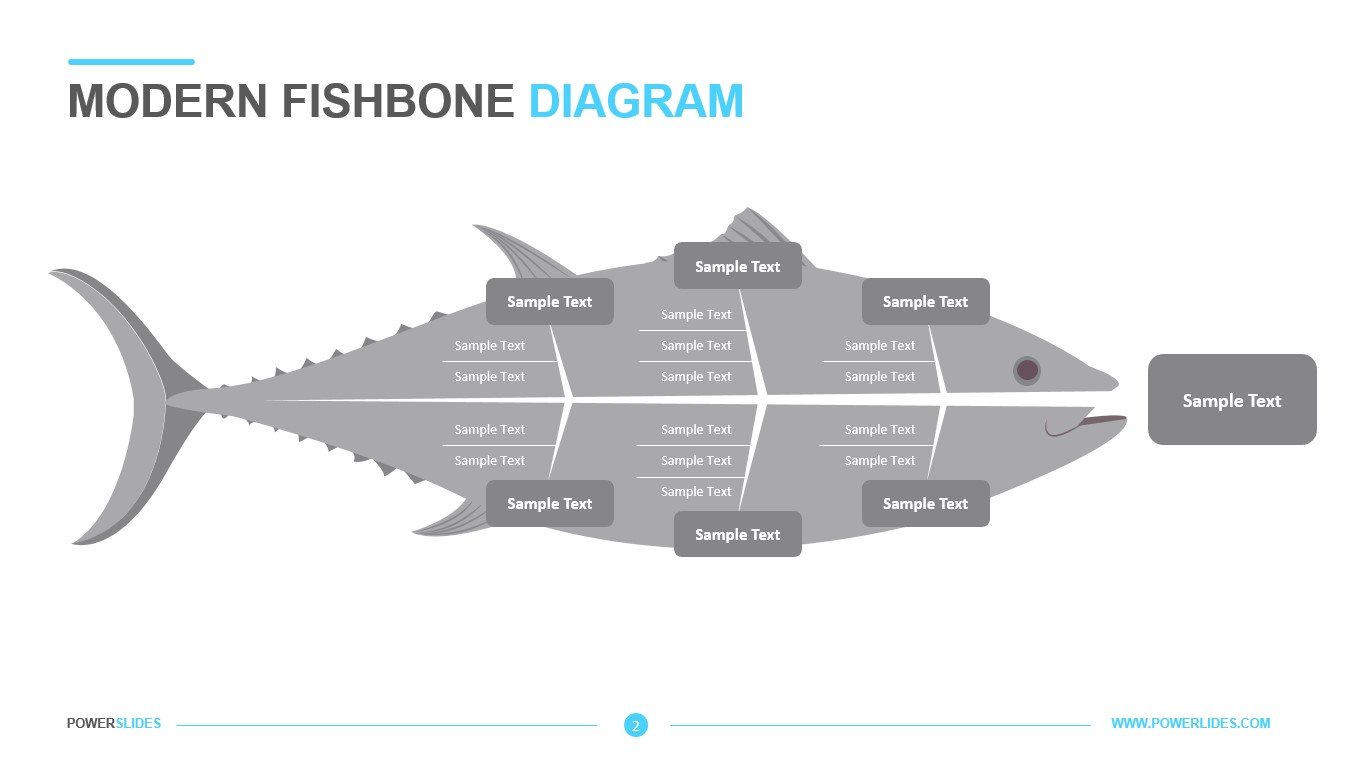
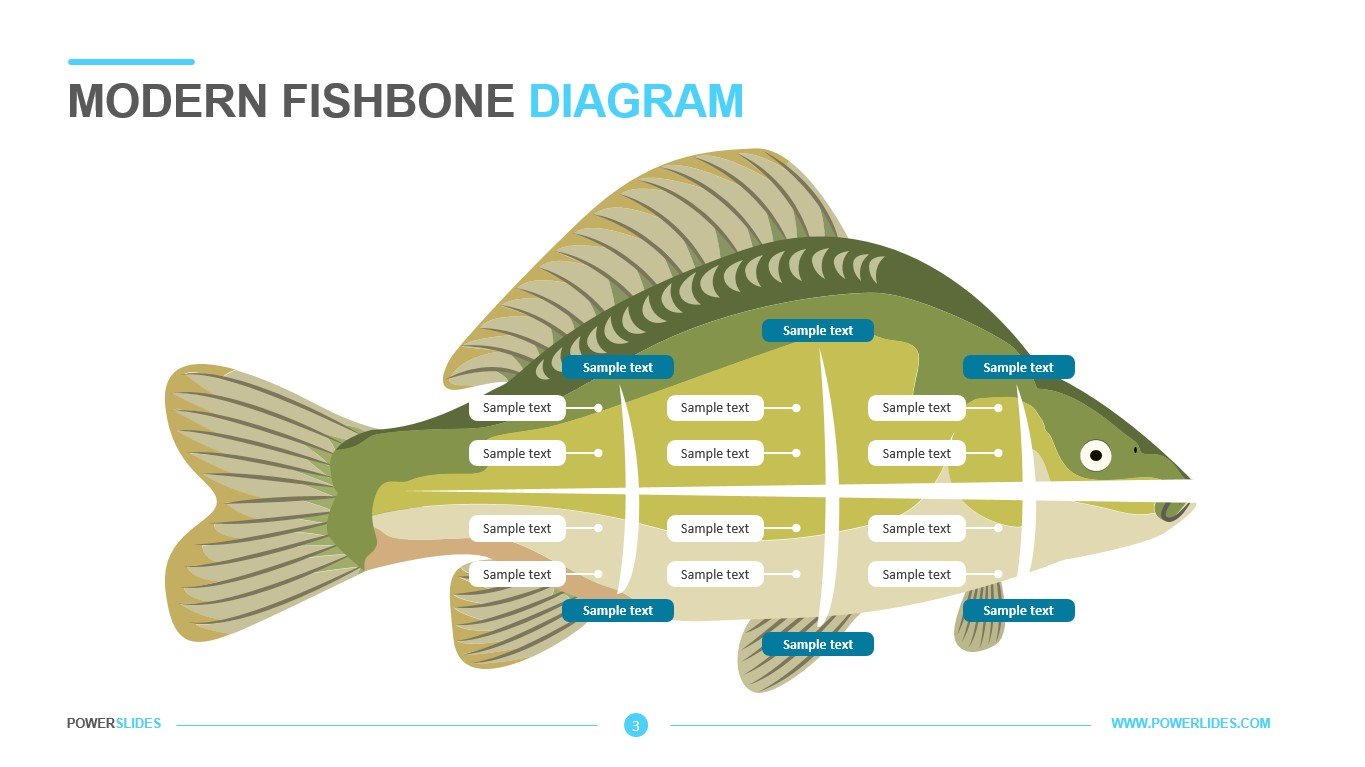
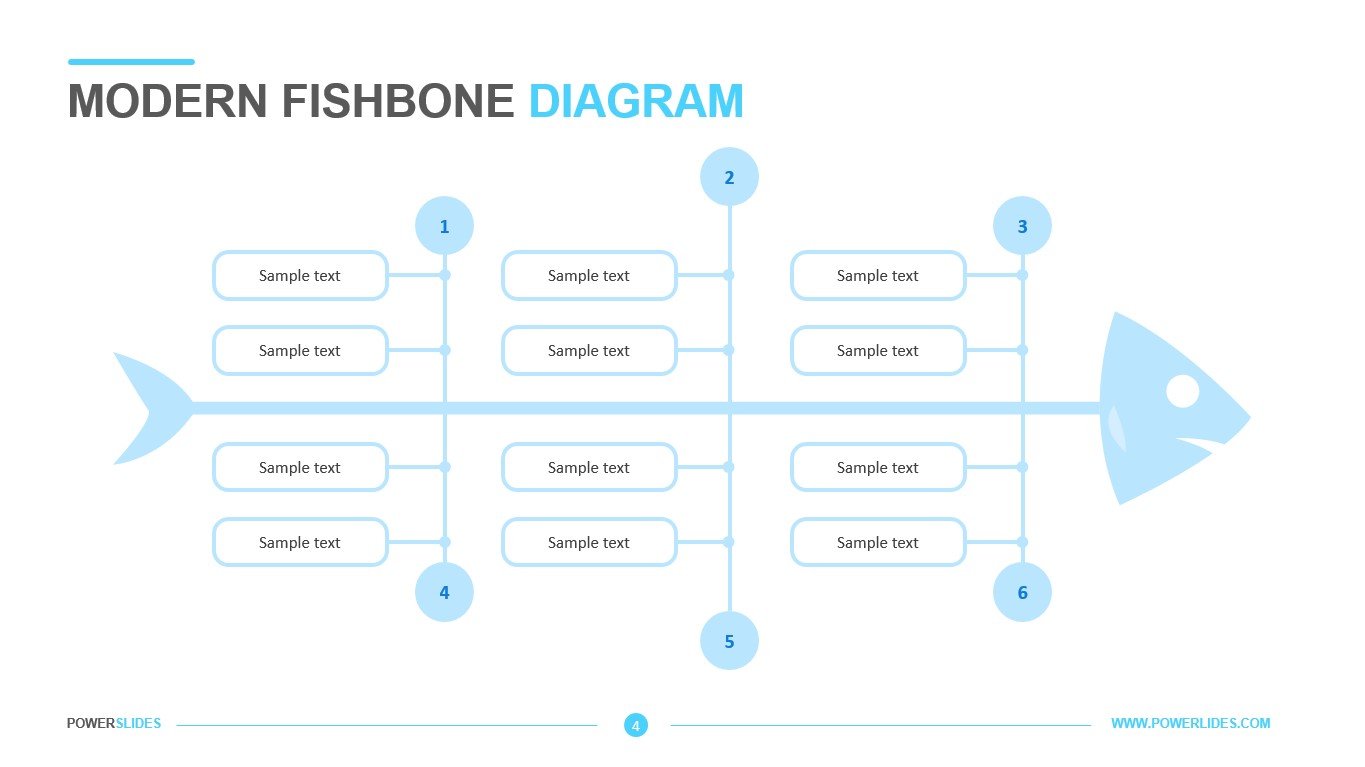
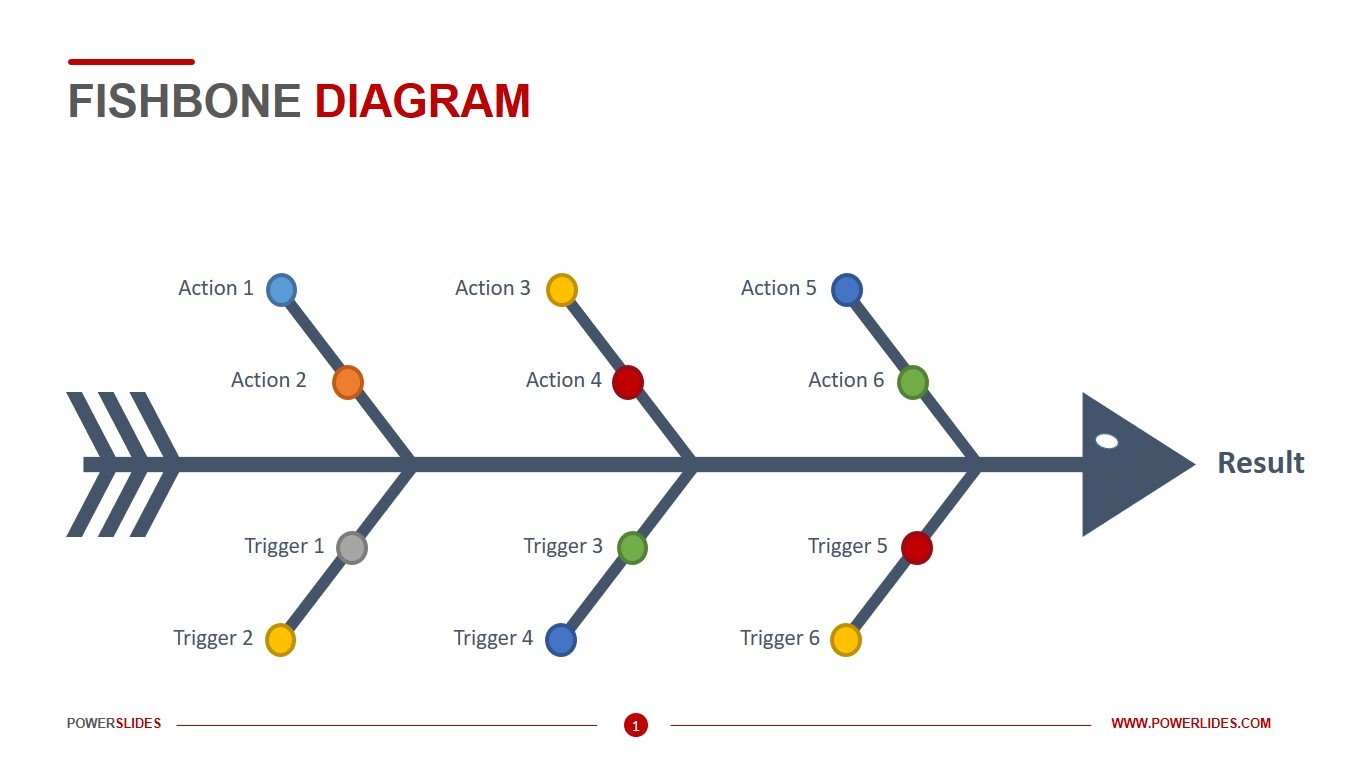
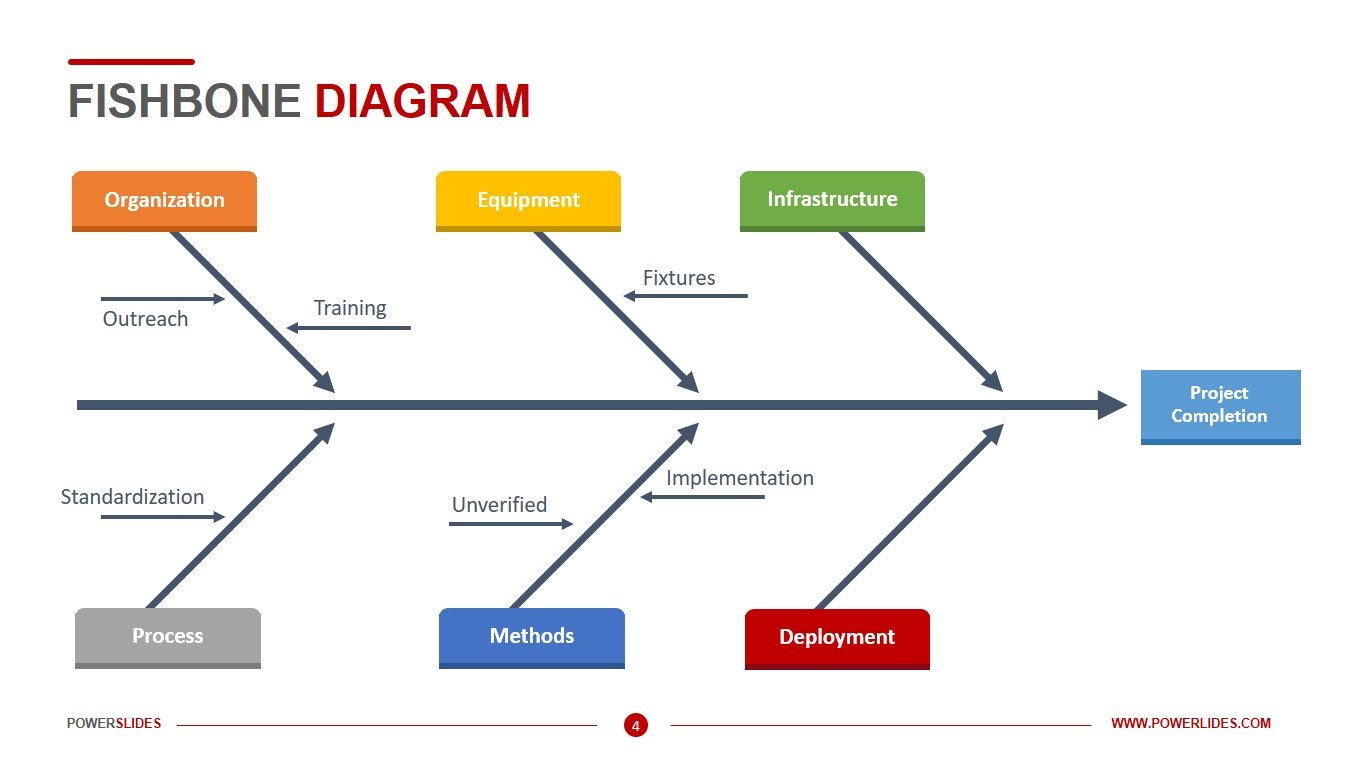
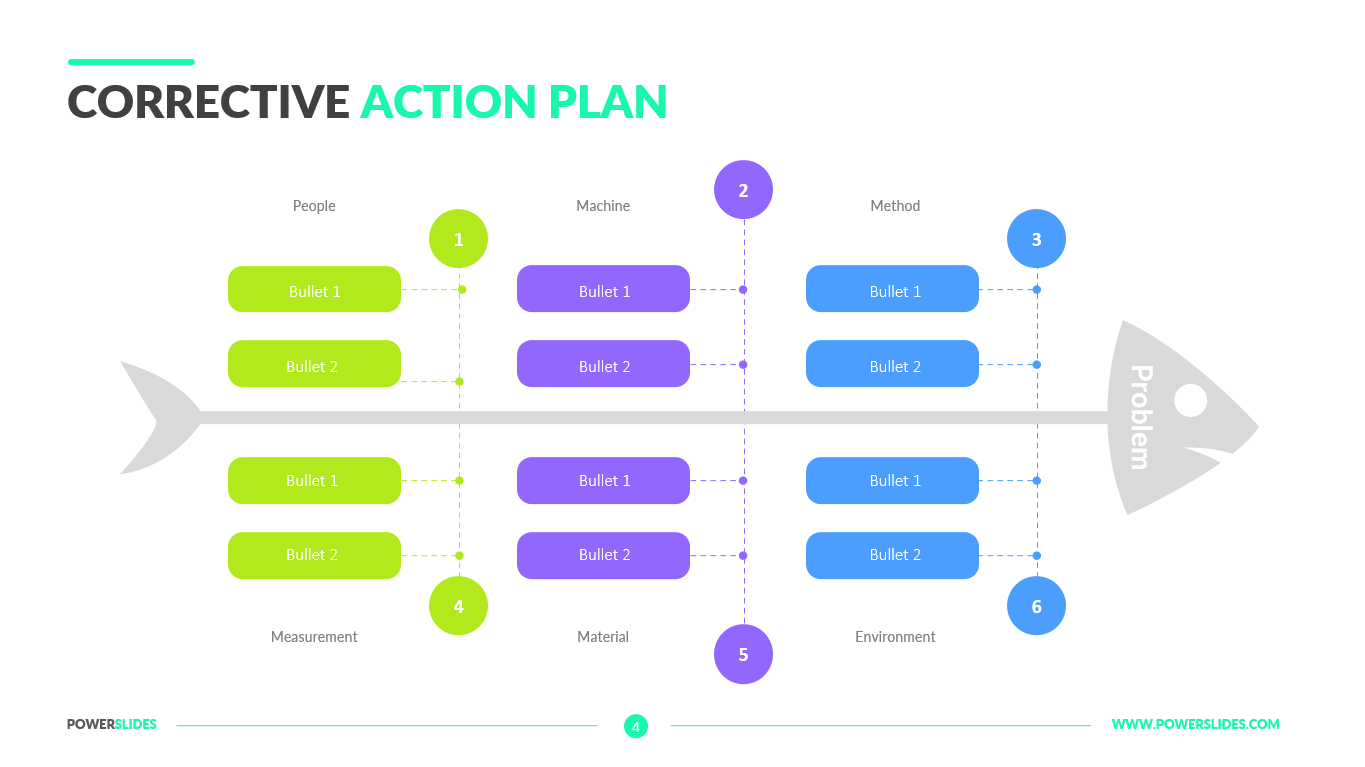
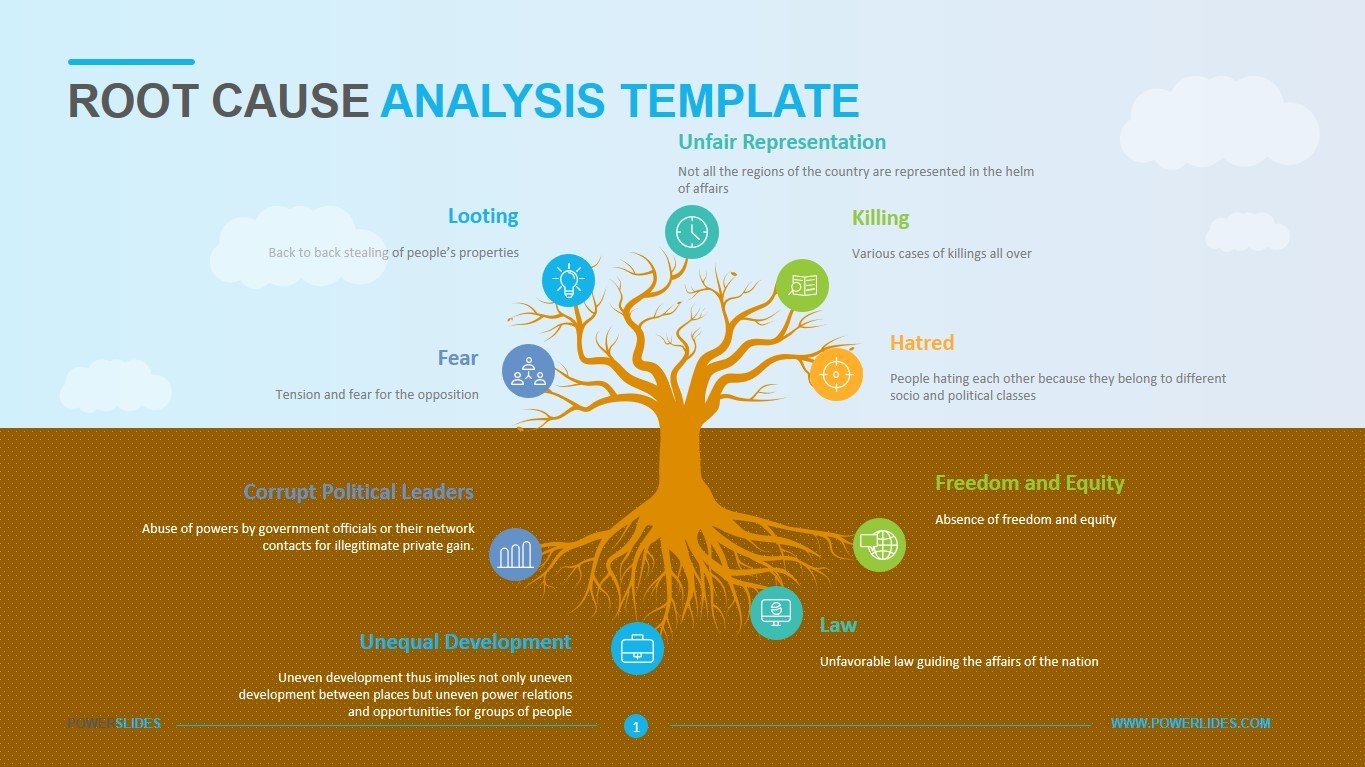
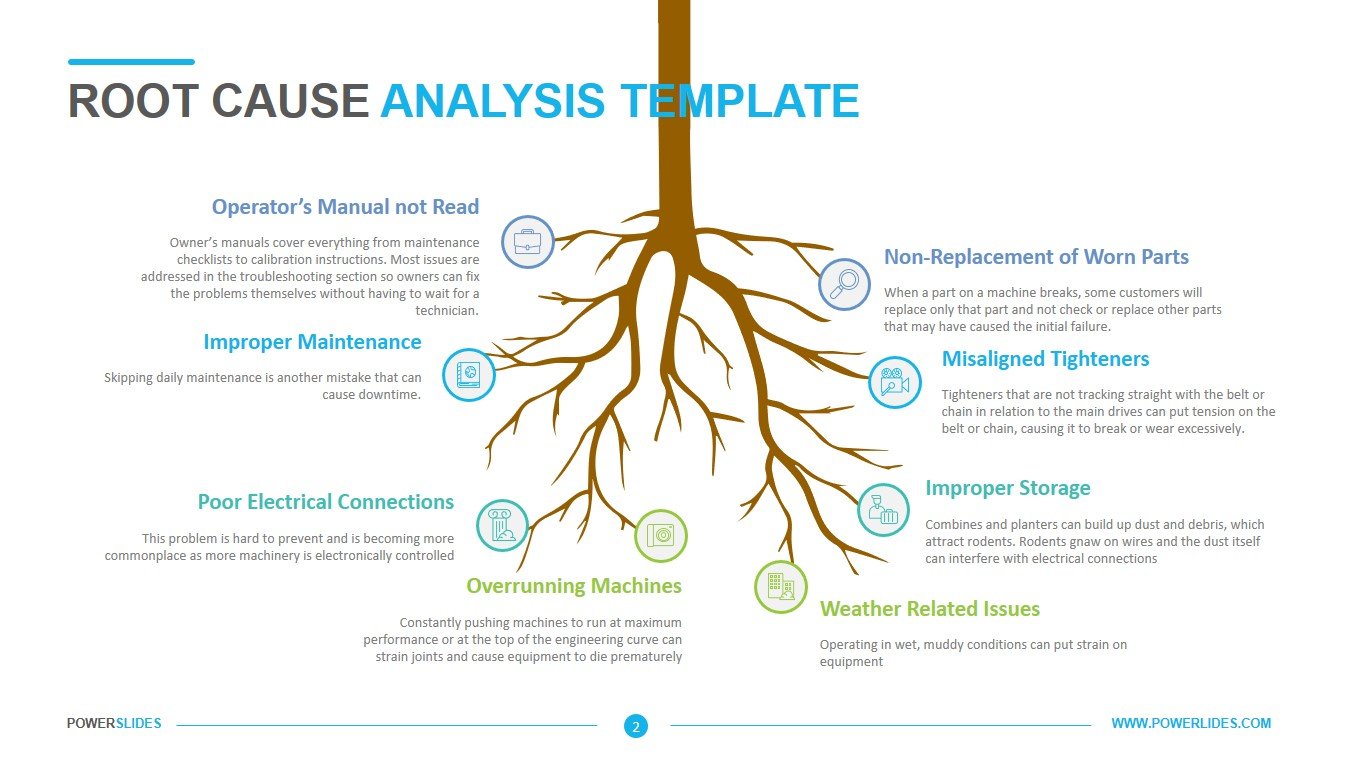
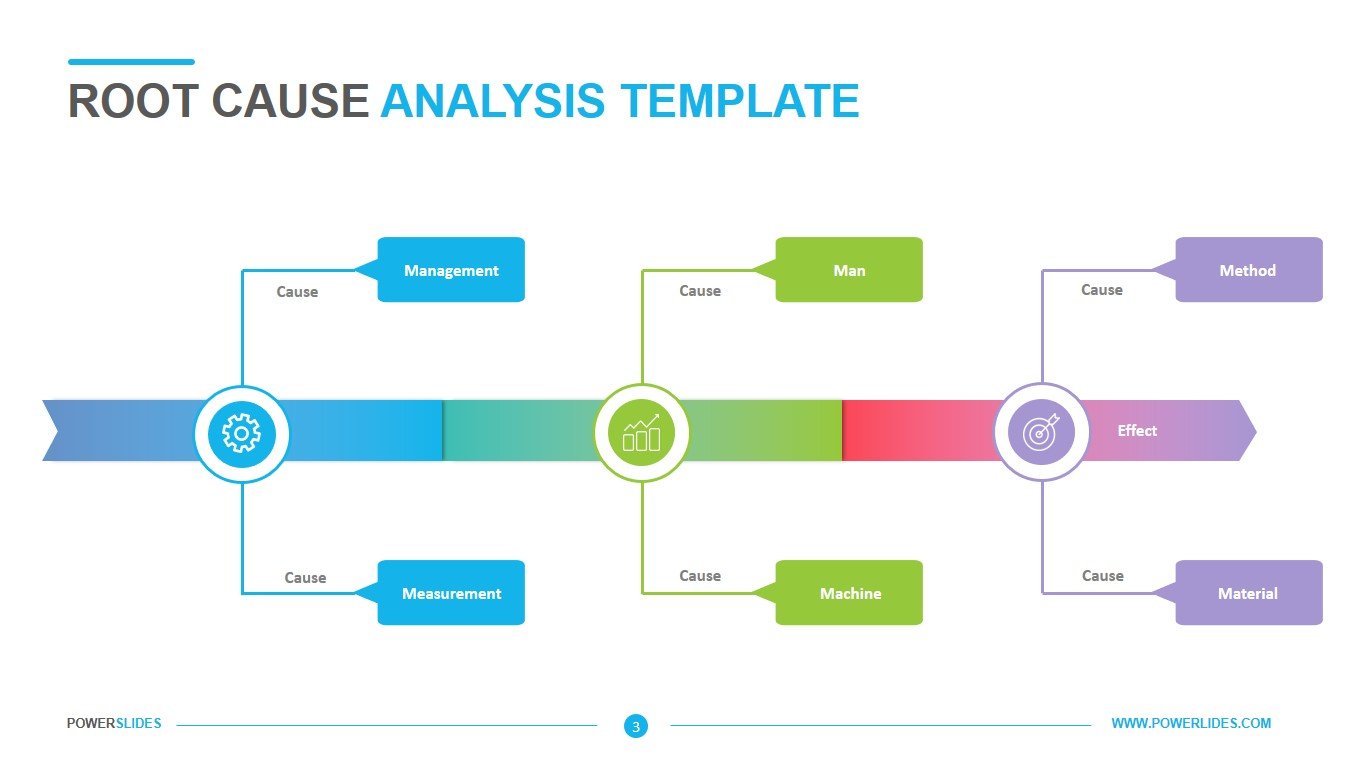
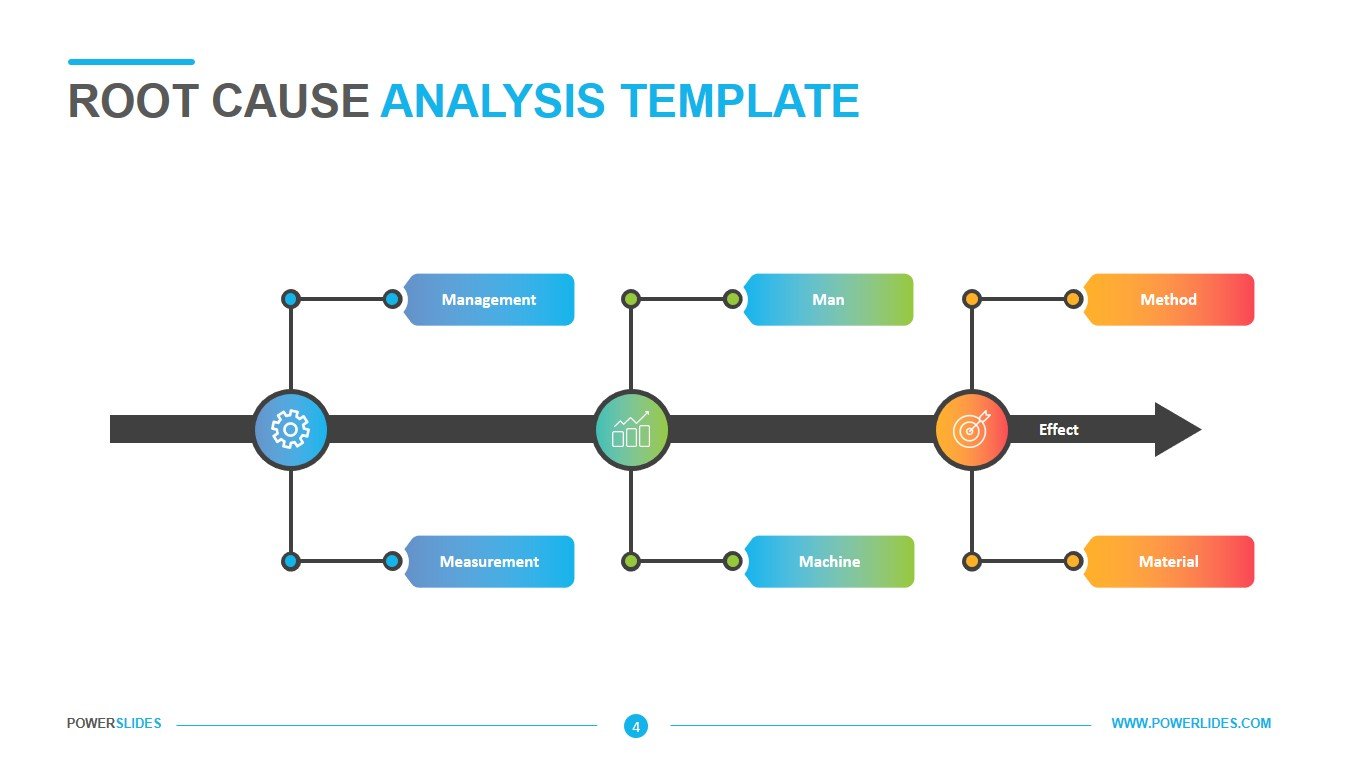
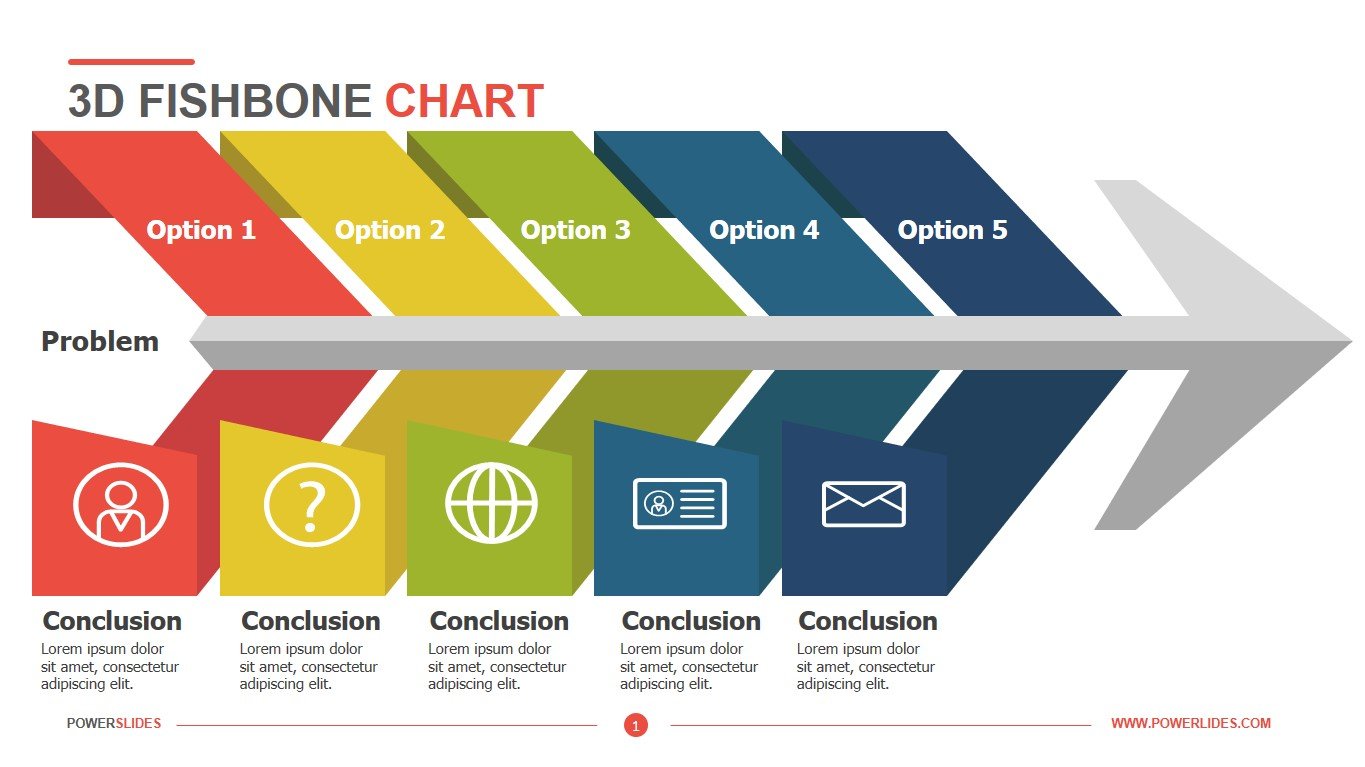
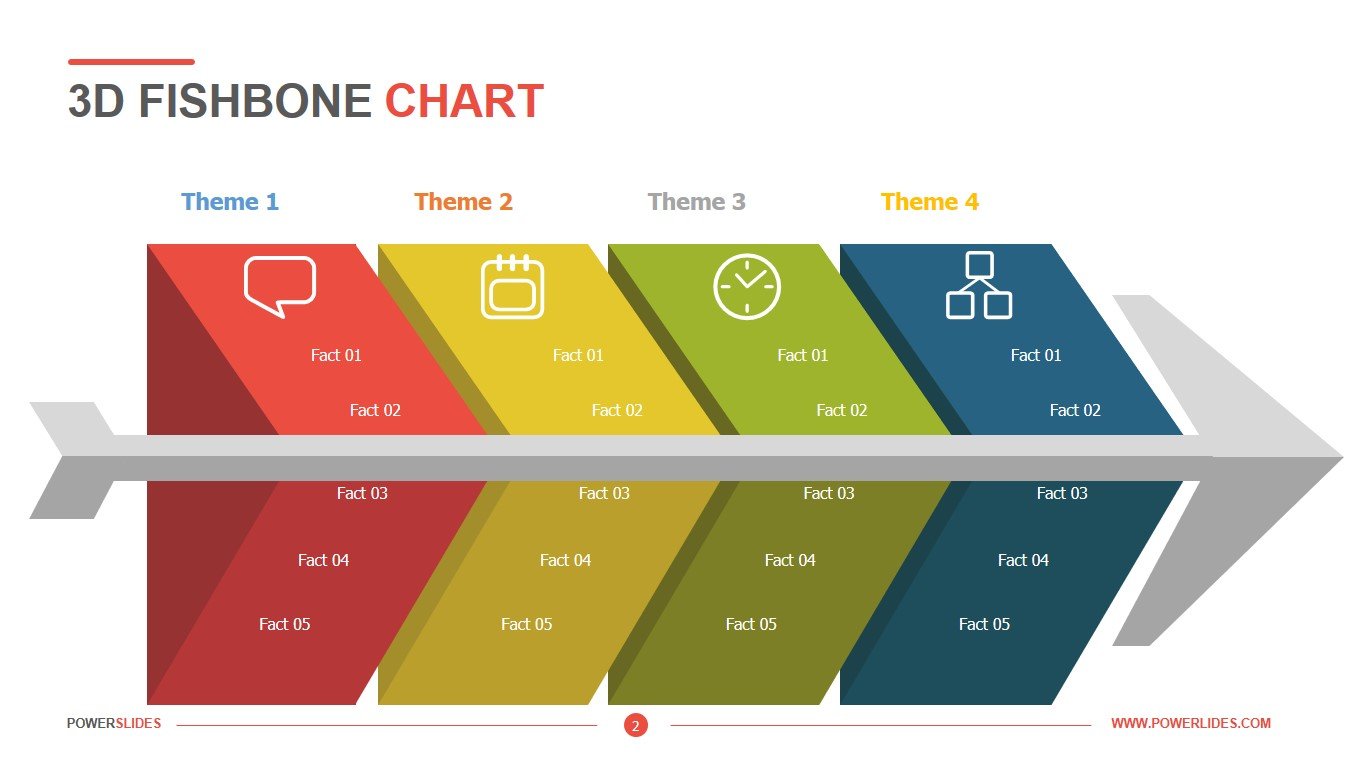
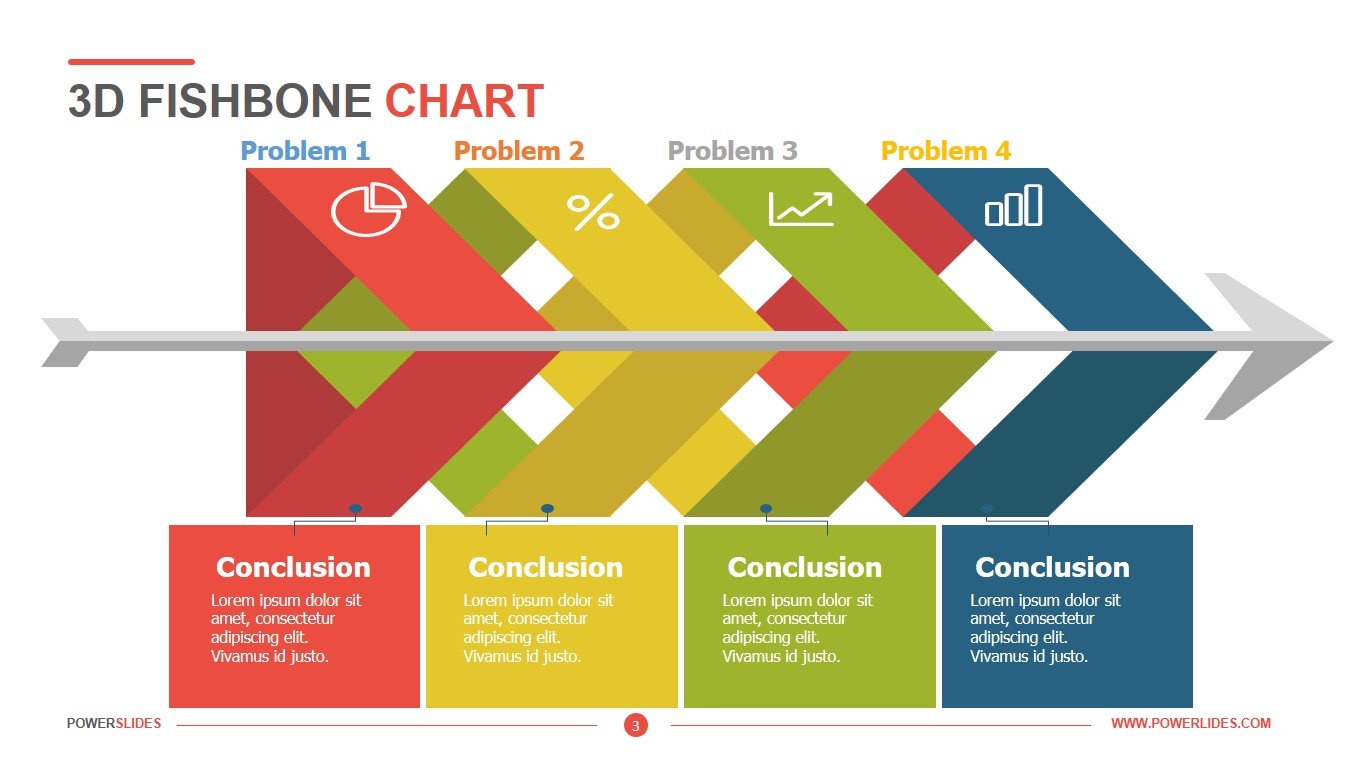
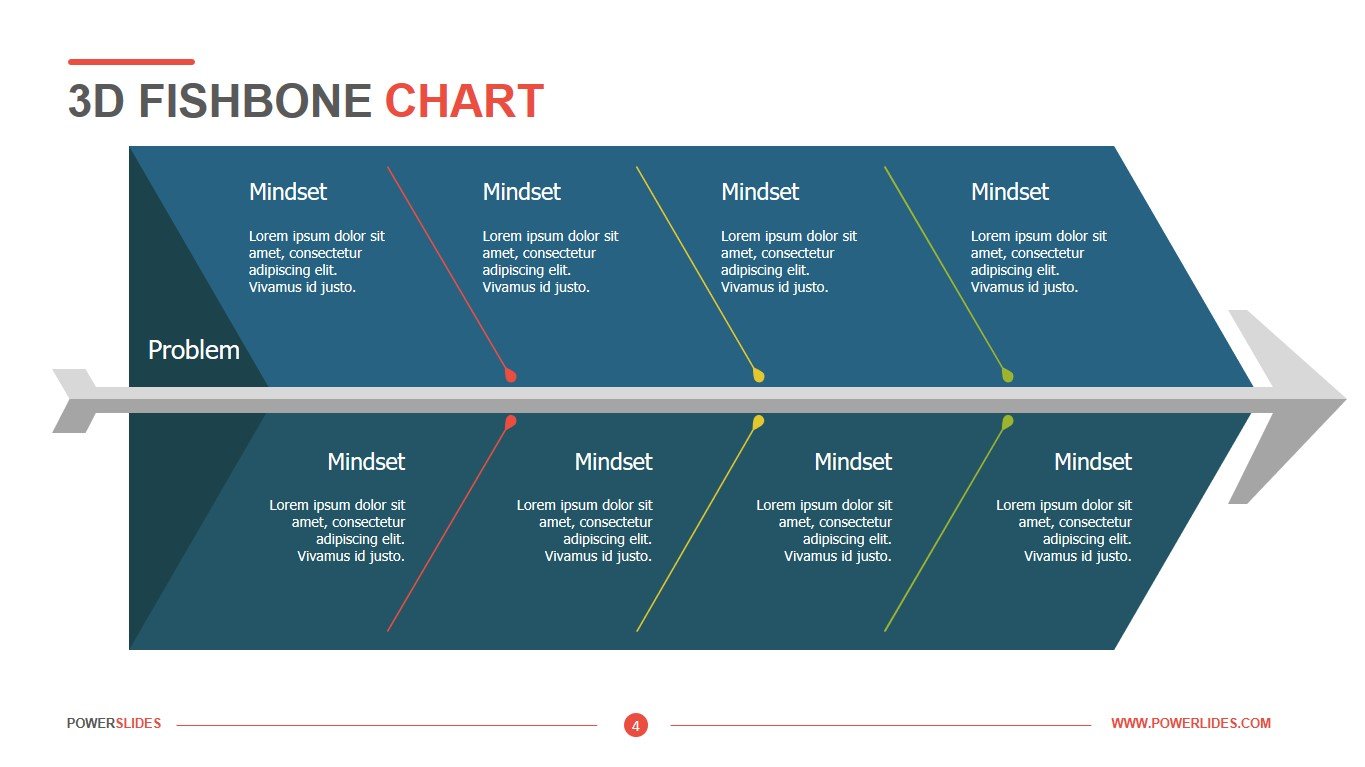
3D Fishbone Chart
SKU: AP8Q14C
 (5.00/ 5)
5 ratings Loading...
What do you think of this template?
(5.00/ 5)5 ratings

Add to Favourites
 4 Slides
 File size: 16:9
 Fonts: Tahoma, Lato Black
 Supported version
PPT 2010, PPT 2013, PPT 2016
Supported version
PPT 2010, PPT 2013, PPT 2016

Product details
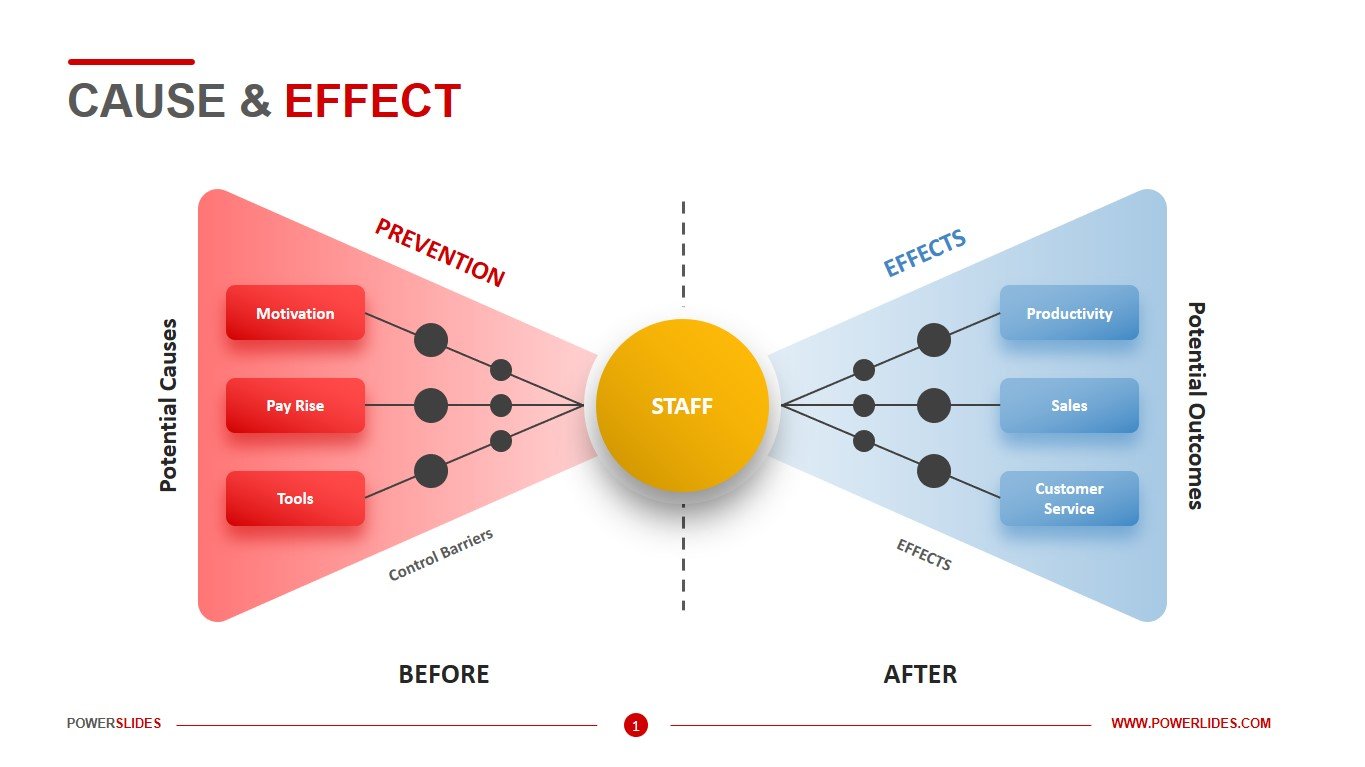
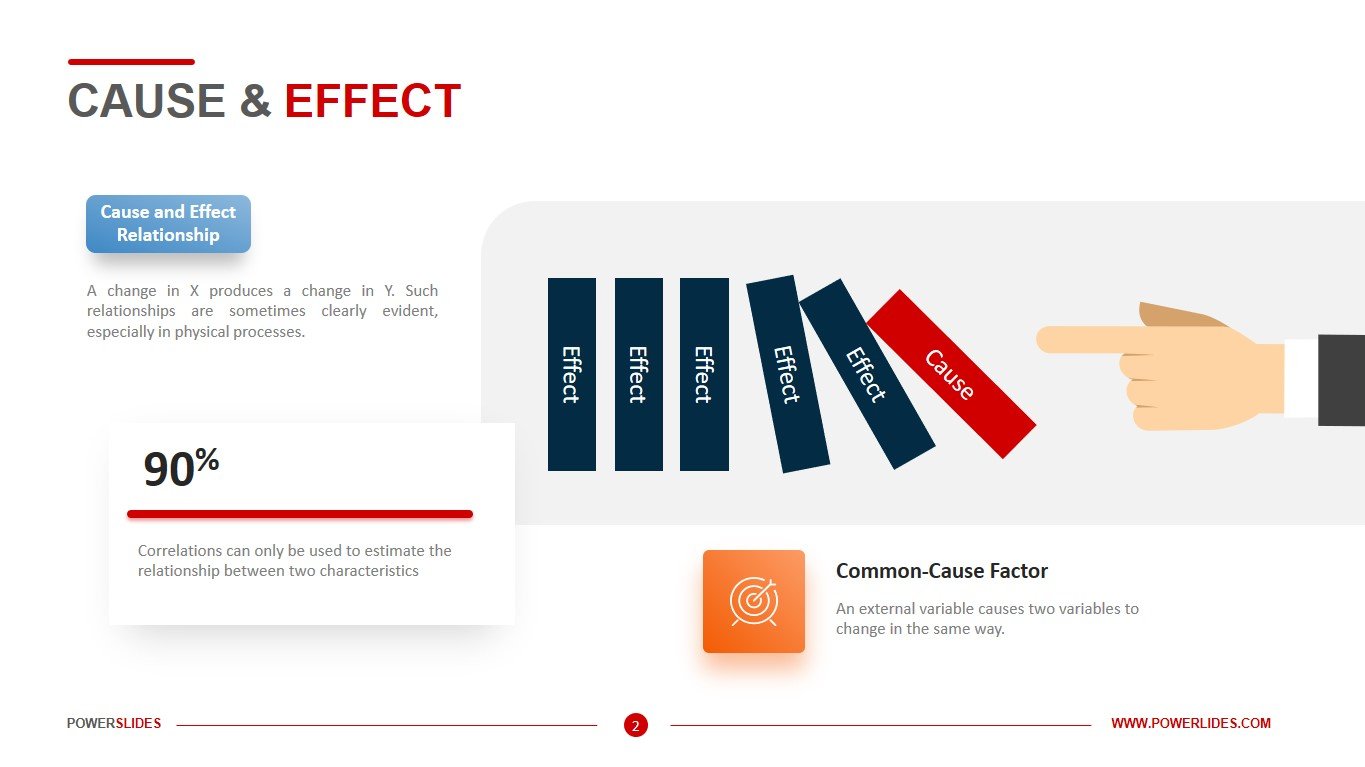
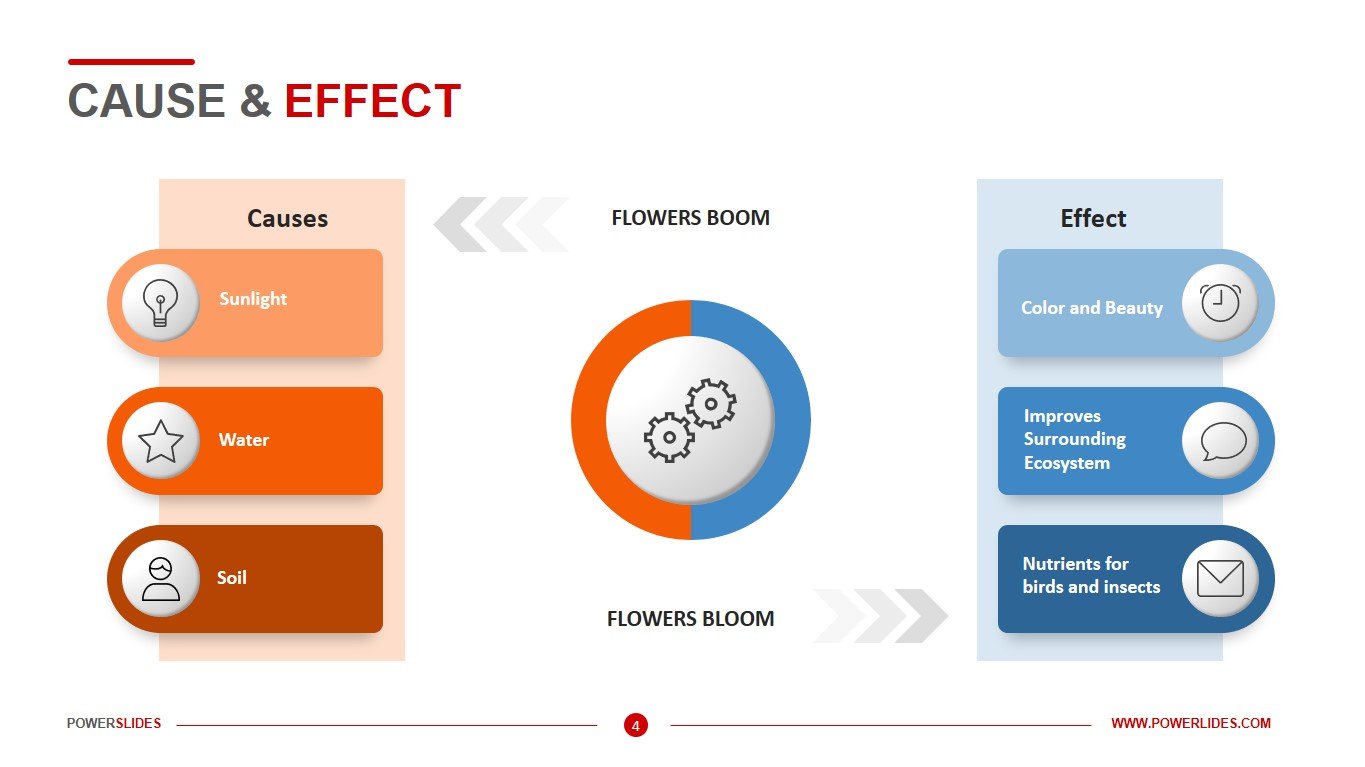
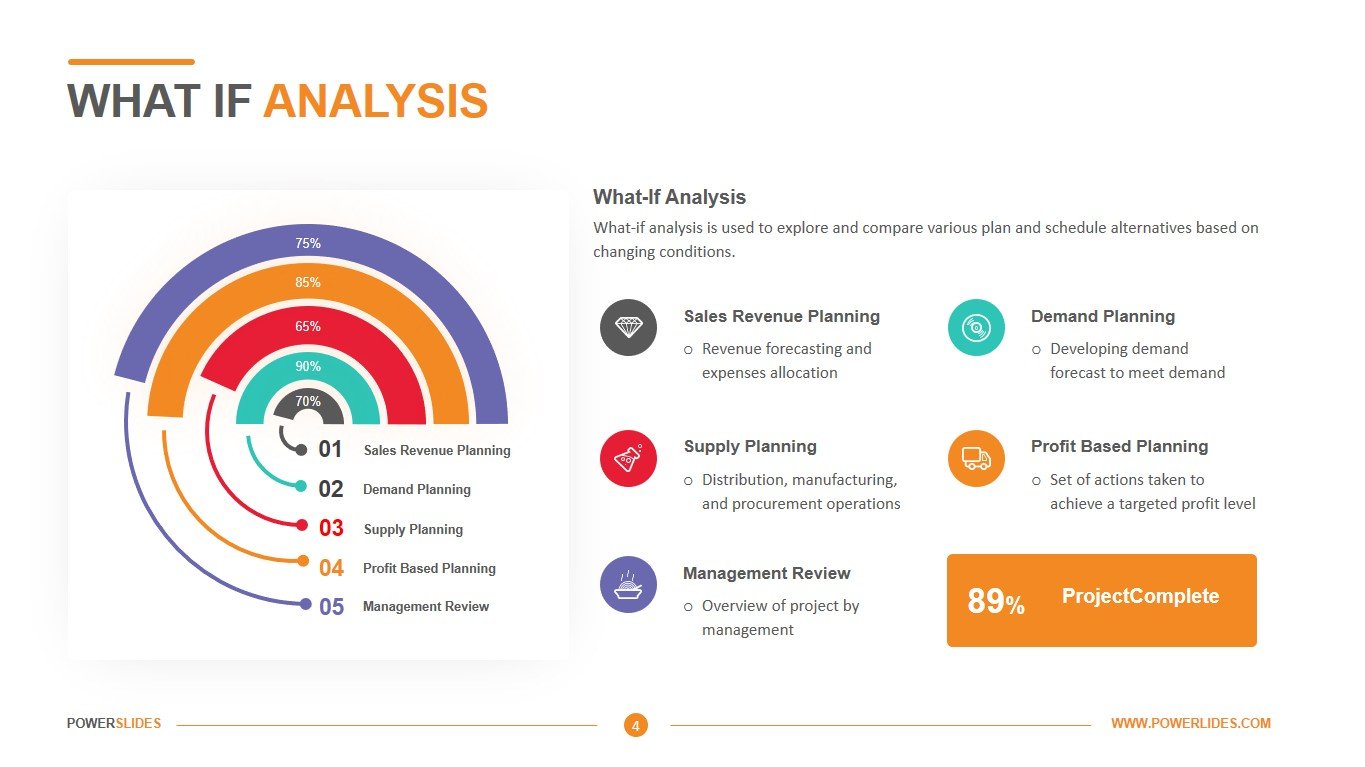
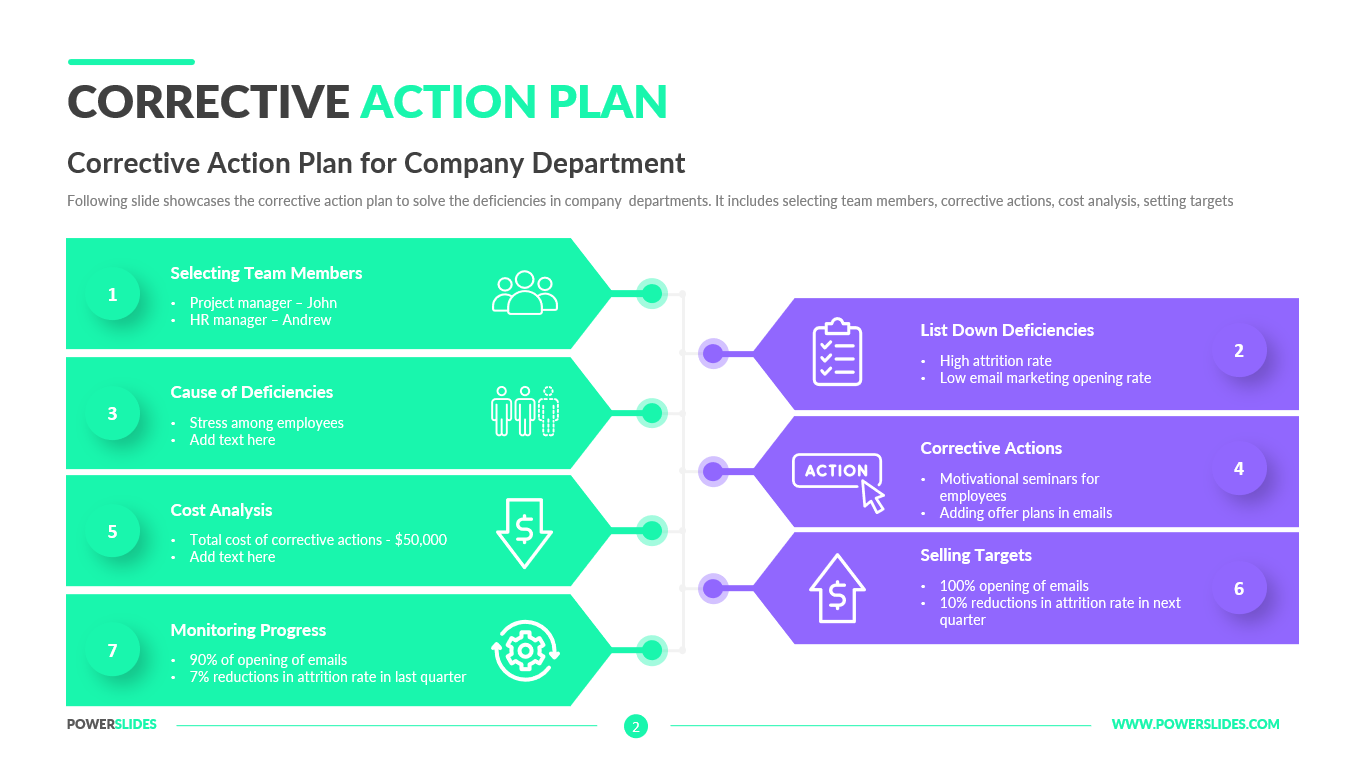
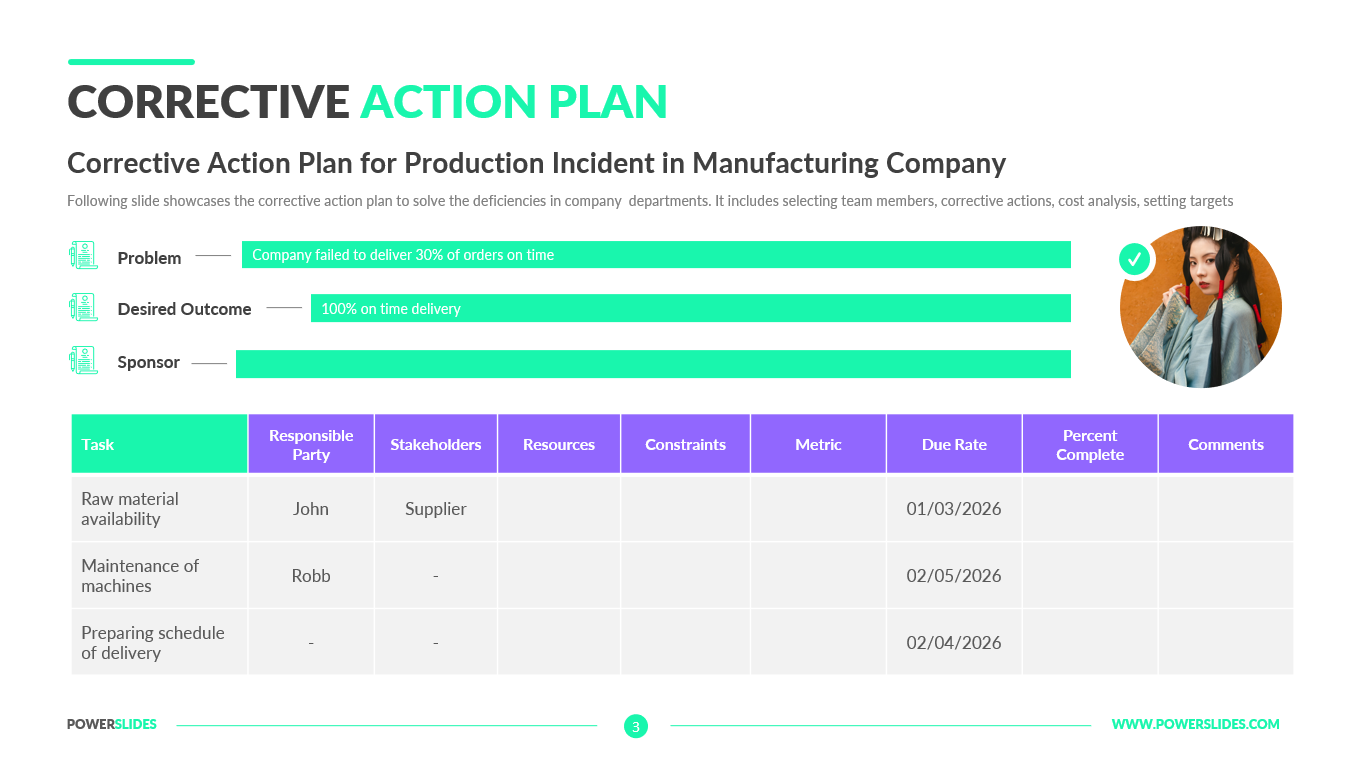
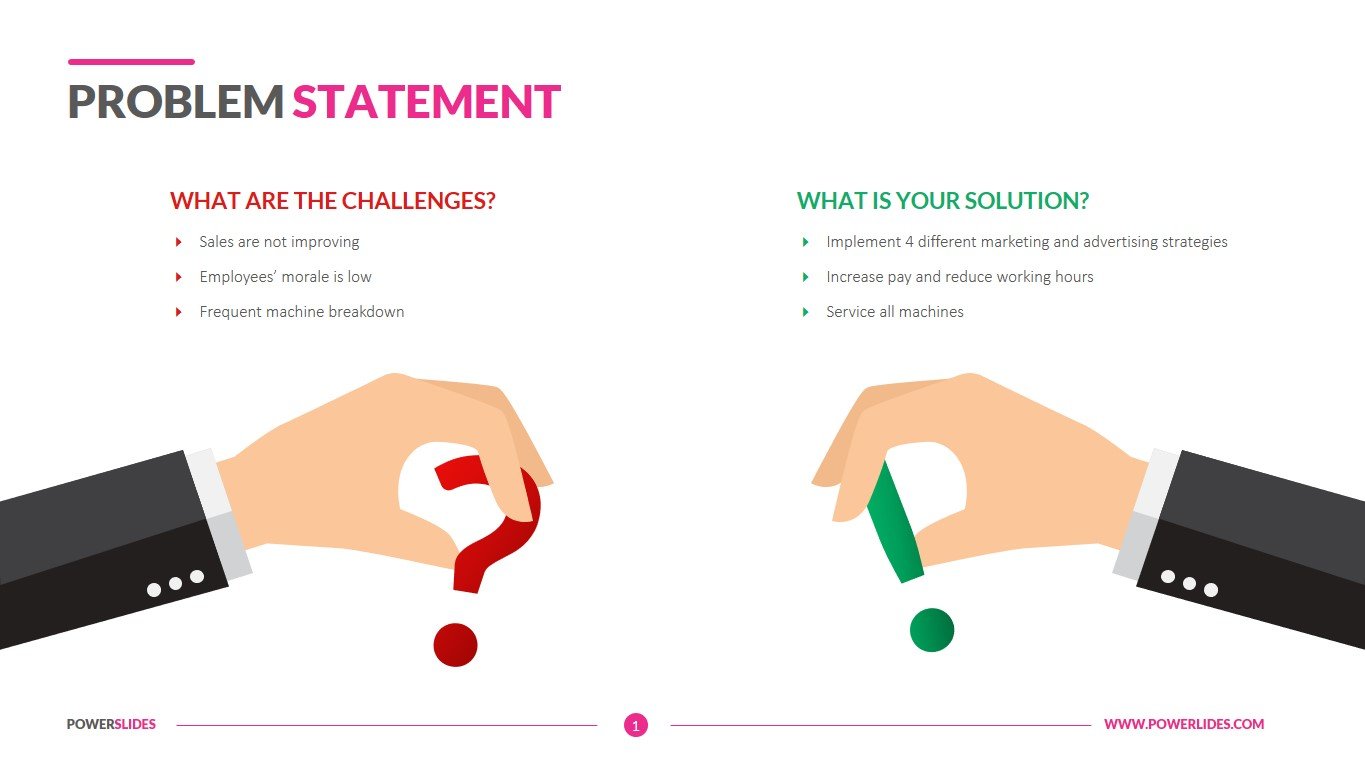
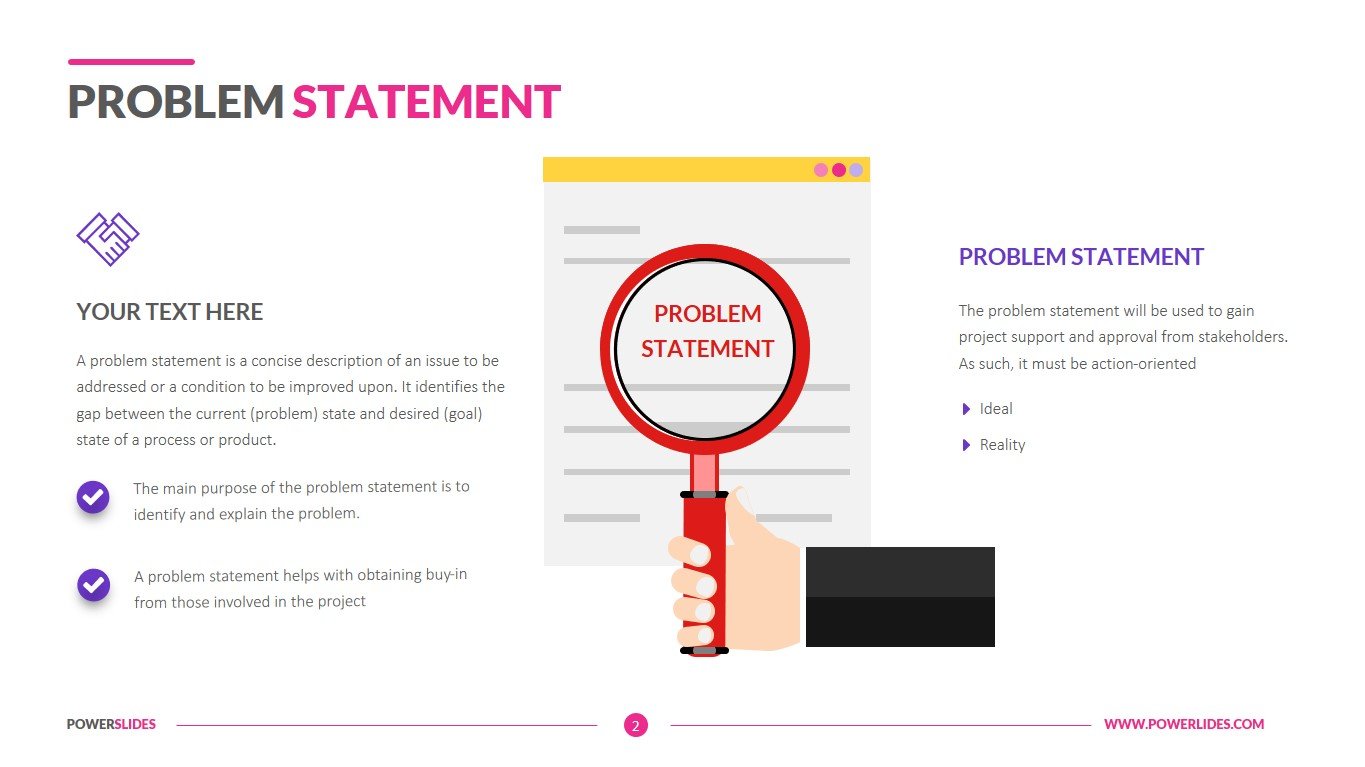
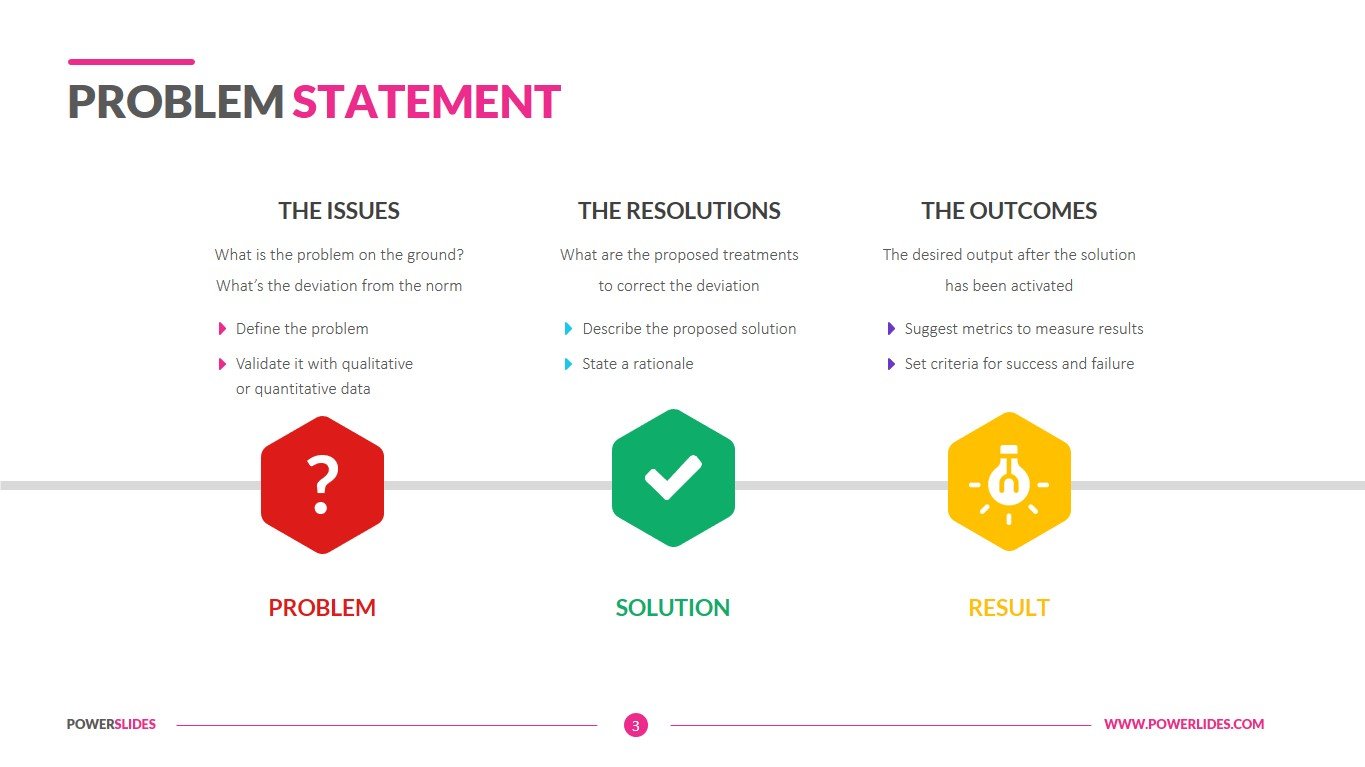
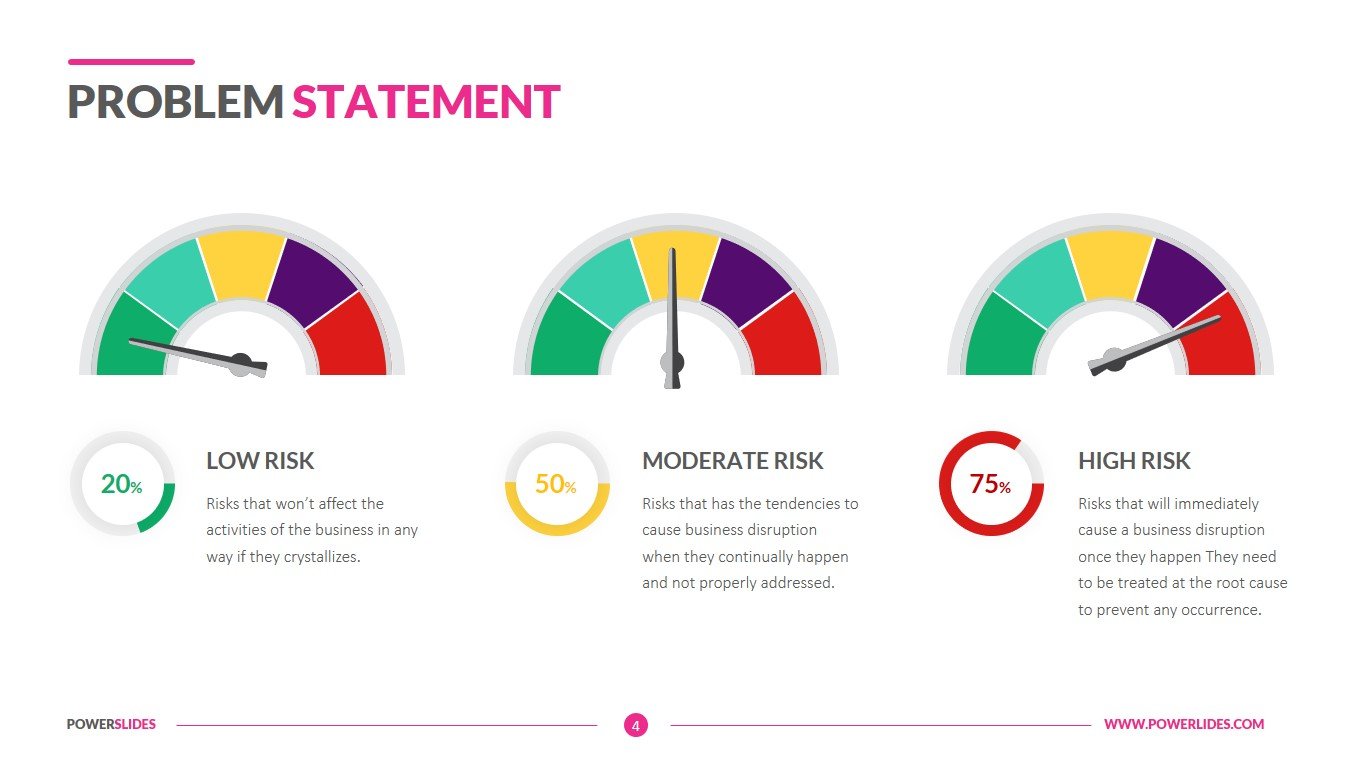
These 3D fishbone chart templates help you to visually organise and present a cause and effect based issue. Identifying the many causes of an organisation problem or issue is the point of focus of these diagrams. These templates are 100% editable and help you illustrate the results of an analysis.


