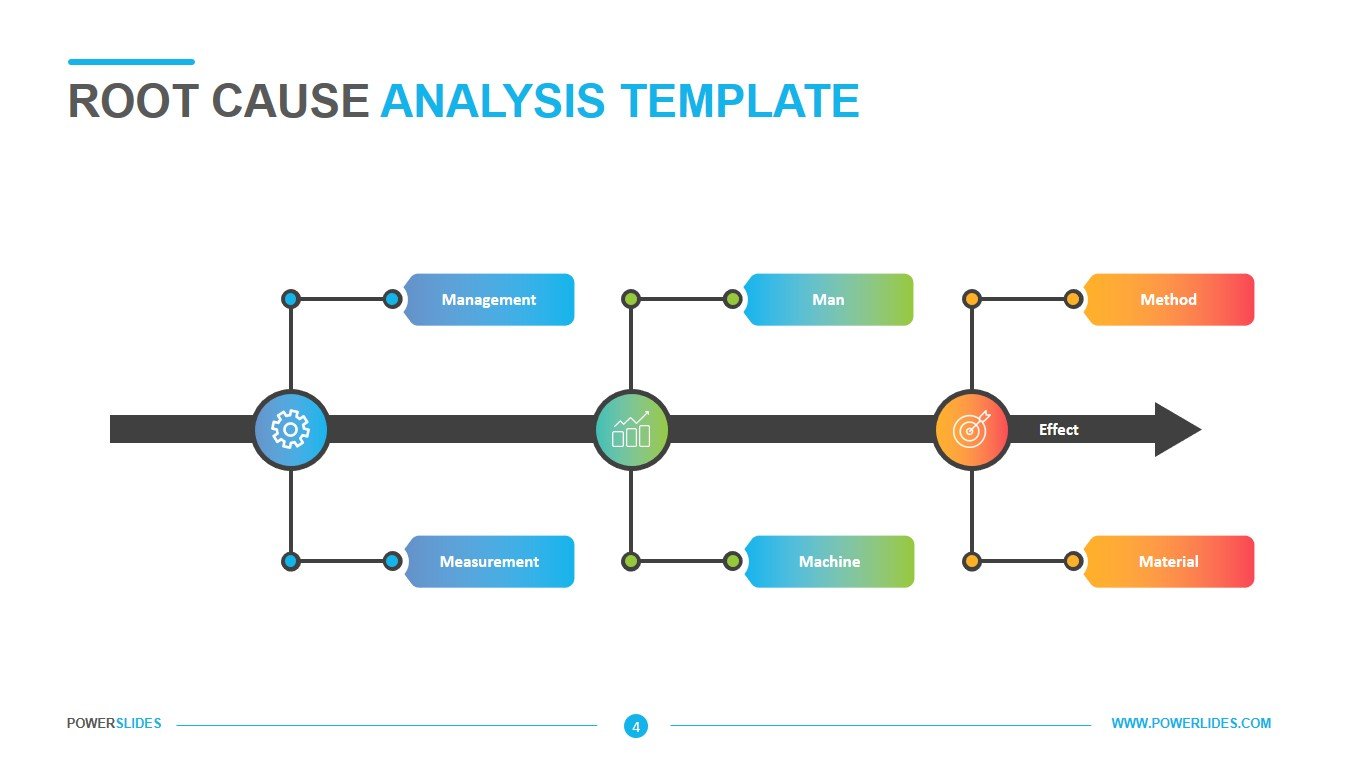
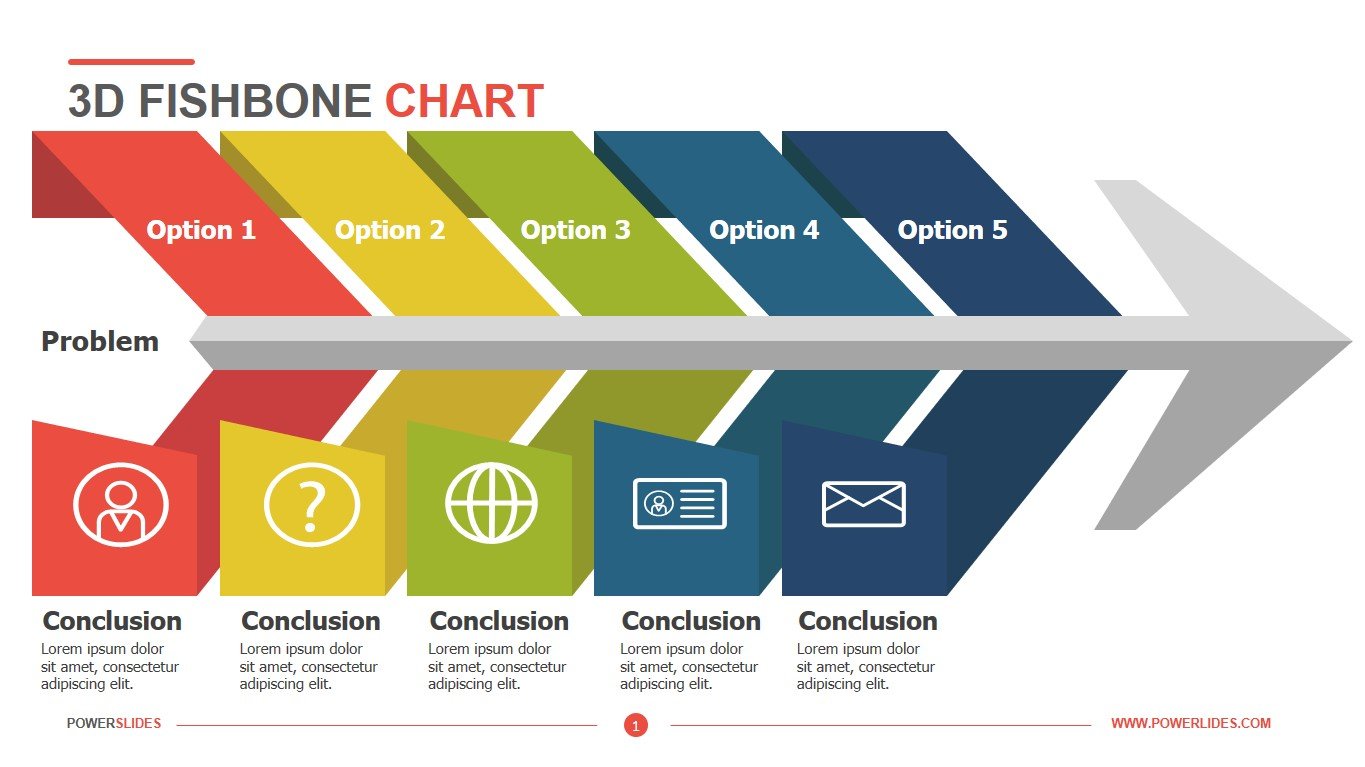
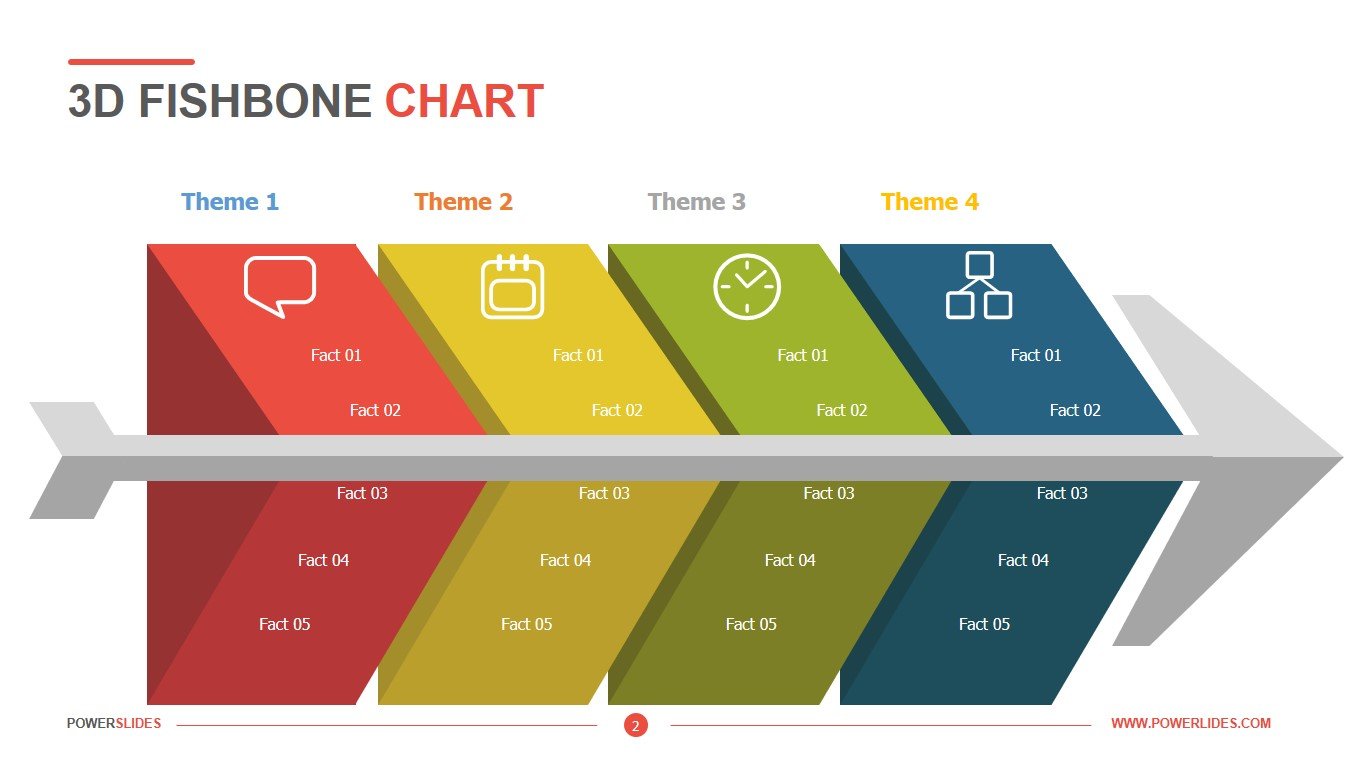
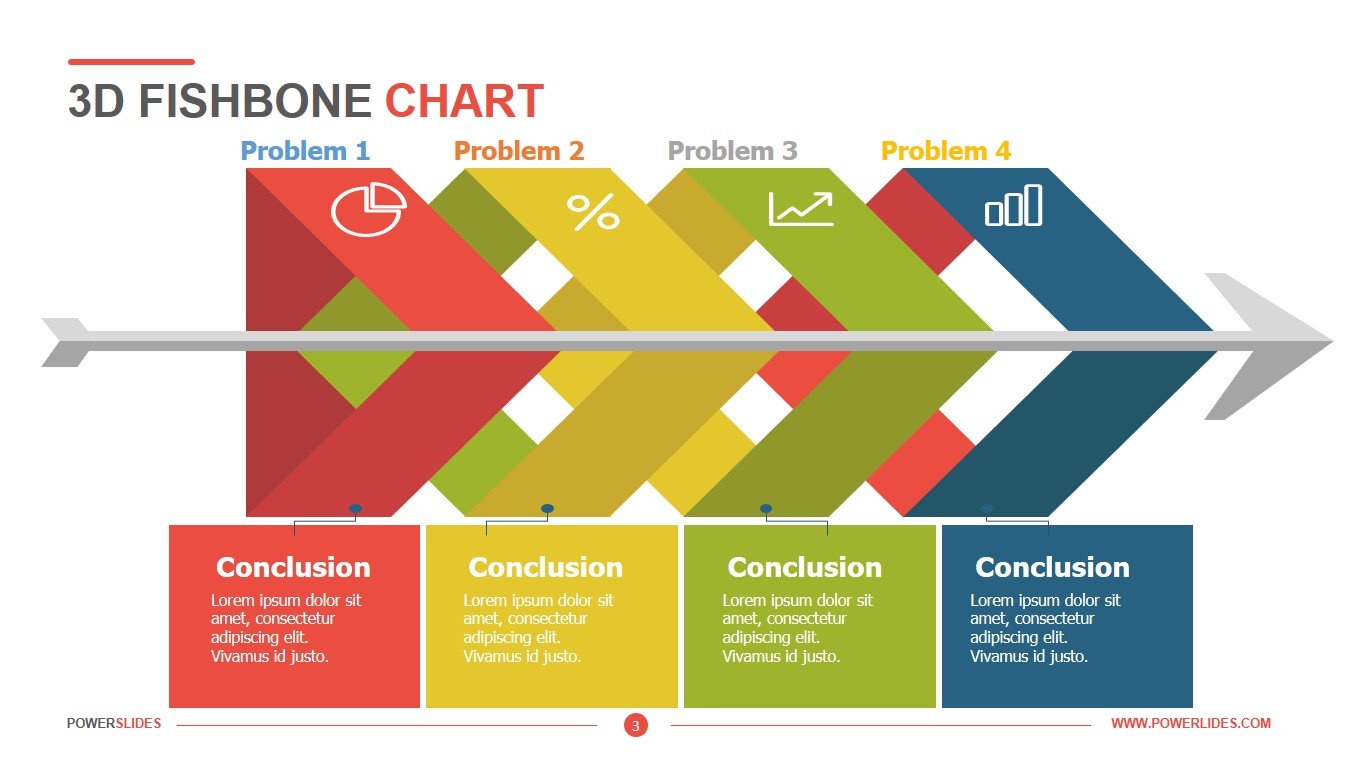
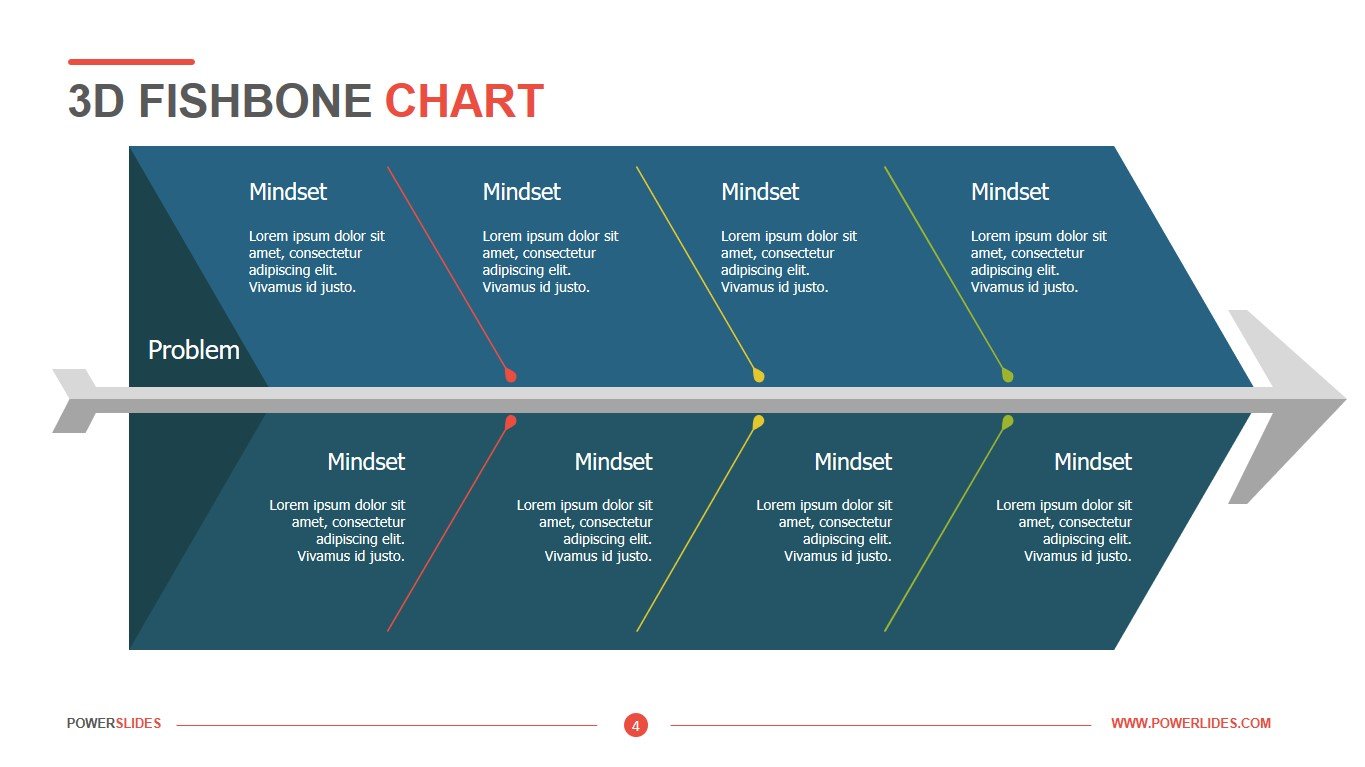
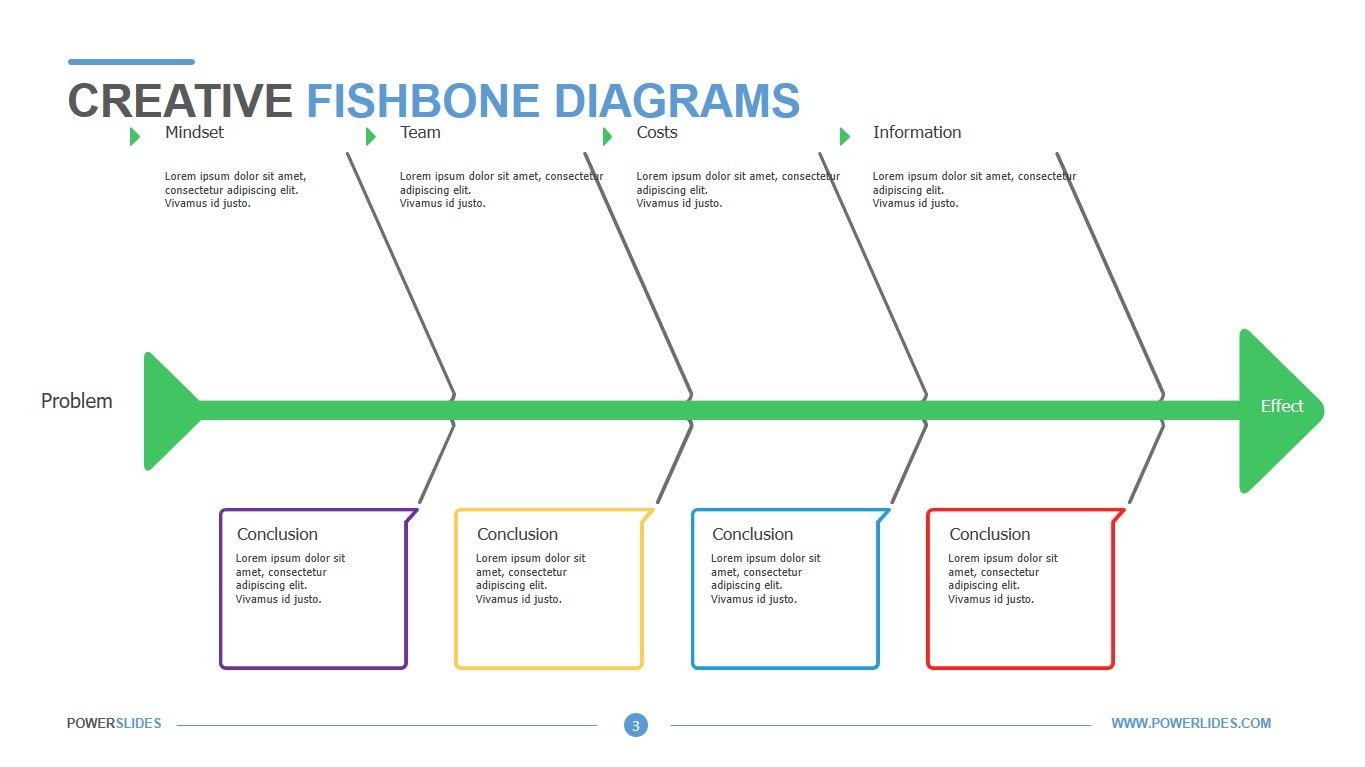
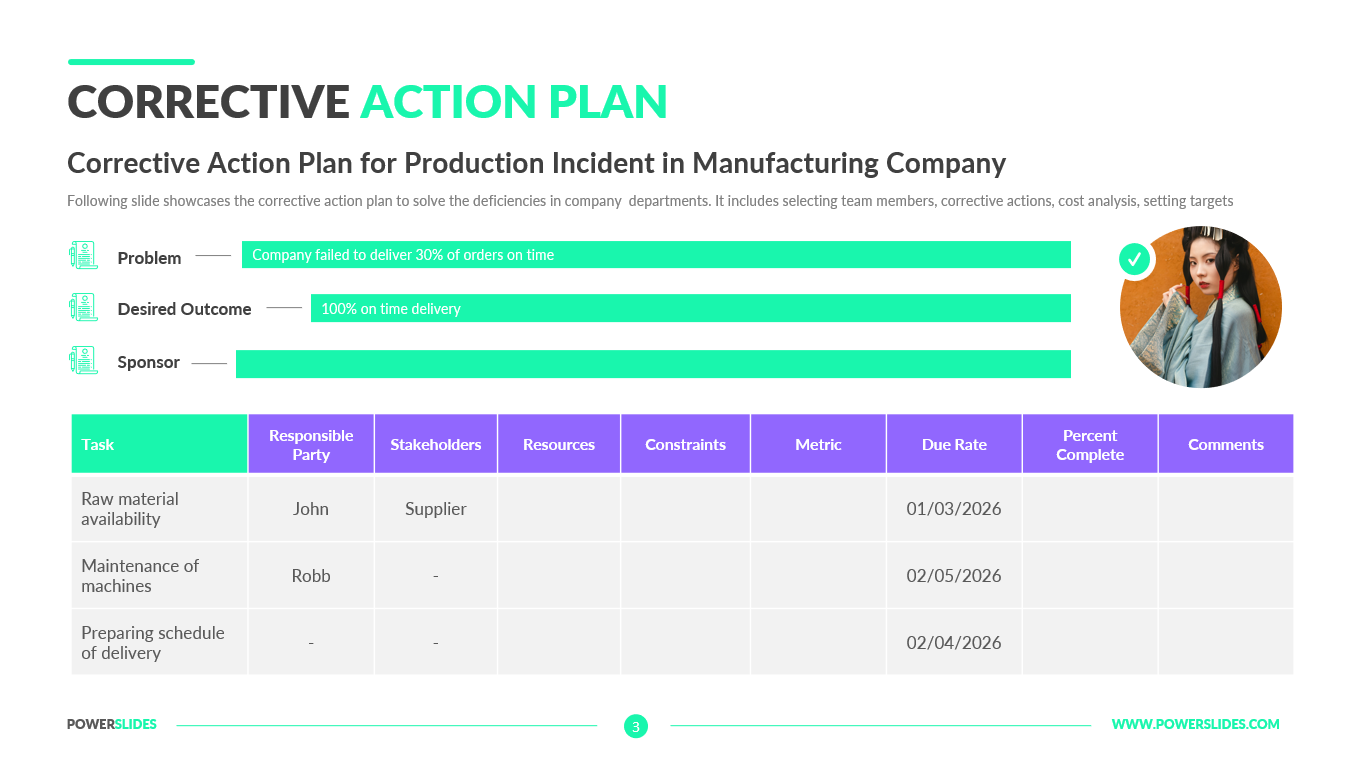
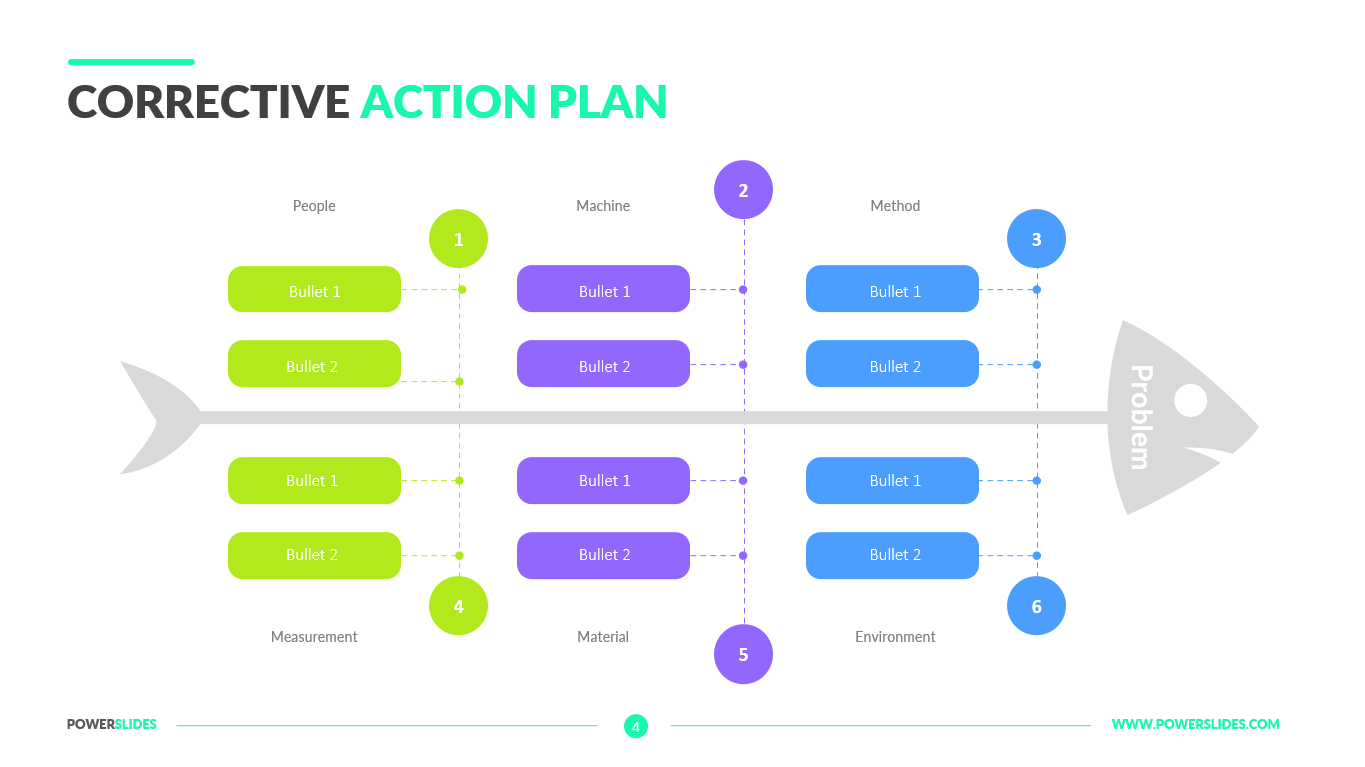
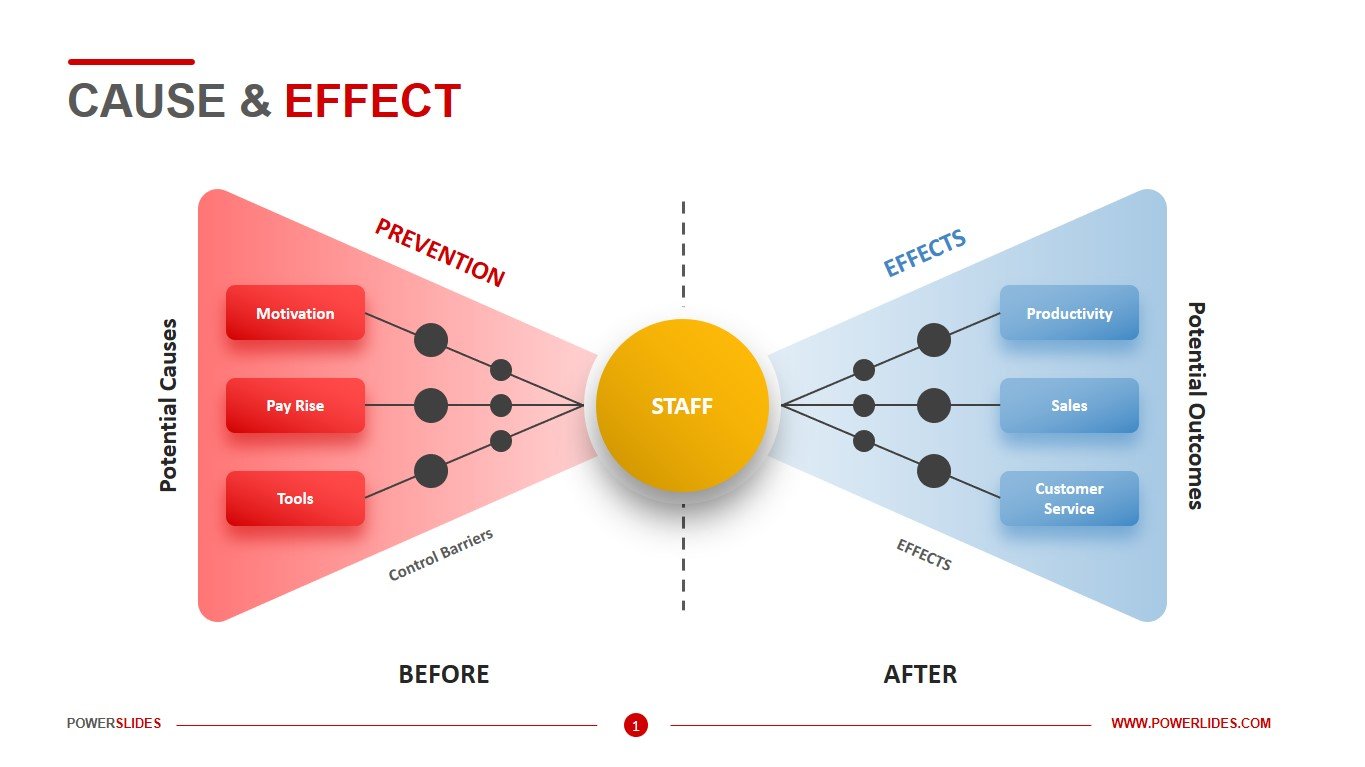
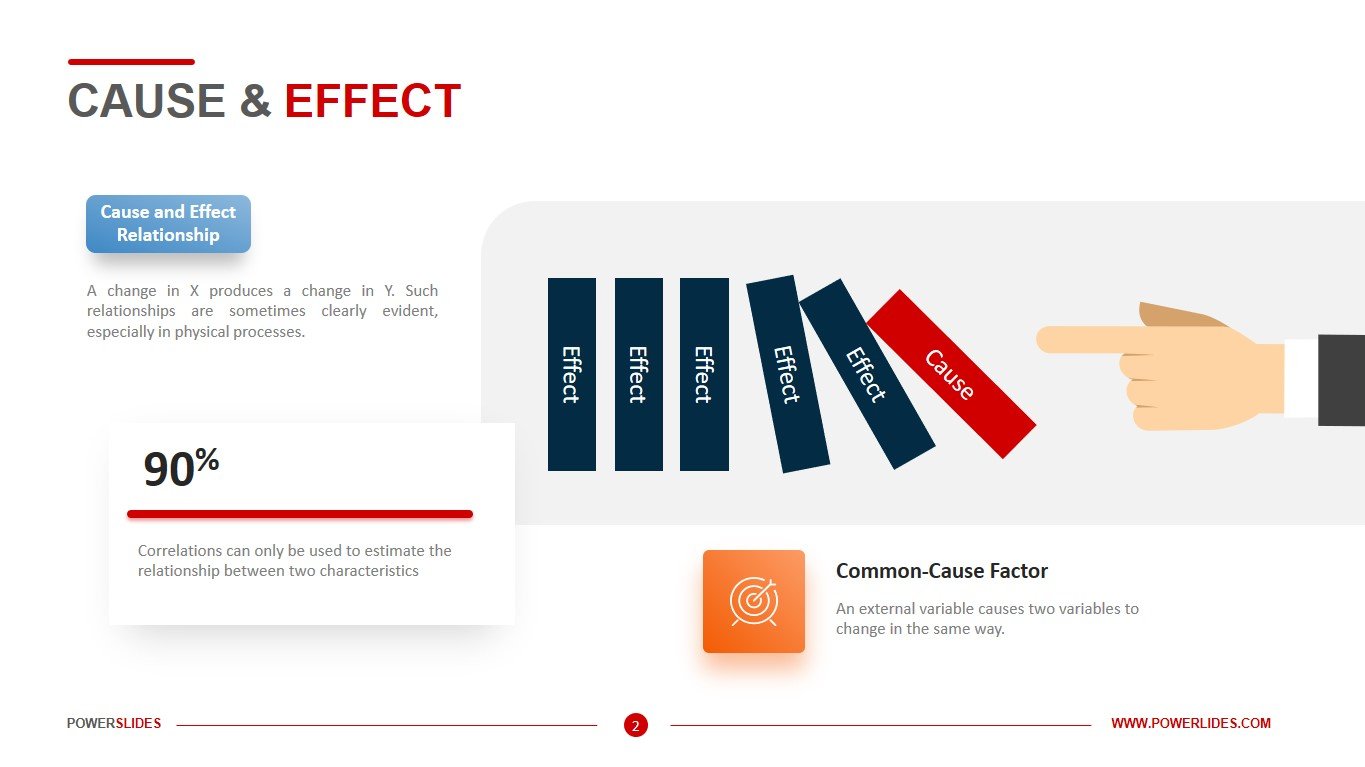
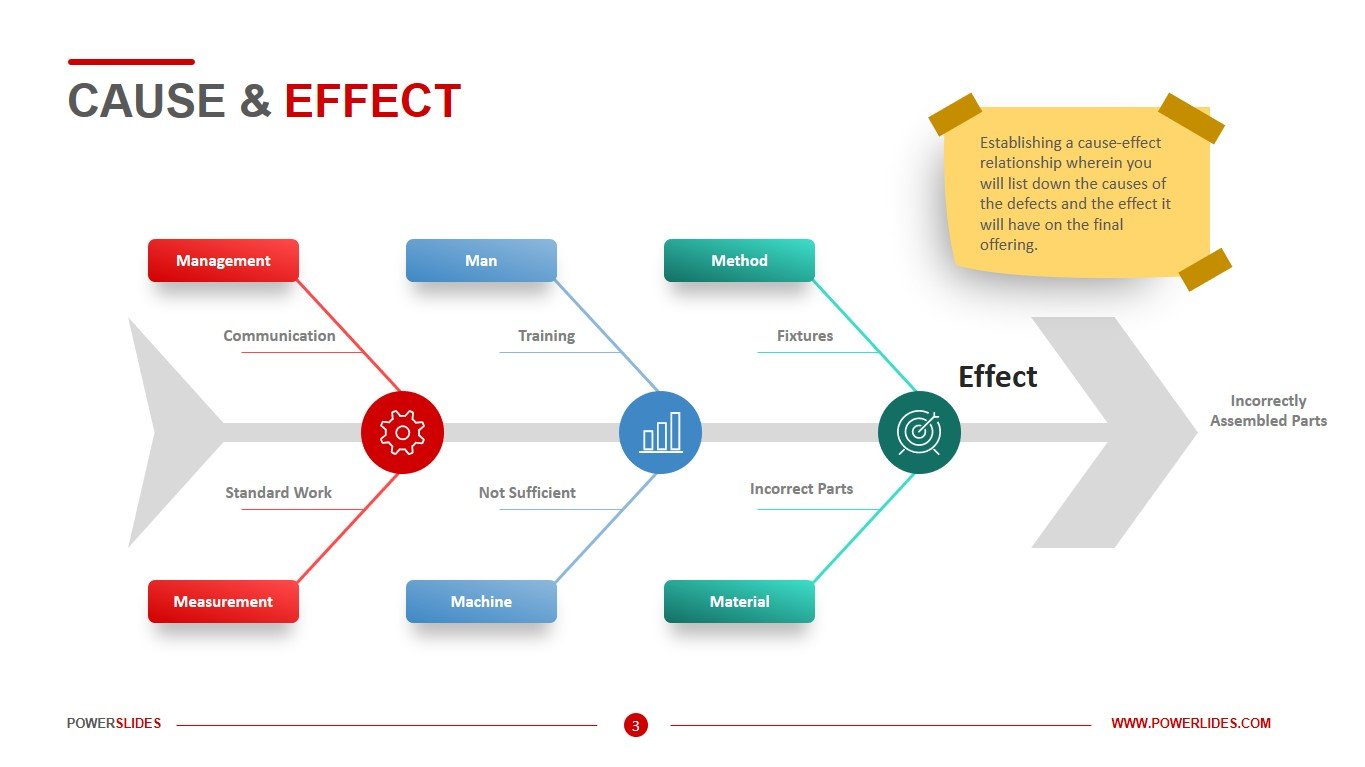
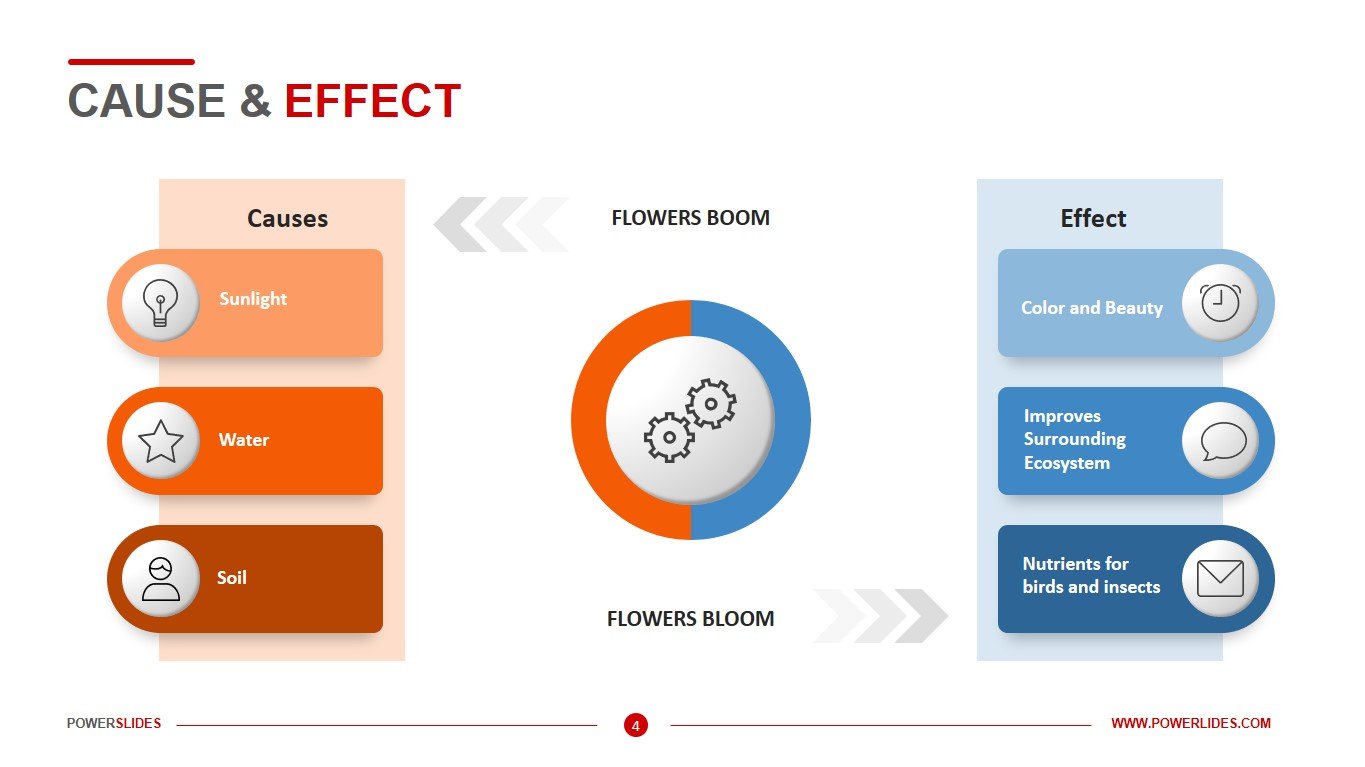
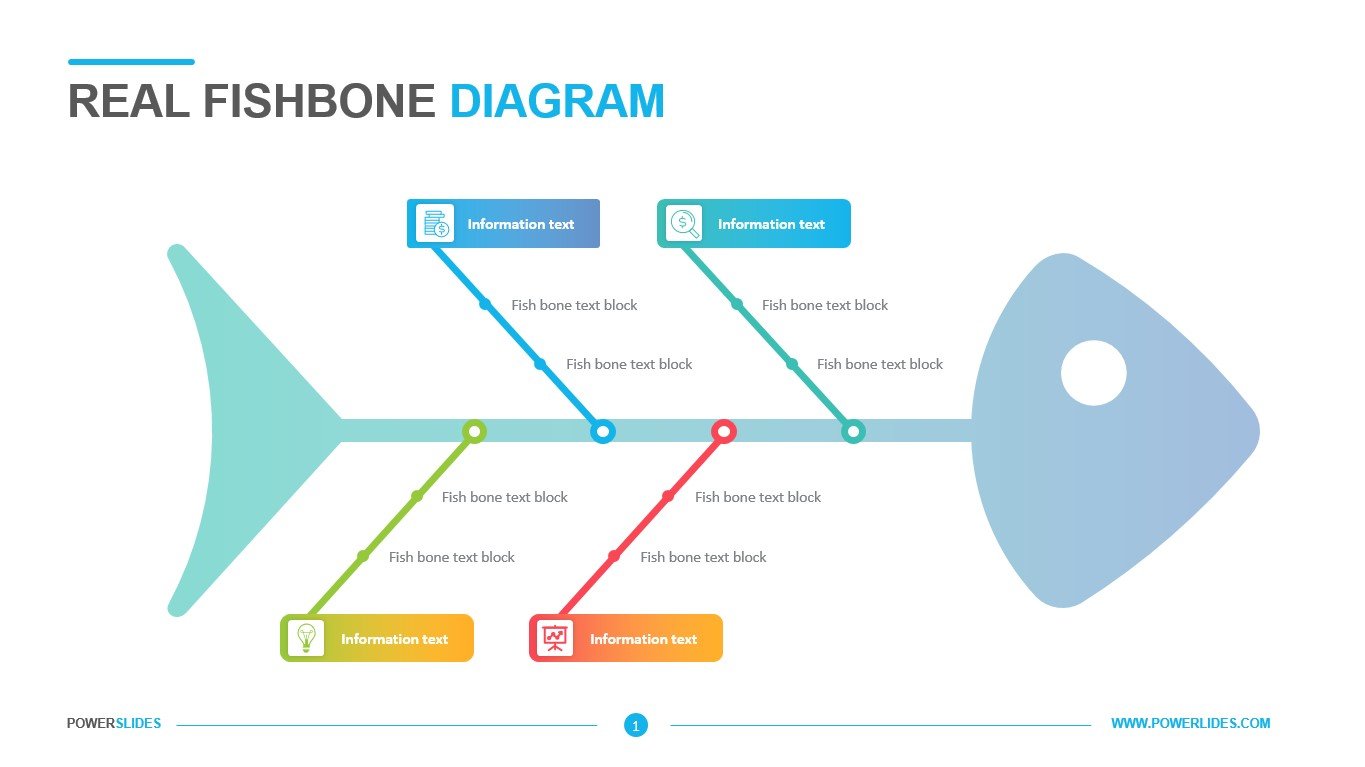
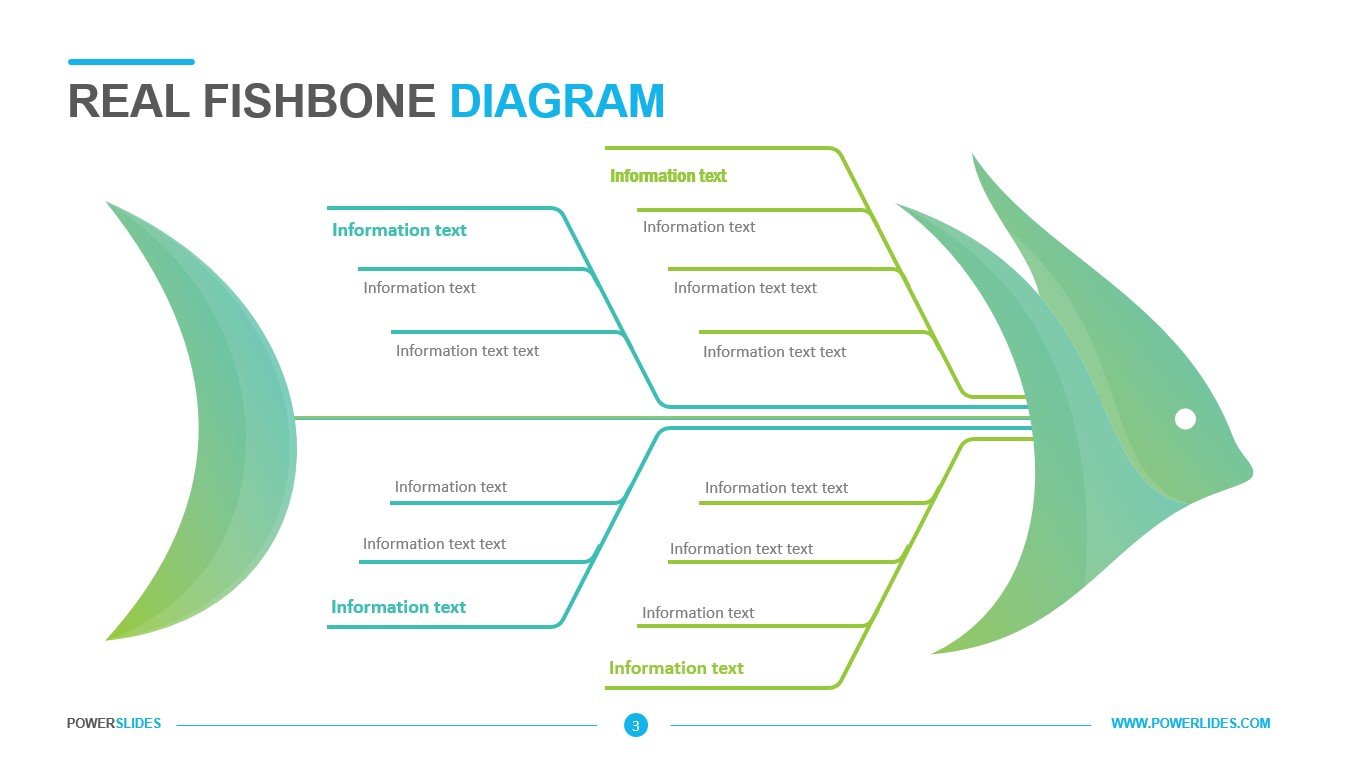
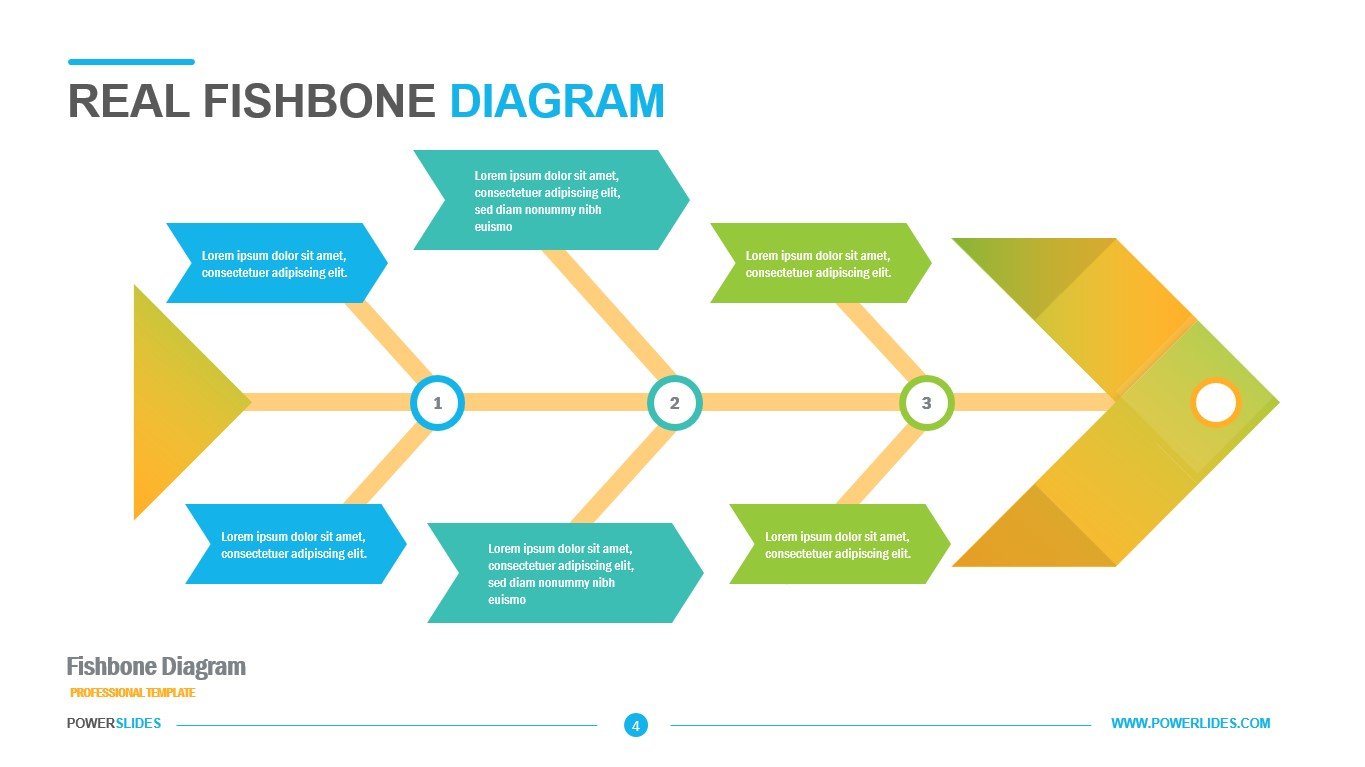
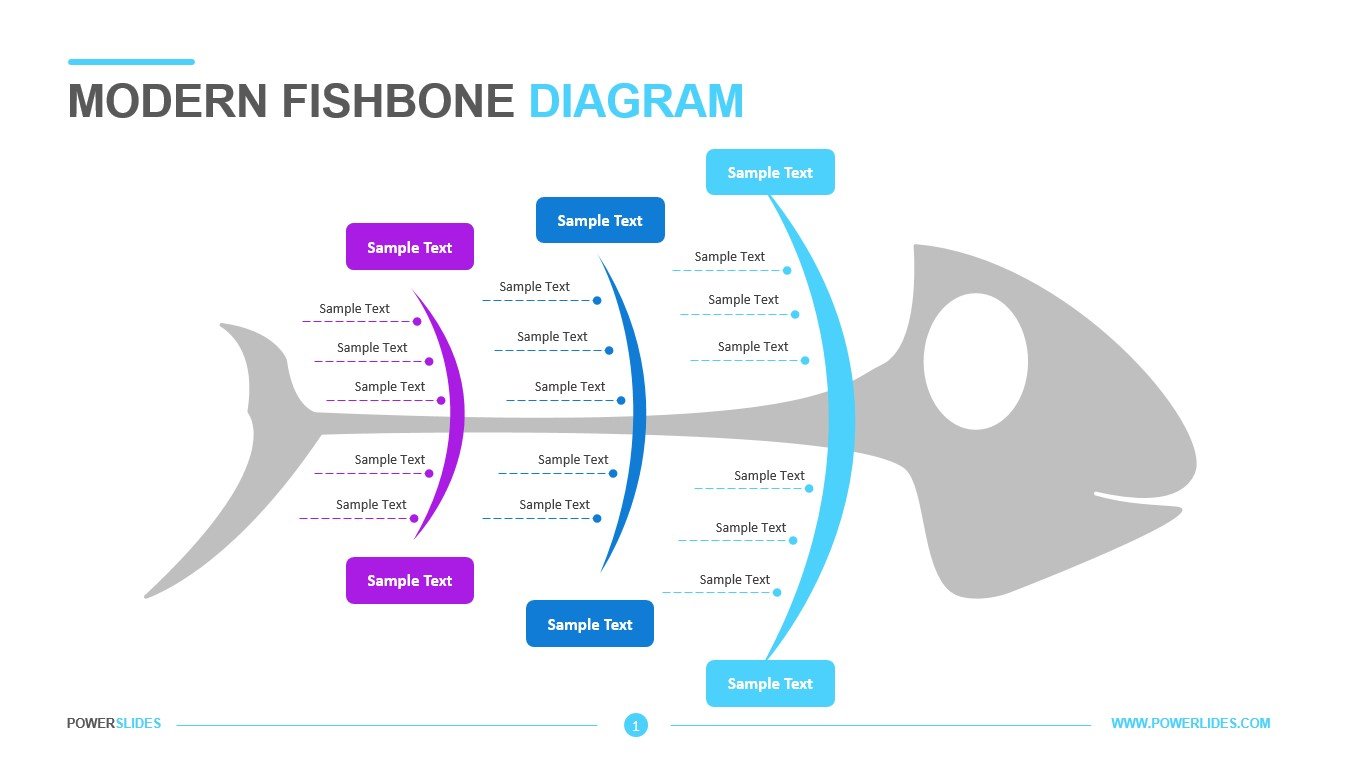
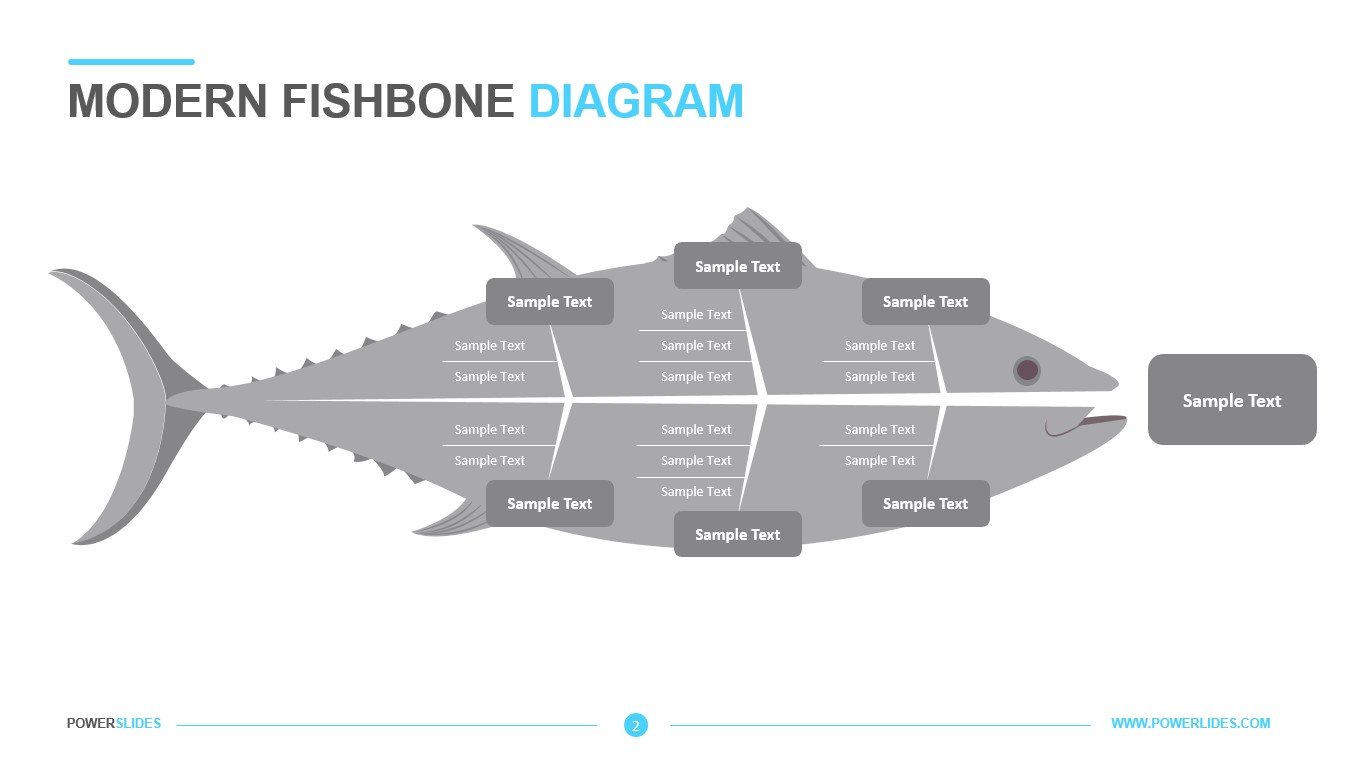
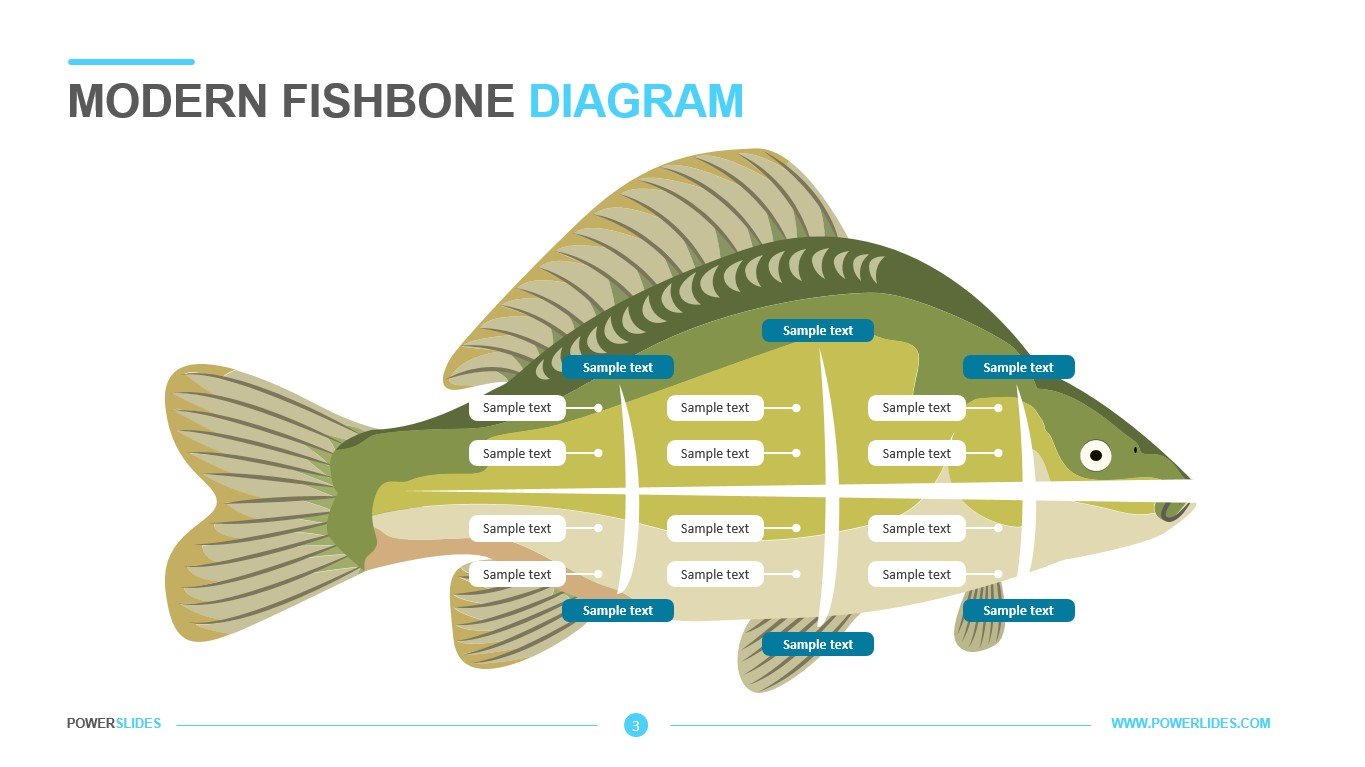
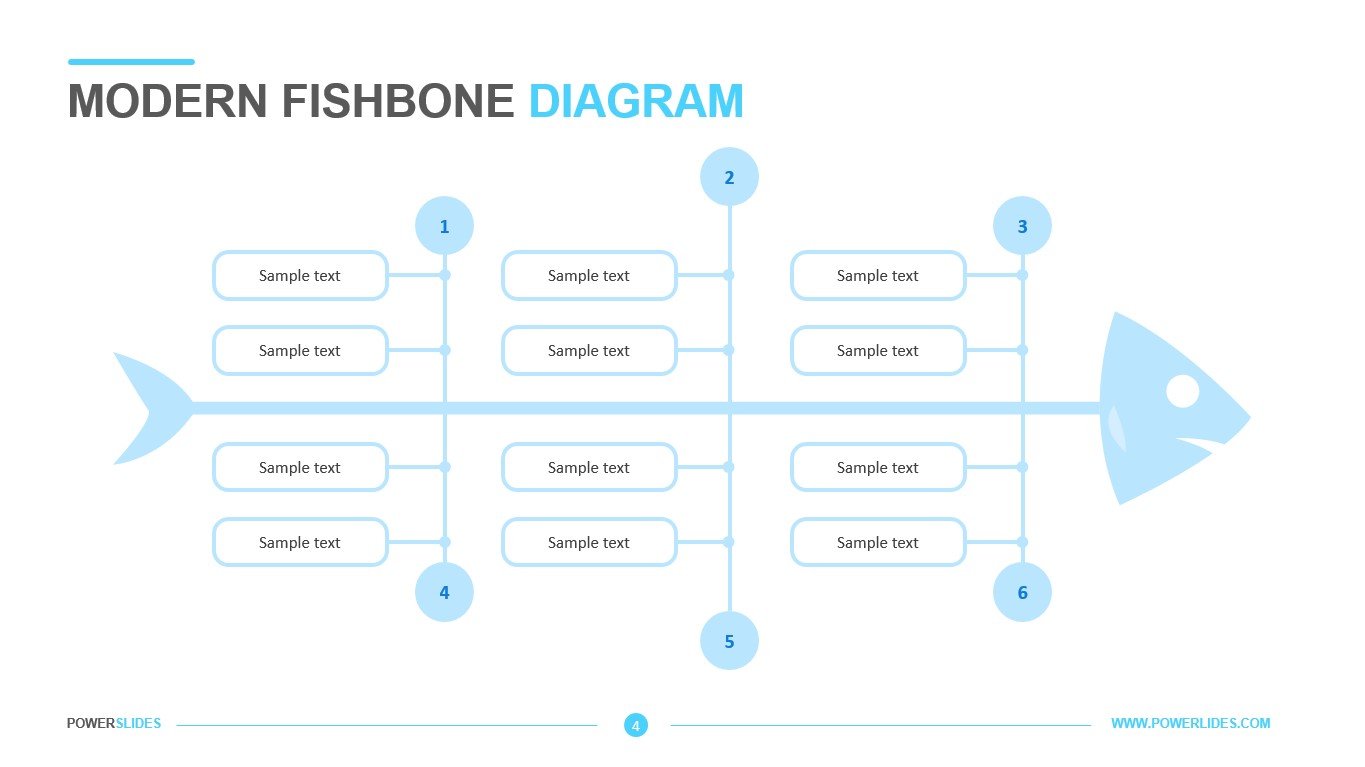
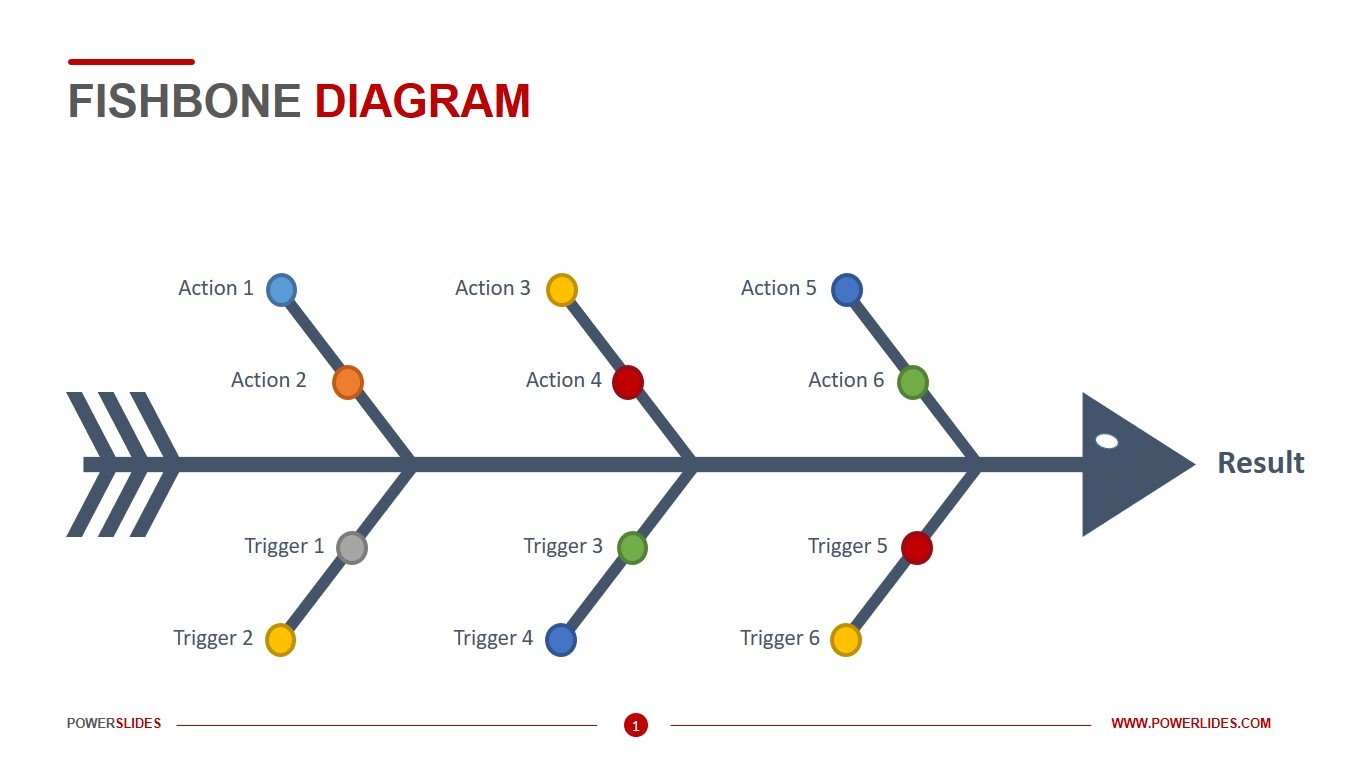
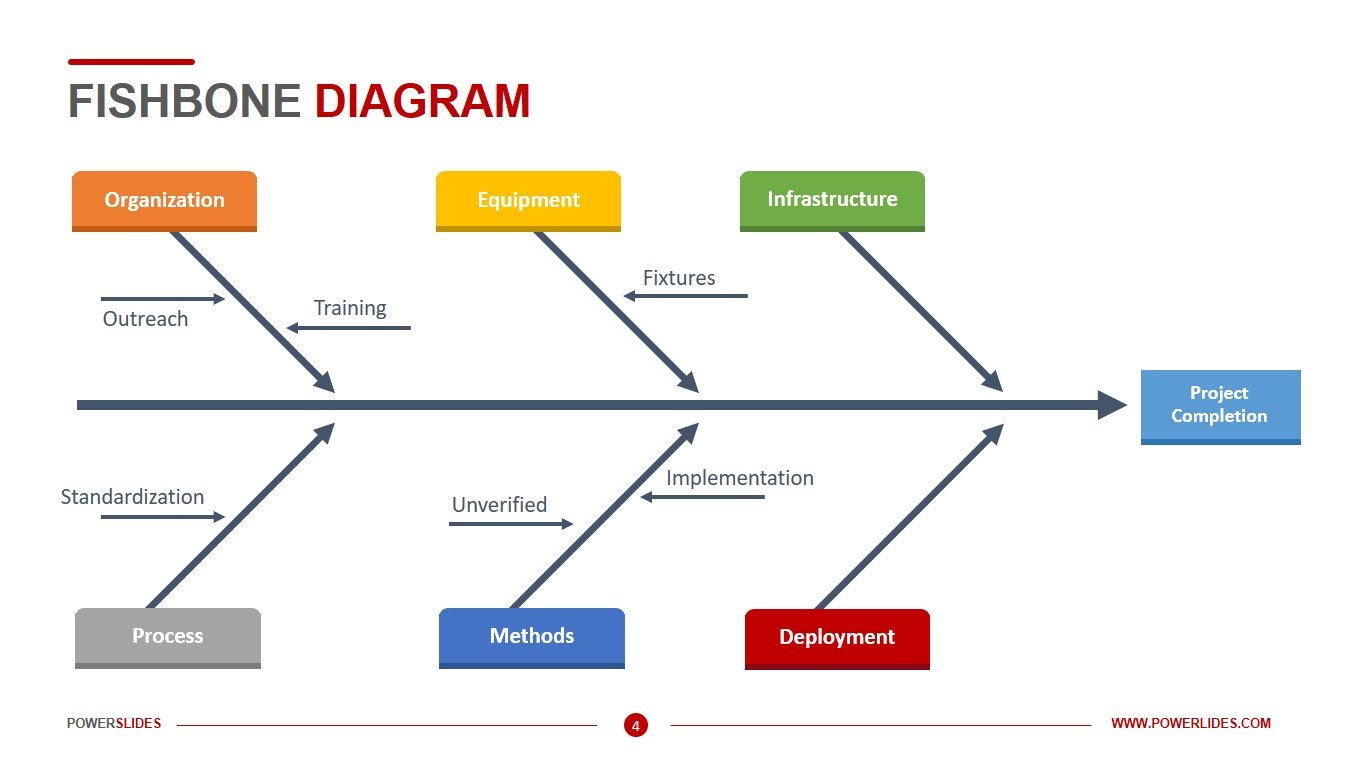
Fishbone Diagram Template For PowerPoint
SKU: U6QY135

 (4.50/ 5)
18 ratings Loading...
What do you think of this template?
(4.50/ 5)18 ratings

Add to Favourites
 4 Slides
 File size: 16:9
 Fonts: Lato Black, Calibri
 Supported version
PPT 2010, PPT 2013, PPT 2016
Supported version
PPT 2010, PPT 2013, PPT 2016

Product details
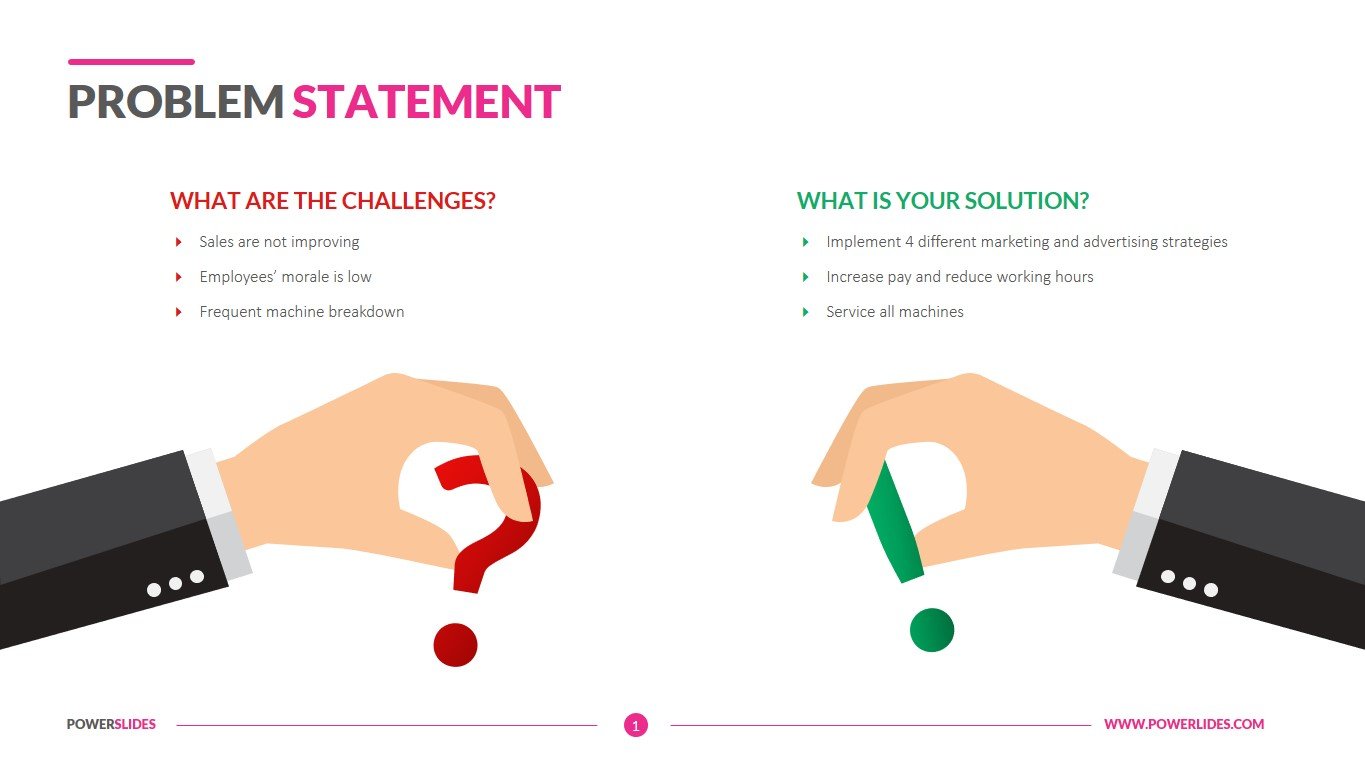
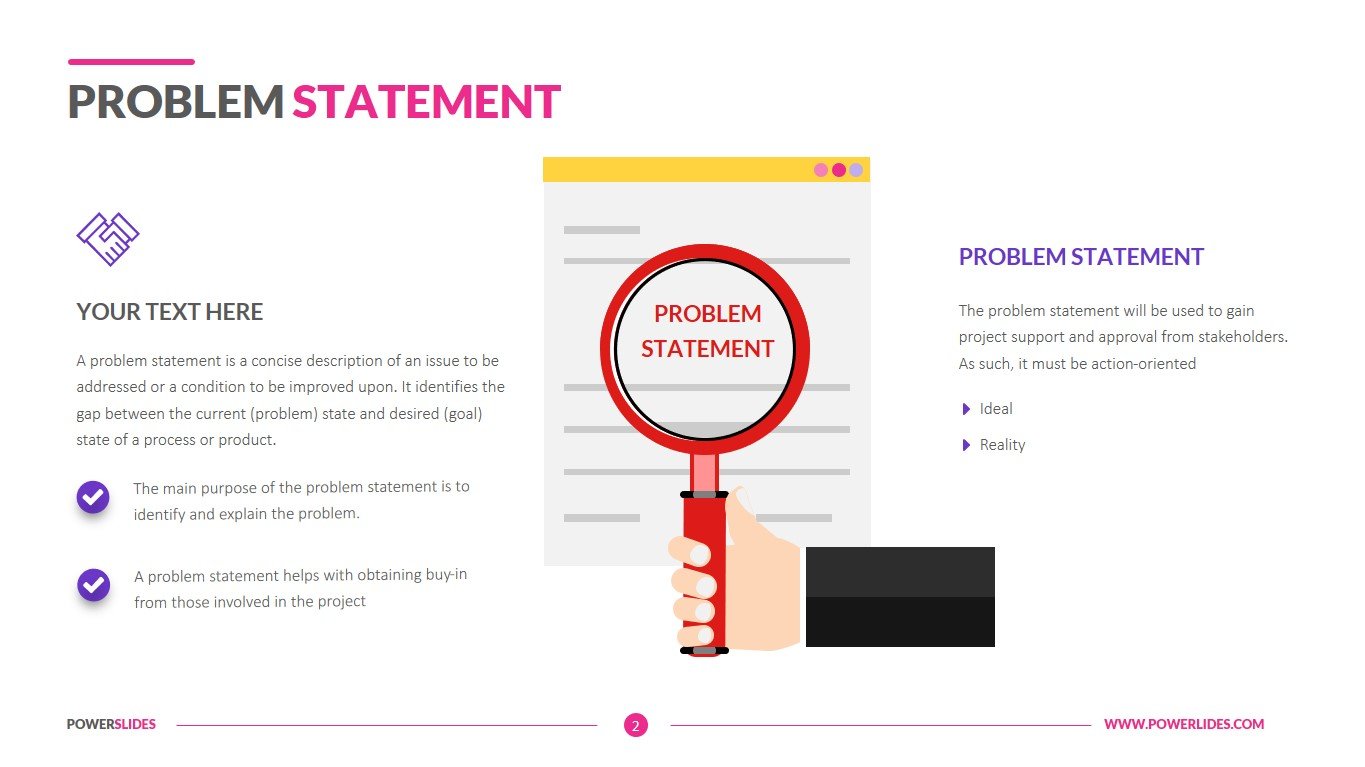
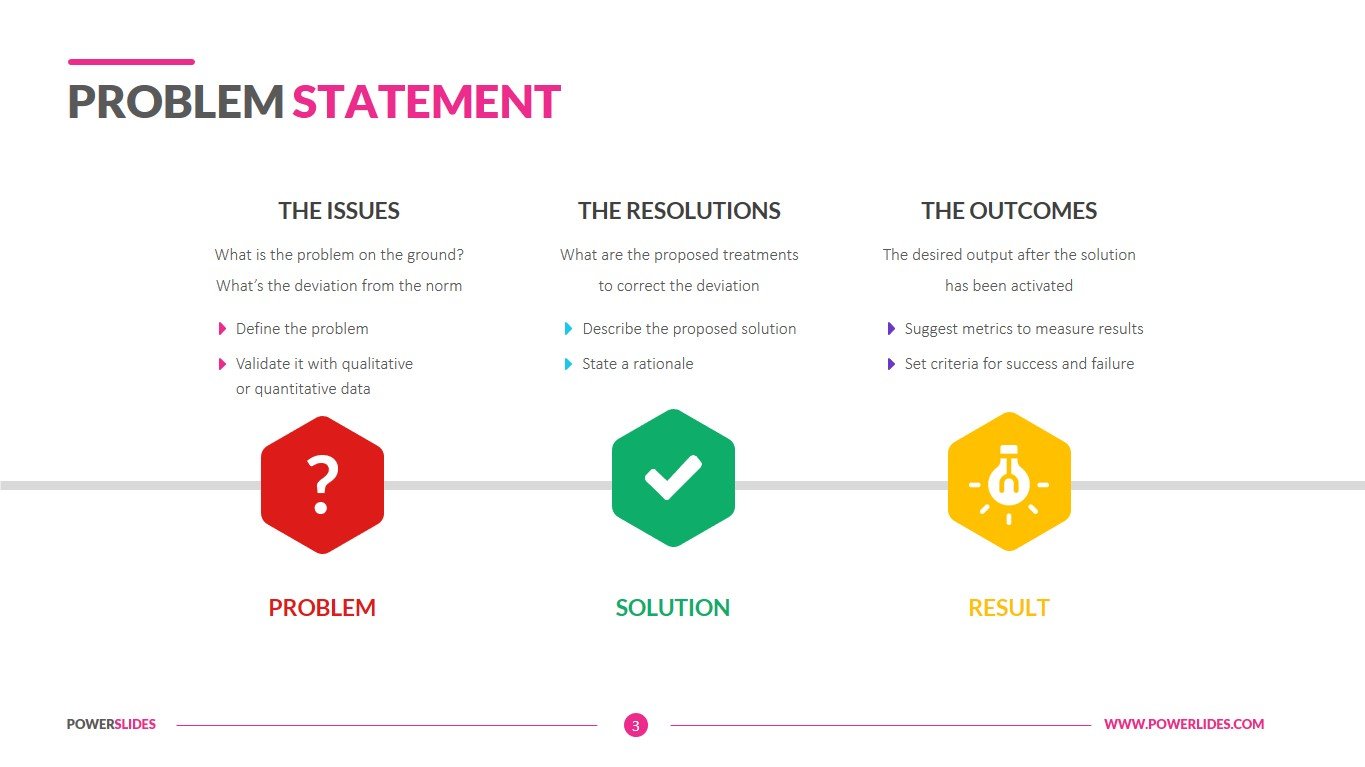
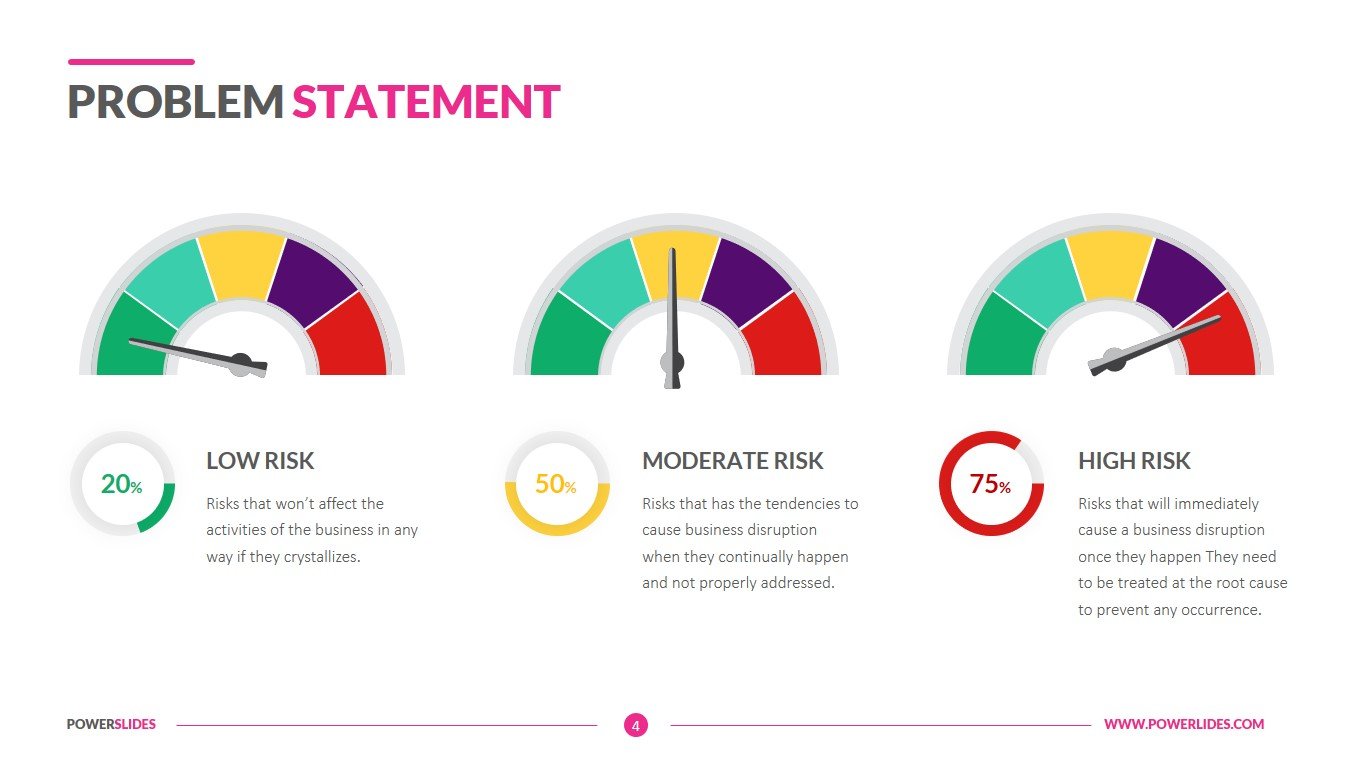
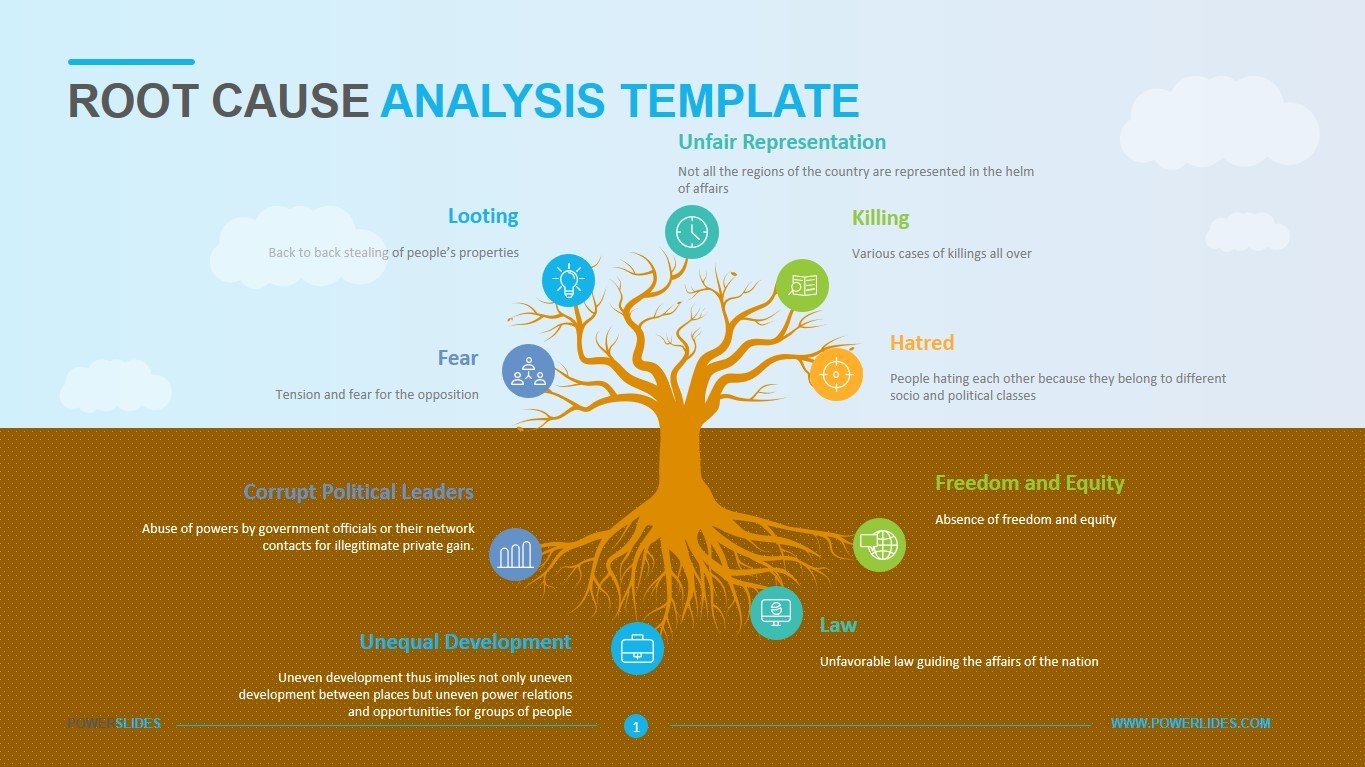
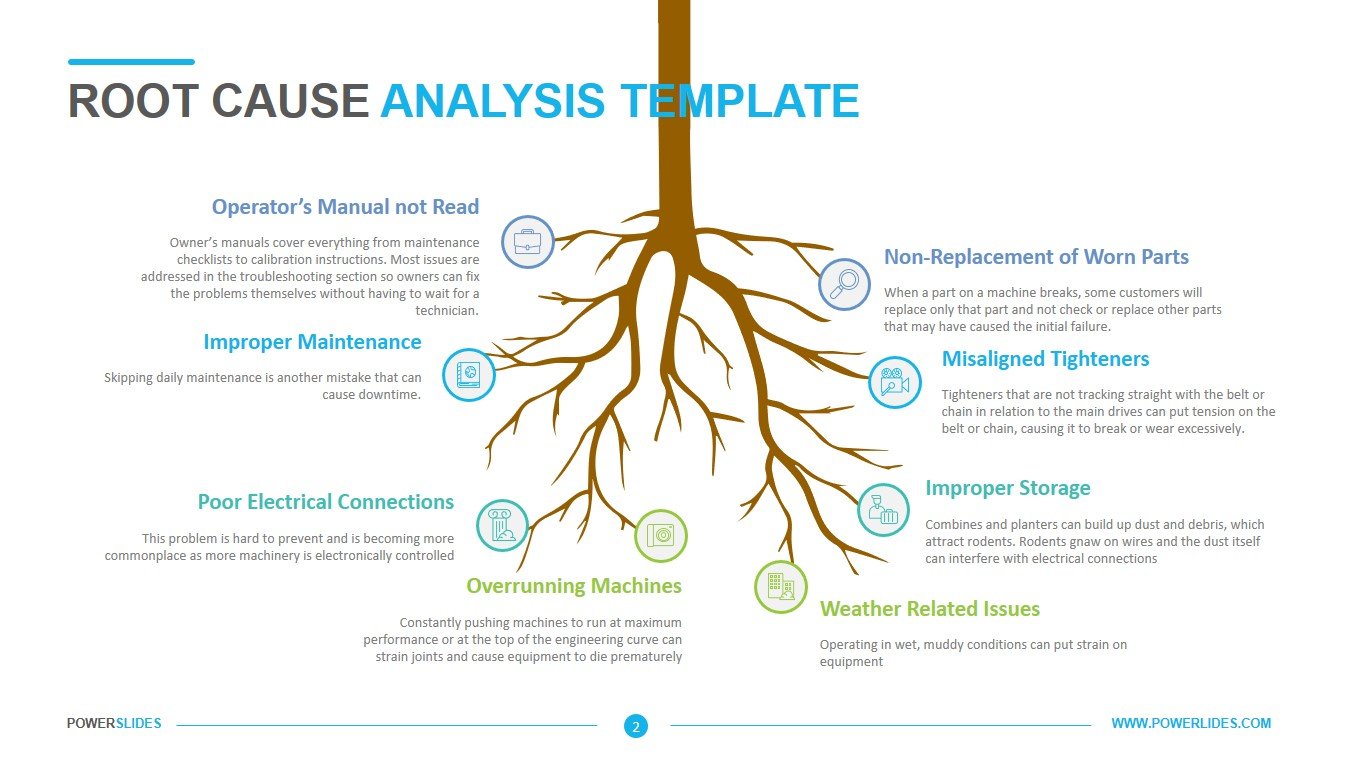
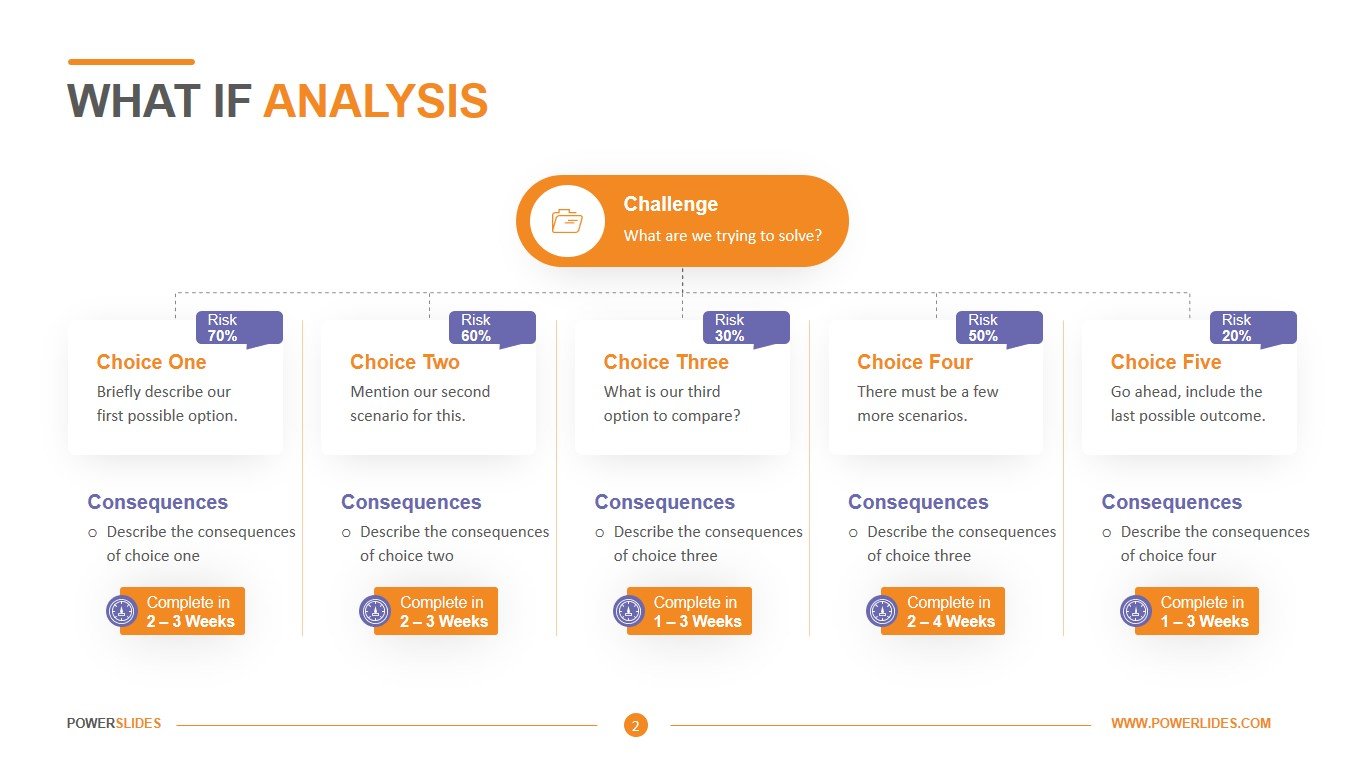
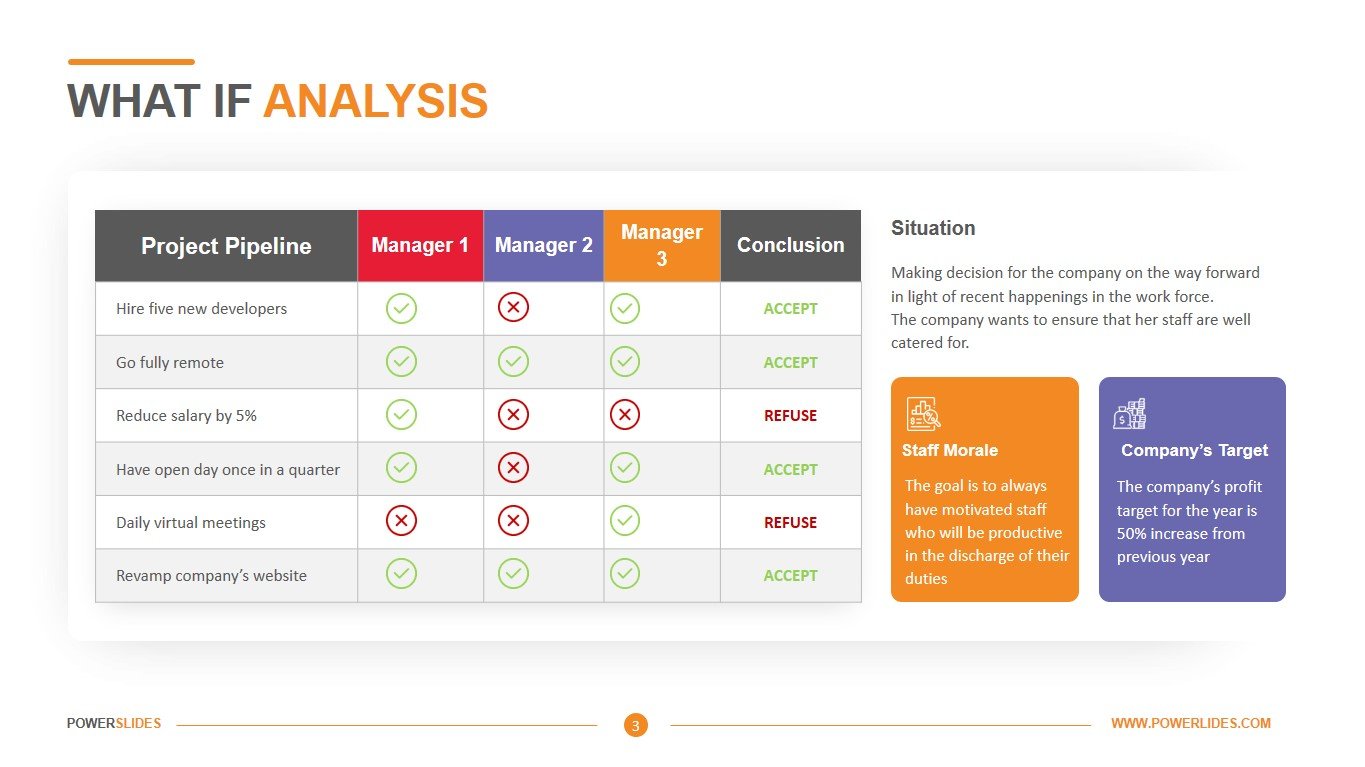
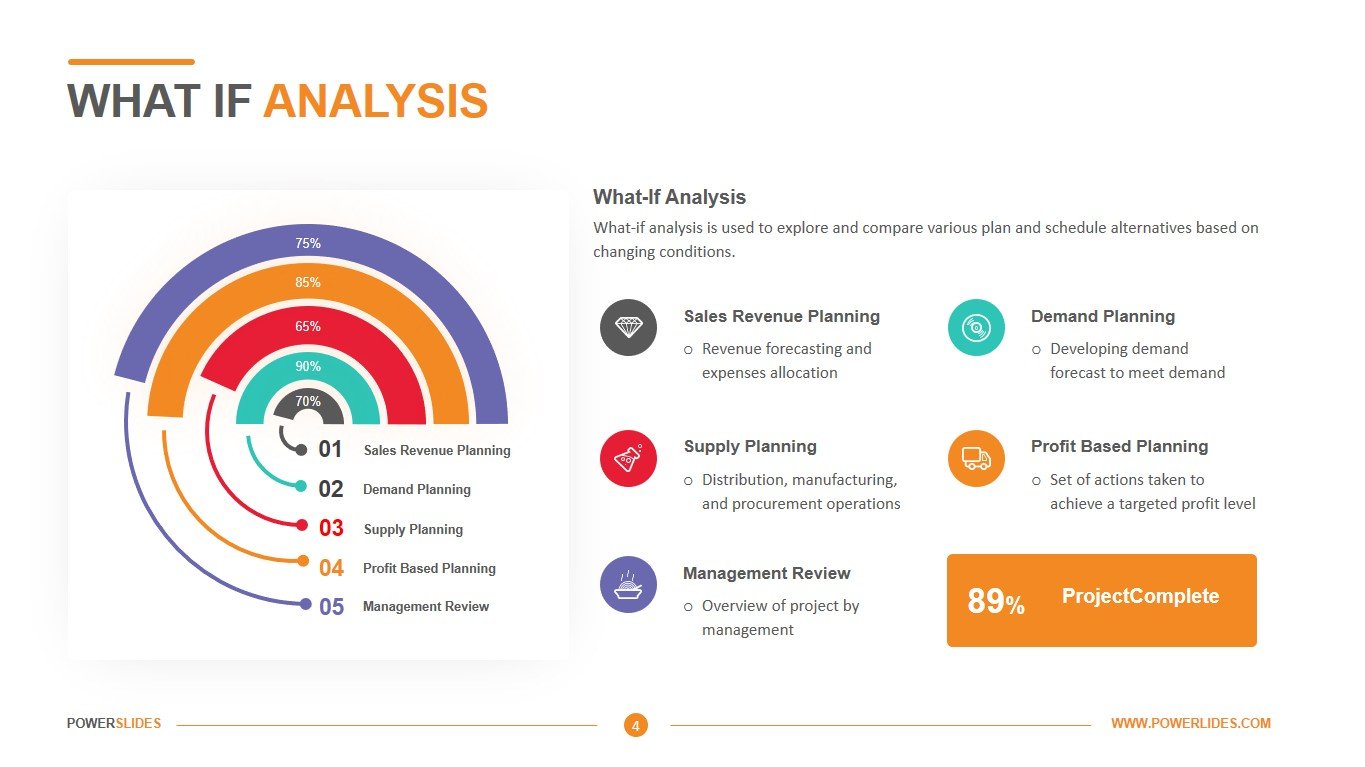
Fishbone Diagrams templates are all you need to create your very own cause and effect presentations. Analyzing causes of problems or difficulties in a process, showing deviations in quality of product or service to identifying areas for data collection, our colorful fishbone templates can help you do it all. This collection is suited for professionals working in a wide range of industries and verticals.


