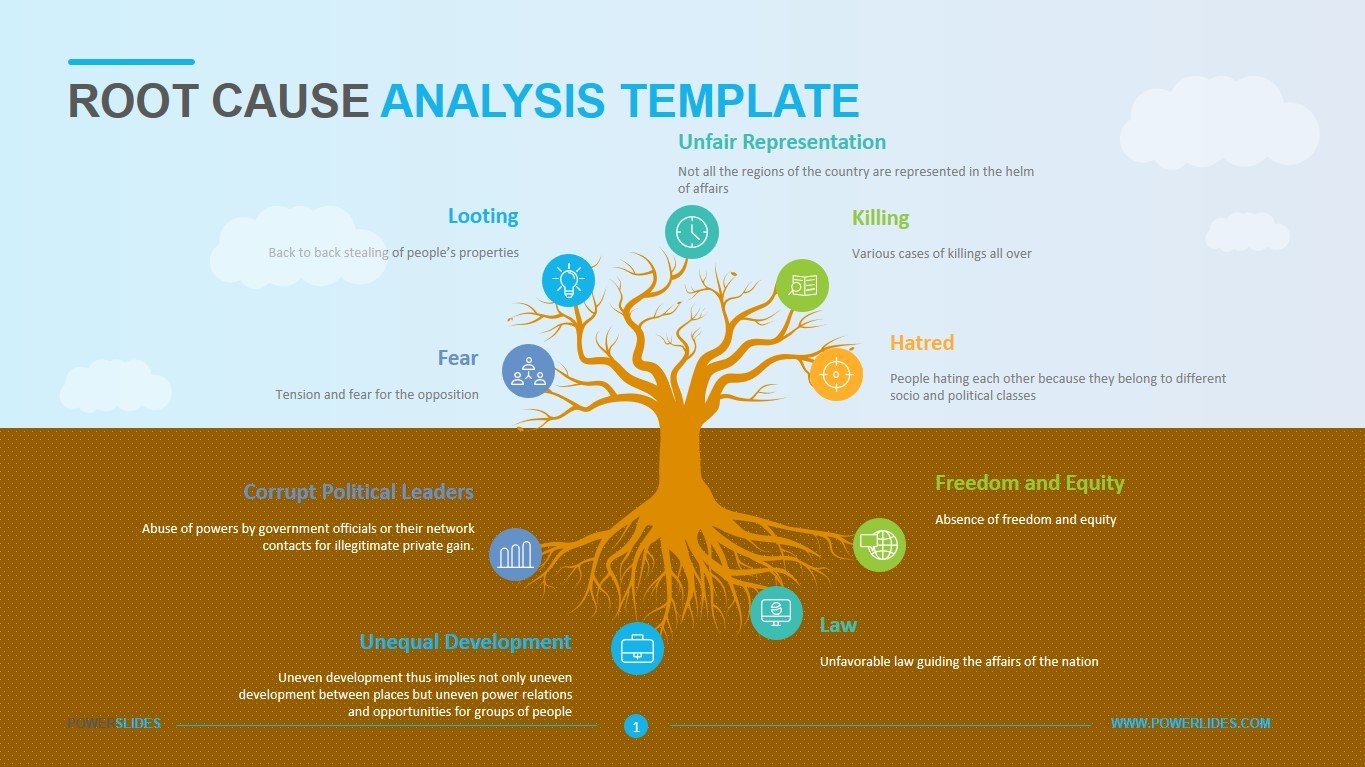
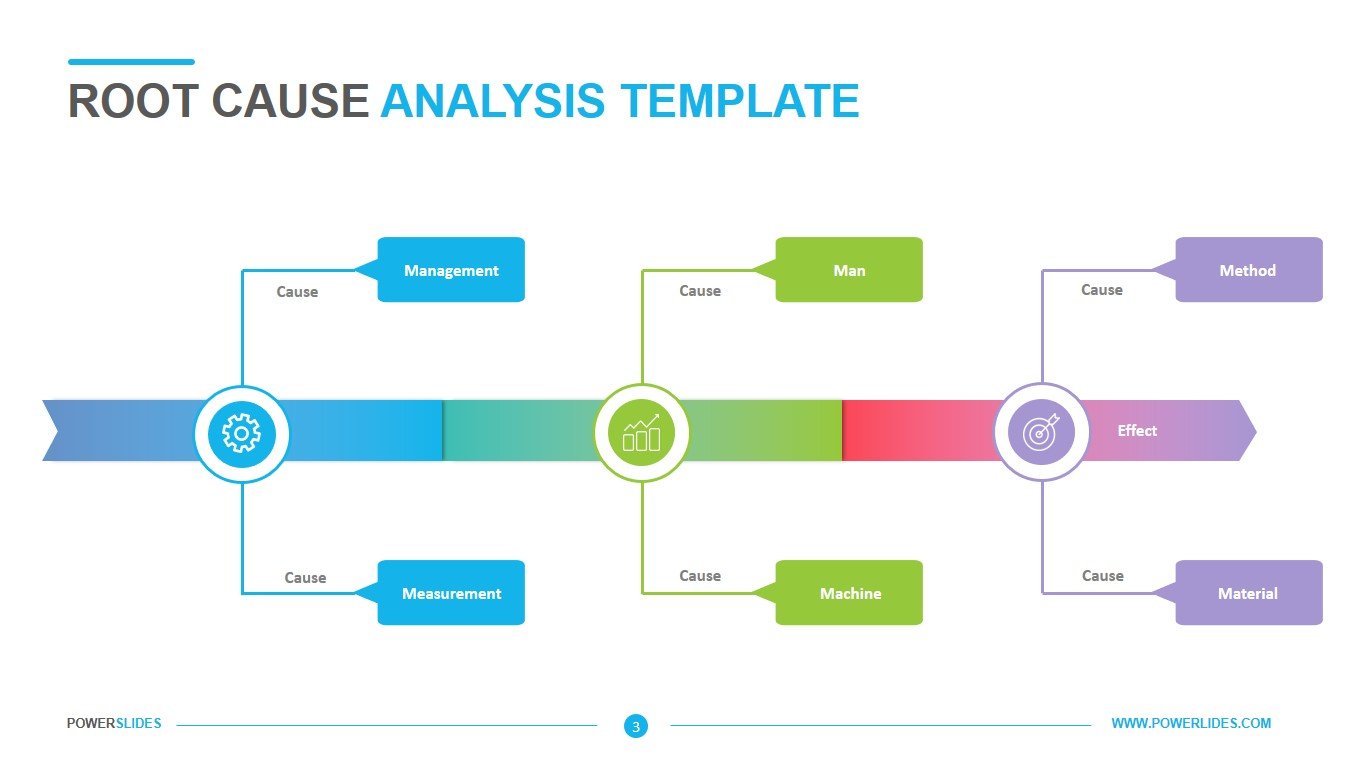
Real Fishbone Diagram
What do you think of this template?
 (5.00/ 5)
10 ratings

 4 Slides
 File size: 16:9
 Fonts: Lato, Calibri
 Supported version
PPT 2010, PPT 2013, PPT 2016
Supported version
PPT 2010, PPT 2013, PPT 2016

Product details
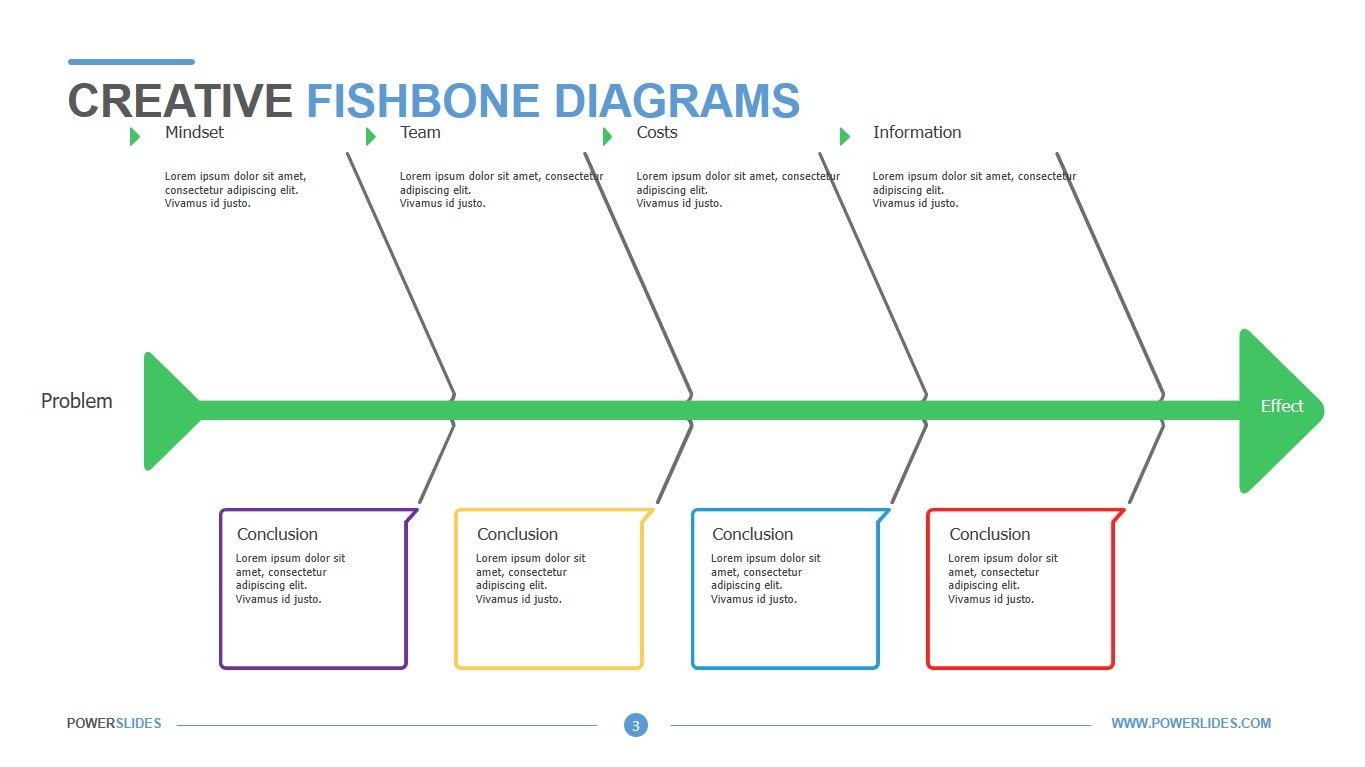
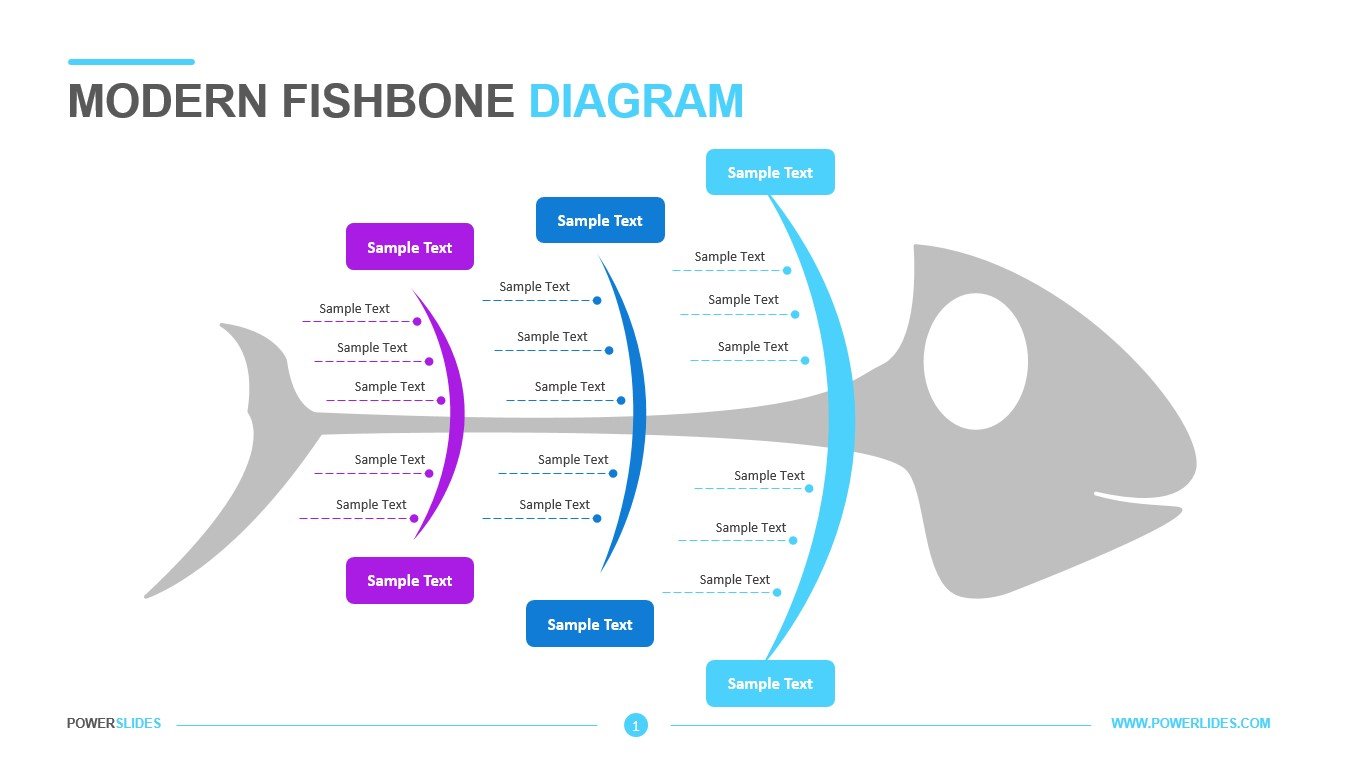
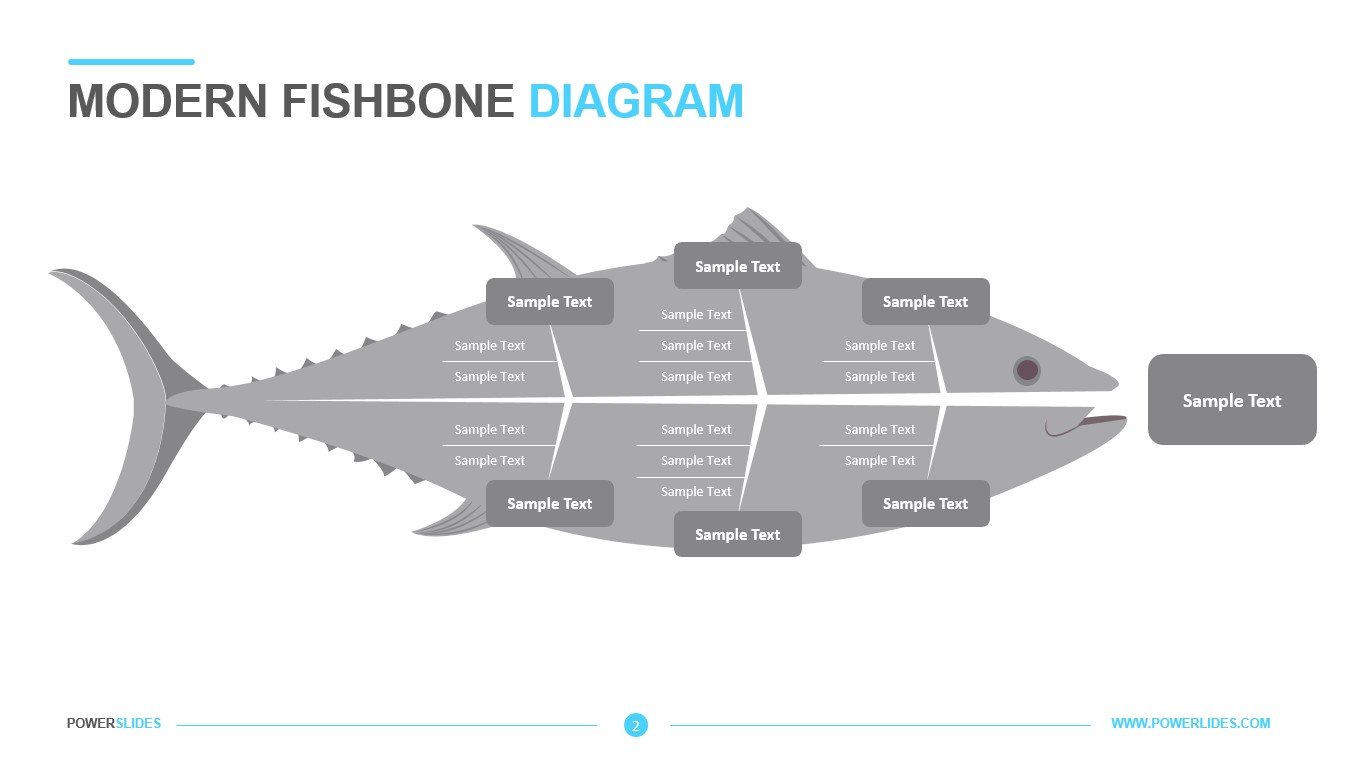
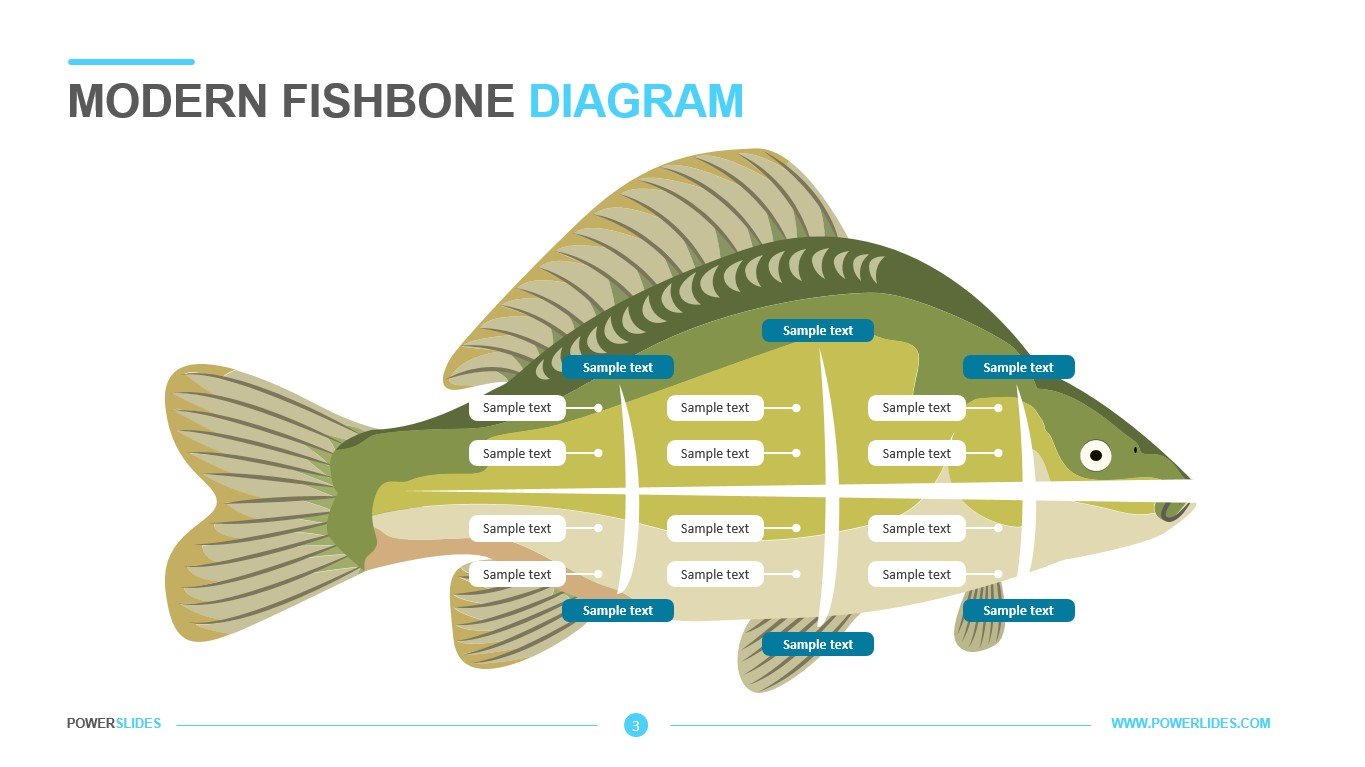
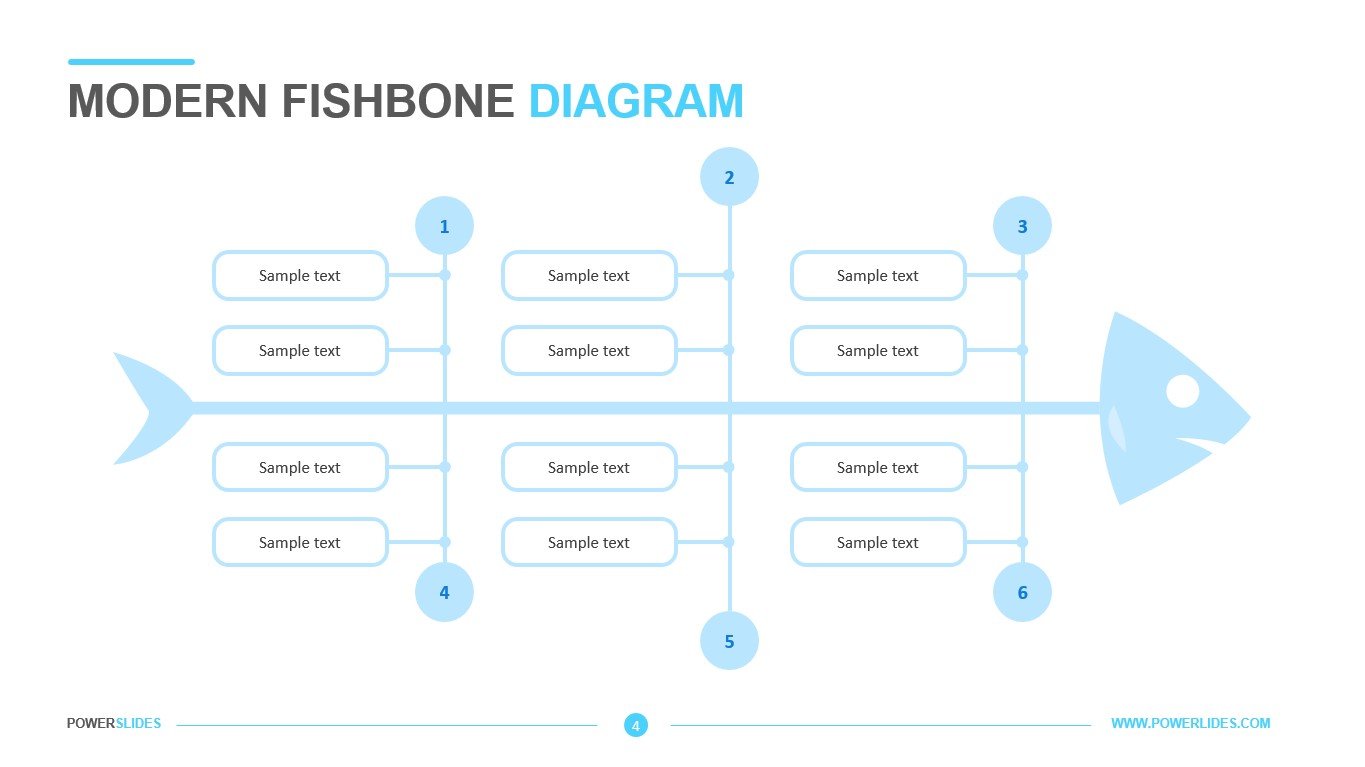
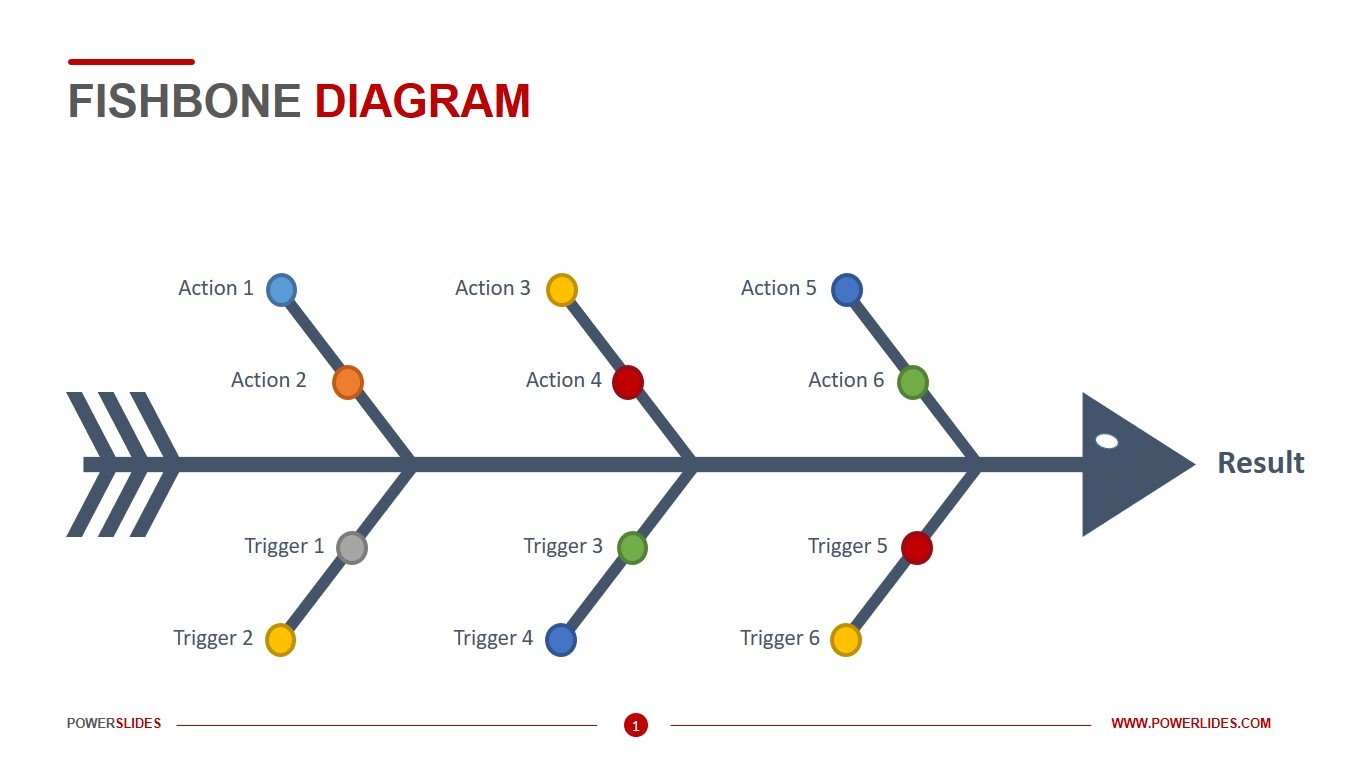
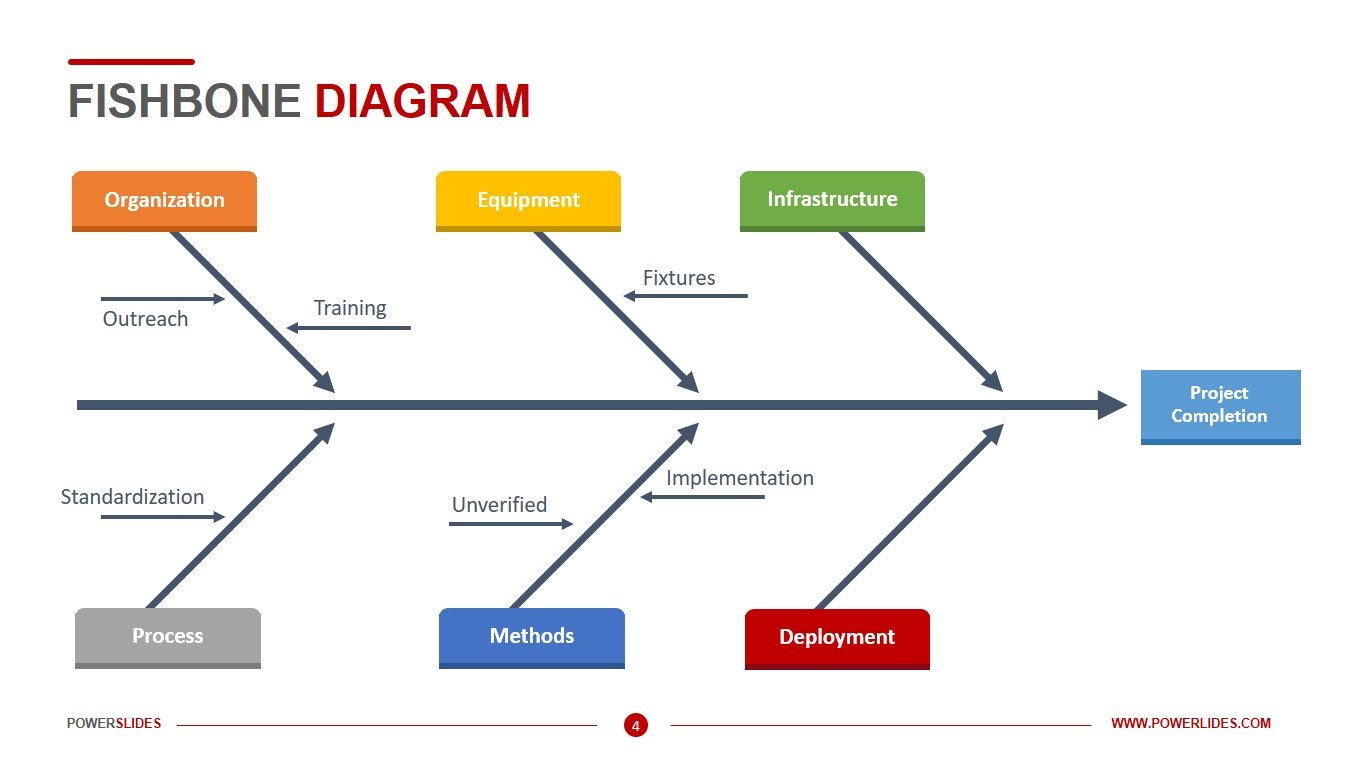
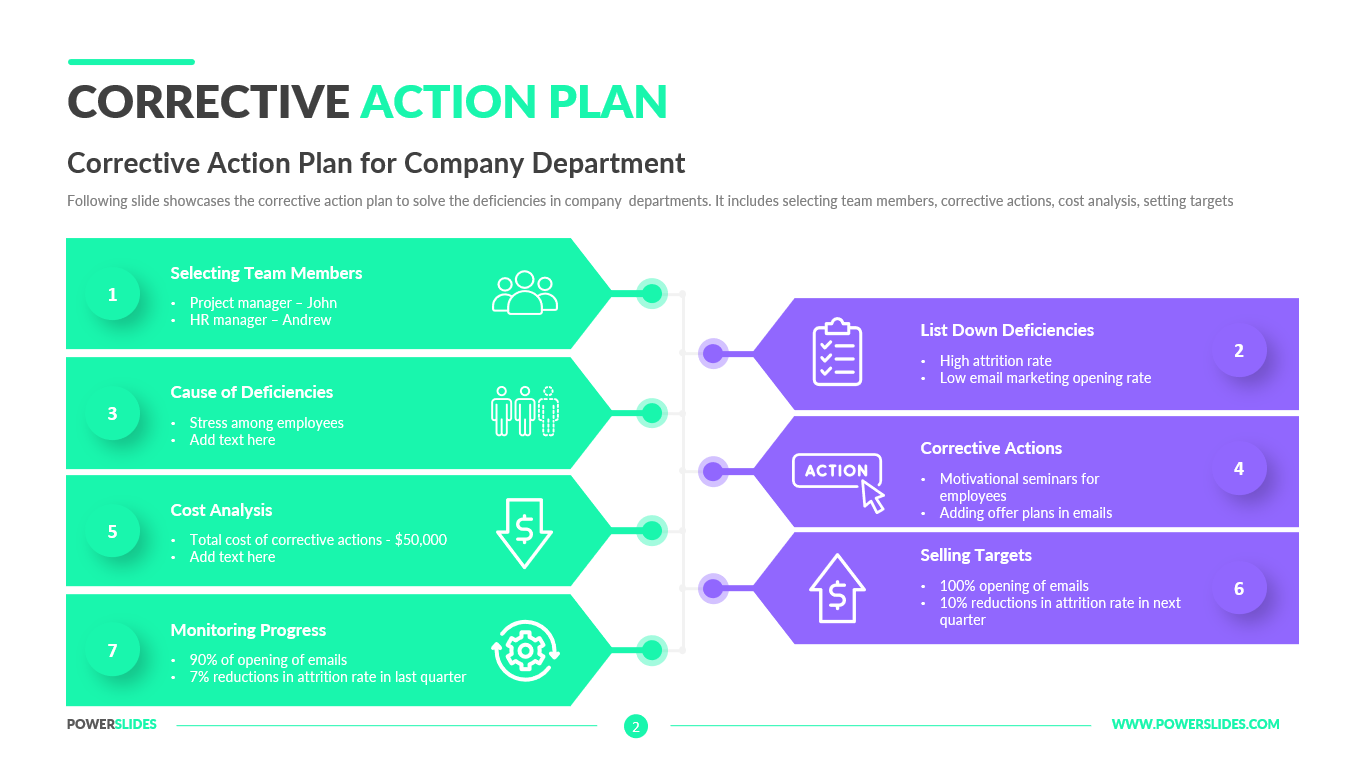
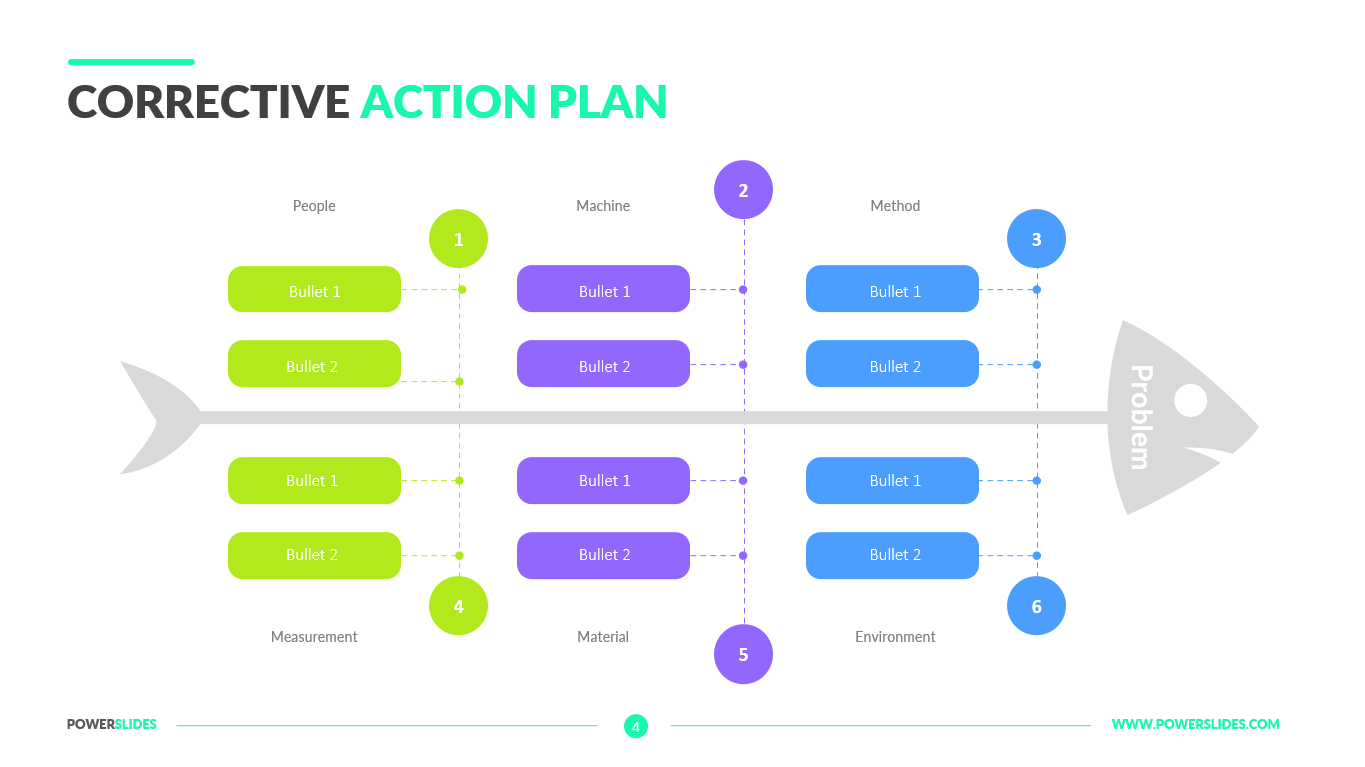
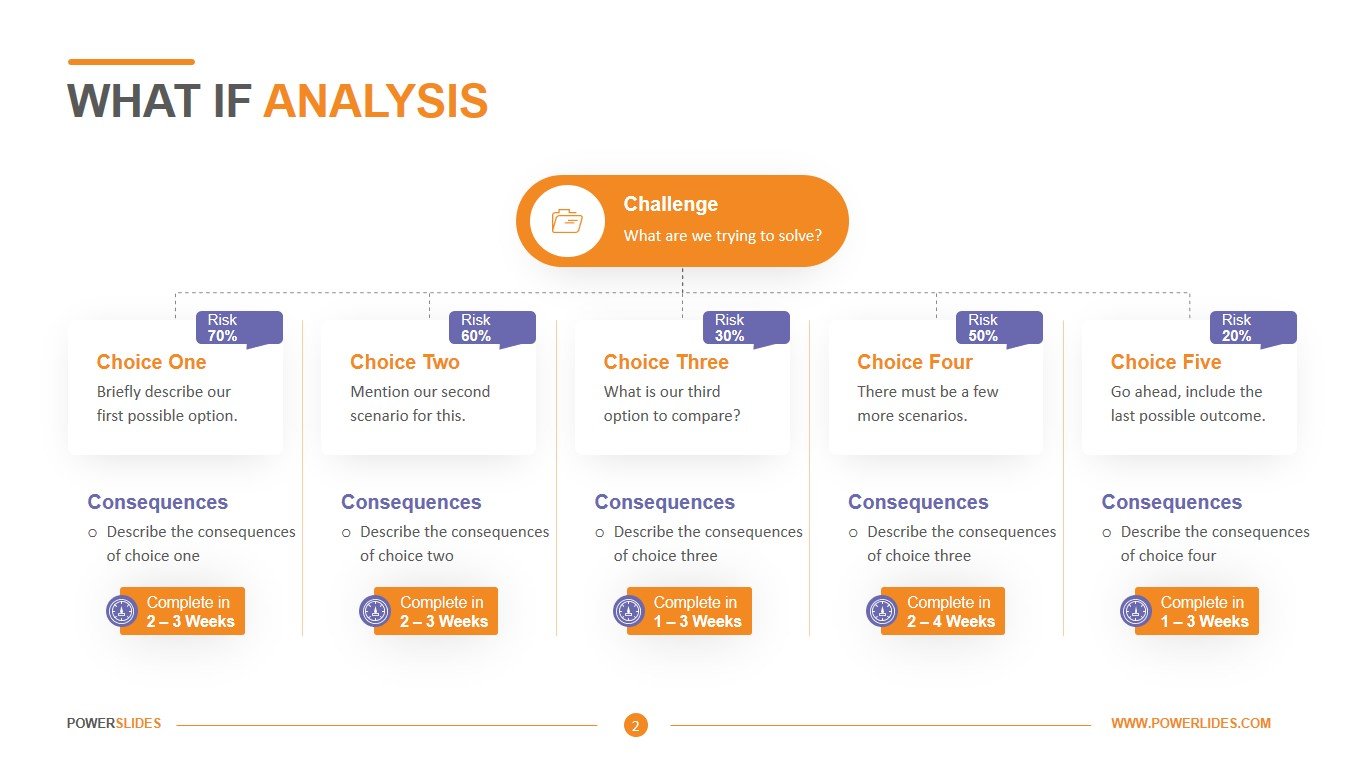
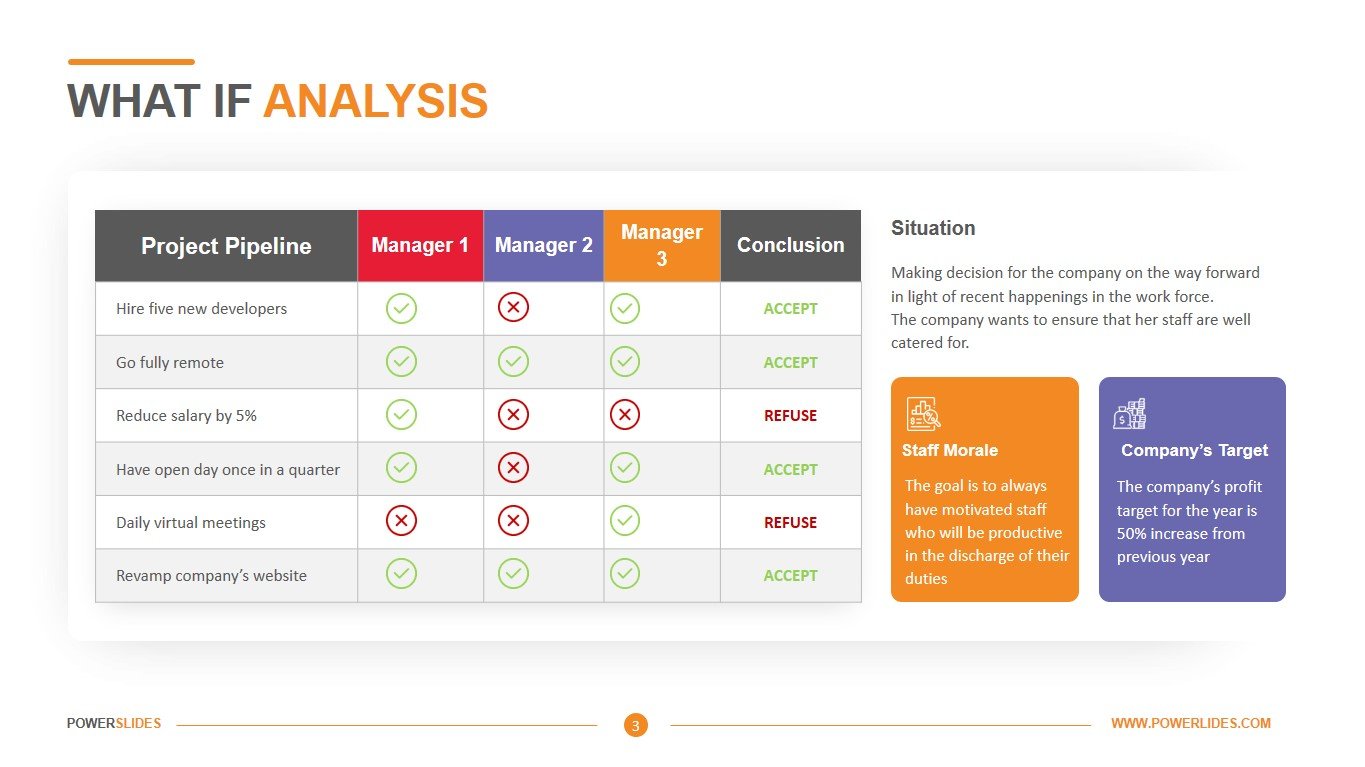
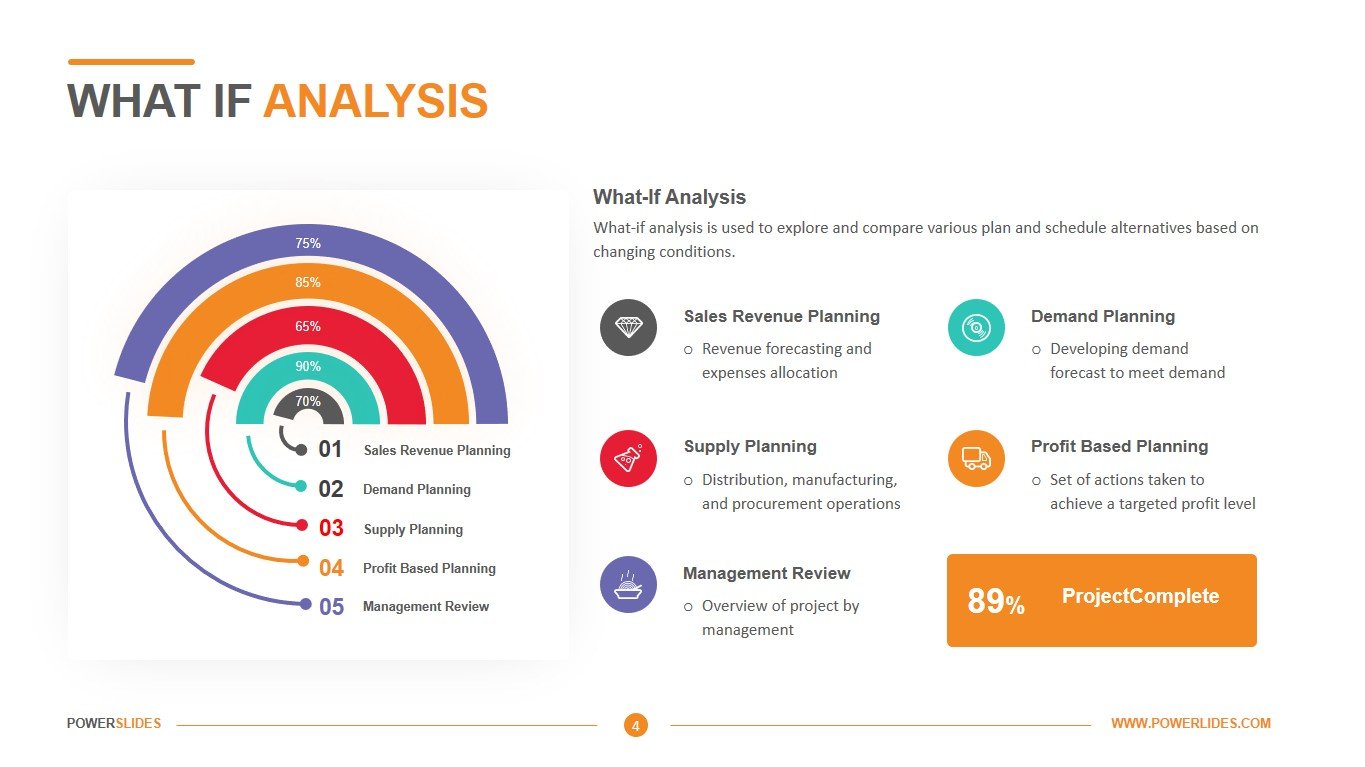
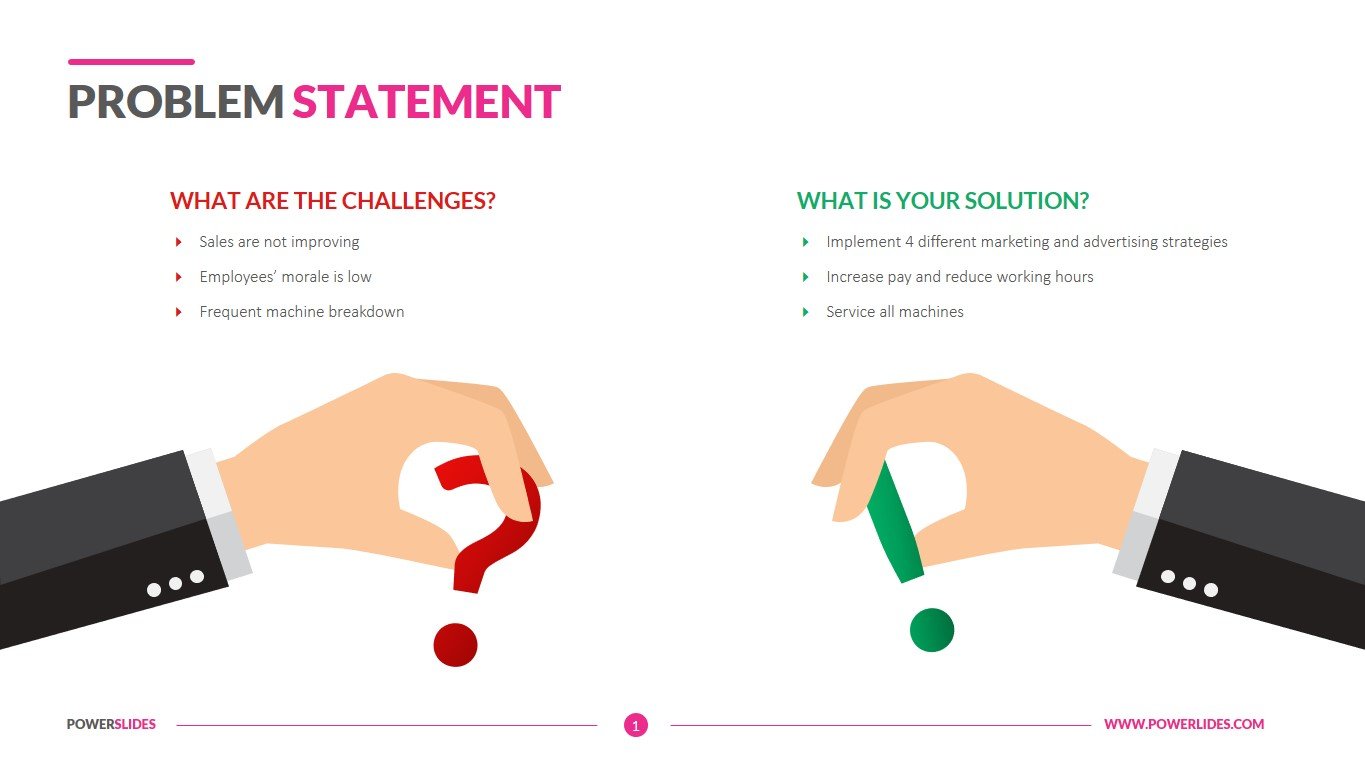
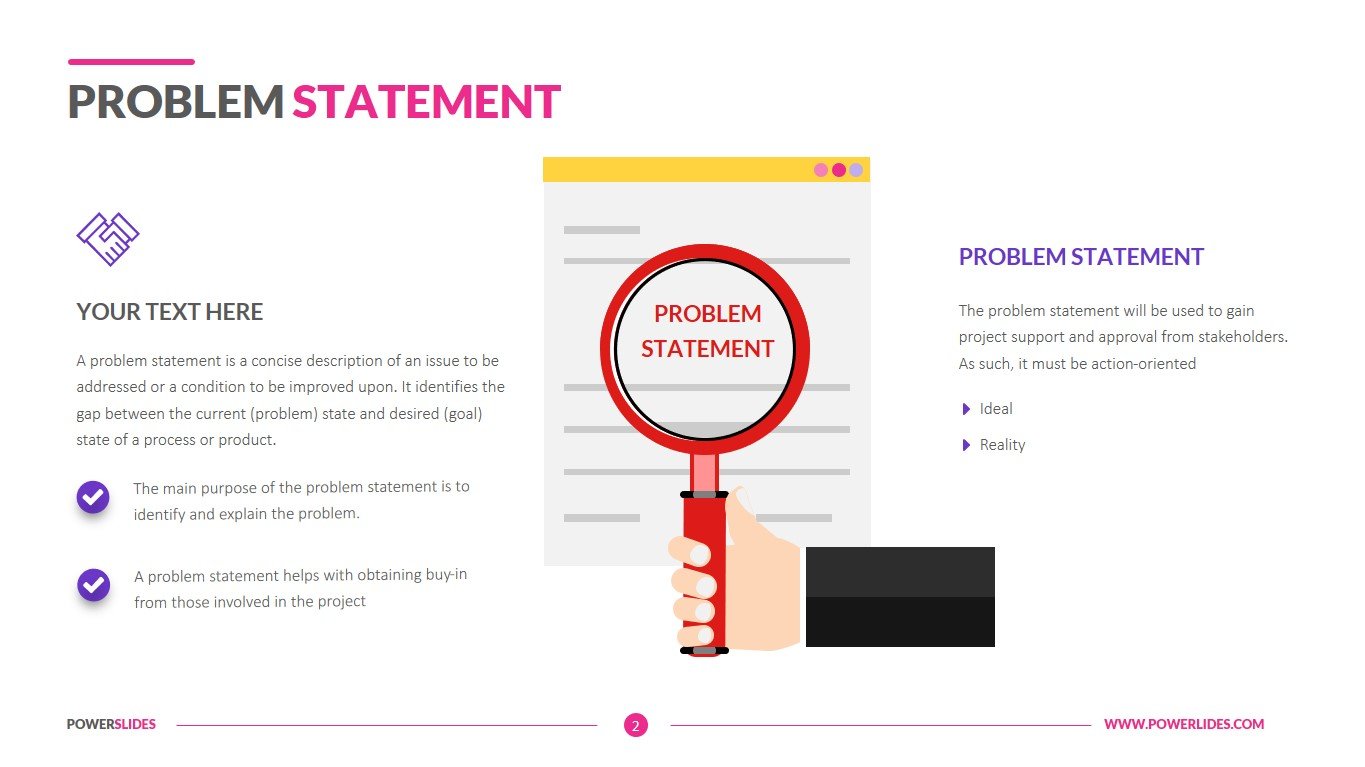
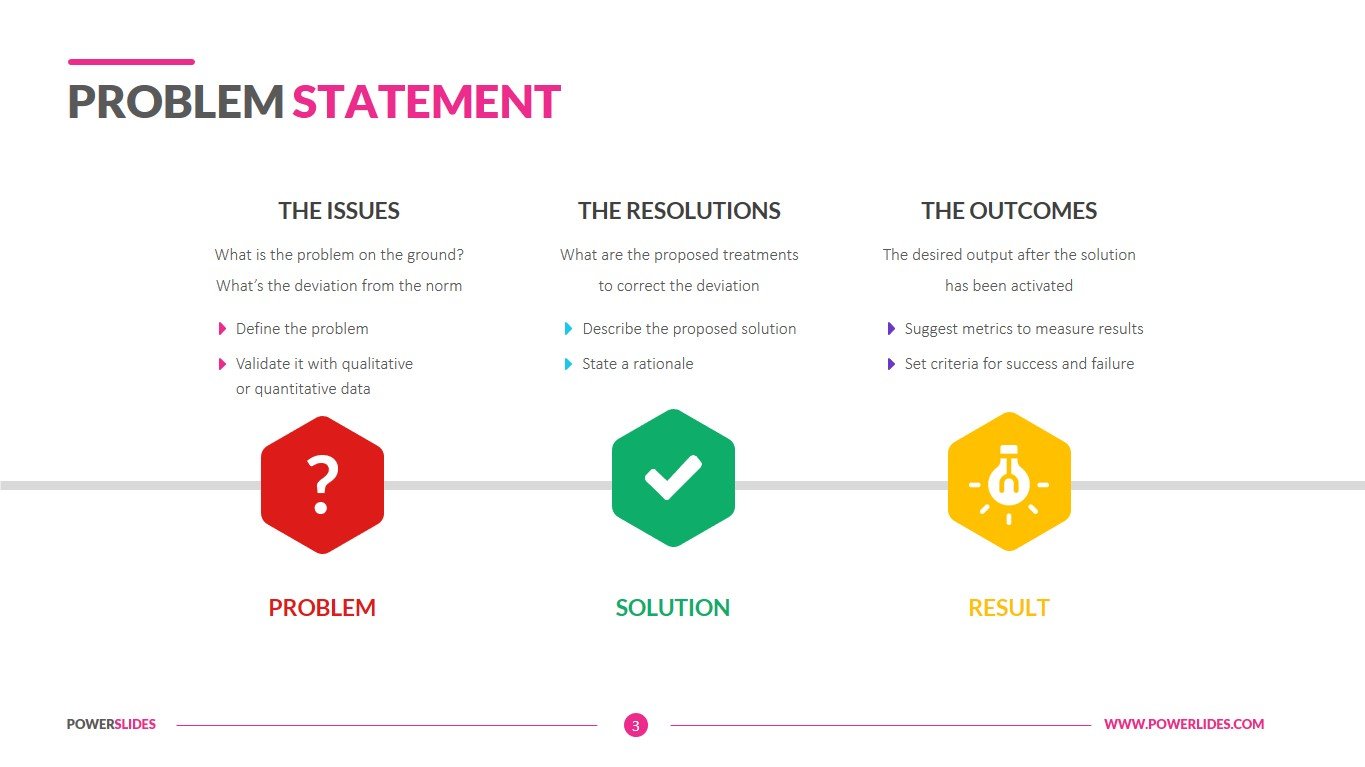
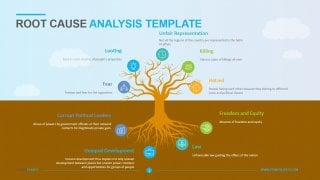
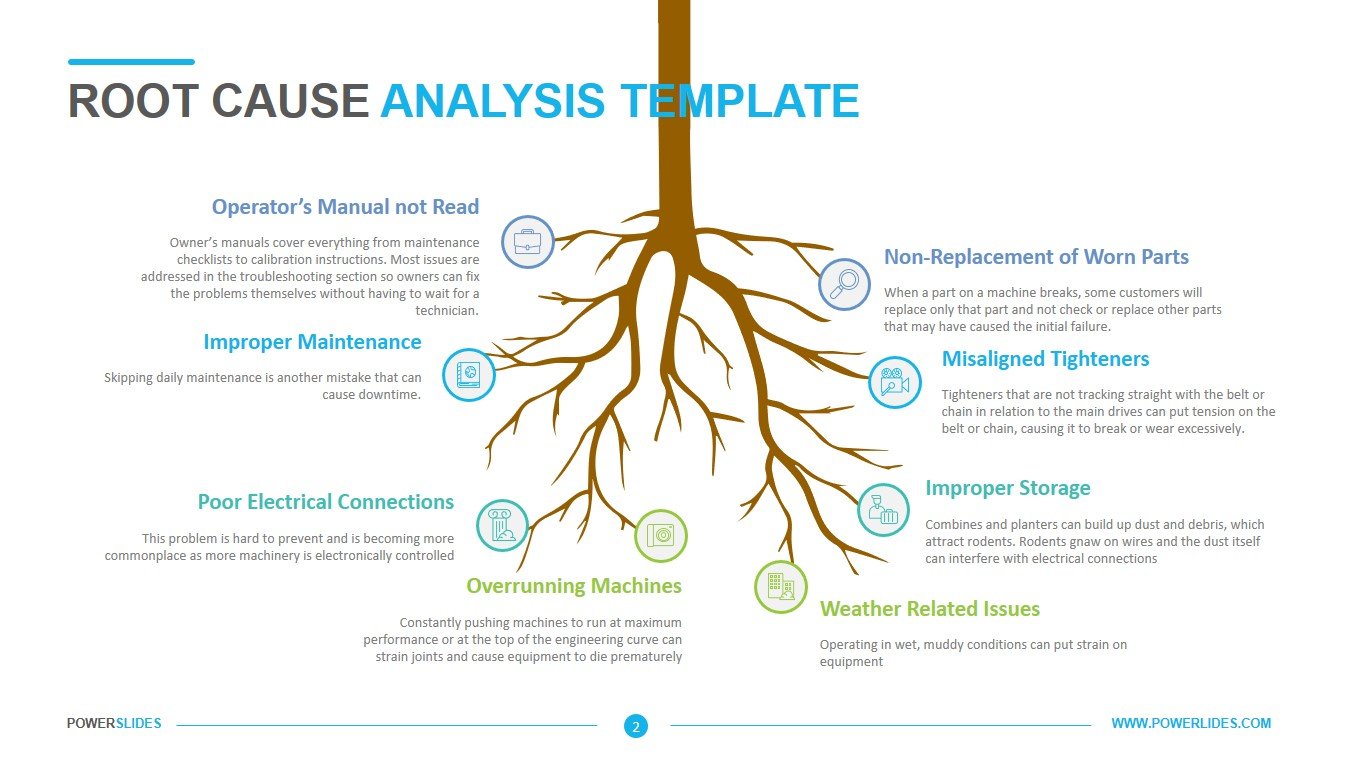
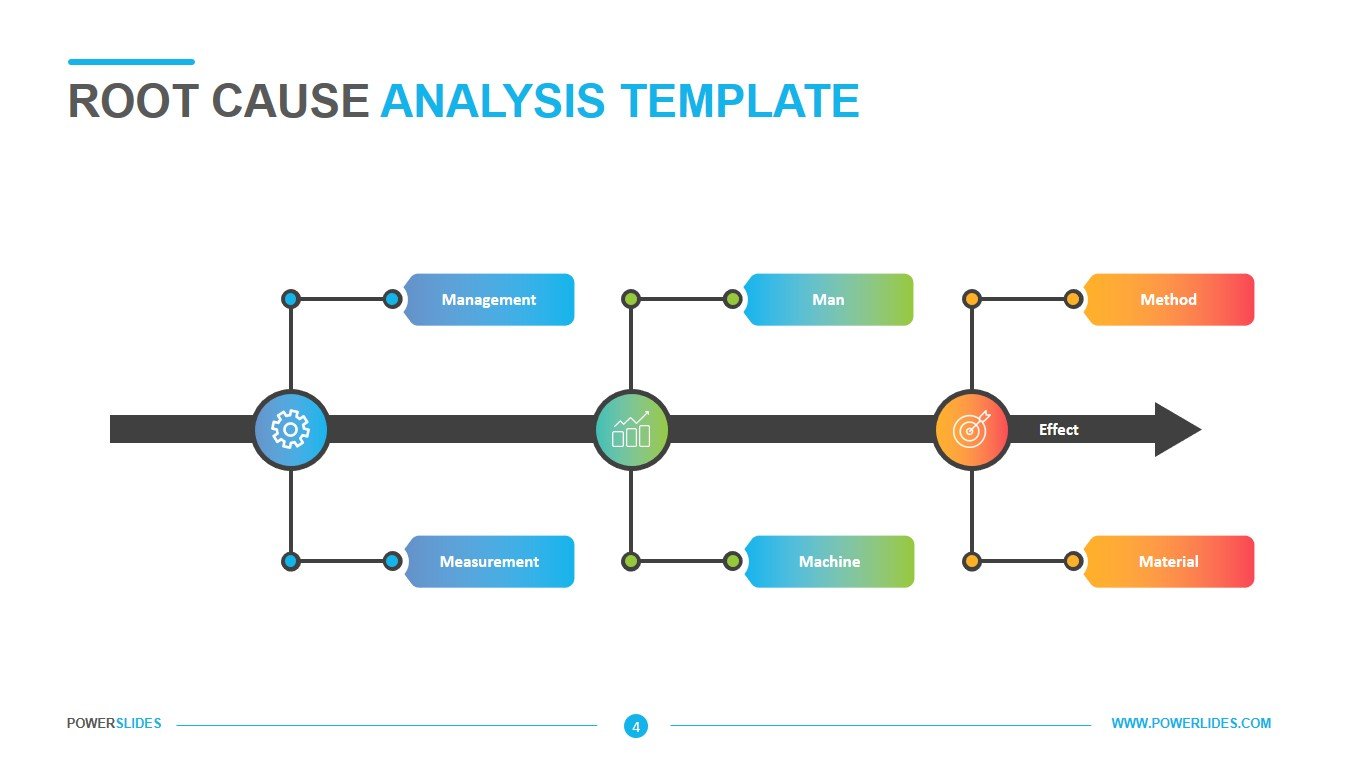
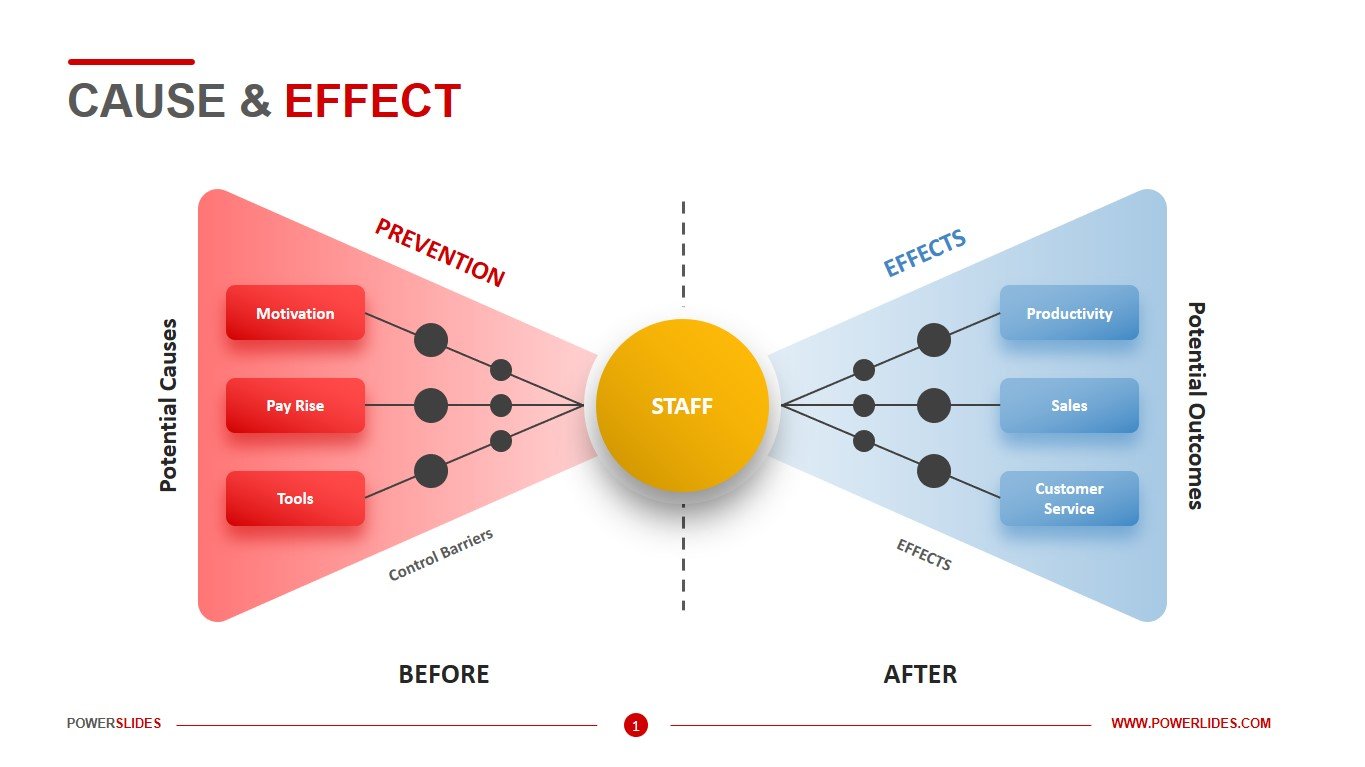
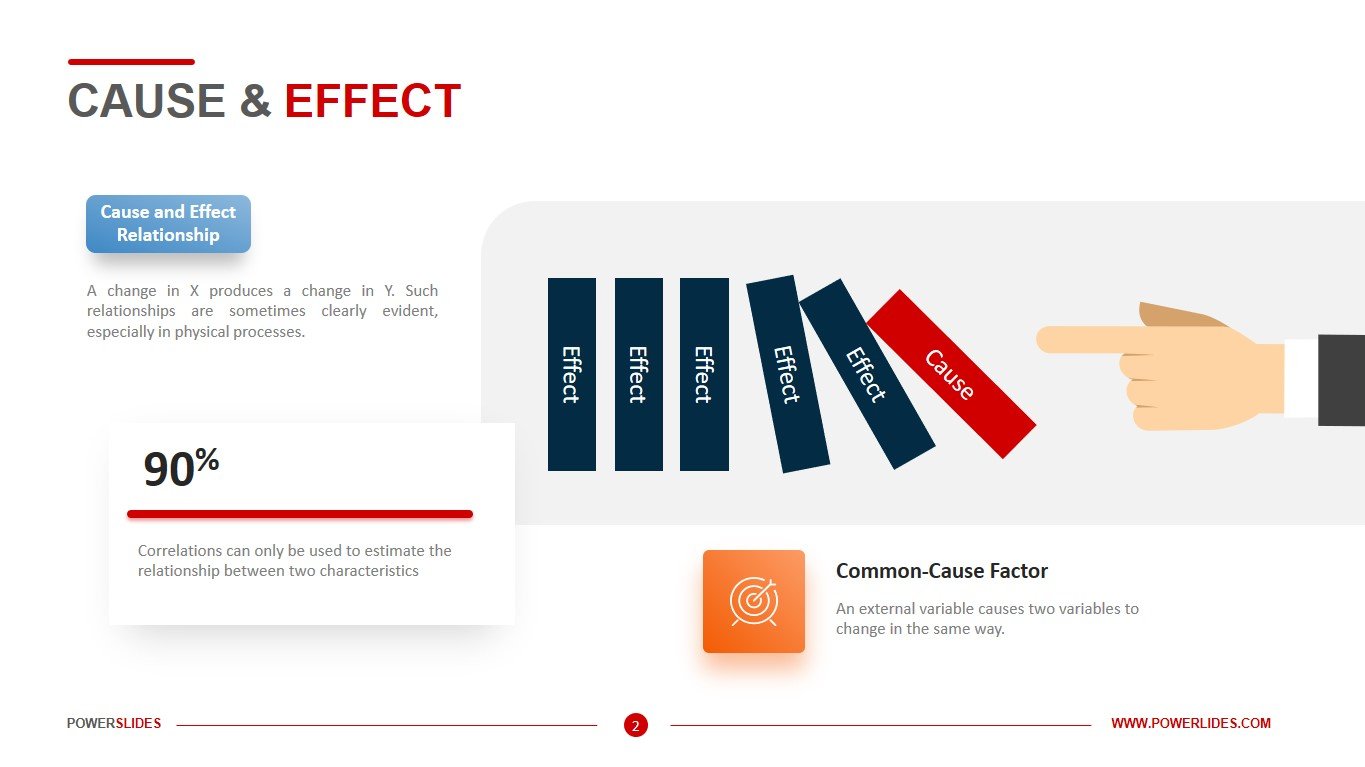
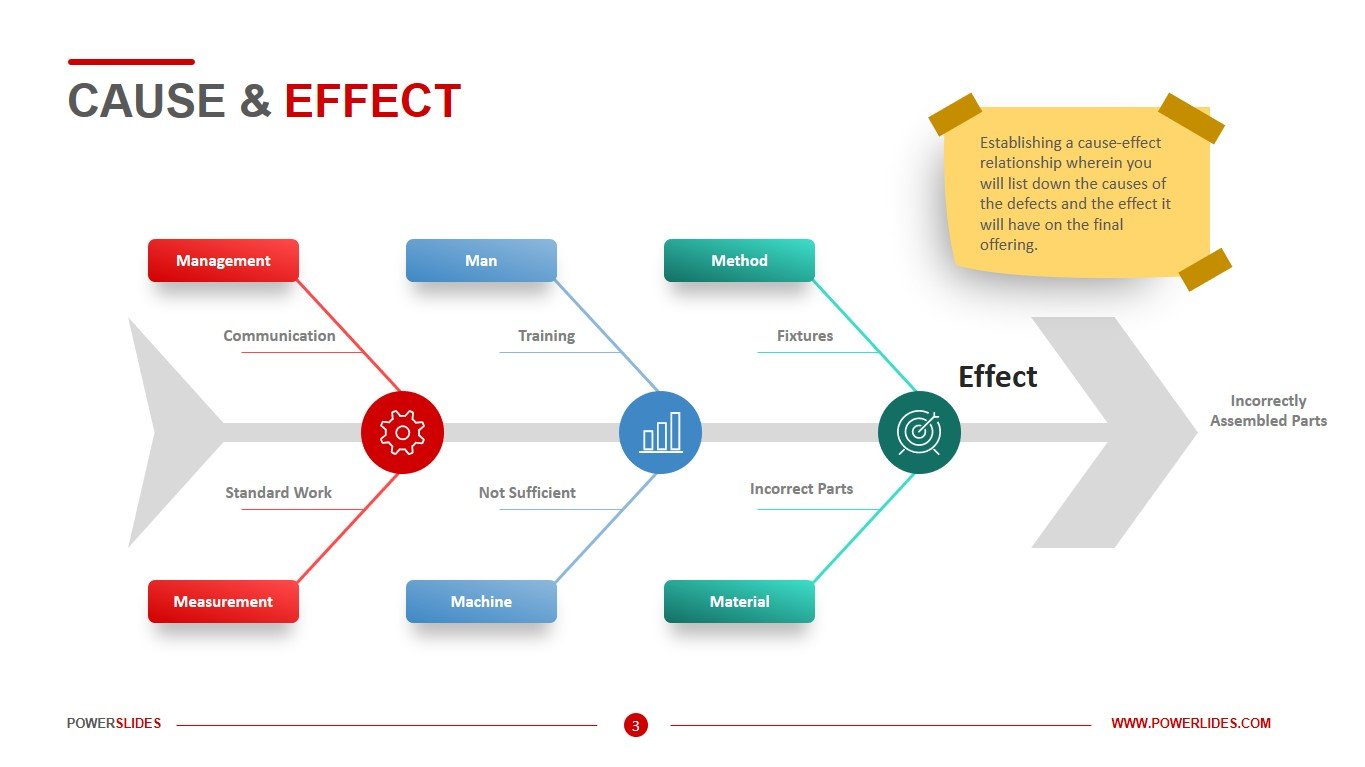
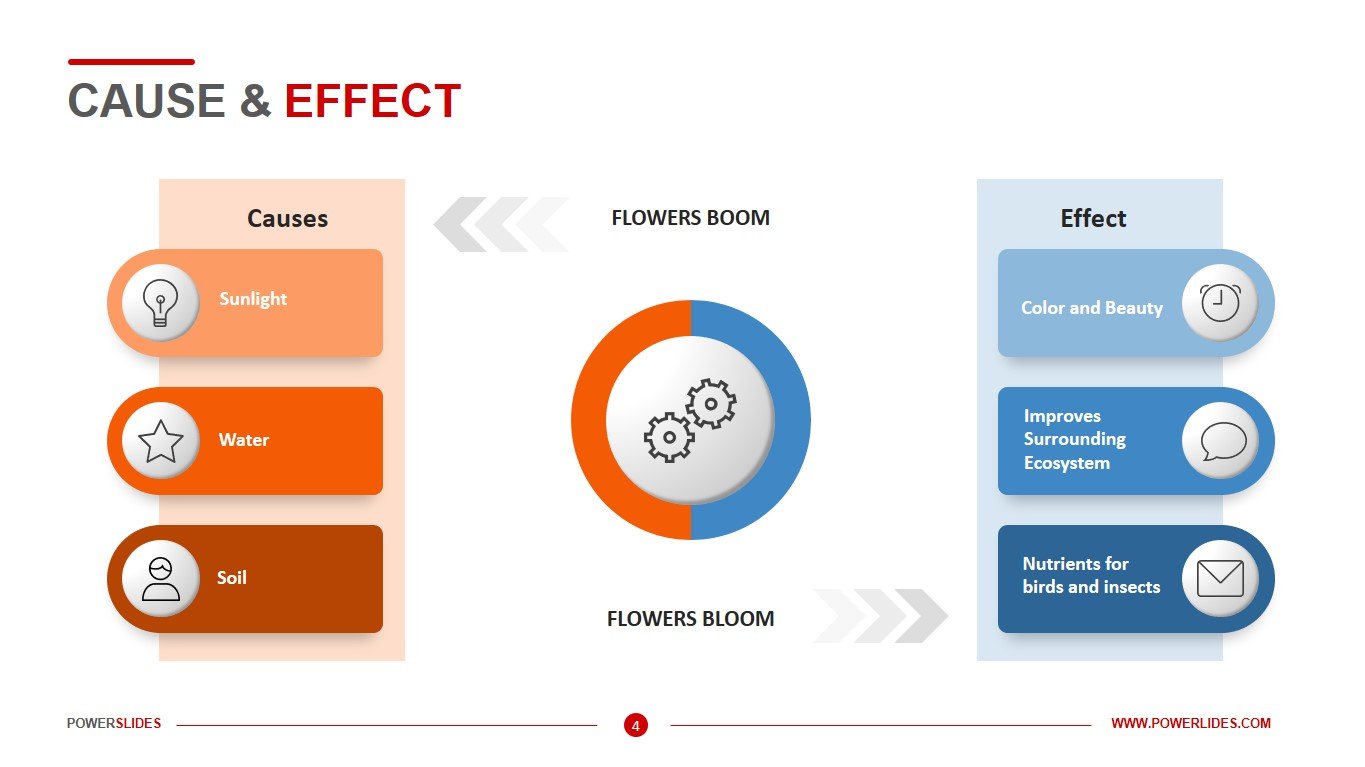
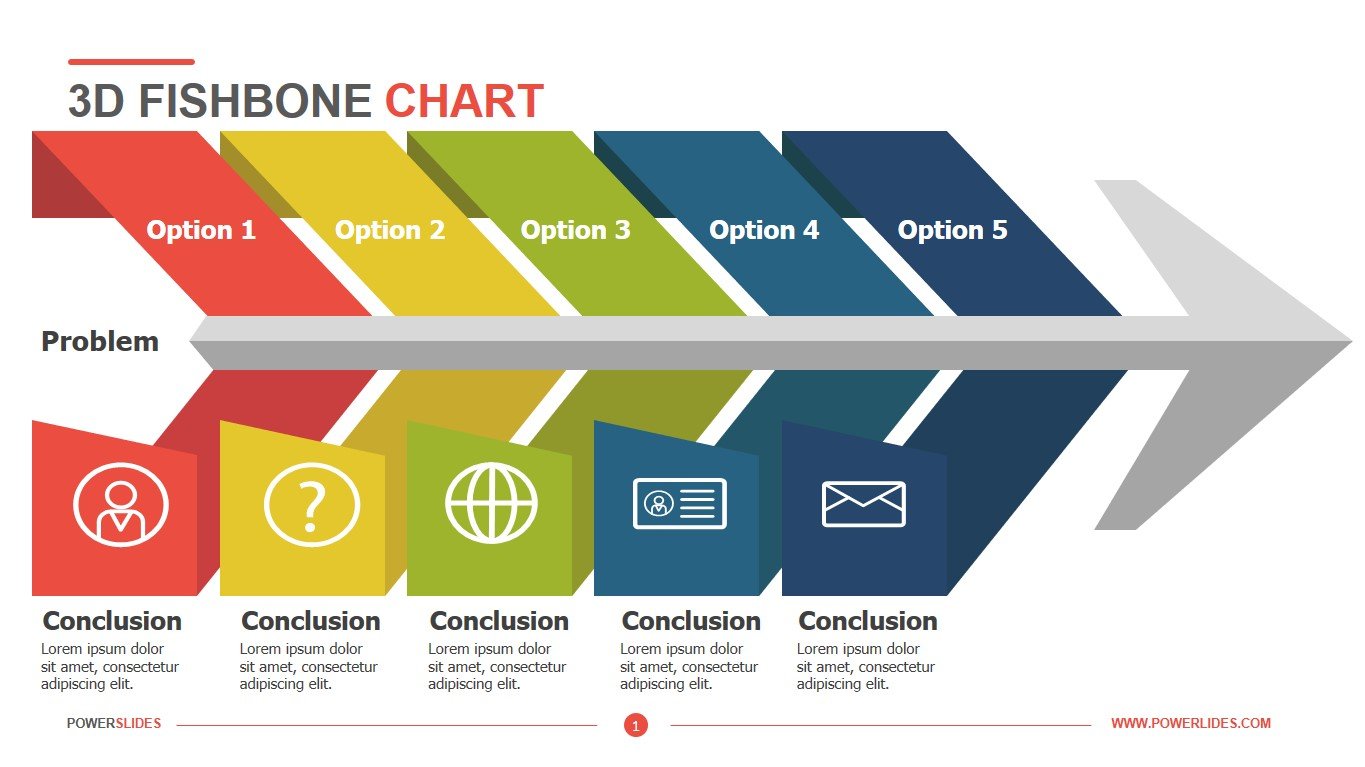
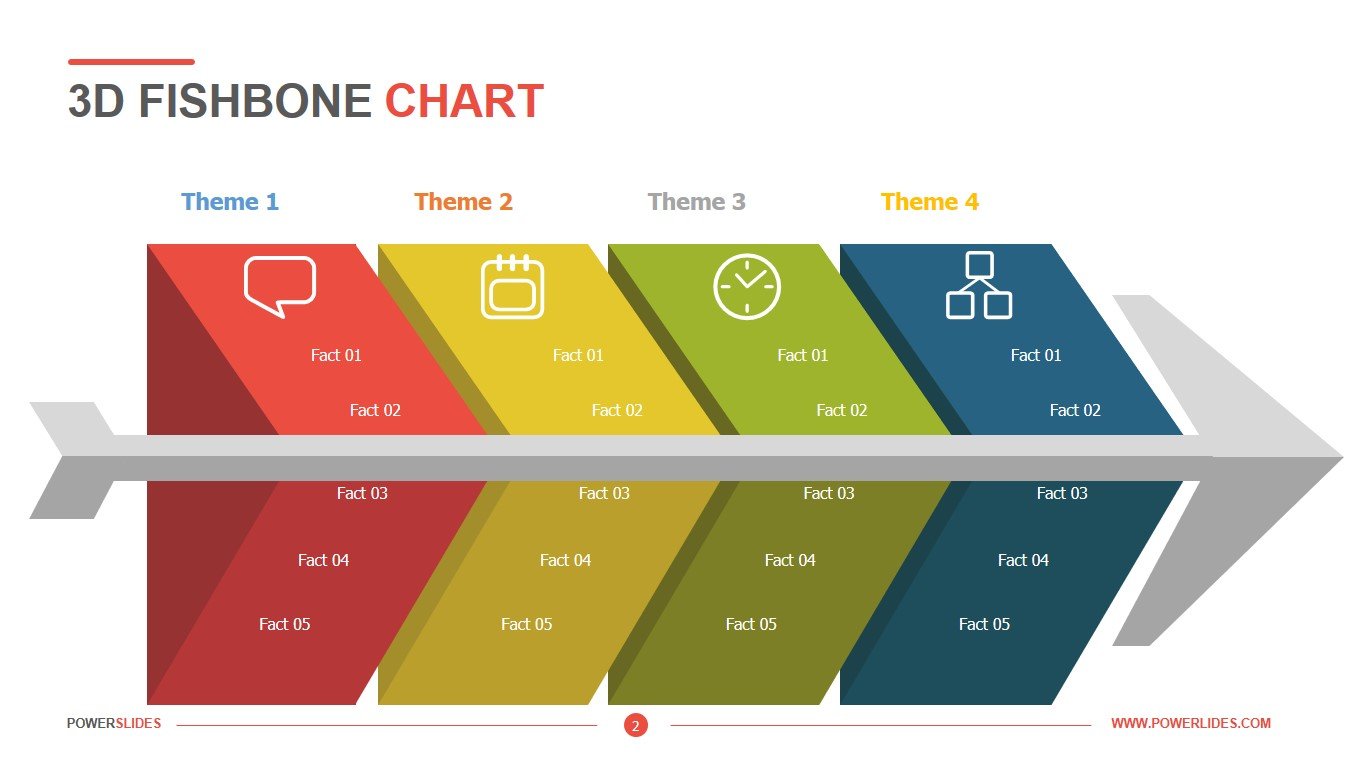
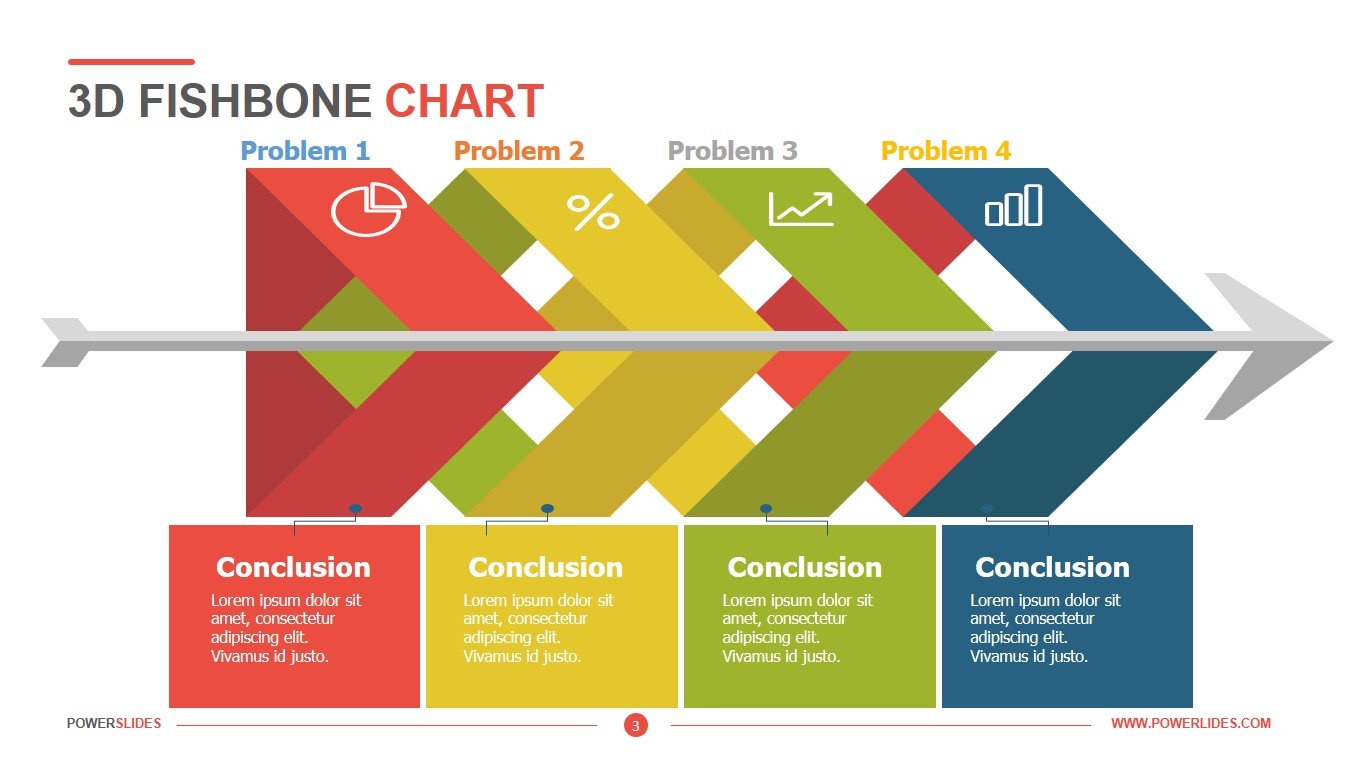
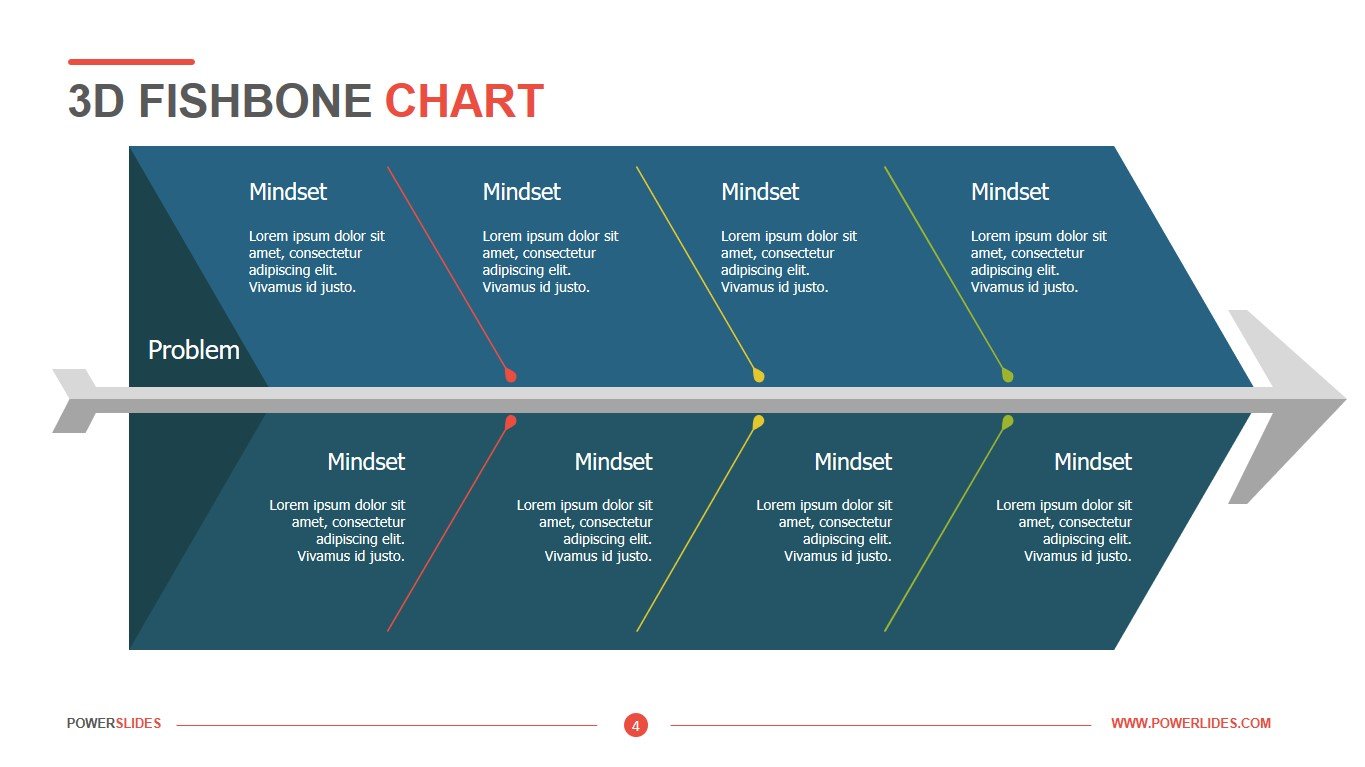
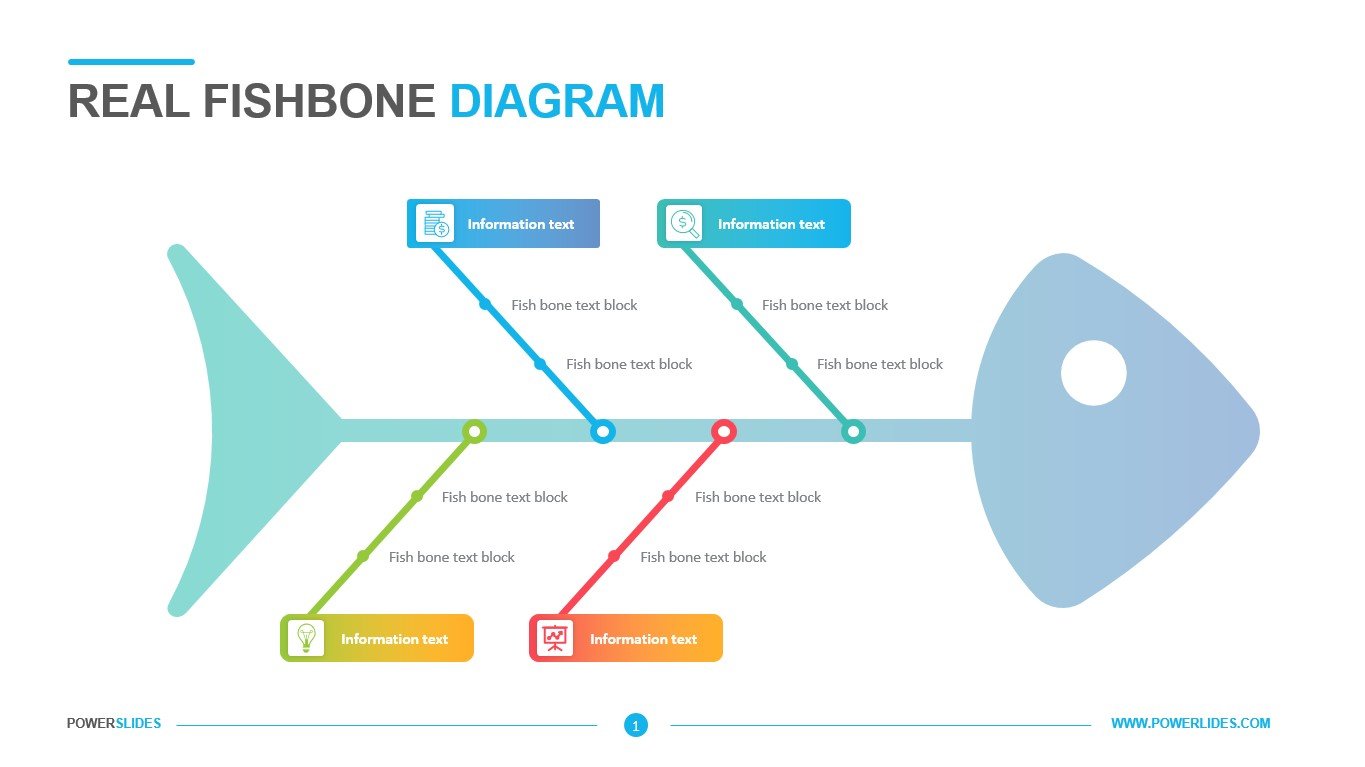
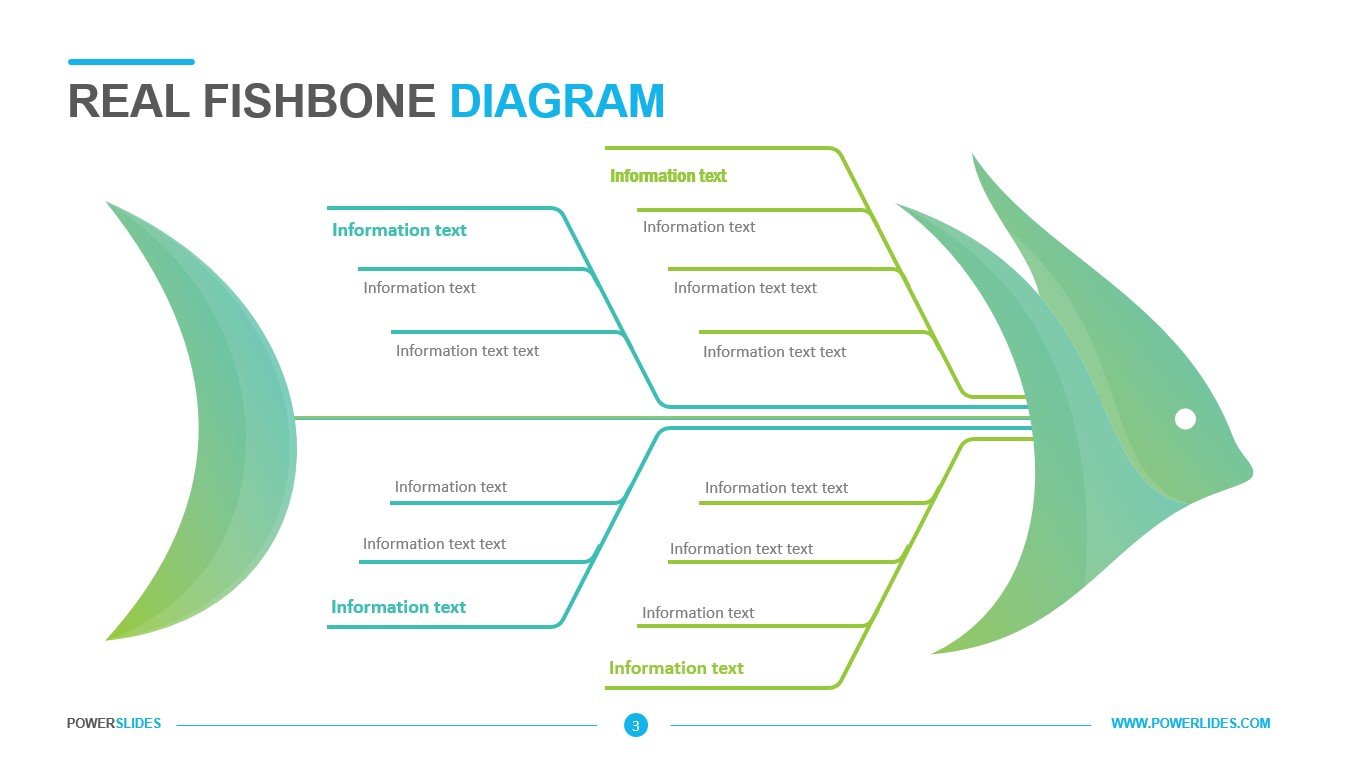
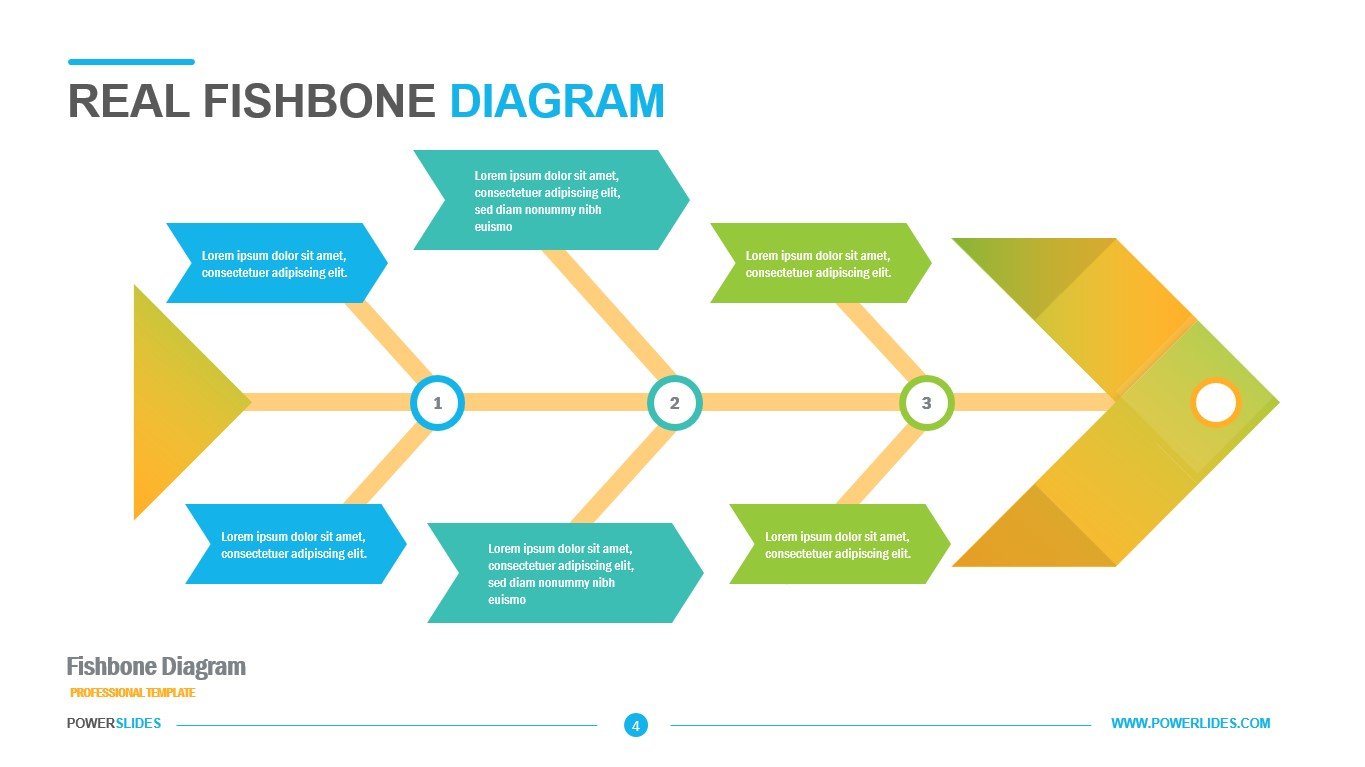
A fishbone diagram is typically created when you need to identify the cause of a problem. The head of the fish indicates the problems whereas the causes are connected to an arrow pointing to the head. Some generic categories may include approaching methods, equipment, material or measurements. Each of these causes is drawn to branch off to the horizontal arrow, making it a fishbone.
To save time, we present you with our ready-to-use fishbone template. We have 4 unique designs to help you analyze problems that might be causing any hindrance between your project and its success. With our template, you can even divide a cause into further categories. For example, you can further divide the measurement in analysis, lab error or calculation.
The template comes with delicate designs, each one of a different style. You can simply download the template and customize it according to the needs of your project. Our template is fully compatible with PowerPoint. Fishbone is also commonly referred to as cause and effect diagram because it helps you to understand the cause that is affecting your success. A perfect match for all your office needs.


