Problem Statement
What do you think of this template?


 (3.67/ 5)
11 ratings

 4 Slides
 File size: 16:9
 Fonts: Tahoma, Calibri
 Supported version
PPT 2010, PPT 2013, PPT 2016
Supported version
PPT 2010, PPT 2013, PPT 2016

Product details
Have you asked yourself the question of how to set the task? Are you familiar with the SMART concept? You should clearly know the answers to the following questions – what needs to be done, how it needs to be done, and who can do it. The correct description of the problem is already half of its solution. To solve this problem, we specially developed the Problem Statement Template. This template will help solve your problem with the correct formulation of the problem.
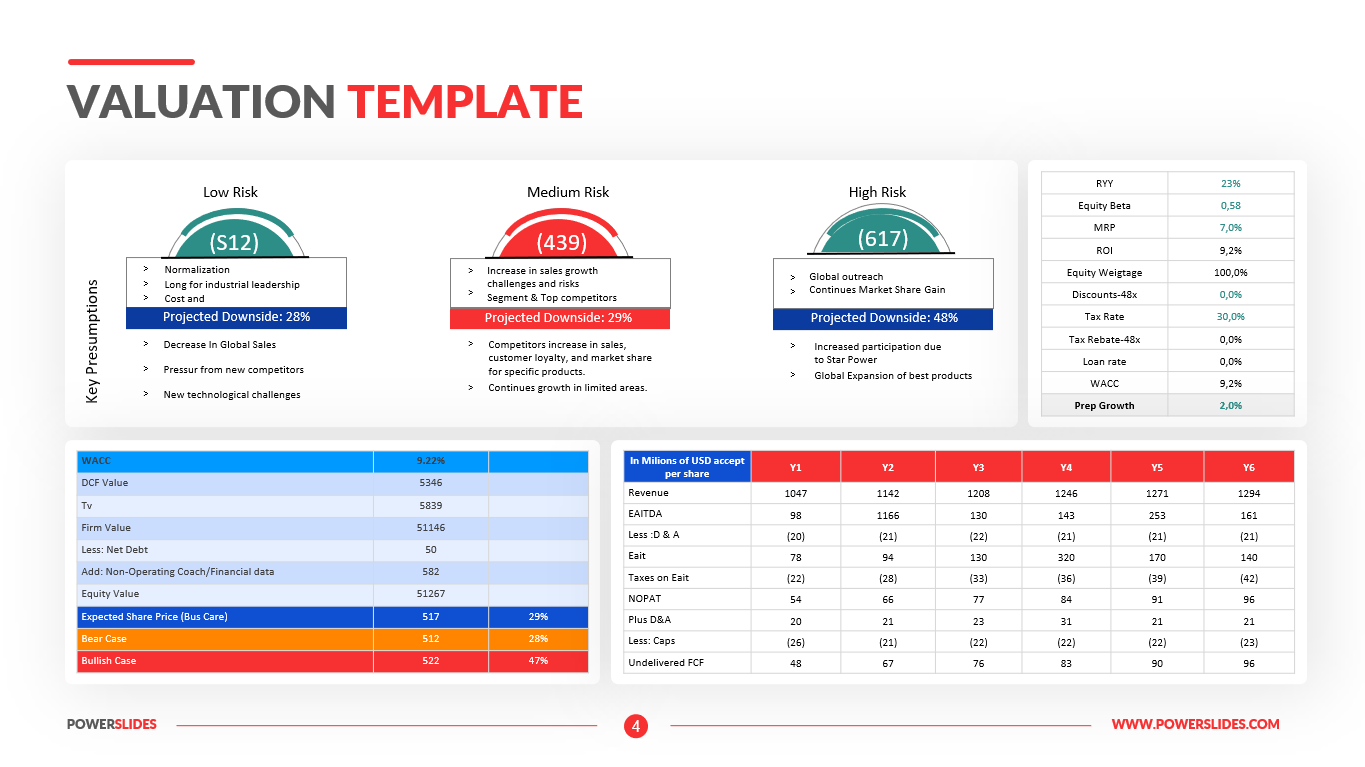
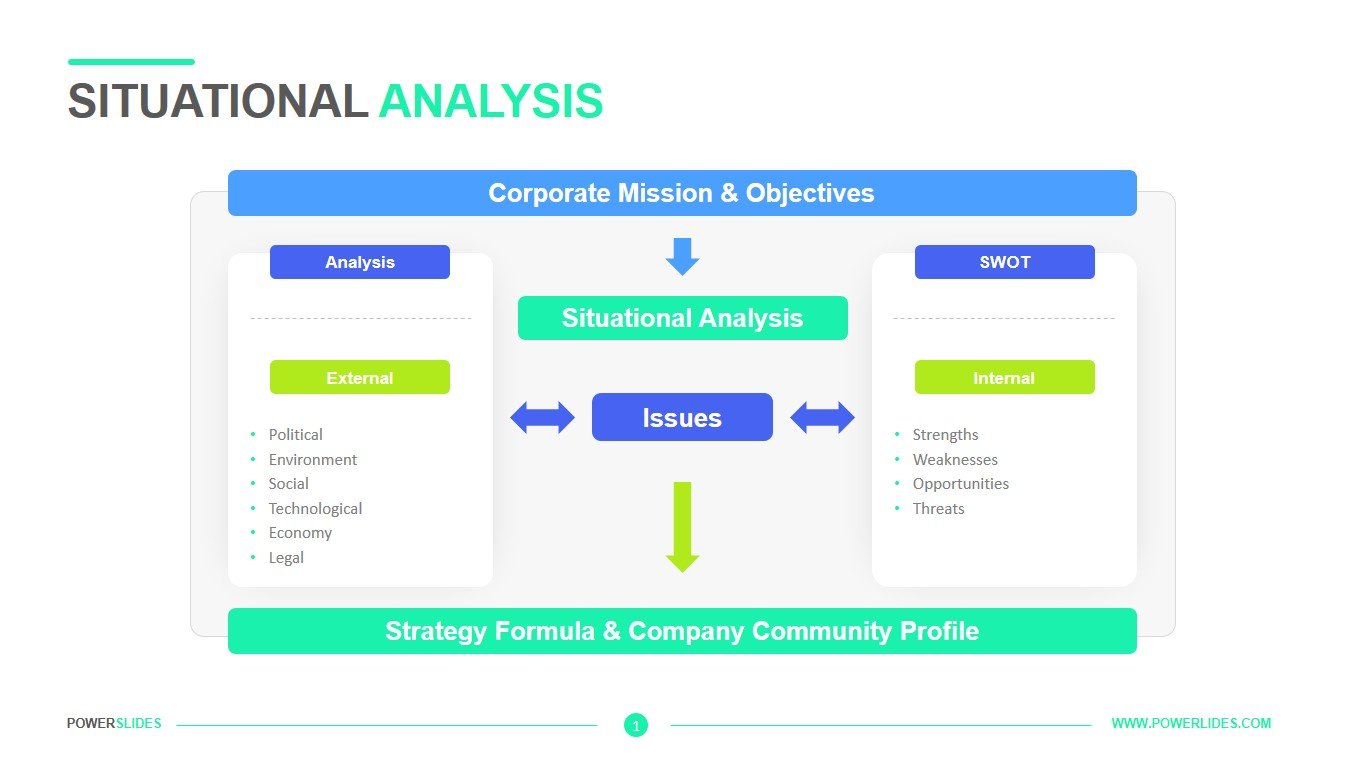
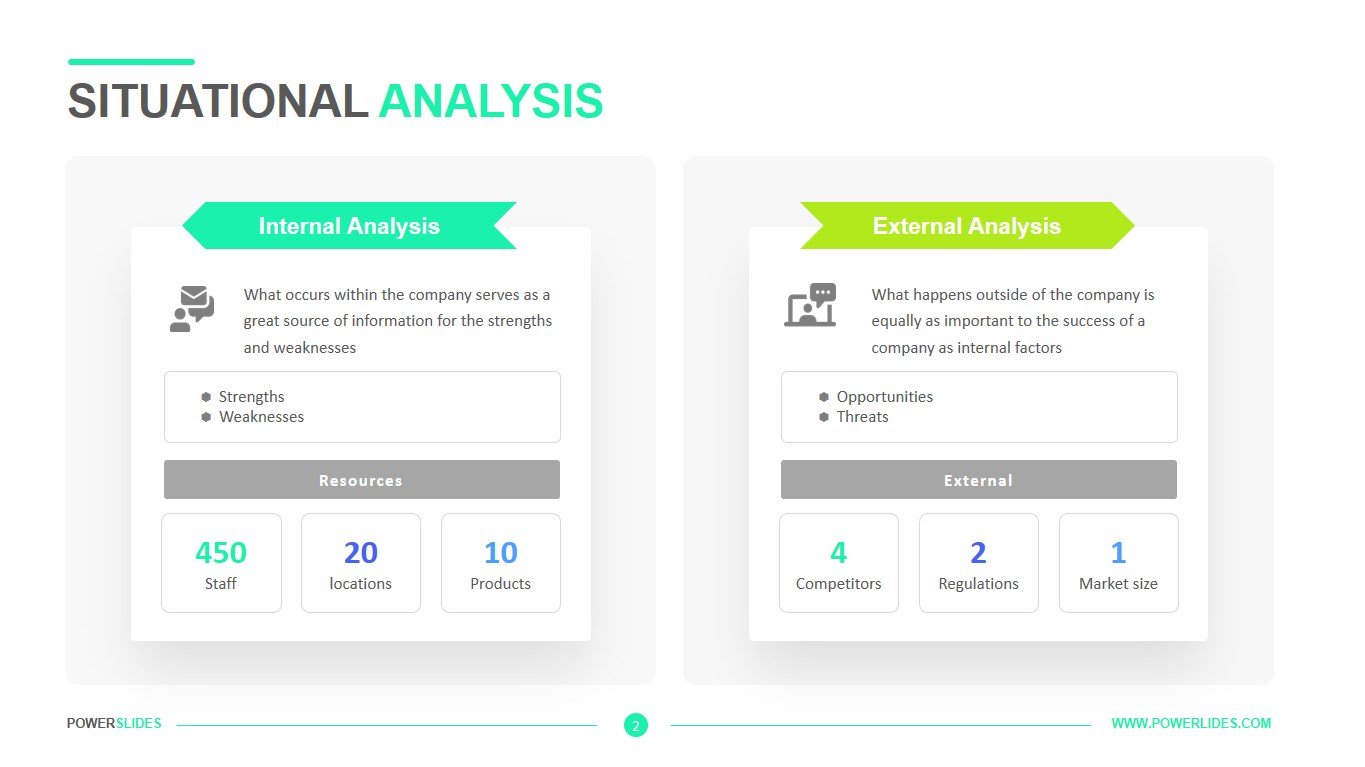
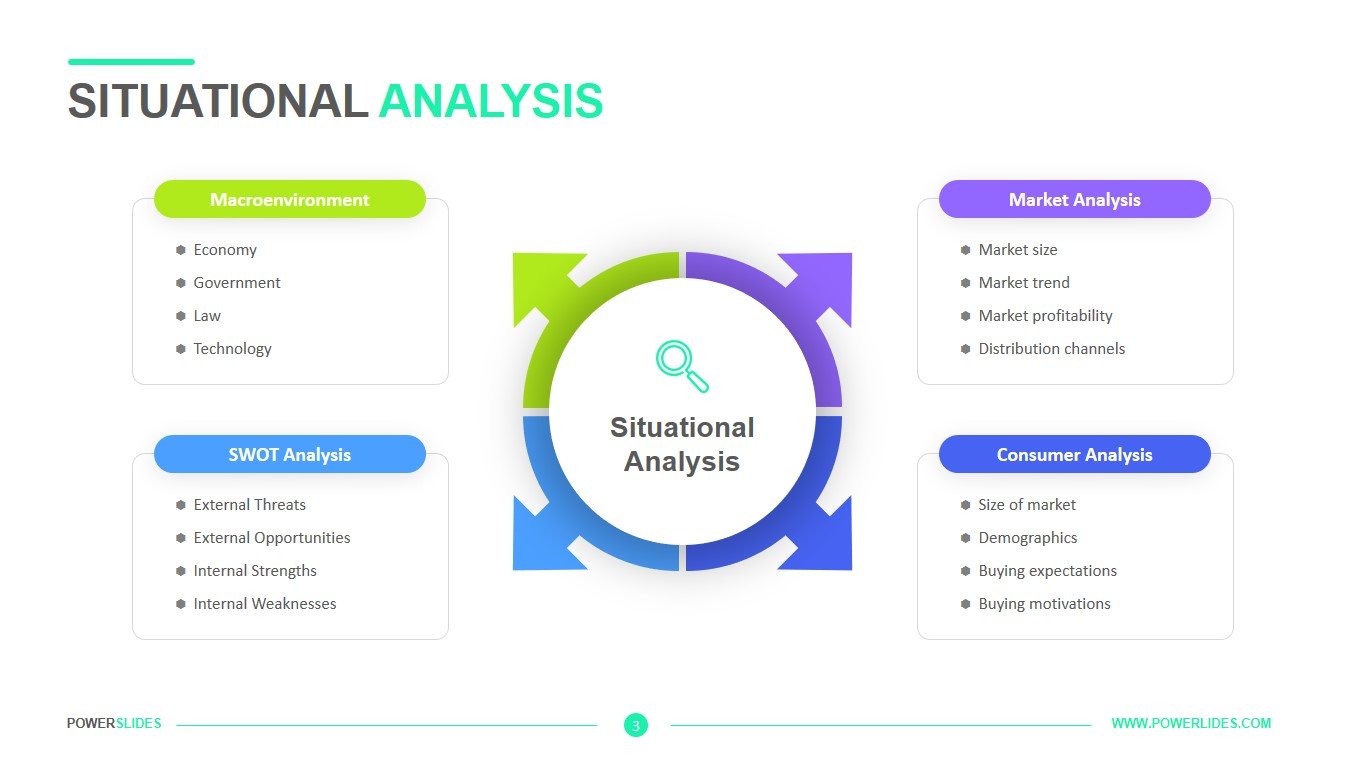
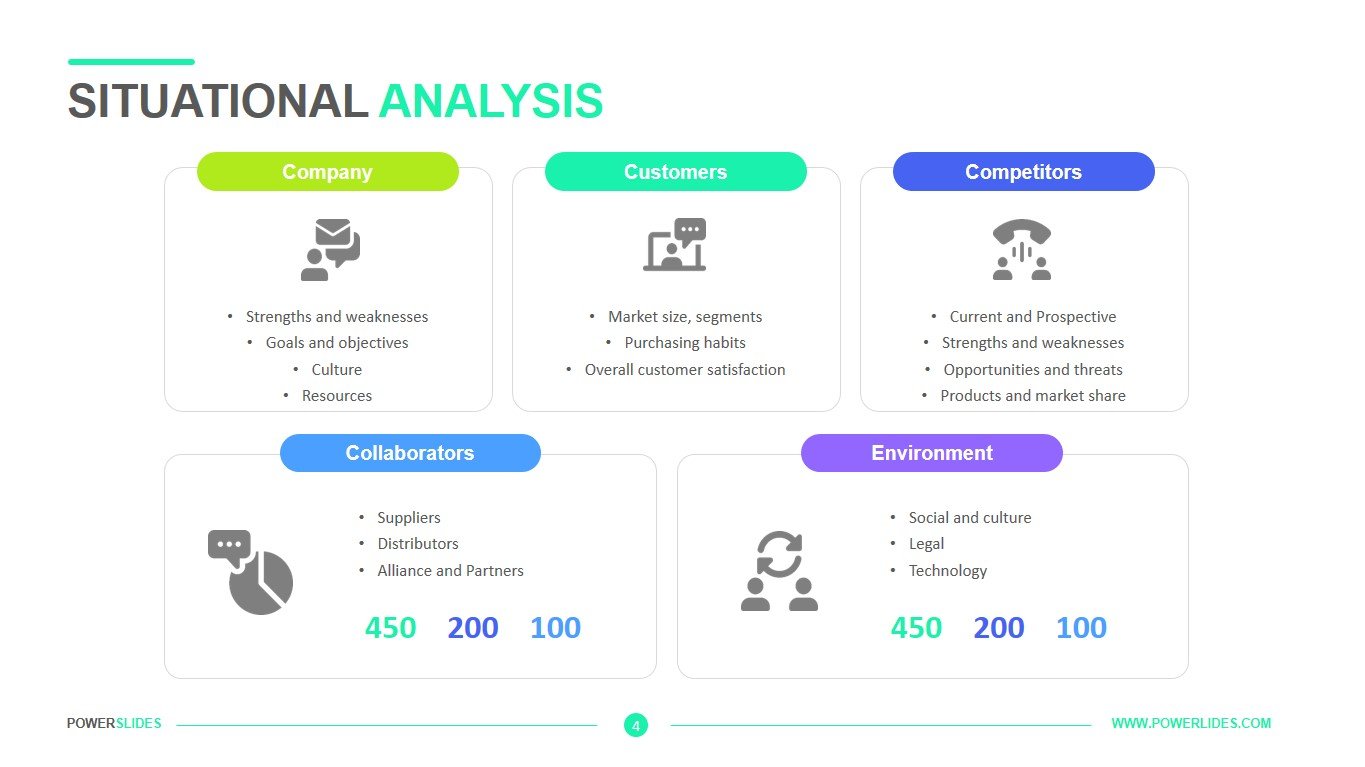
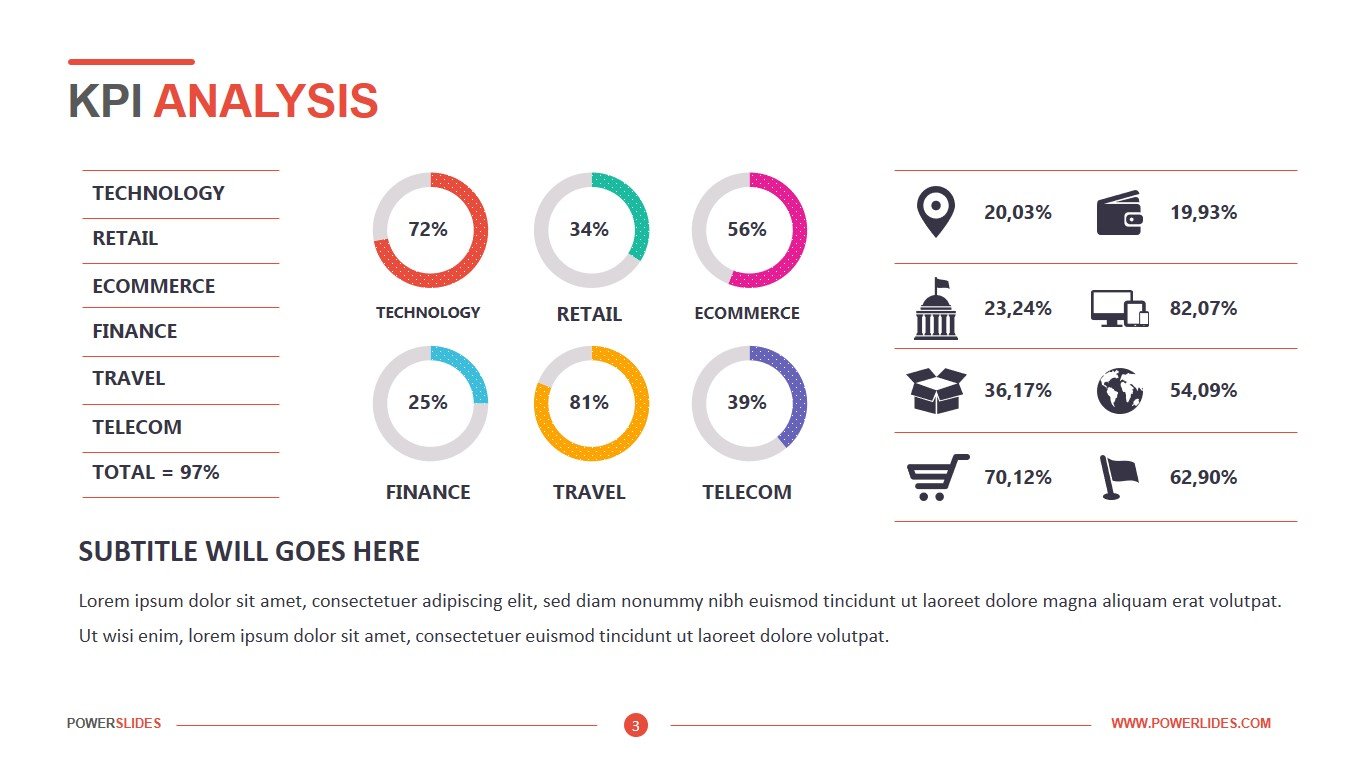
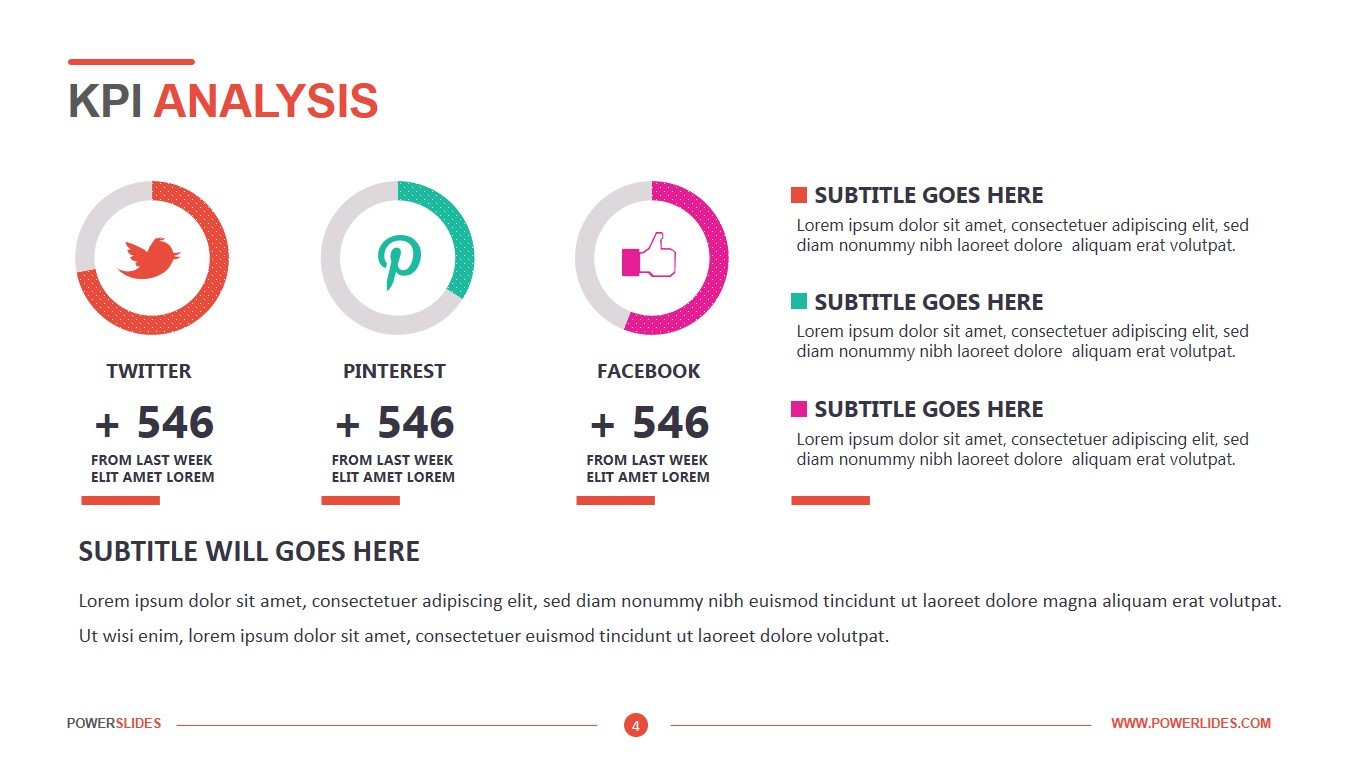
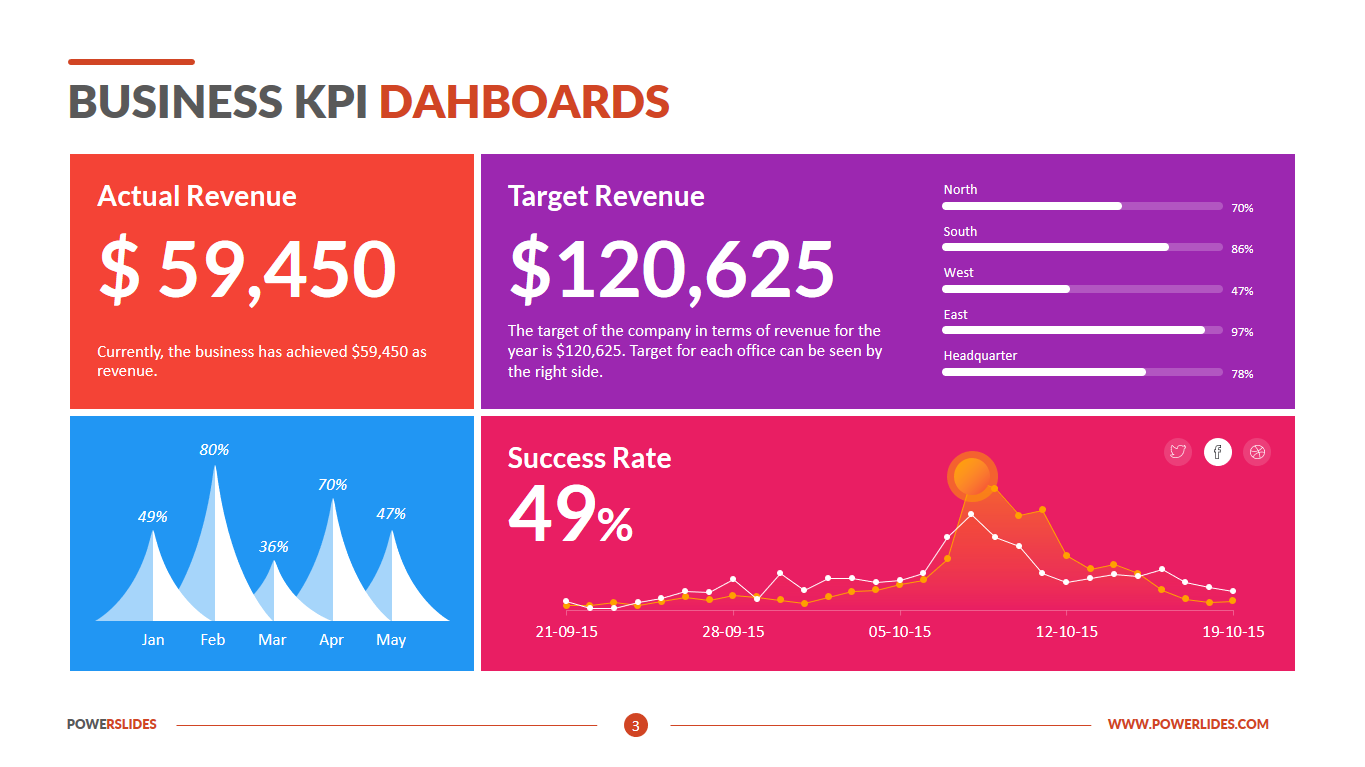
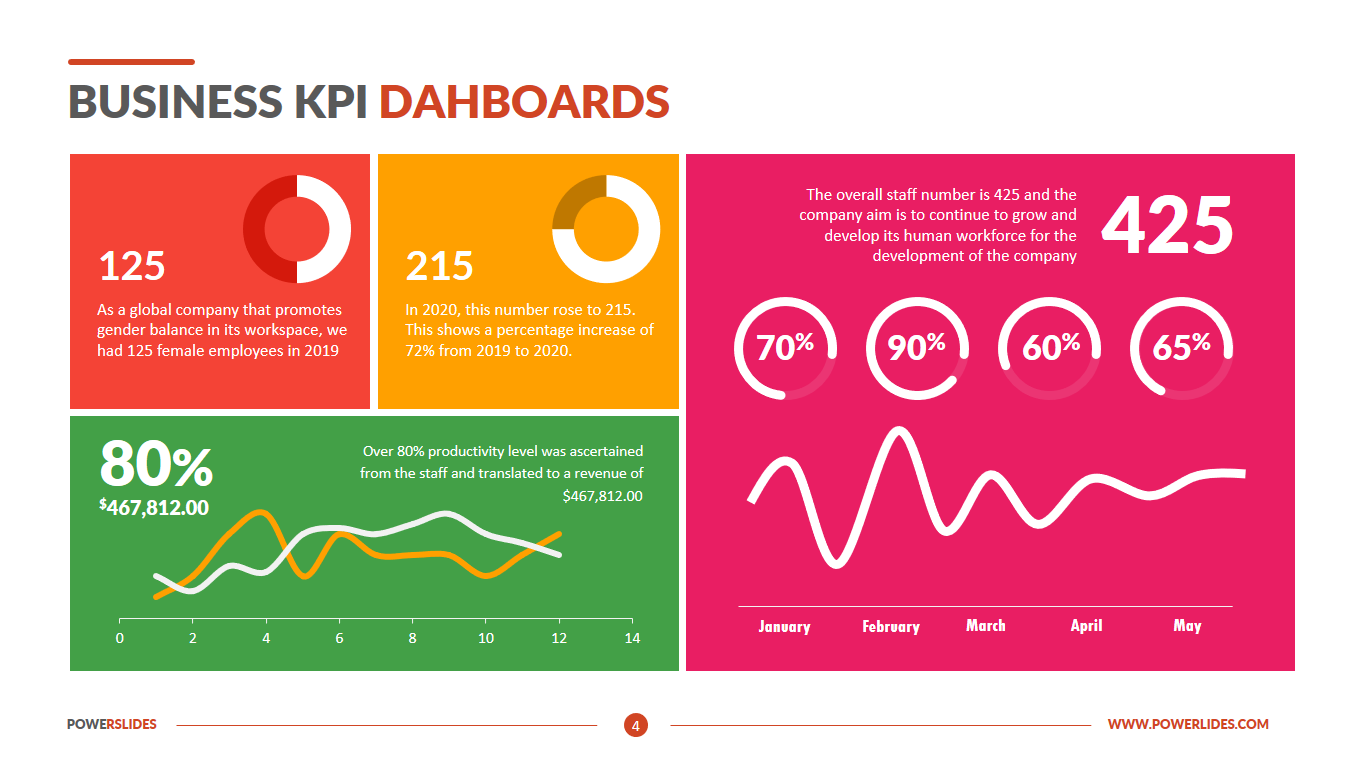
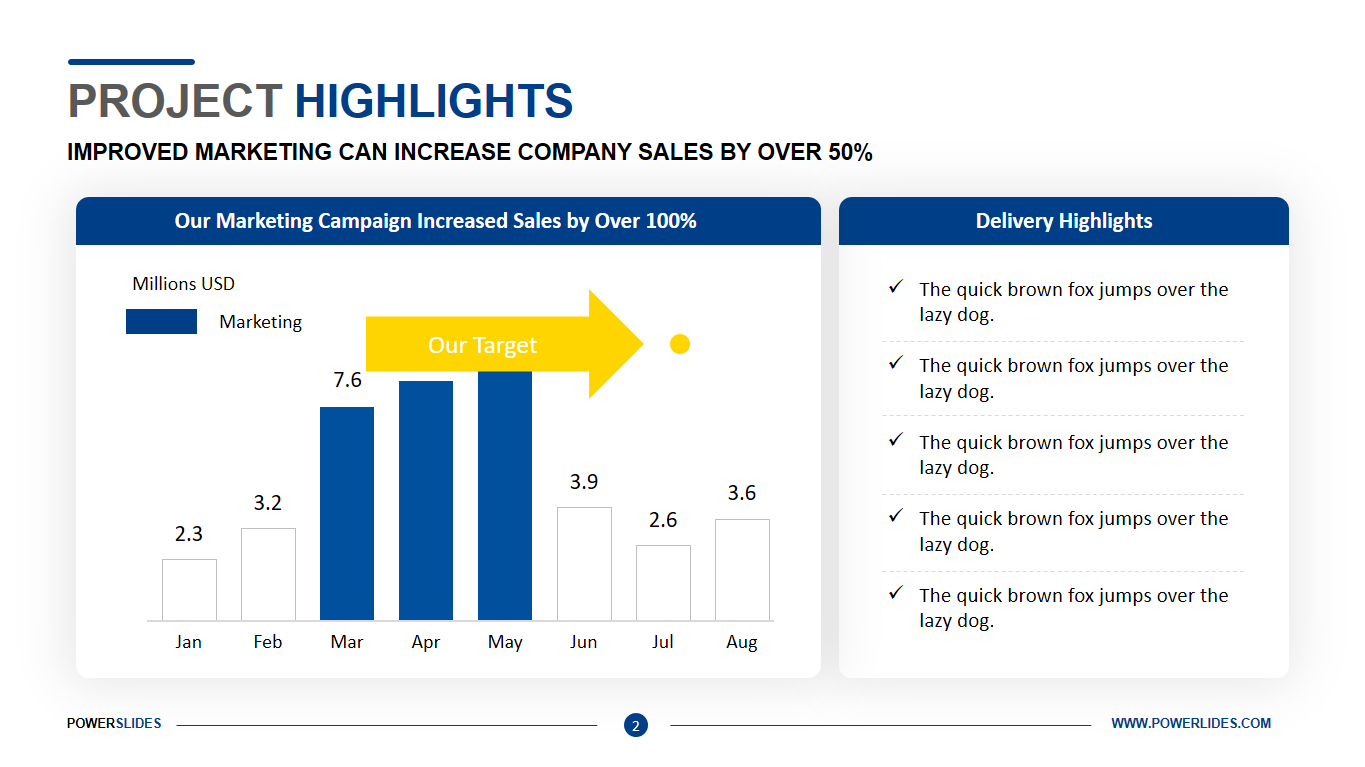
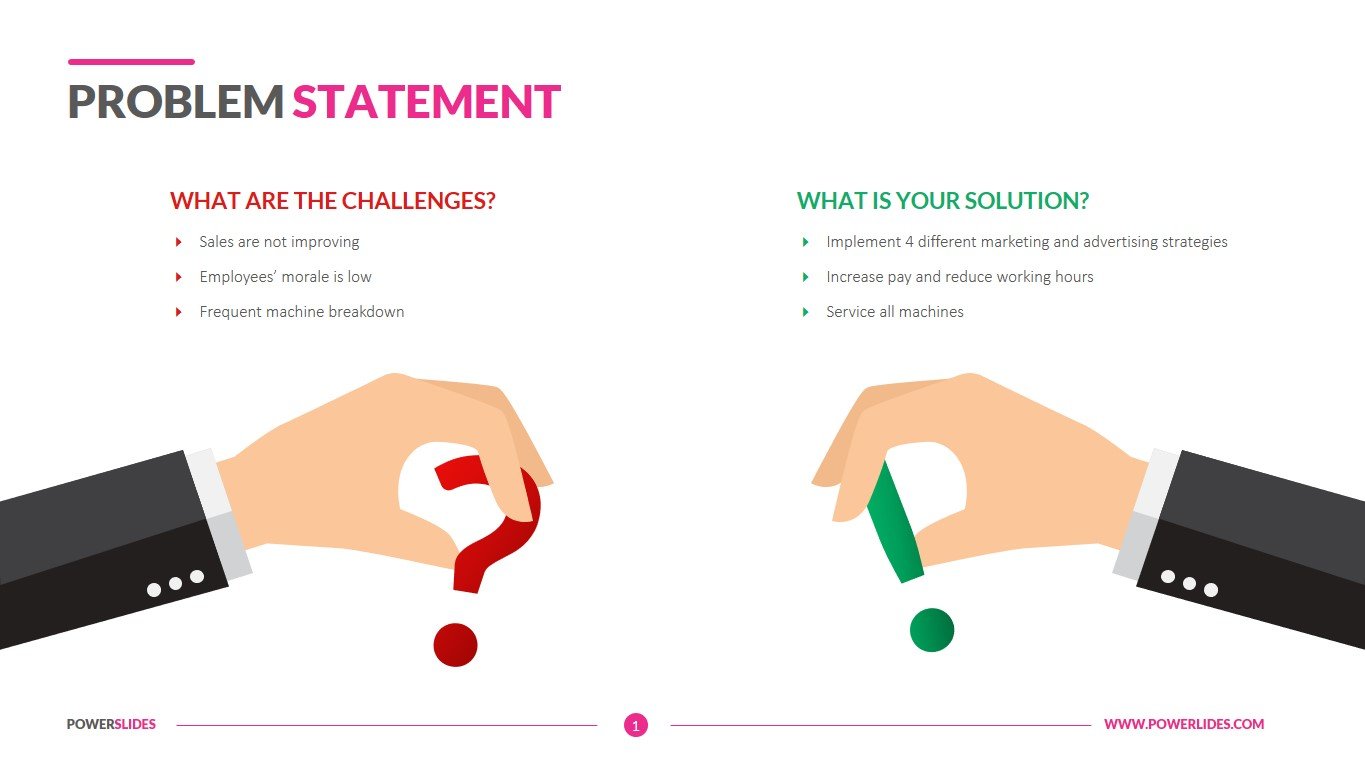
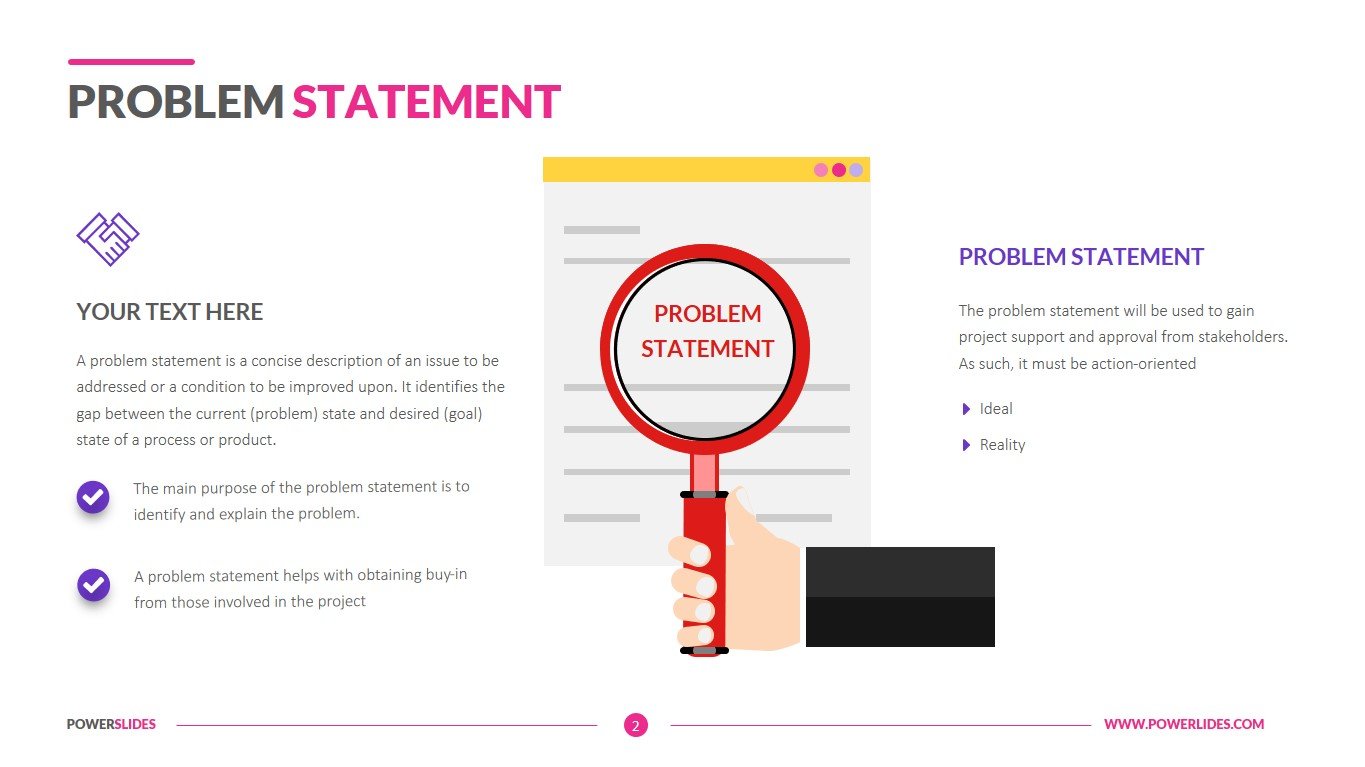
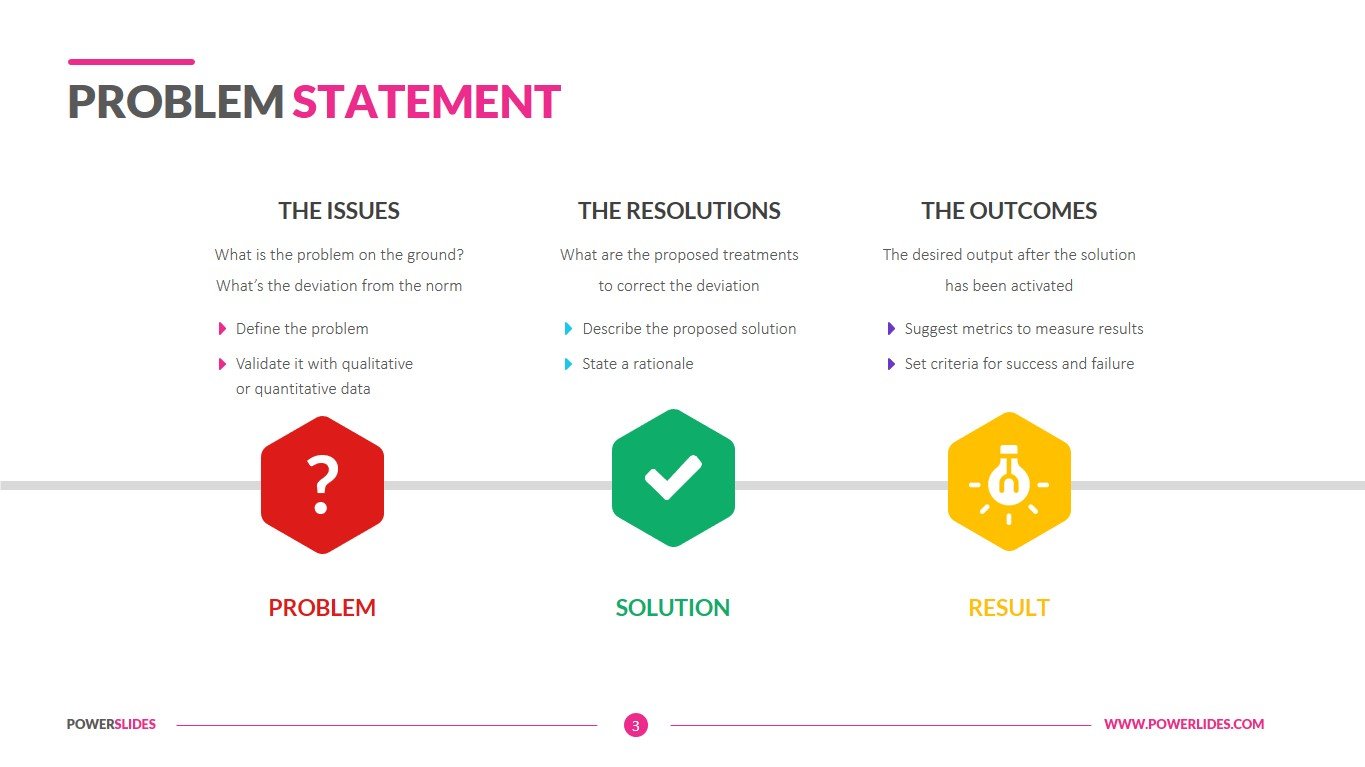
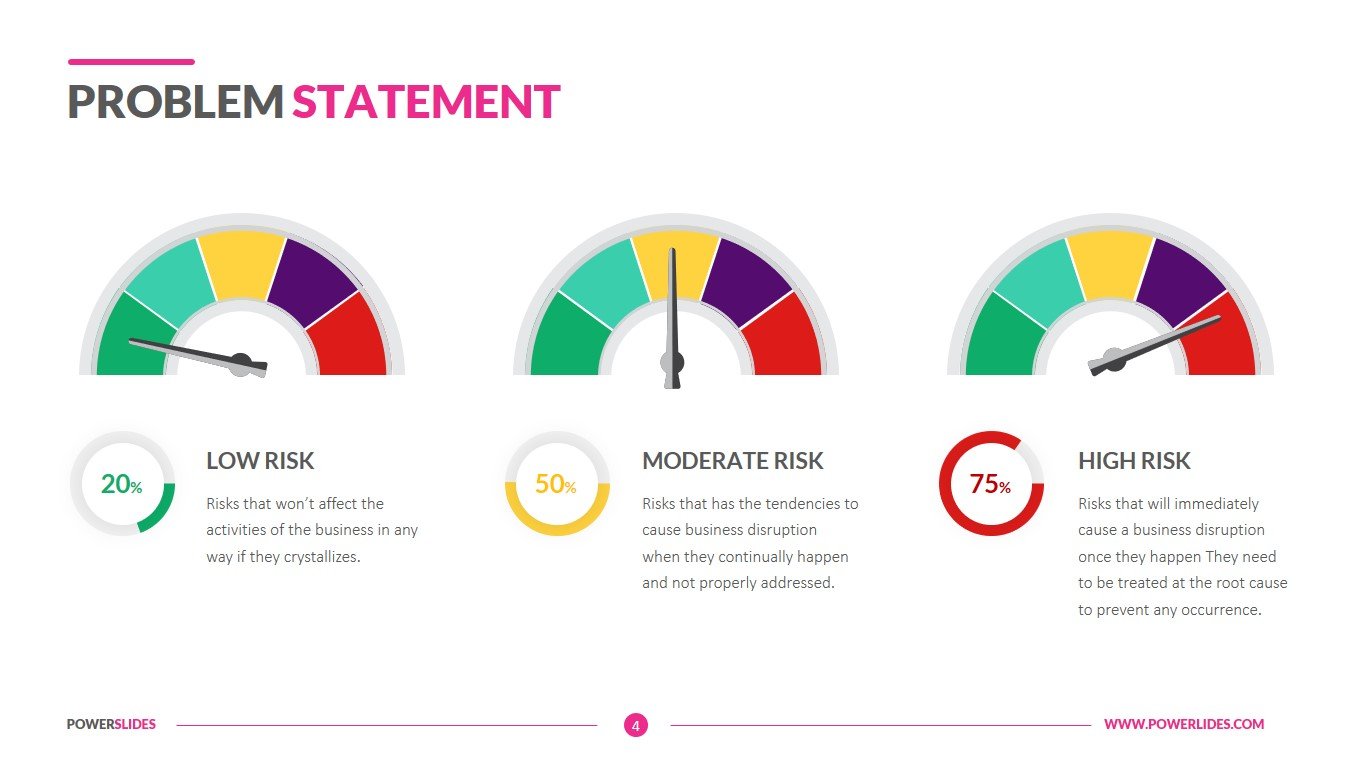
What features and tools do this template provide for the user? Let’s look at them in more detail and analyze a few slides of this presentation. The first slide is divided into two equal parts. In the first part, we can describe what we need to solve and what problems we encountered. This section accurately describes its title, What are the challenges? The second section is titled What is your solution? Here we describe ways to solve the problem. To enhance the effect of perception of the information under each of the sections are quite large drawings. They symbolize questions and answers to them. The second slide immediately focuses our attention on the hand with a magnifying glass. Thanks to this, the audience perceives the information on the slide as carefully worked out. On each side, there are blocks in which we can describe the problem and its solutions. The third slide is presented in the form of a so-called timeline – a problem, solution, result. A small block is placed above each of the infographic icons for a brief description. This slide very clearly demonstrates the sequence of actions and the final result. We recommend it for use in your report. The next slide consists of “three speedometers”. Each of them has several colors on its own scale. These colors can be changed. For example, in the first place to put red color and its shades and further change moving to yellow, and then green. Ready set Go. Below are the pie charts. They can be used to represent strengths or project readiness as a percentage. Visually, this is very well accepted by the audience and it is easier for it to understand the data, which are presented in percent. The presentation is intuitive to fill out the information and does not require in-depth knowledge of PowerPoint. Visualization tools are diverse and enough to build a good presentation.
The colors used in the problem statement template are bright and clear. They attract the attention of the audience to the problem that is described in the presentation. The presence of speedometer charts enhances the overall impression of the presentation. Black colors on the first two slides add confidence that the speaker knows the problem thoroughly and understands how to solve it. The light background gives the presentation a business style. We are sure that the problem statement template will help you solve any difficult tasks.


