Water Phase Diagram
What do you think of this template?

 (2.00/ 5)
2 ratings

 4 Slides
 File size: 16:9
 Fonts: Lato Black, Calibri
 Supported version
PPT 2010, PPT 2013, PPT 2016
Supported version
PPT 2010, PPT 2013, PPT 2016

Product details
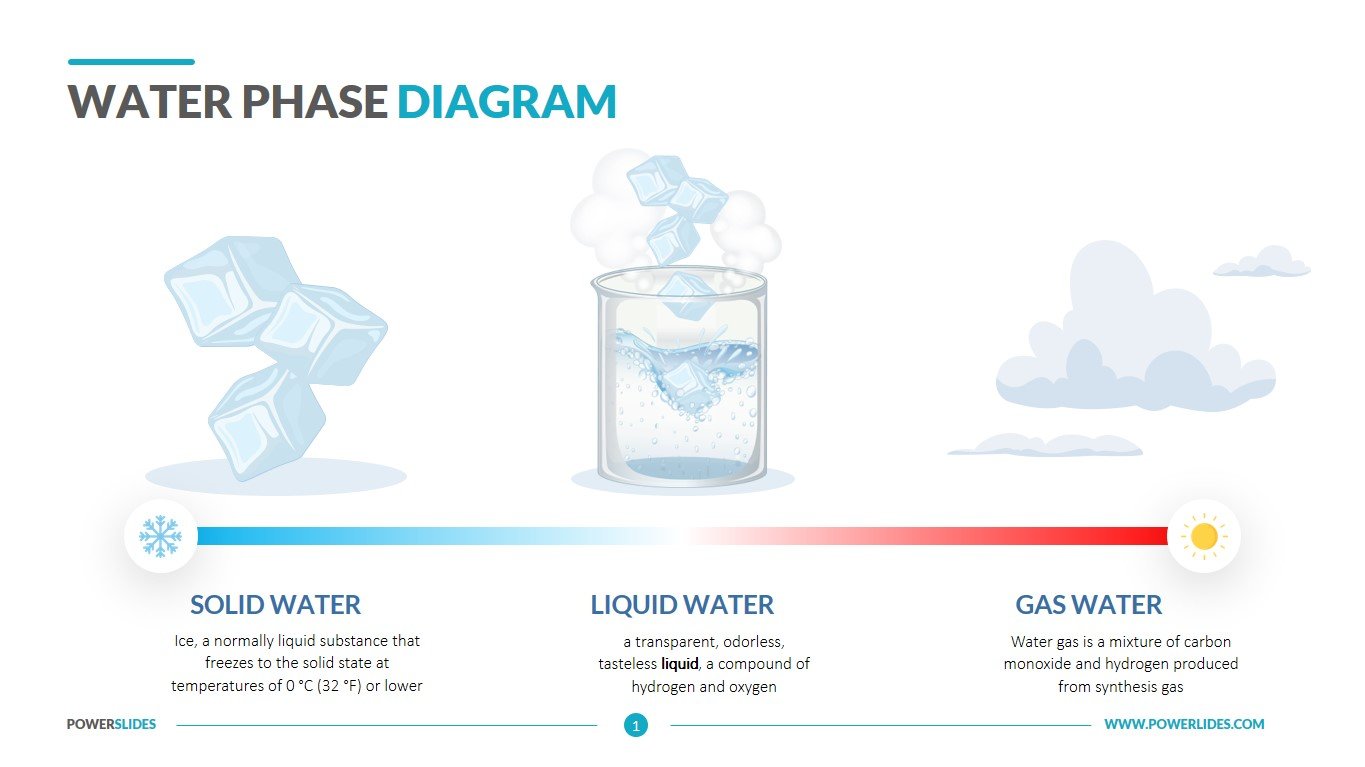
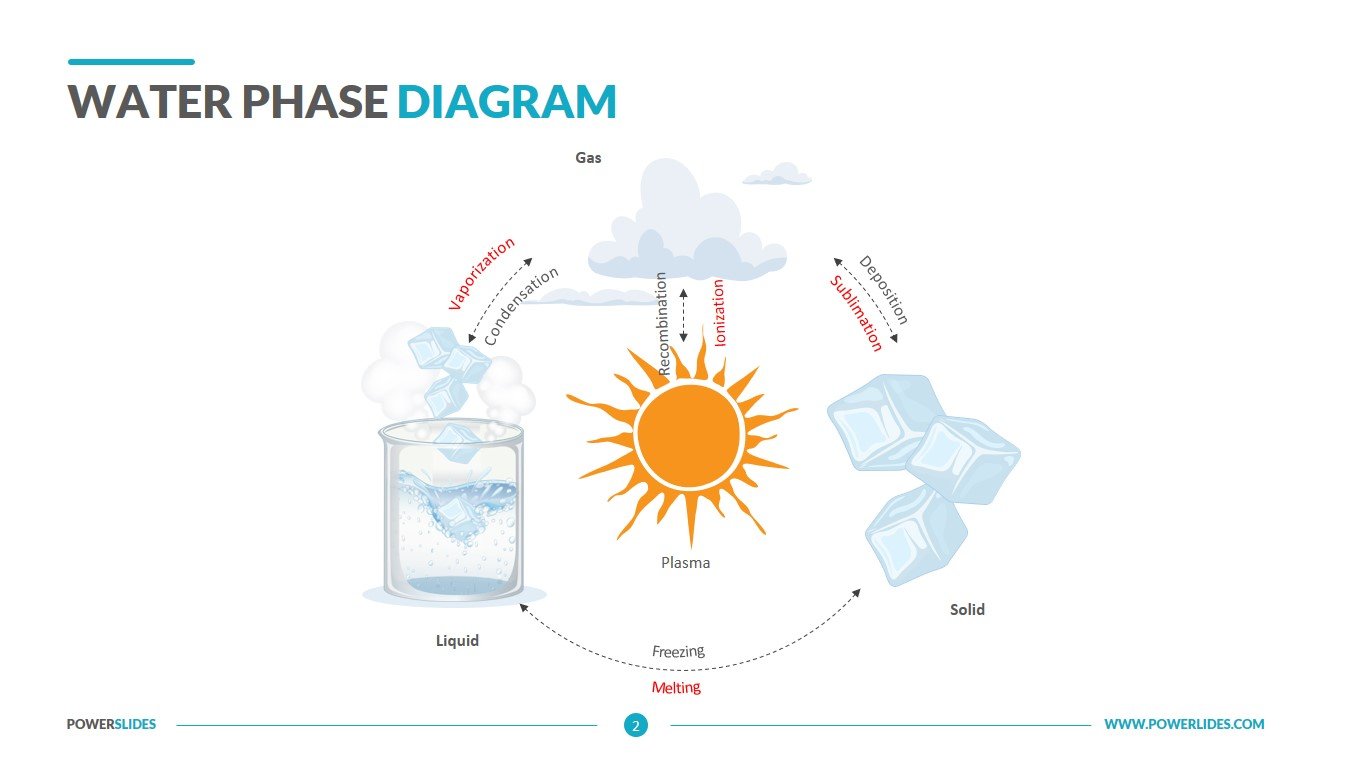
We all know what water is — a clear, odorless, tasteless liquid. And we all know what water does — falls from the skies, quenches thirst, cleans surfaces, makes plants grow. But there’s another way to look at water, if you go below the surface. If you could peer into the submicroscopic world, you’d see that water consists of three atoms: two of hydrogen and one of oxygen. Water is a small molecule: A single living cell may contain billions of them. As a rule, when liquids freeze, they become denser. But forget about the rules when it comes to water: When frozen as ice, it becomes less dense. The result? Ice floats. As always, the explanation is in the atoms. In liquid water, the molecules are chaotic, jumbled and packed densely together. But as ice forms, the molecules arrange themselves in a crystal structure with empty spaces — and those spaces act as flotation devices. Water freezes at 0 ° C (32 ° F), but it’s most dense — that is, its molecules are most tightly packed — at 4 ° C (39 ° F). And water vapor helps trap some of the Sun’s heat so it doesn’t all bounce back into space. Water as gas: You can’t see it, but you can’t do without it. Next time you’re drinking a glass of ice water, stop and think about this: At a single moment, you’re experiencing water in all three phases. The solid is cooling the liquid in your glass while the air you’re breathing is full of water vapor. Water’s versatility — its ability to exist as a liquid, solid, and vapor at ordinary temperature and pressure — makes life as we know it possible on Earth.
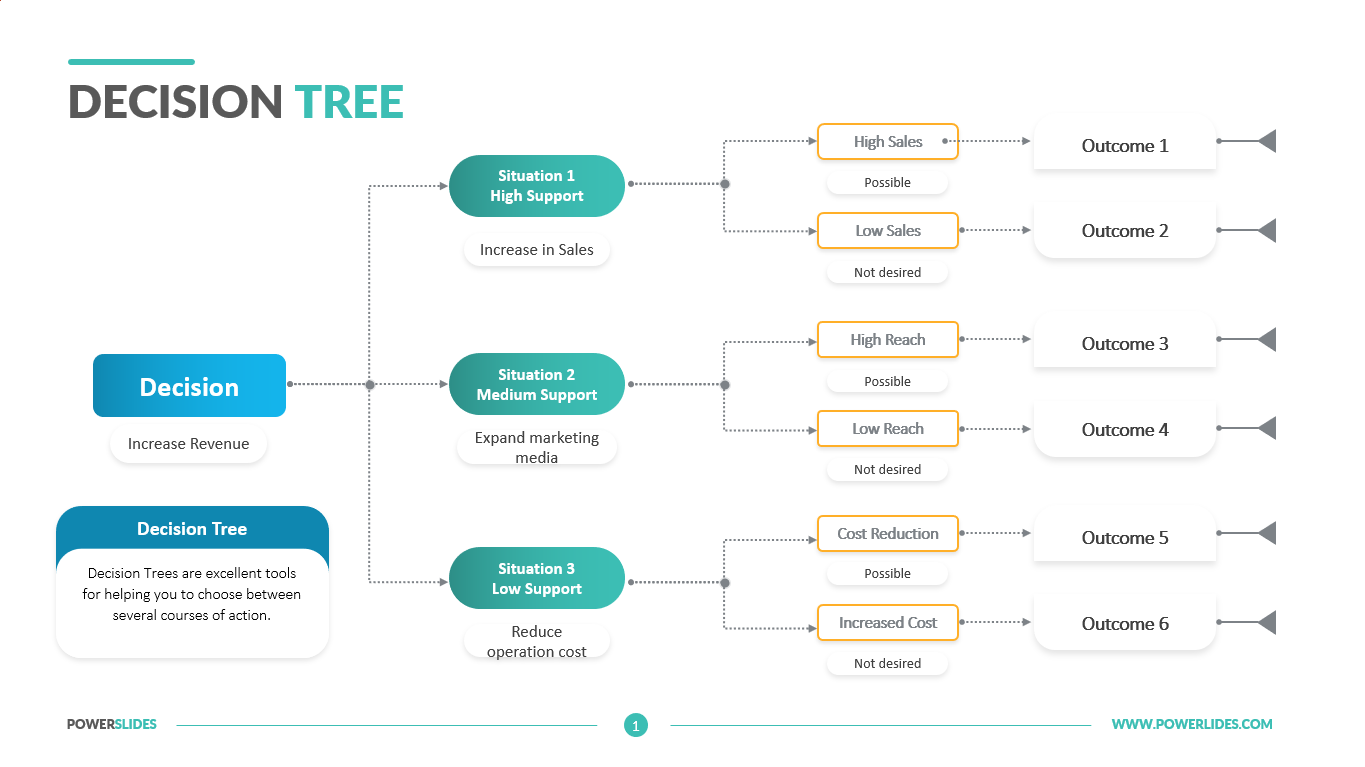
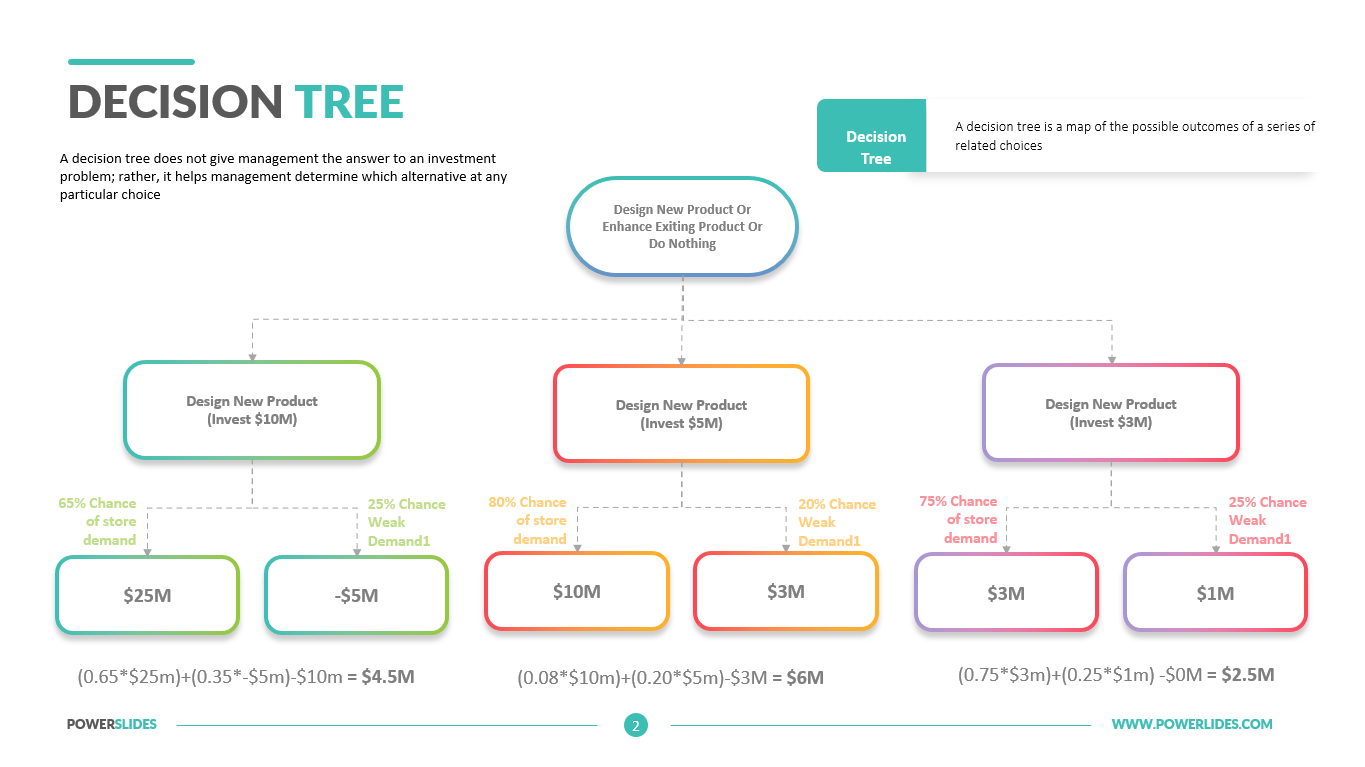
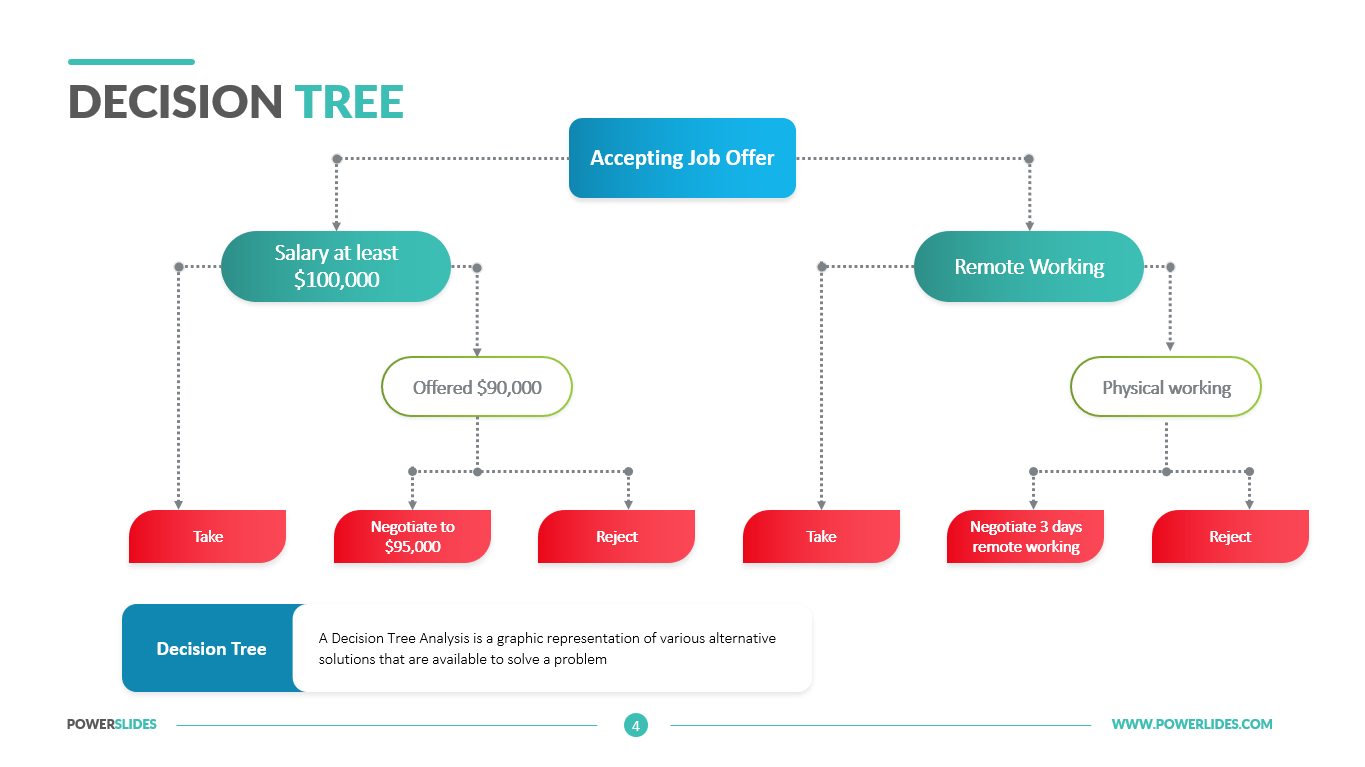
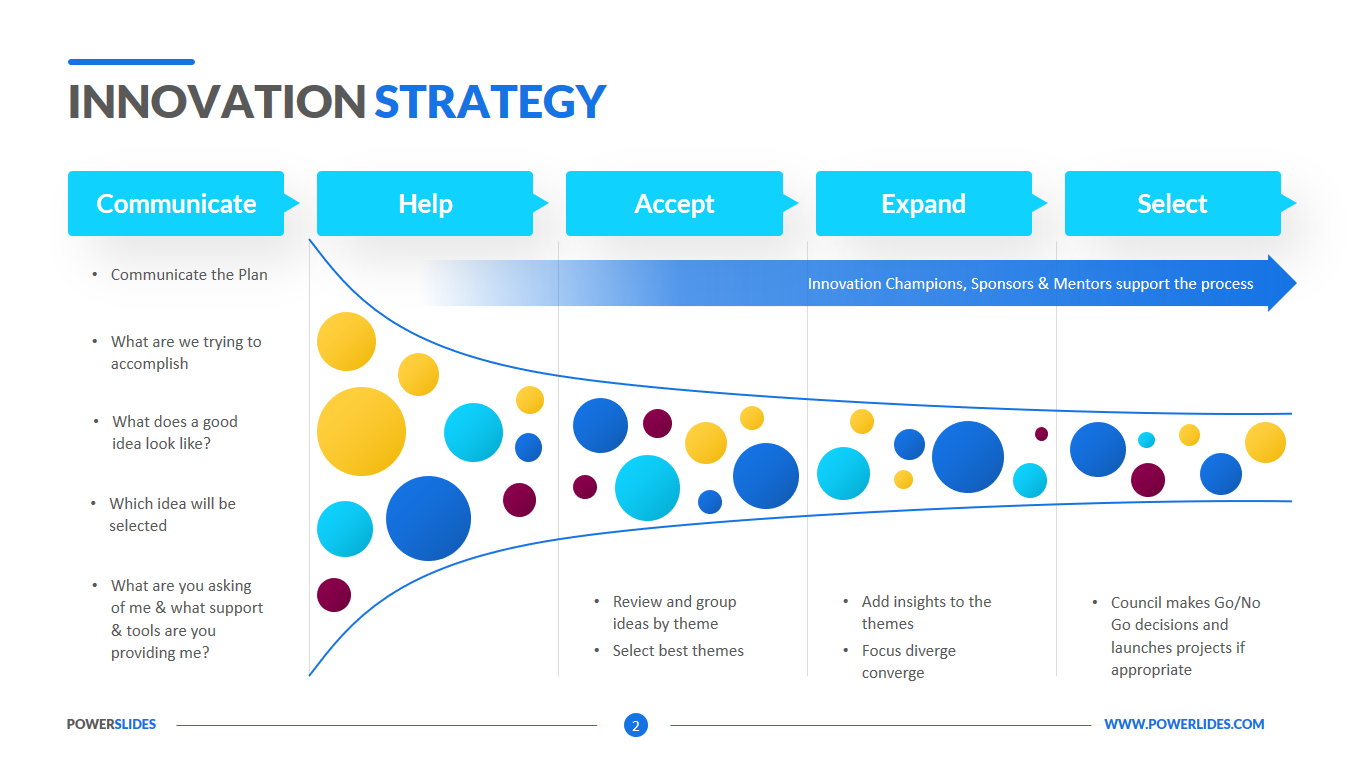
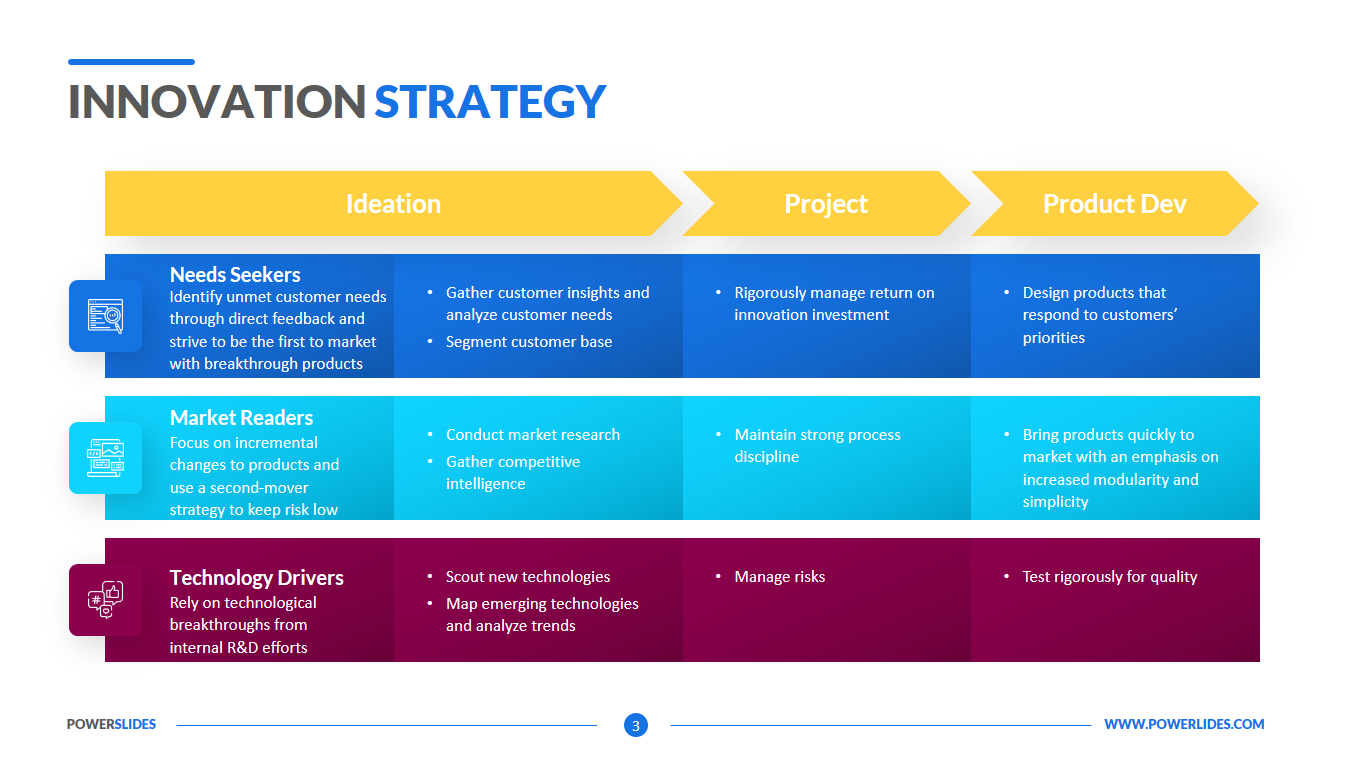
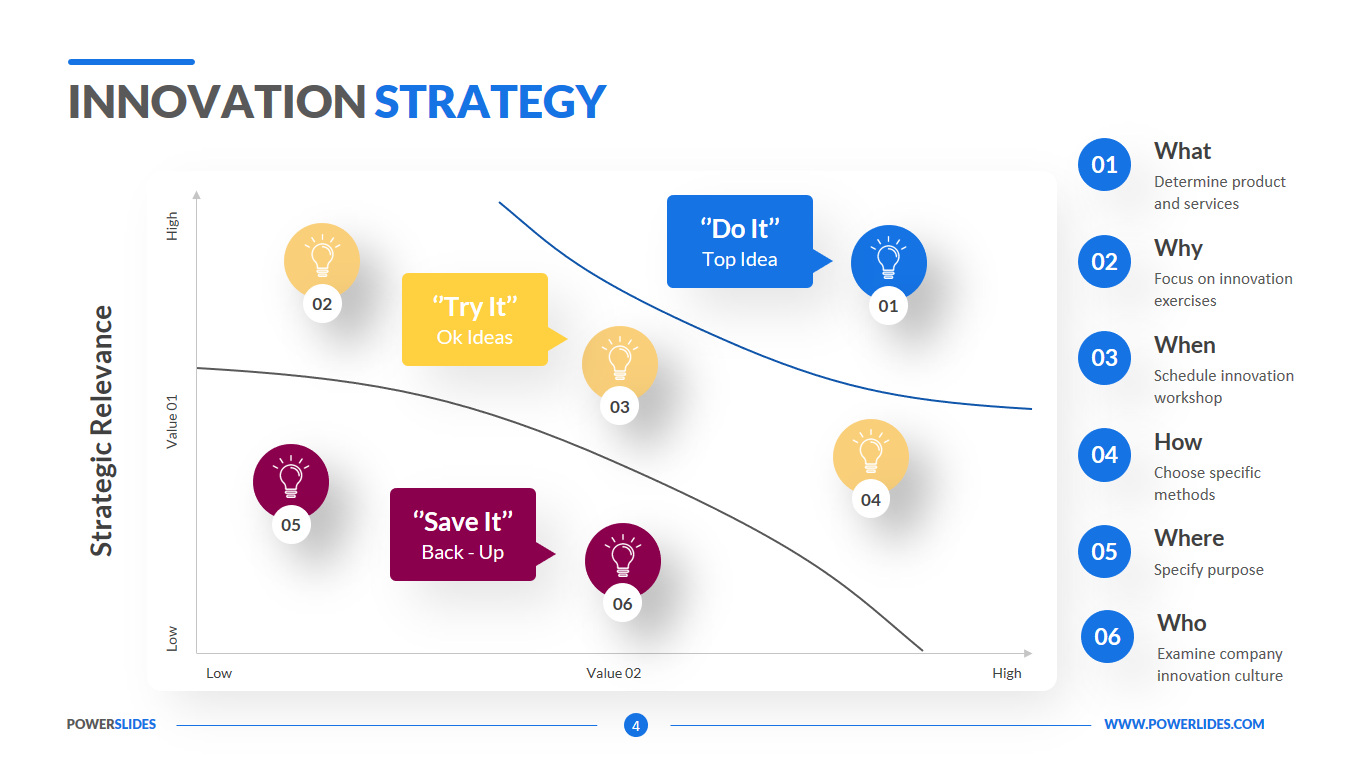
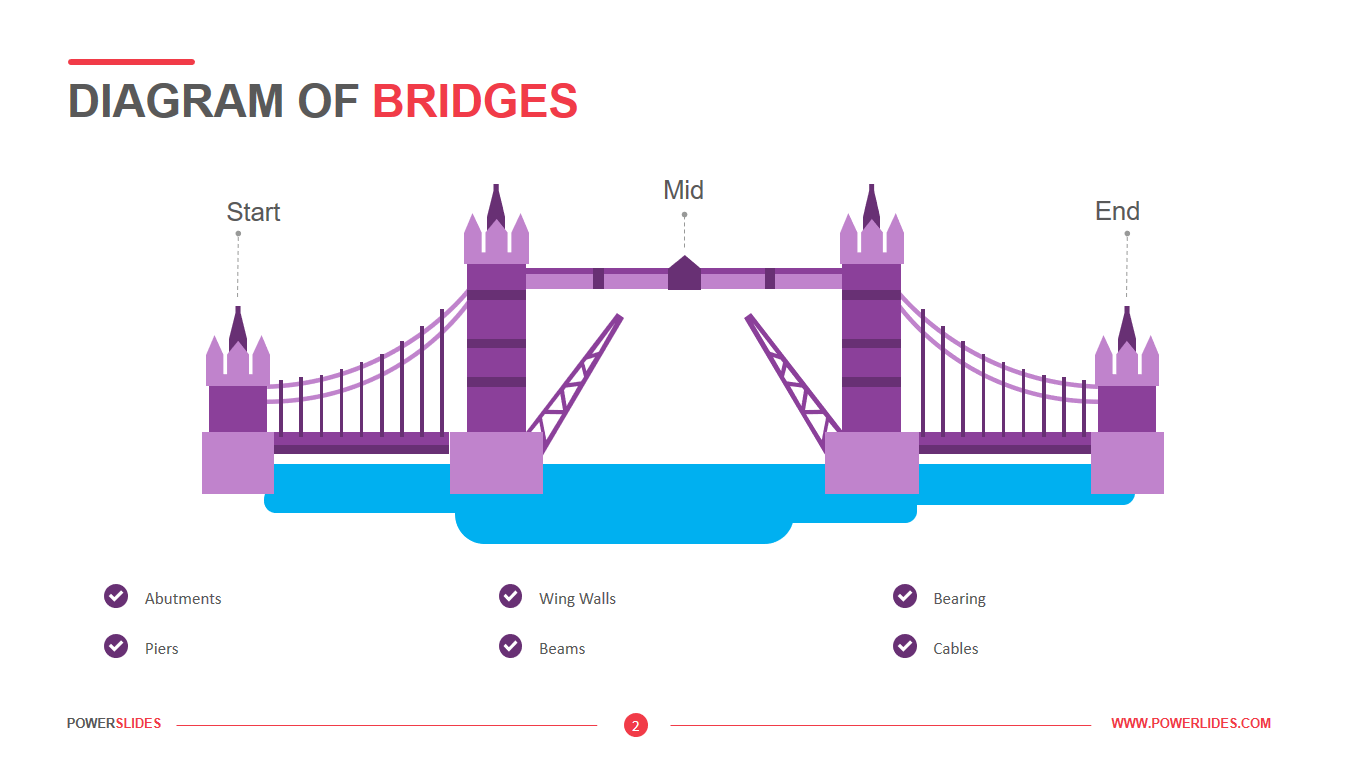
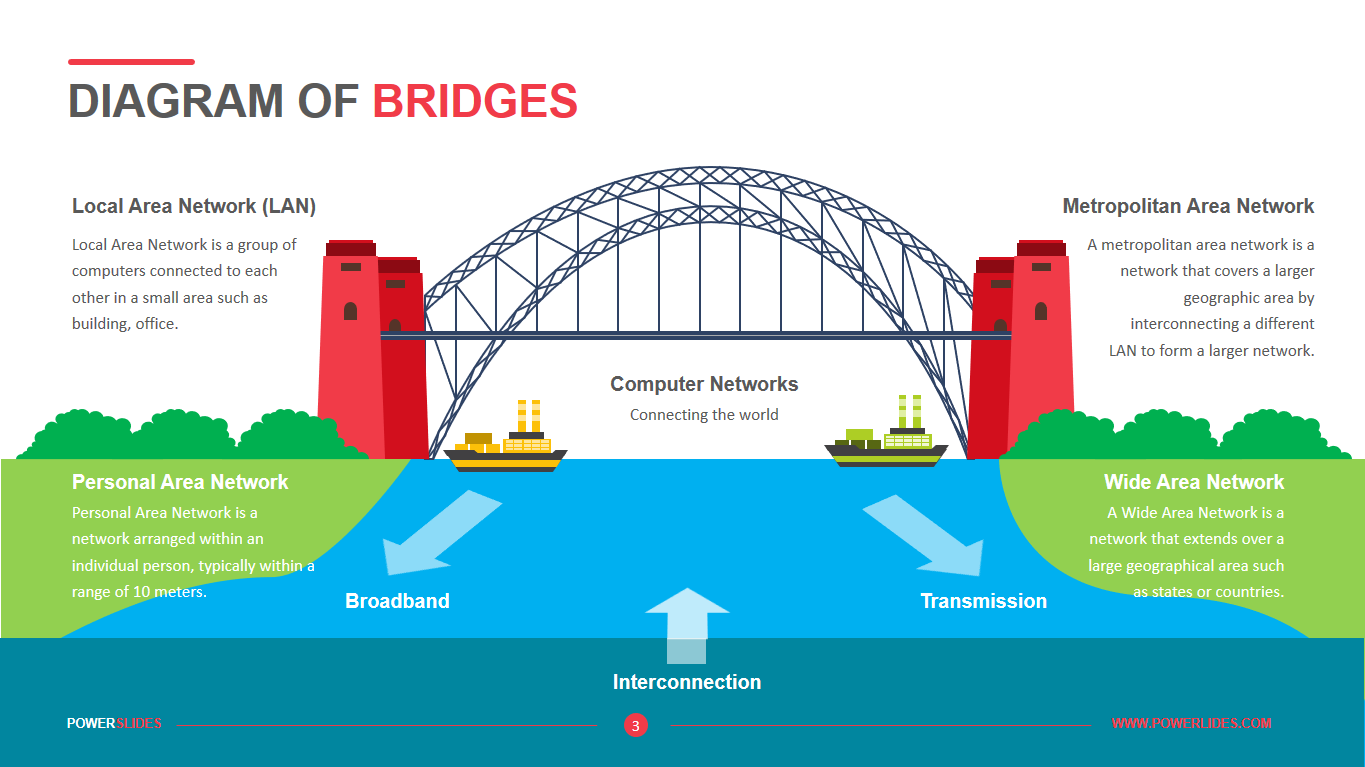
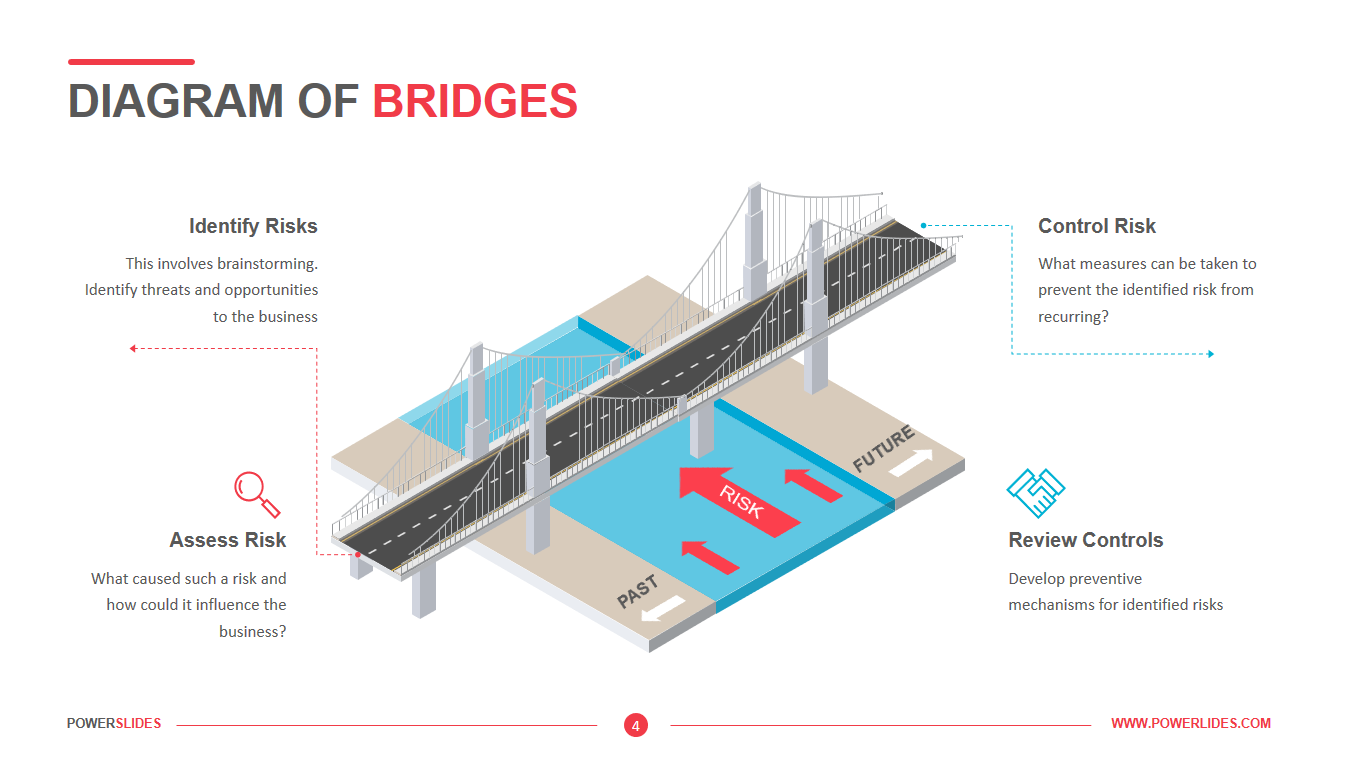
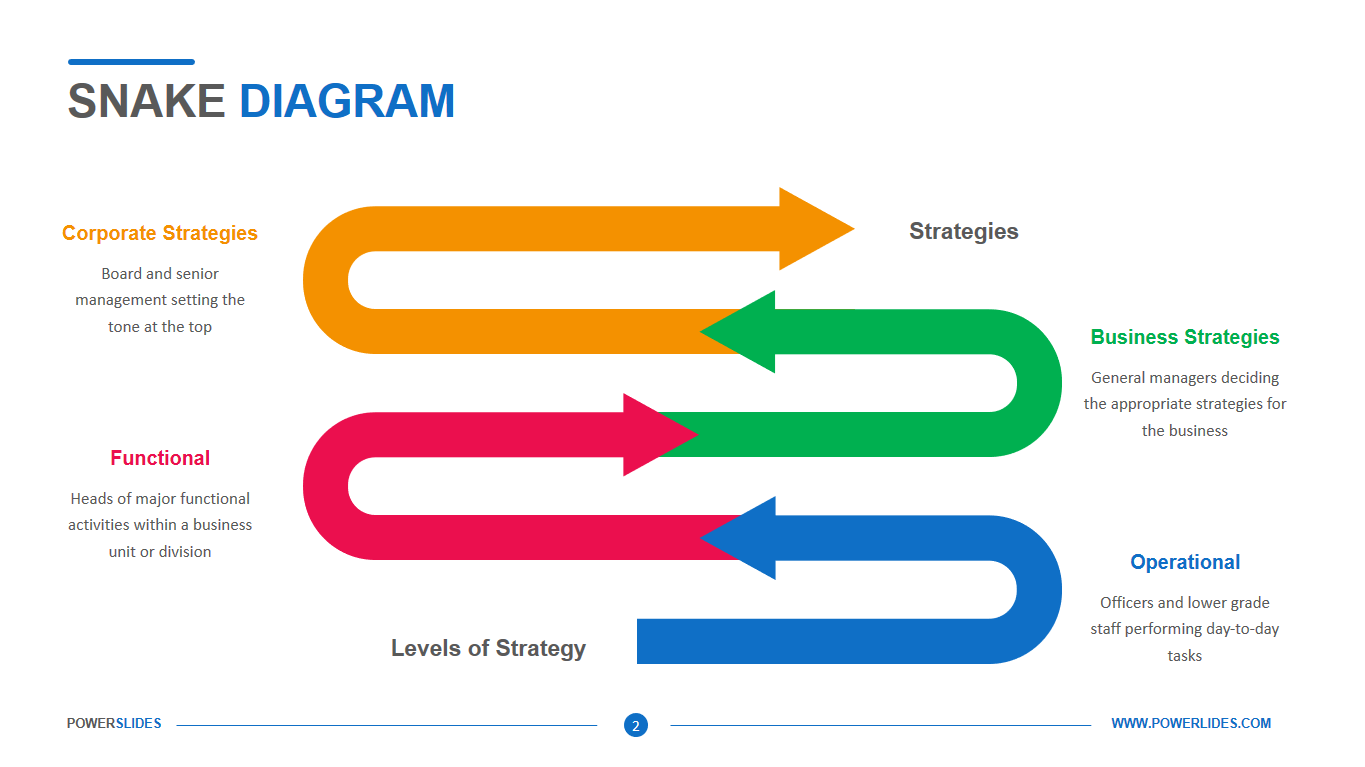
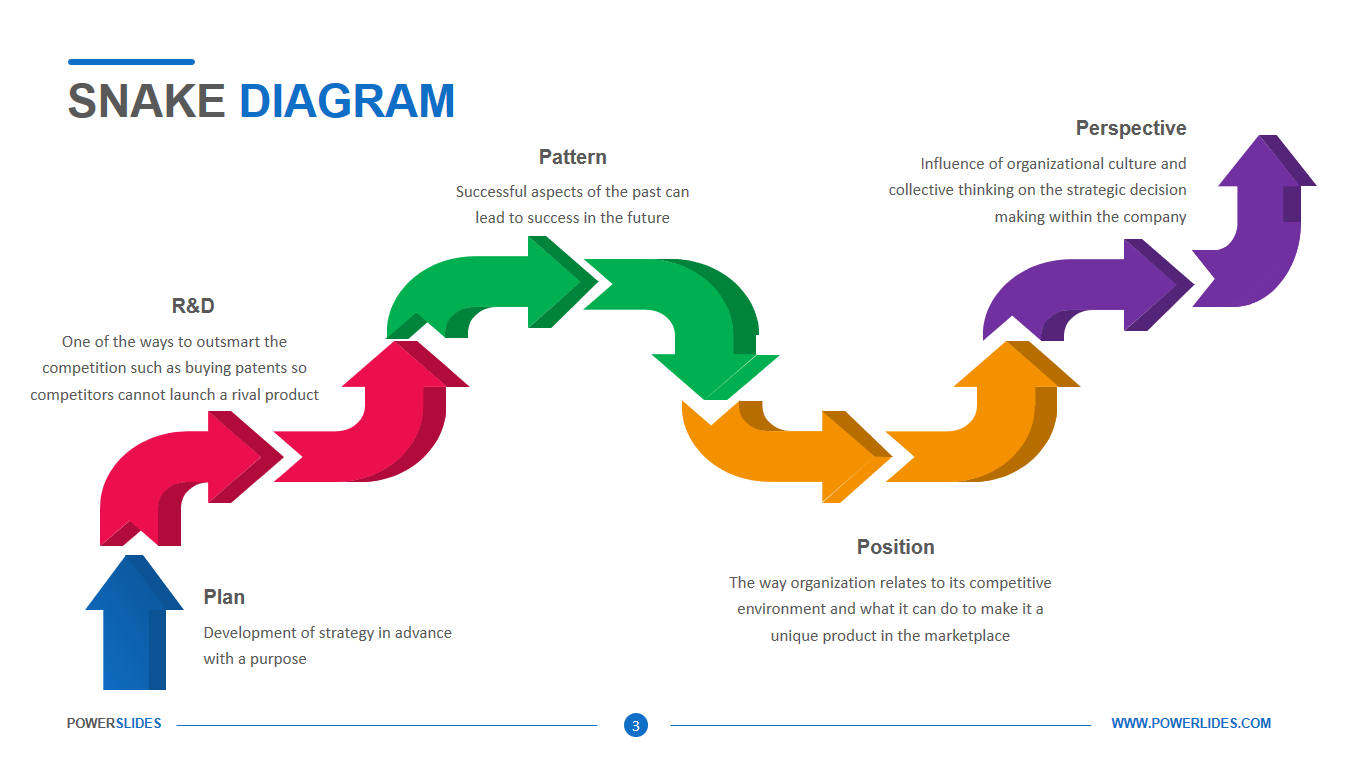
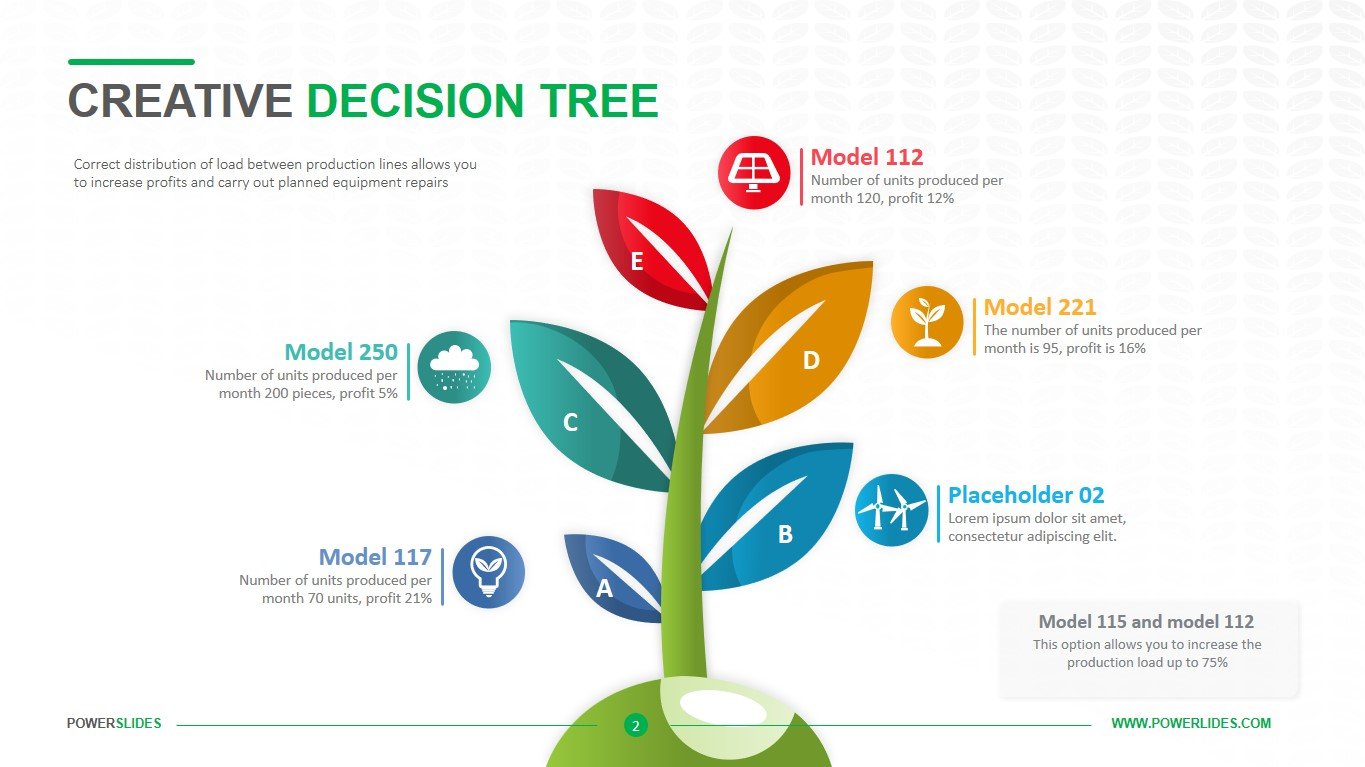
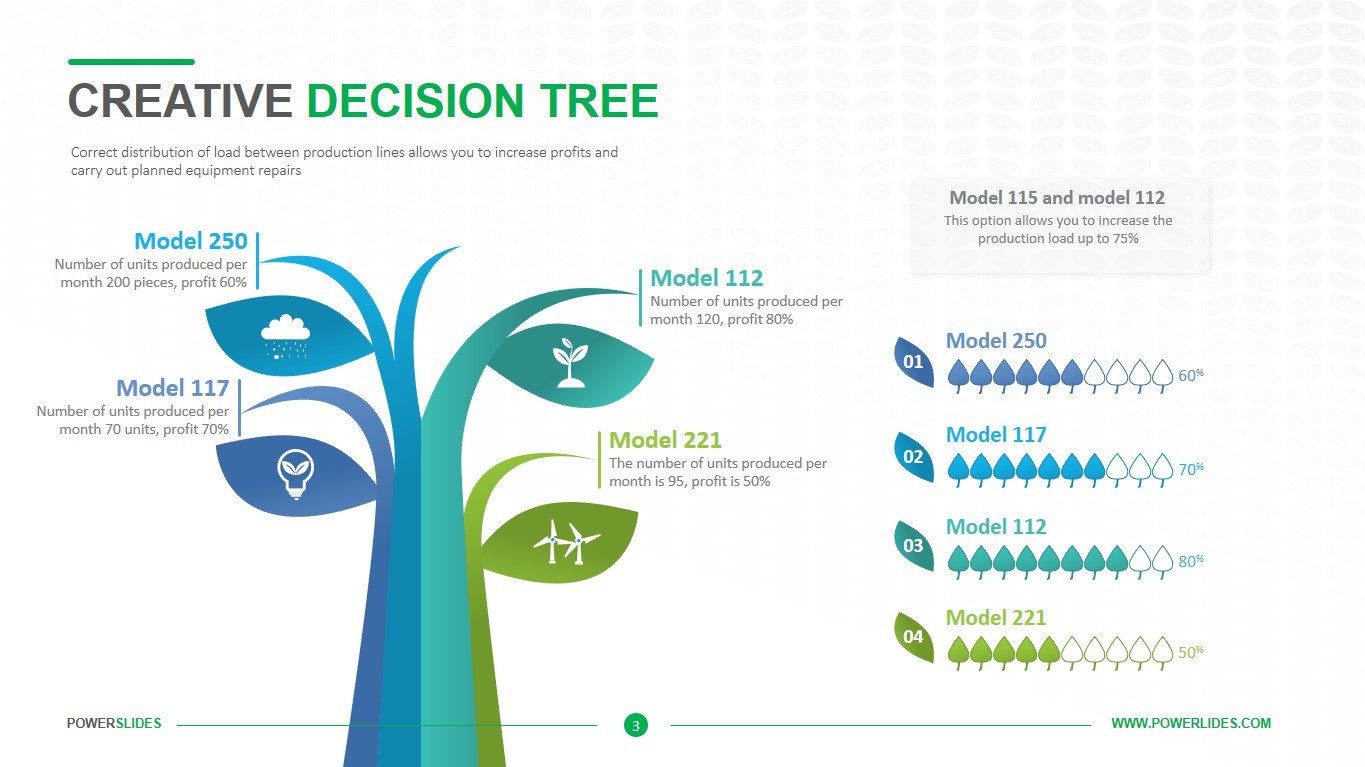
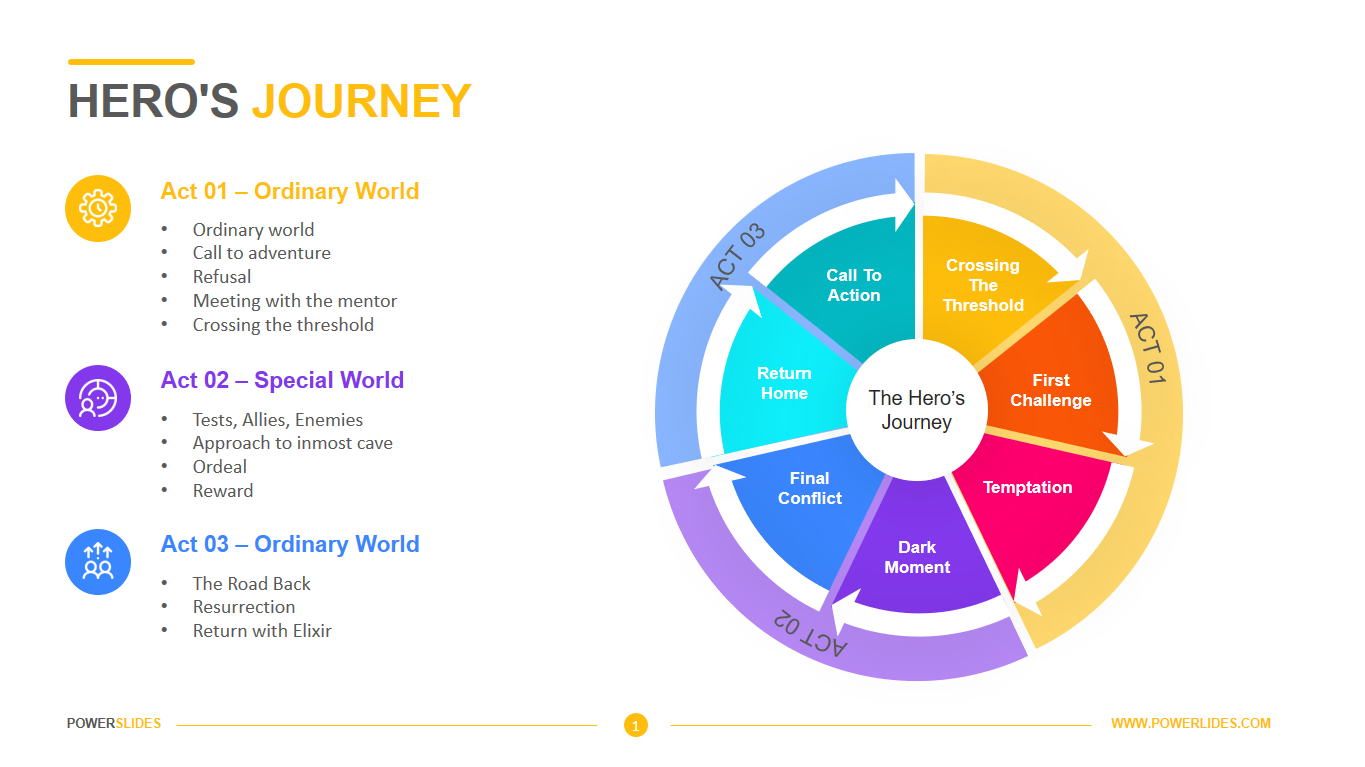
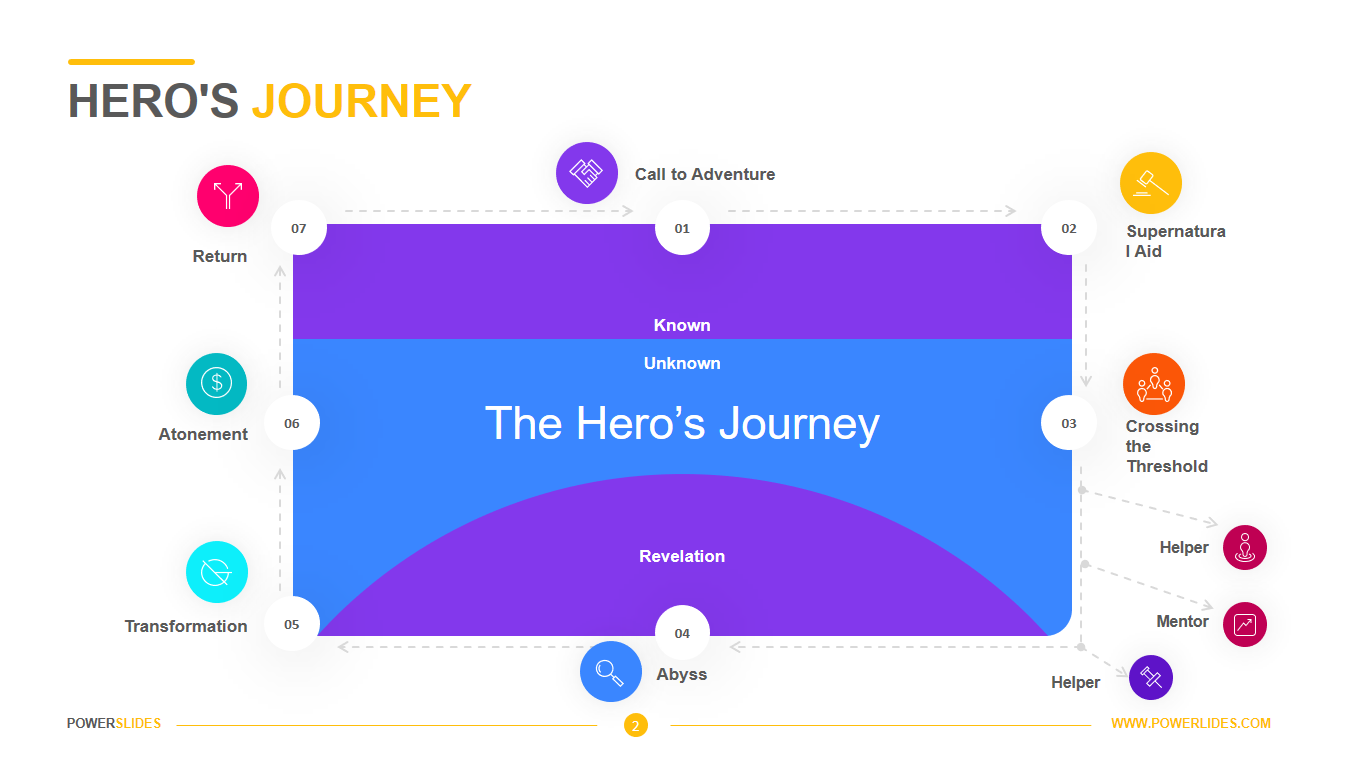
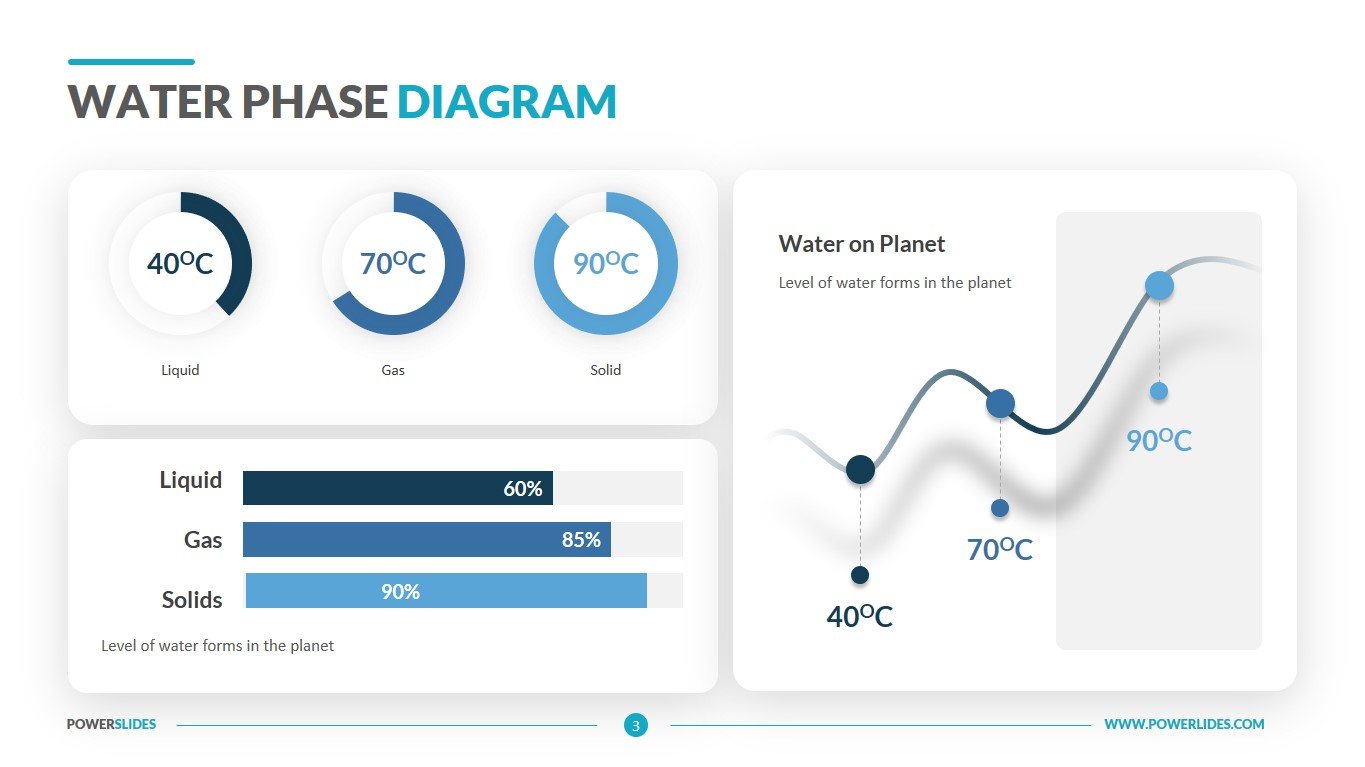
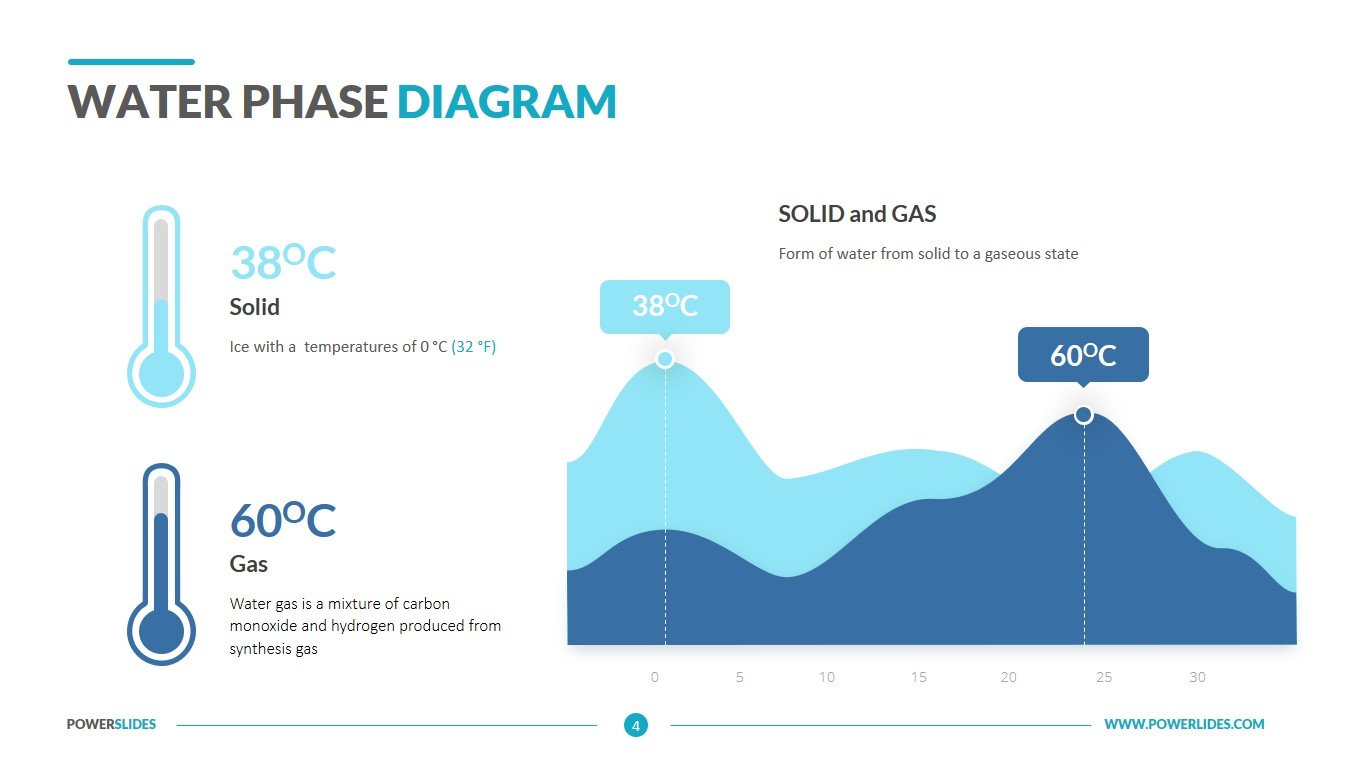
The first slide of the template is a large infographic of the three phases of water. You can provide brief information for each phase. The slide can be used by school teachers when preparing a course in natural history. The second slide brings information about the water cycle in nature to the audience in an easy and accessible way. You can explain complex processes in nature to schoolchildren in an easy and playful way. The next slide contains several graphs, charts, and histograms. You can specify different data about water in different phases. Also, this slide can be used by economists and sales managers in their daily work. You can easily modify this slide for economic analysis or sales report. The last slide gives you the opportunity to show the amount of water in its various states. You can also use this slide when comparing product dew points or alloy melting points.
You can independently change the color, size and position of any elements on the slide. Thus, you can prepare this template for your corporate requirements. This template will be able to complement any of your presentation and will take its rightful place in your collection.


