Cohort Analysis
What do you think of this template?

 (3.00/ 5)
6 ratings

 4 Slides
 File size: 16:9
 Fonts: Lato Black, Calibri
 Supported version
PPT 2010, PPT 2013, PPT 2016
Supported version
PPT 2010, PPT 2013, PPT 2016

Product details
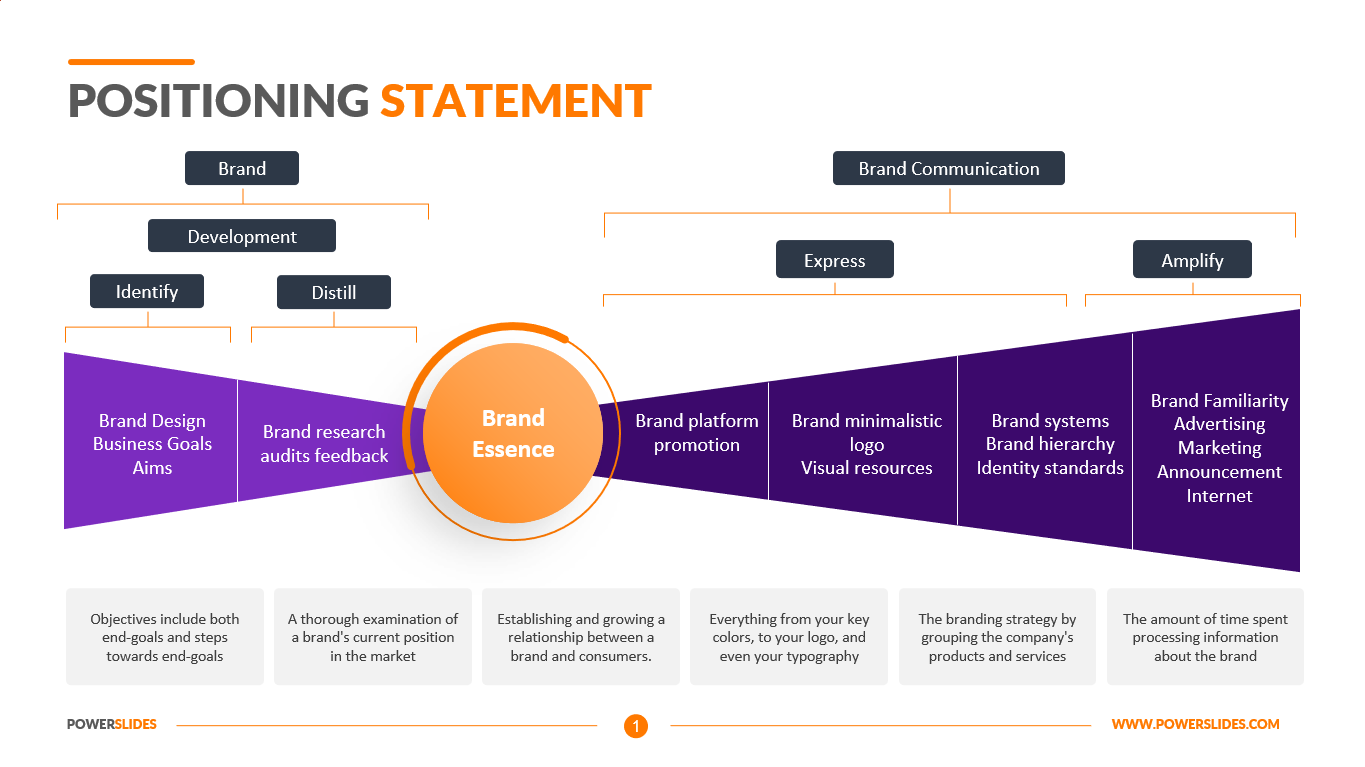
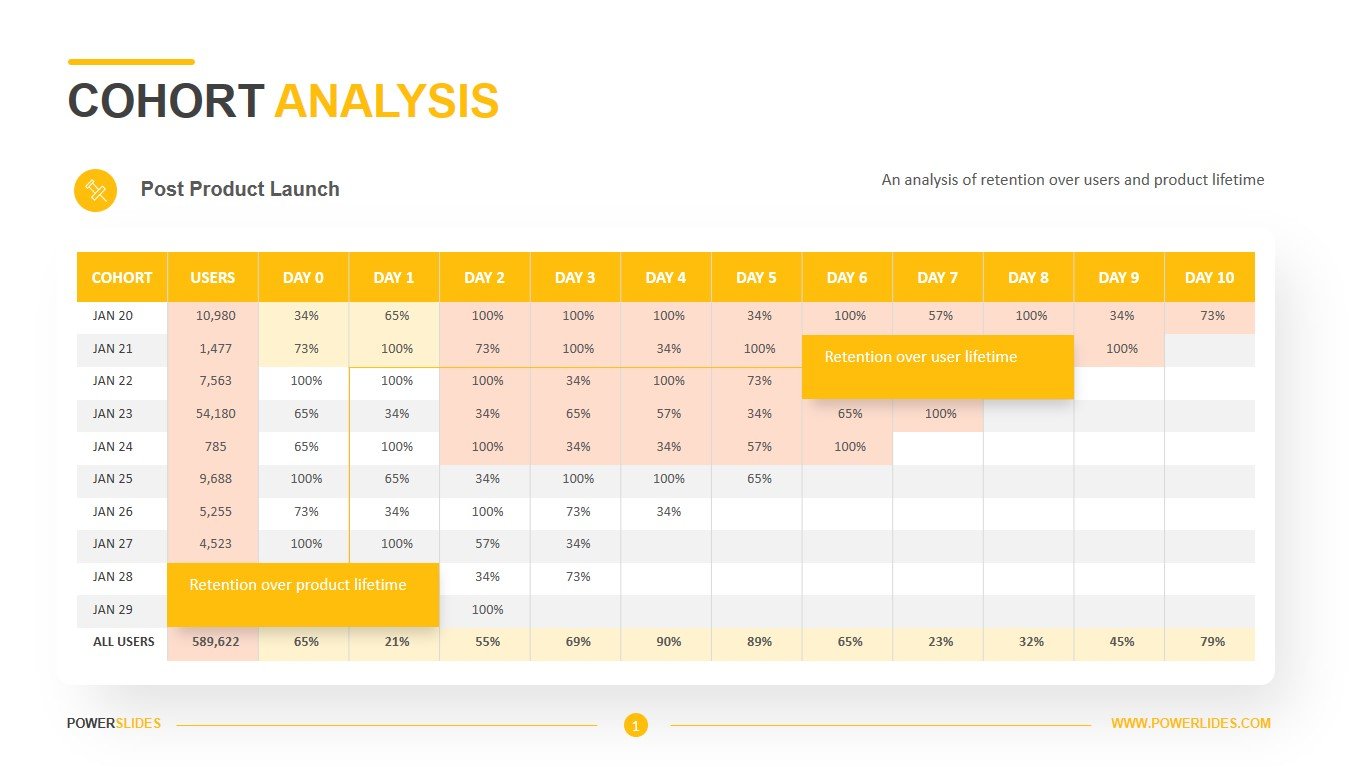
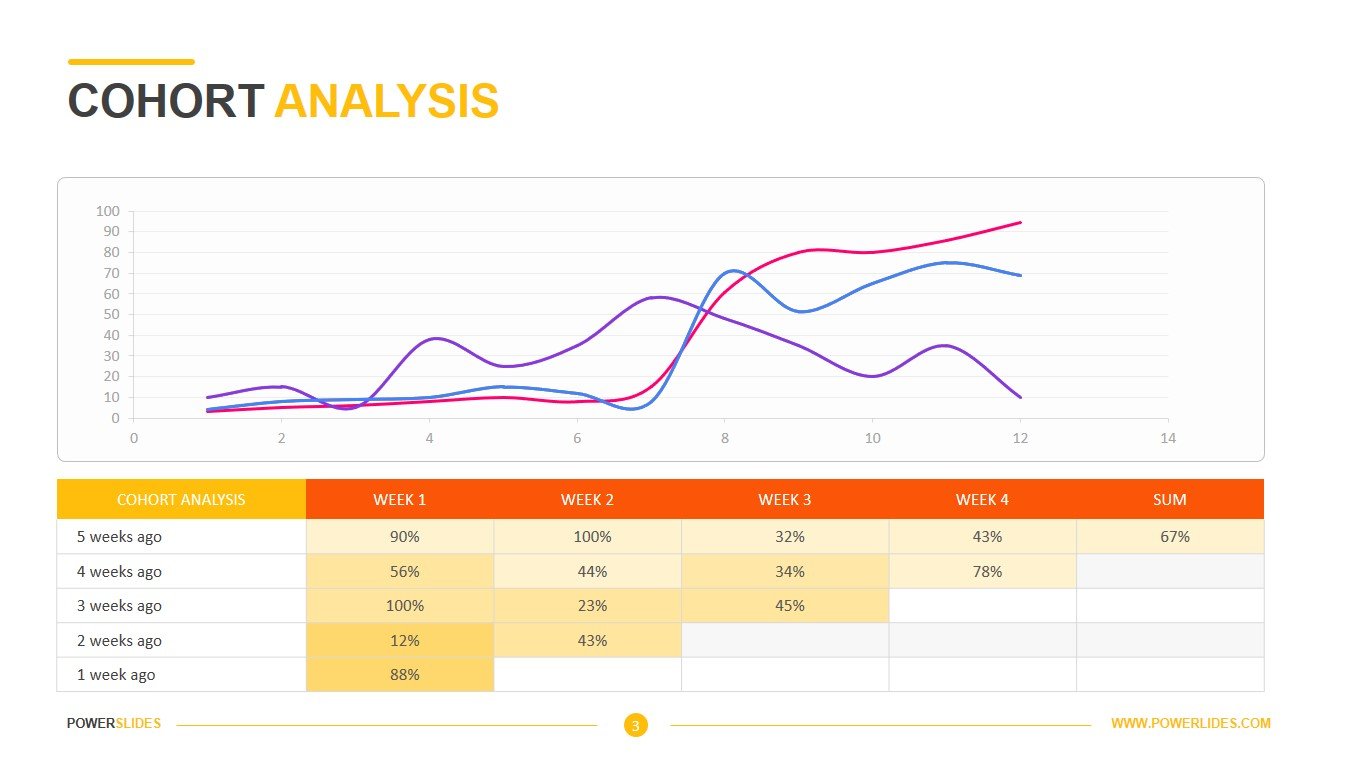
Cohort analysis is a subset of behavioral analytics that takes the data from a given eCommerce platform, web application, or online game and rather than looking at all users as one unit, it breaks them into related groups for analysis. These related groups, or cohorts, usually share common characteristics or experiences within a defined time-span. Cohort analysis is a tool to measure user engagement over time. It helps to know whether user engagement is actually getting better over time or is only appearing to improve because of growth. Cohort analysis proves to be valuable because it helps to separate growth metrics from engagement metrics. Growth can easily mask engagement problems. In reality, the lack of activity of the old users is being hidden by the impressive growth numbers of new users. It results in concealing the lack of engagement from a small number of people.
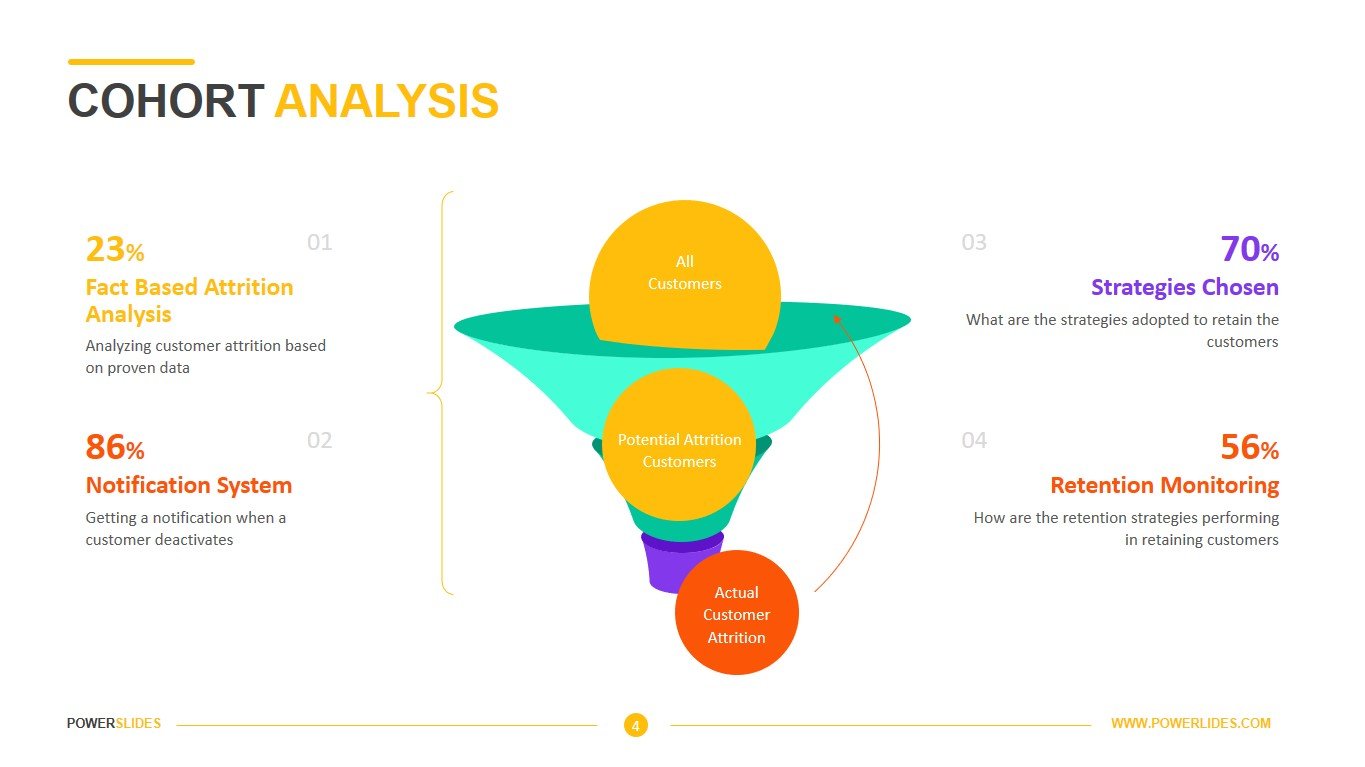
Cohort analysis involves looking at the groups of people, over time, and observing how their behavior changes. For instance, if we send out an email notification to 100 people, some may buy the product on day 1, less on day 2, even fewer on day 3, and so on. But, if we send another email to 100 people, after a few weeks, they’ll be buying the product on their “day 0” while the first sent email might show its prevalent lag effect on the buying decision. There are two types of cohorts – behavioral cohorts and attraction cohorts. For example, acquisition cohorts measure how long people continue to use your app from the start. Behavioral cohorts allow you to track how long different cohorts remain active in your application after performing certain actions. The power of cohort analysis is that it allows you to not only see which customers are leaving and when they are leaving, but also to understand why customers are leaving your application so you can fix it.
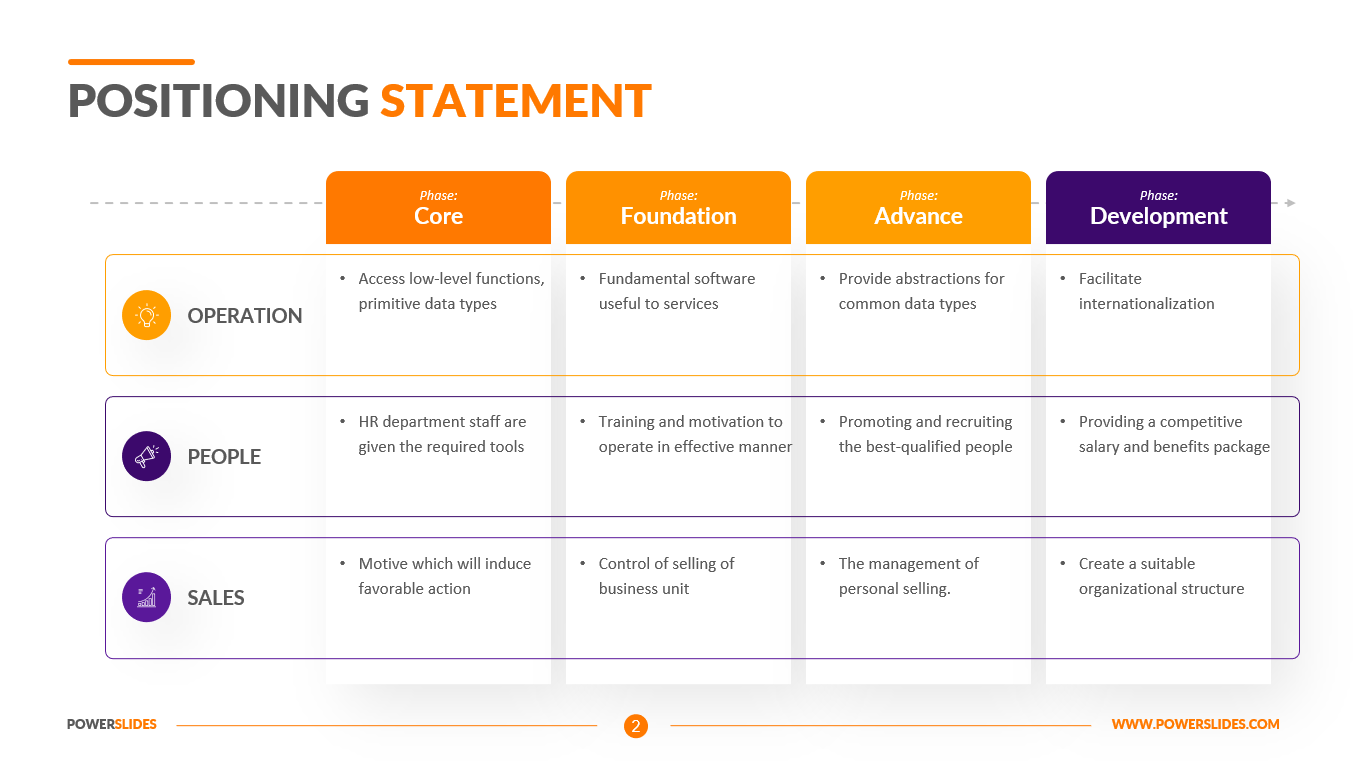
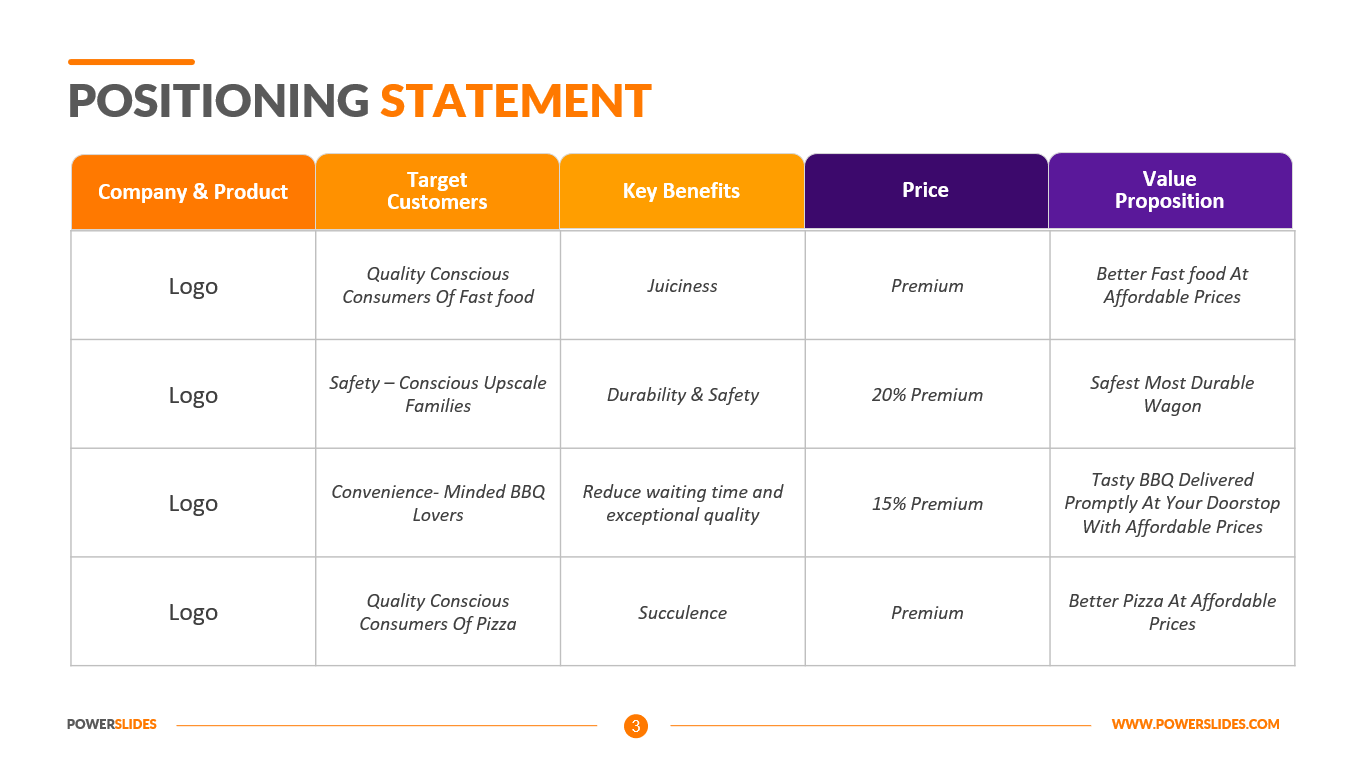
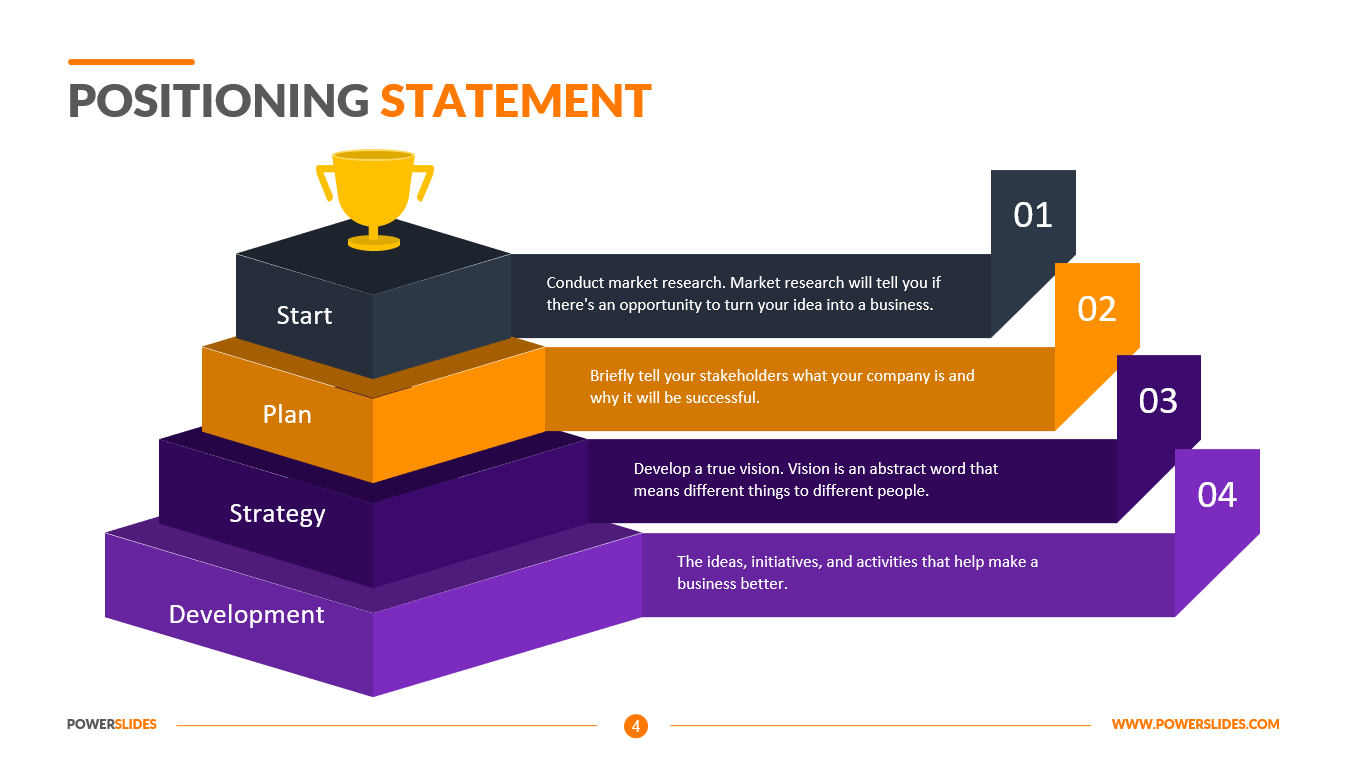
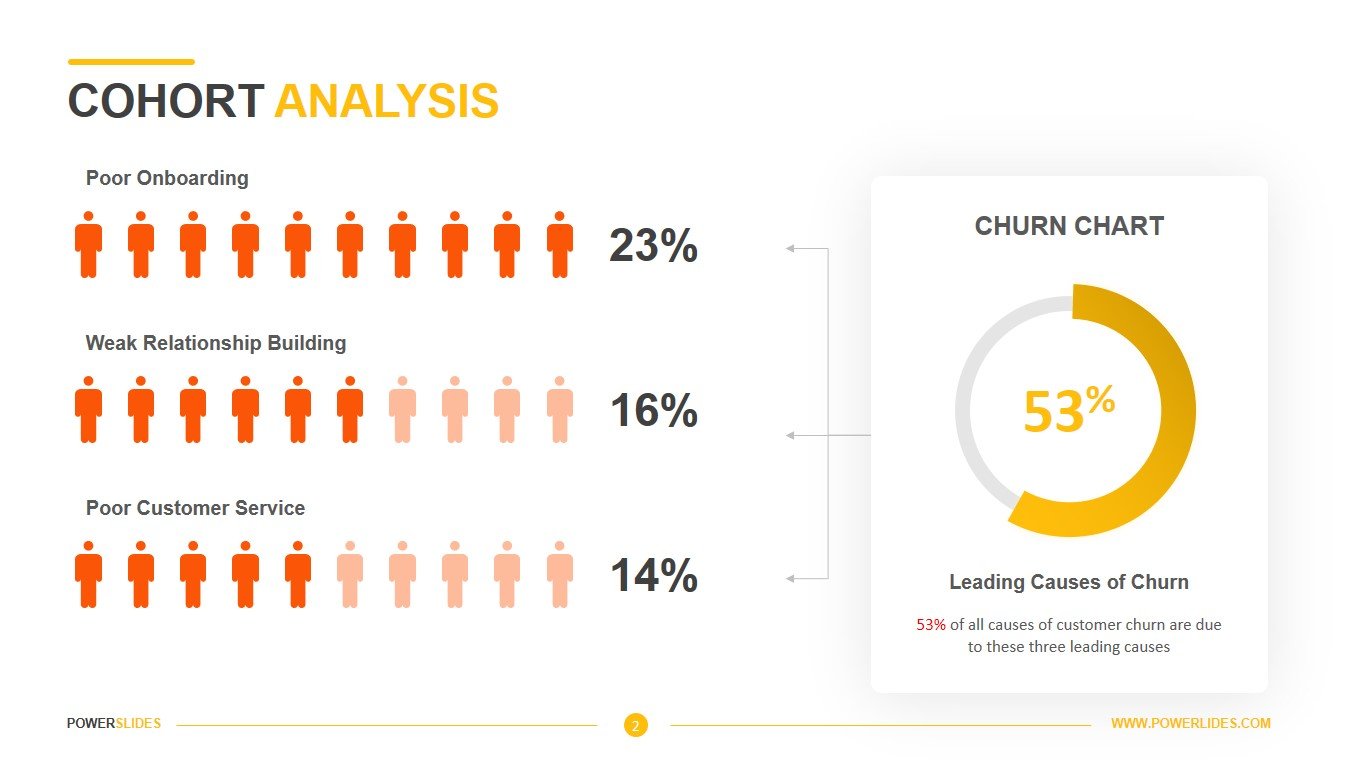
The Cohort Analysis template allows you to take full advantage of all the tools you need to build your analysis. You can analyze user interaction with your post or determine the conversion rate of your ad on social media. Marketers and ad agency employees can provide customer satisfaction survey data for a company’s services. The second slide allows you to display the overall percentage of dissatisfied customers and indicate the main reasons for customer dissatisfaction. The next slide provides opportunities for building various graphs and placing a table with data. For example, you can display statistics on interactions with your three ad posts that have different content. As a result of the analysis, you will be able to determine the most effective, in terms of advertising, filling the post with text and images. The last slide of the template gives you the opportunity to introduce a sales funnel and provide a short explanation for each customer category. This template will be useful for heads of sales departments and sales managers. This template is a must-have for startups, analysts to marketing professionals.


