BCG Matrix
What do you think of this template?
 (5.00/ 5)
15 ratings

 4 Slides
 File size: 16:9
 Fonts: Lato Black, Calibri
 Supported version
PPT 2010, PPT 2013, PPT 2016
Supported version
PPT 2010, PPT 2013, PPT 2016

Product details
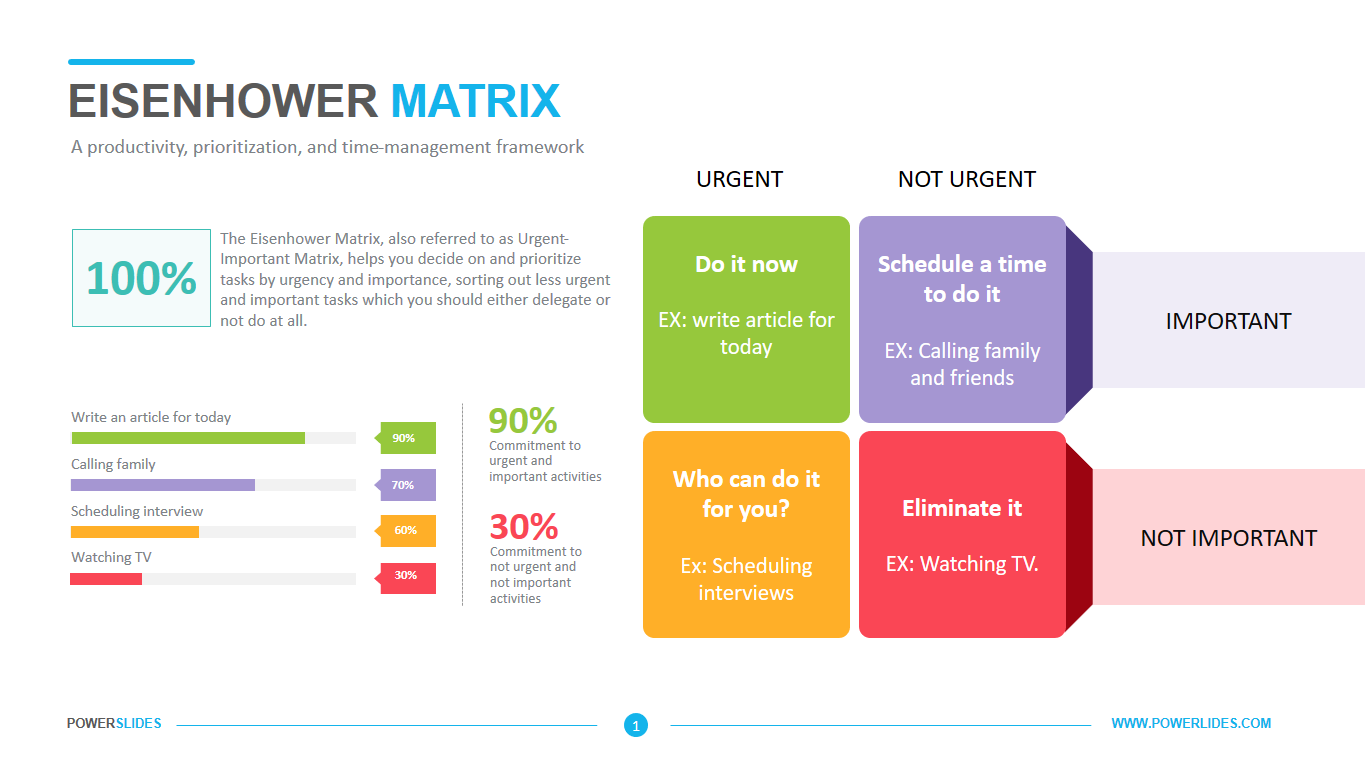
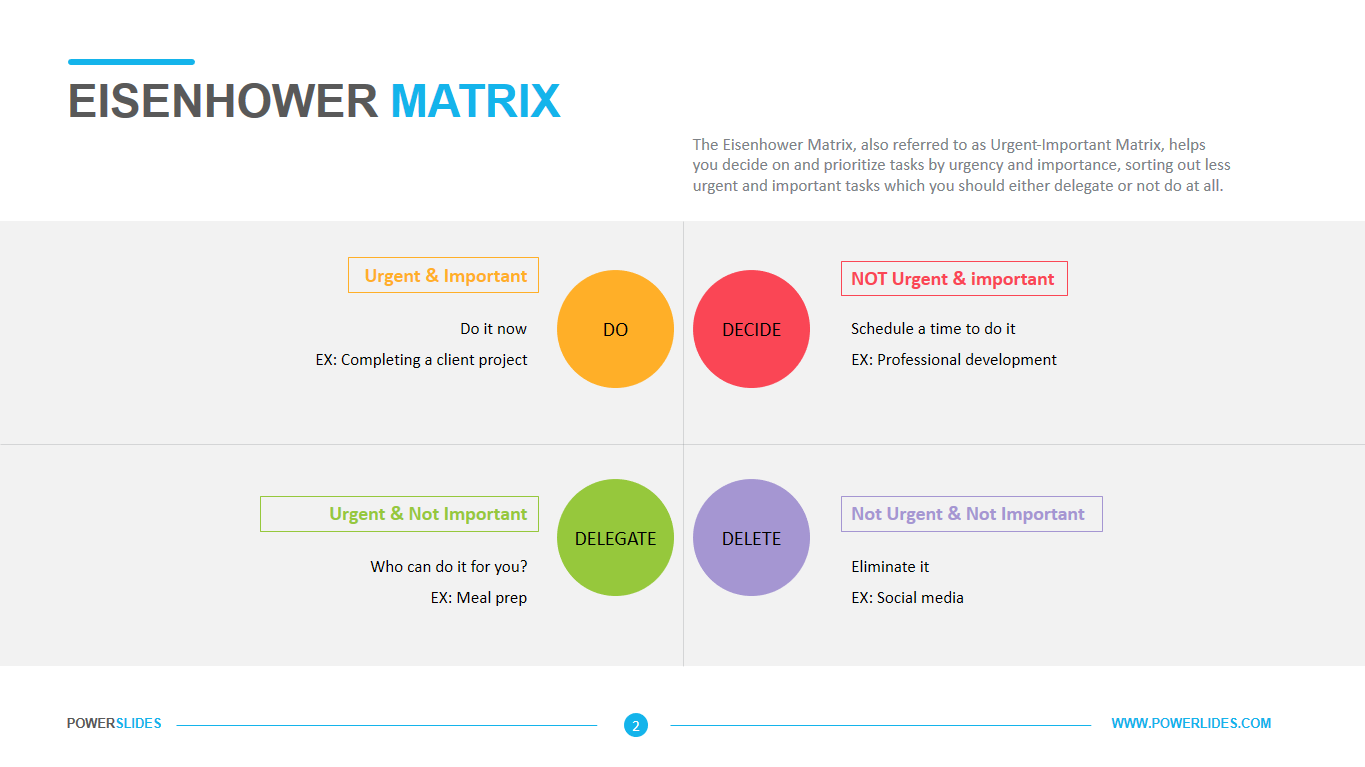
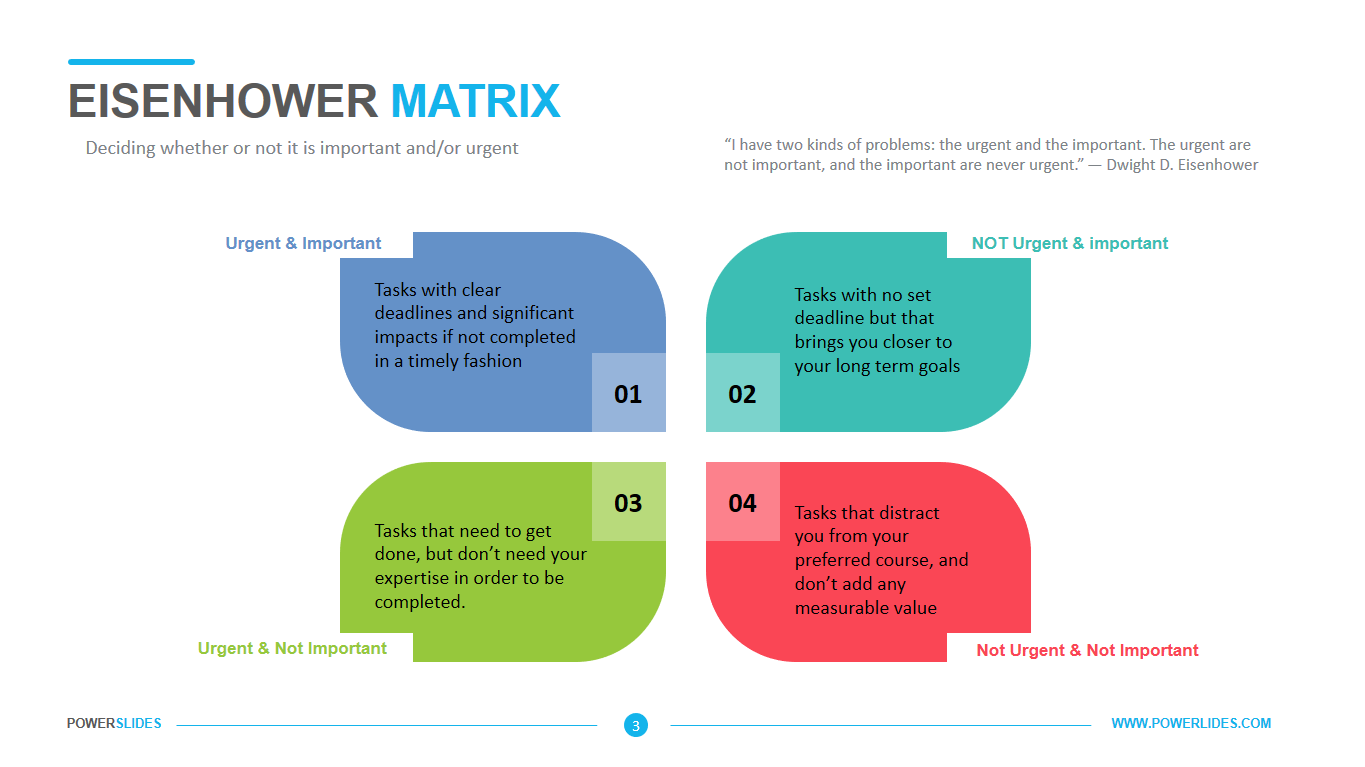
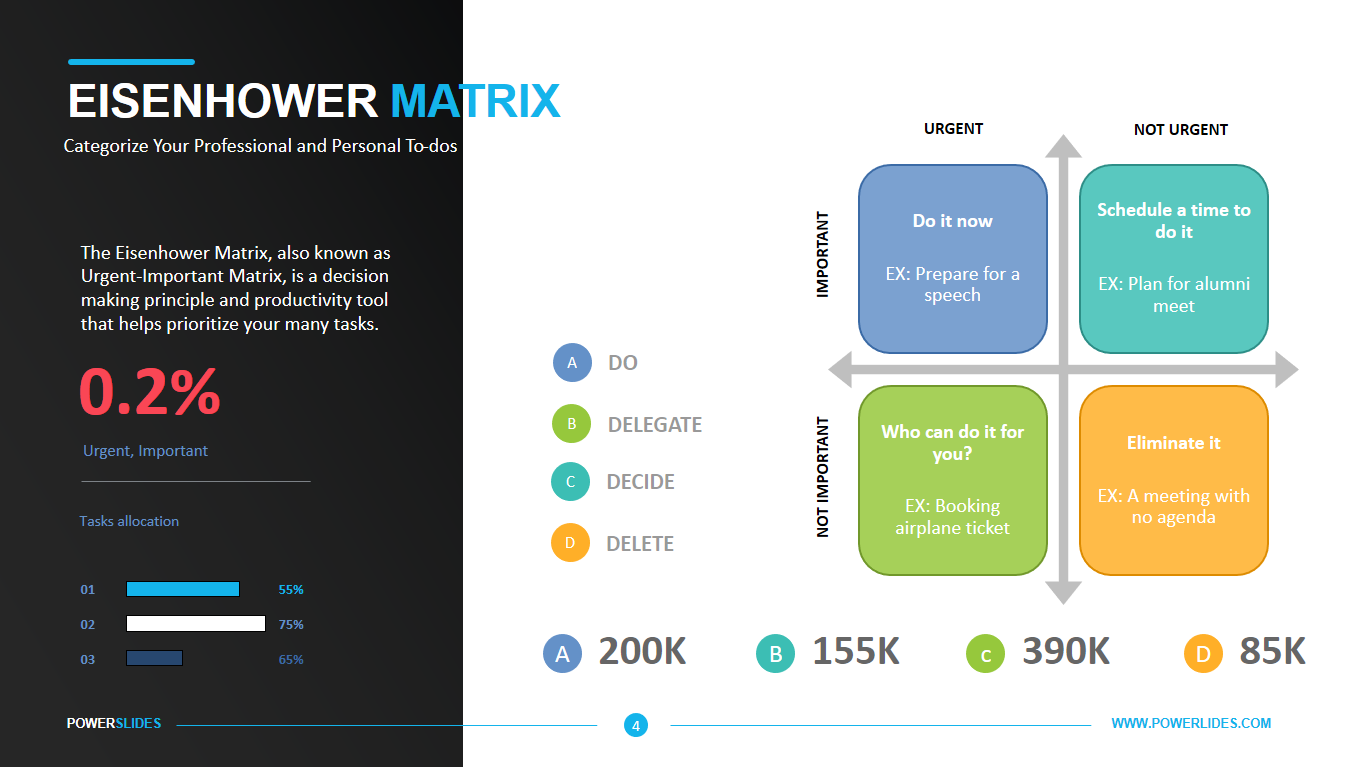
Business models are based on providing products or services that are profitable now, but they also attempt to identify changes in offerings that will keep the company profitable in the future. Created by the Boston Consulting Group, the BCG matrix – also known as the Boston or growth share matrix – provides a strategy for analyzing products according to growth and relative market share. The BCG model has been used since 1968 to help companies gain insights on what products best help them capitalize on market share growth opportunities and give them a competitive advantage.
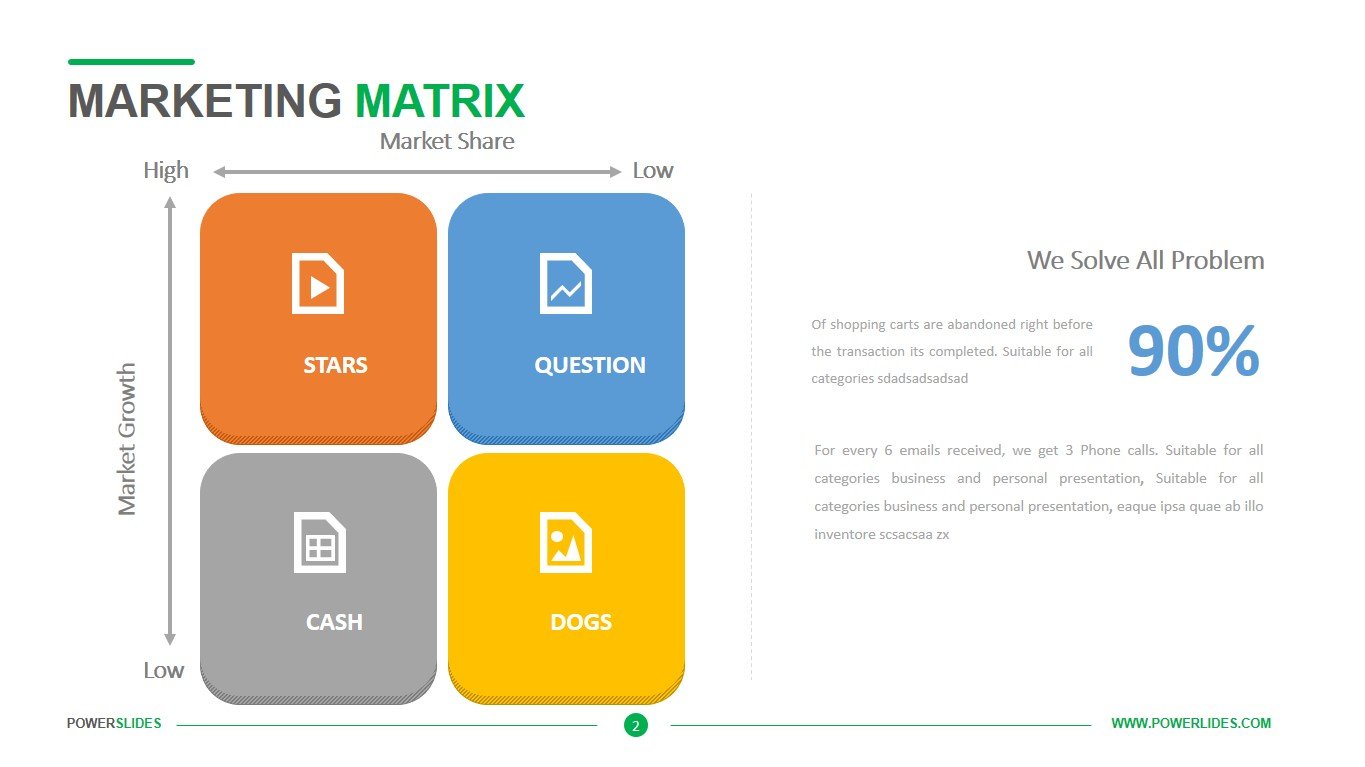
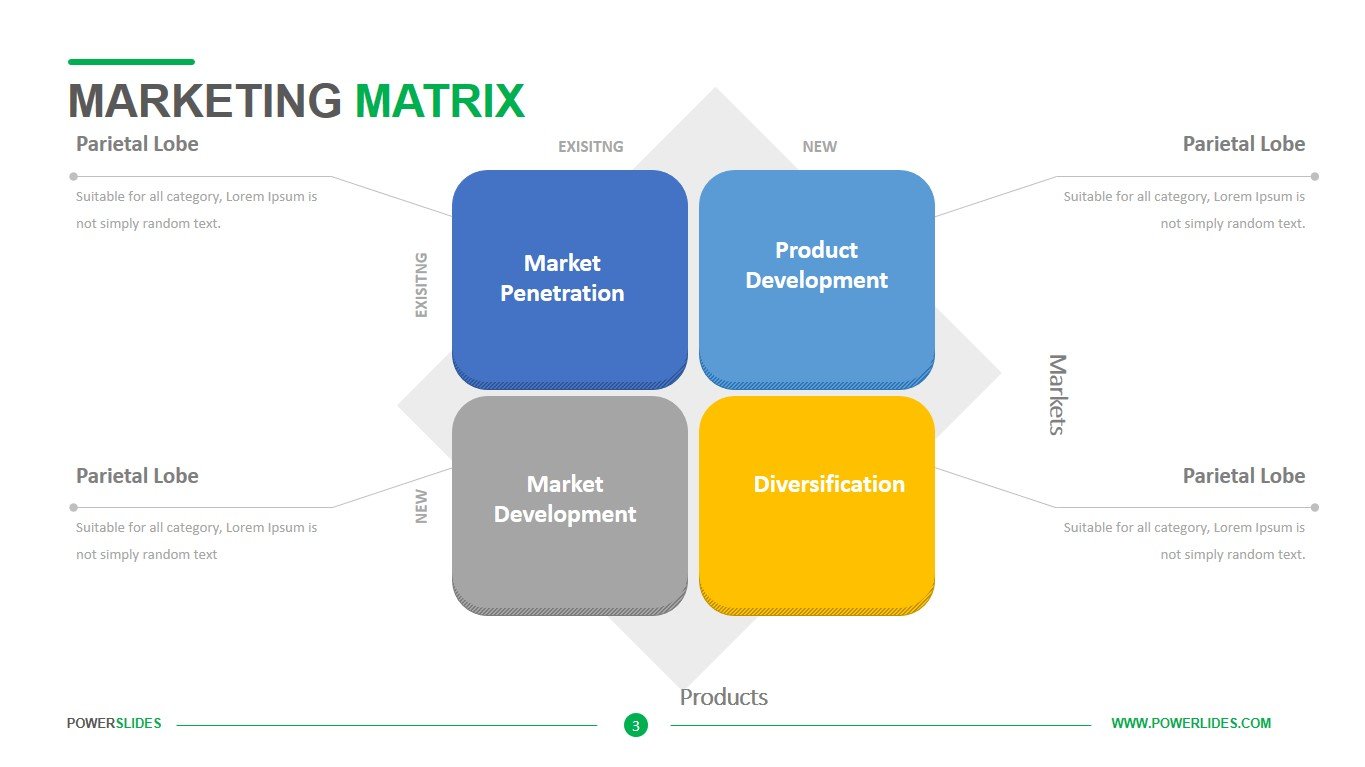
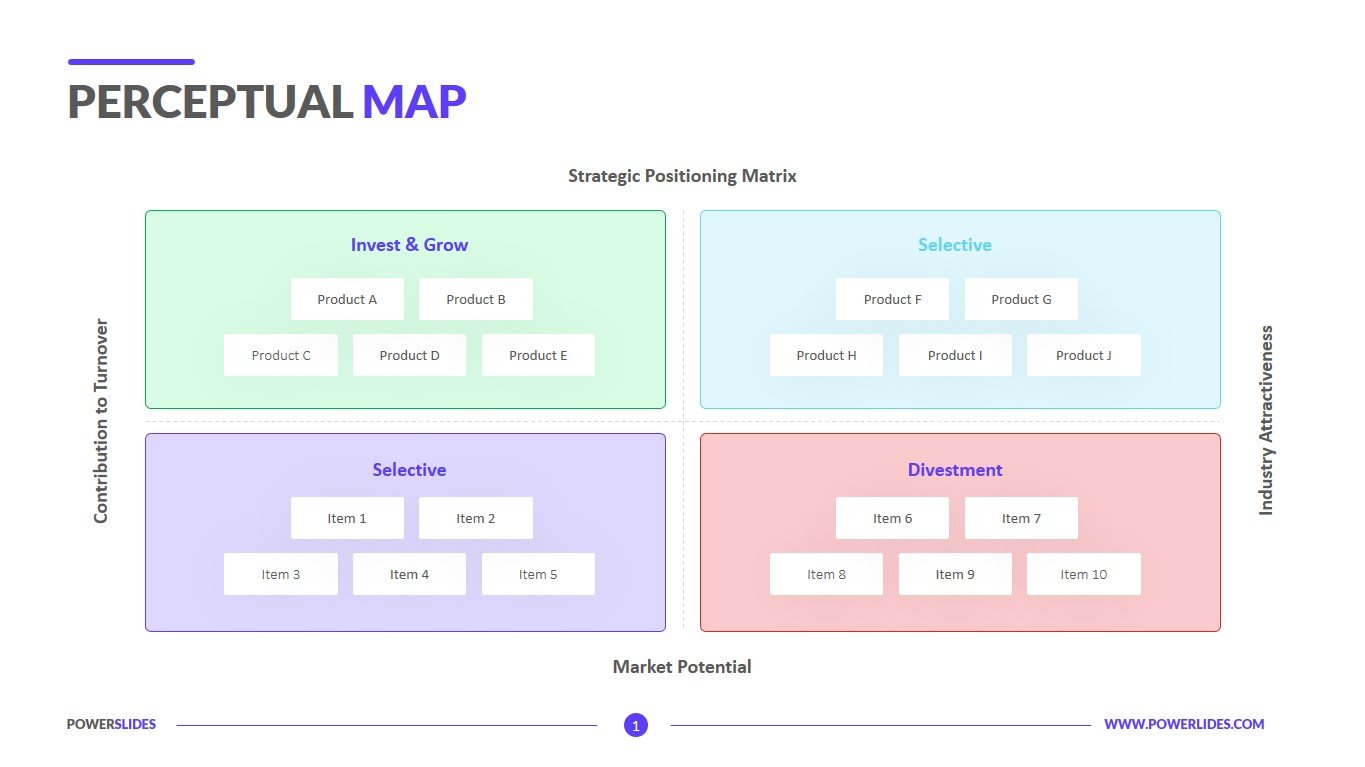
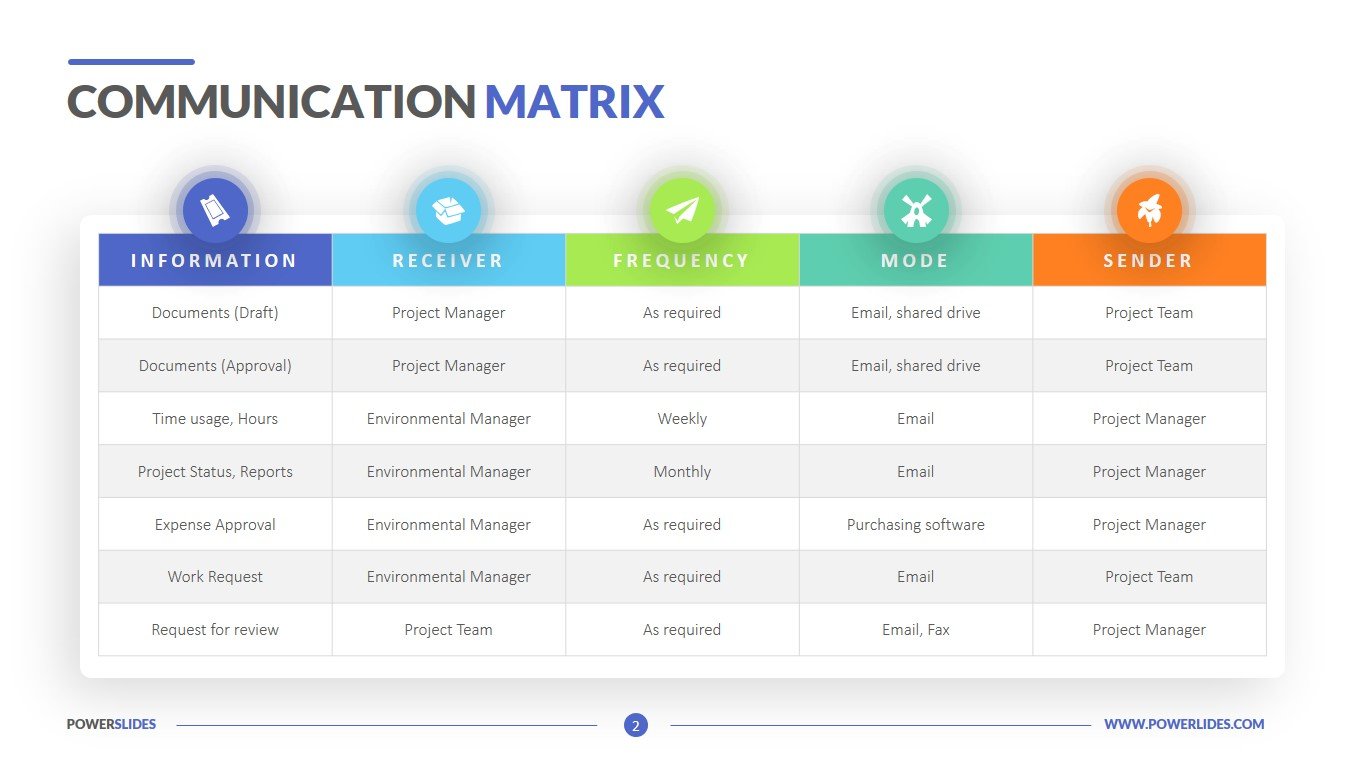
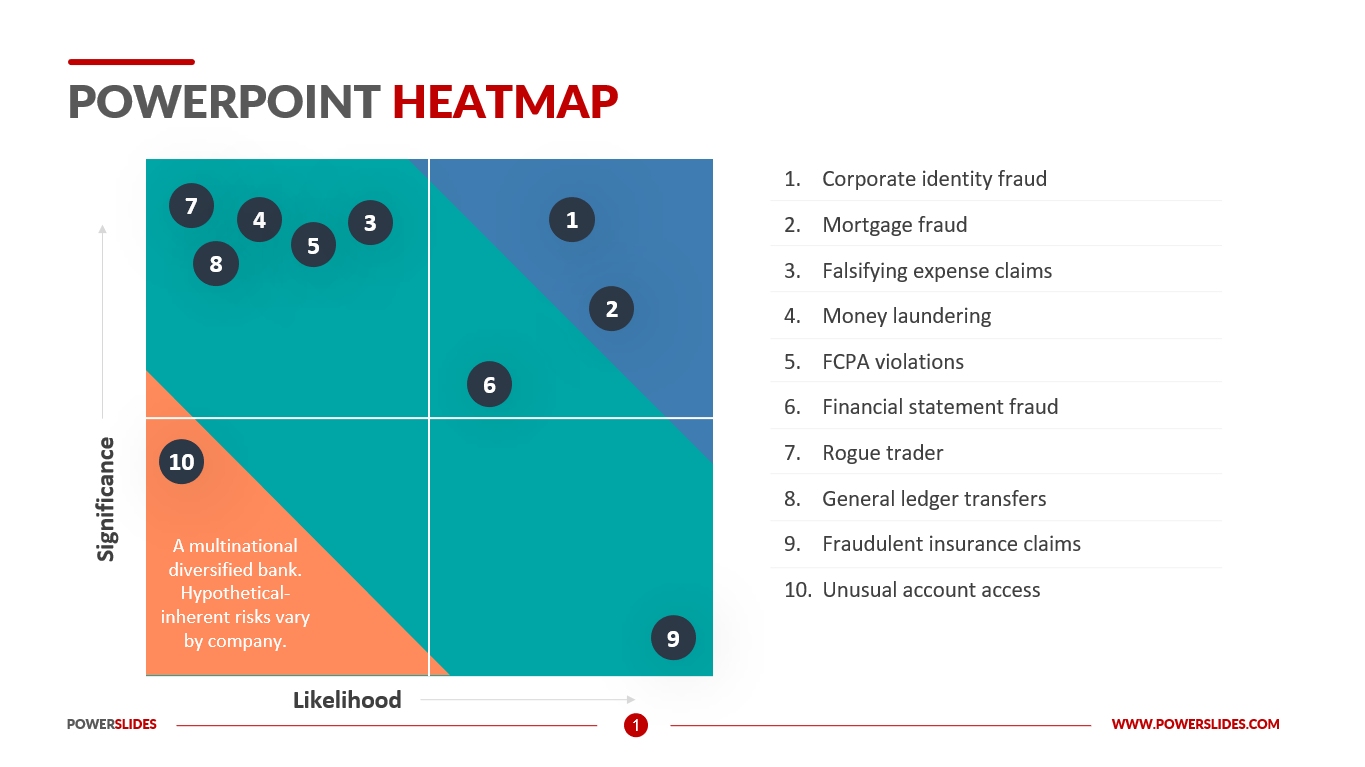
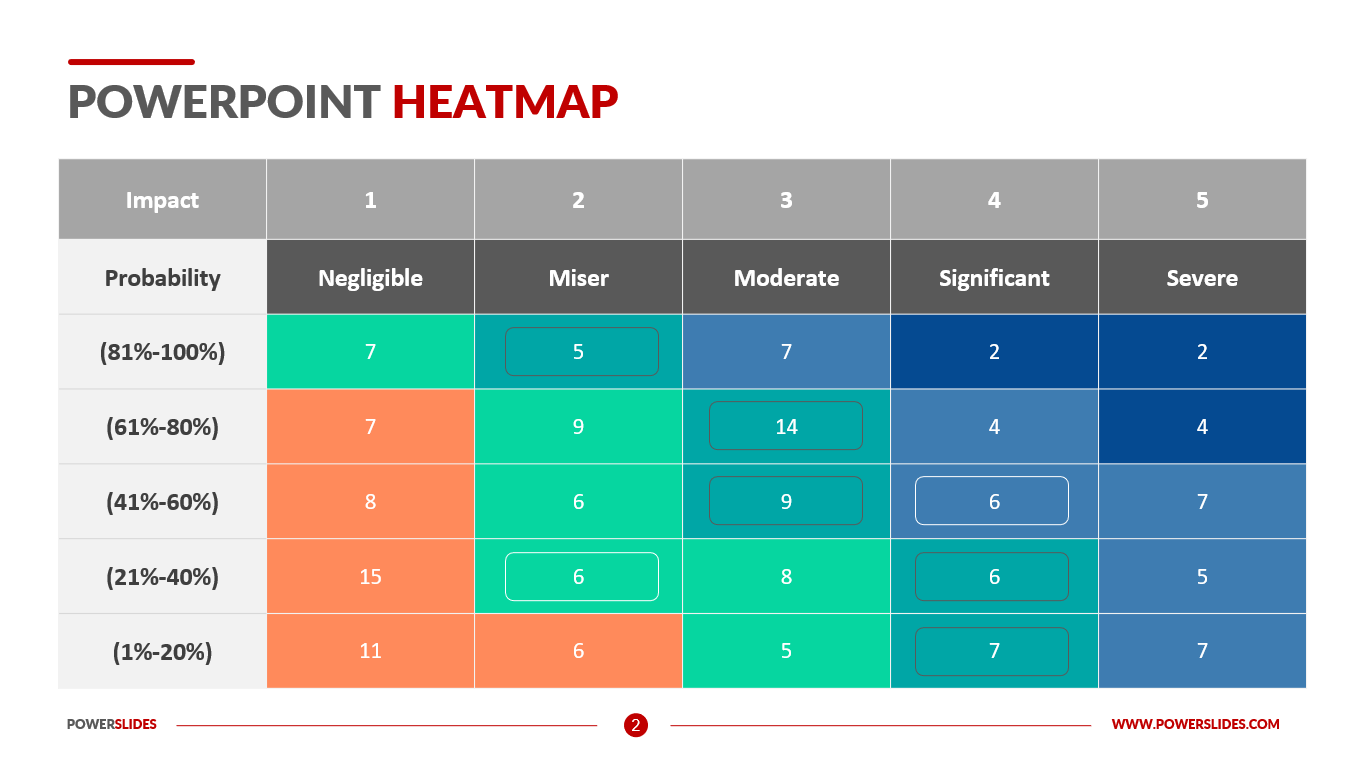
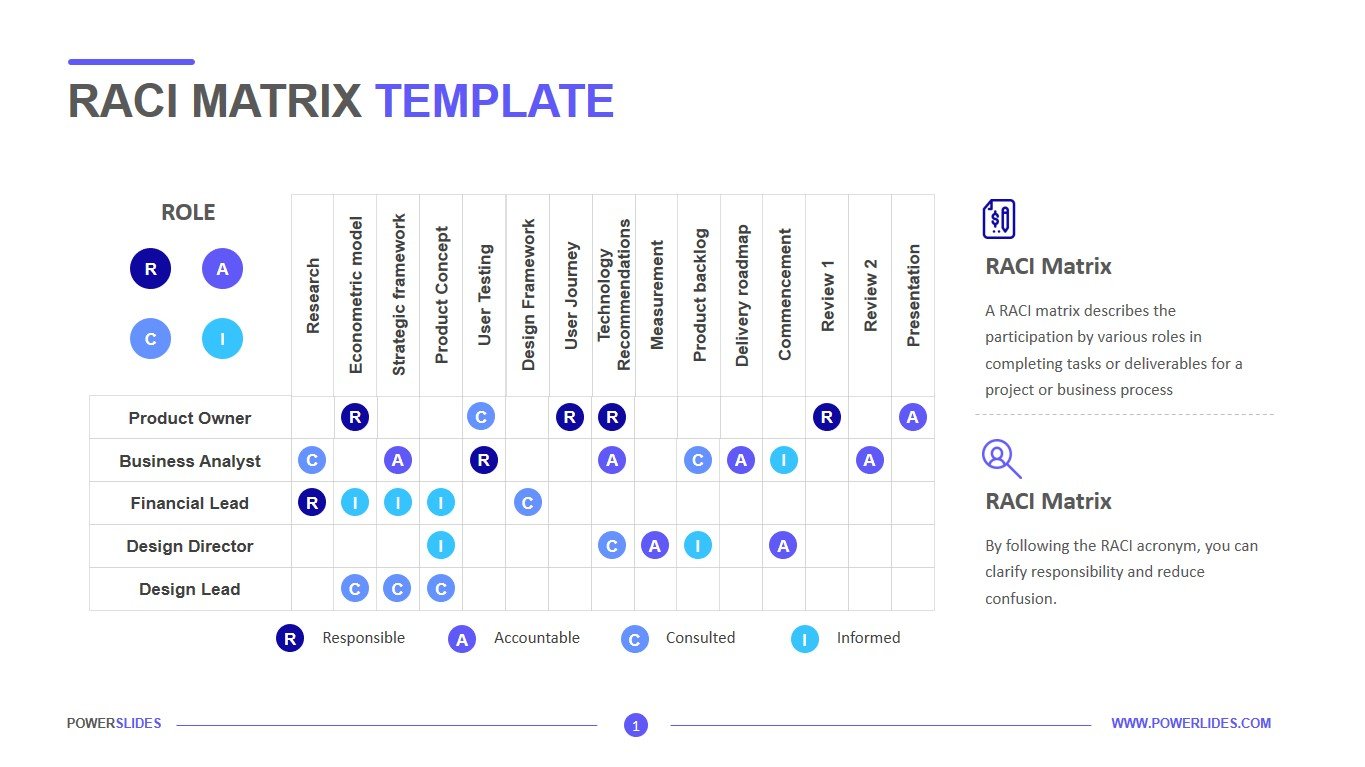
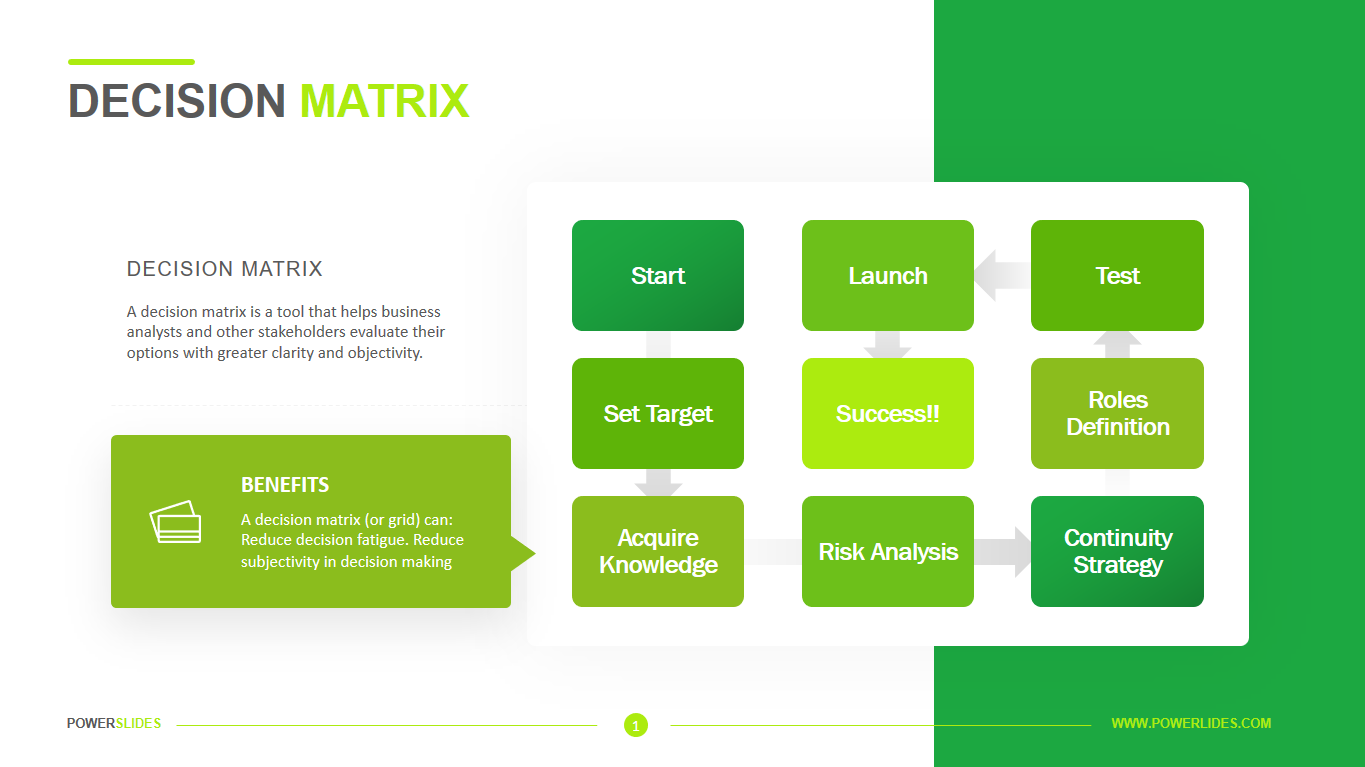
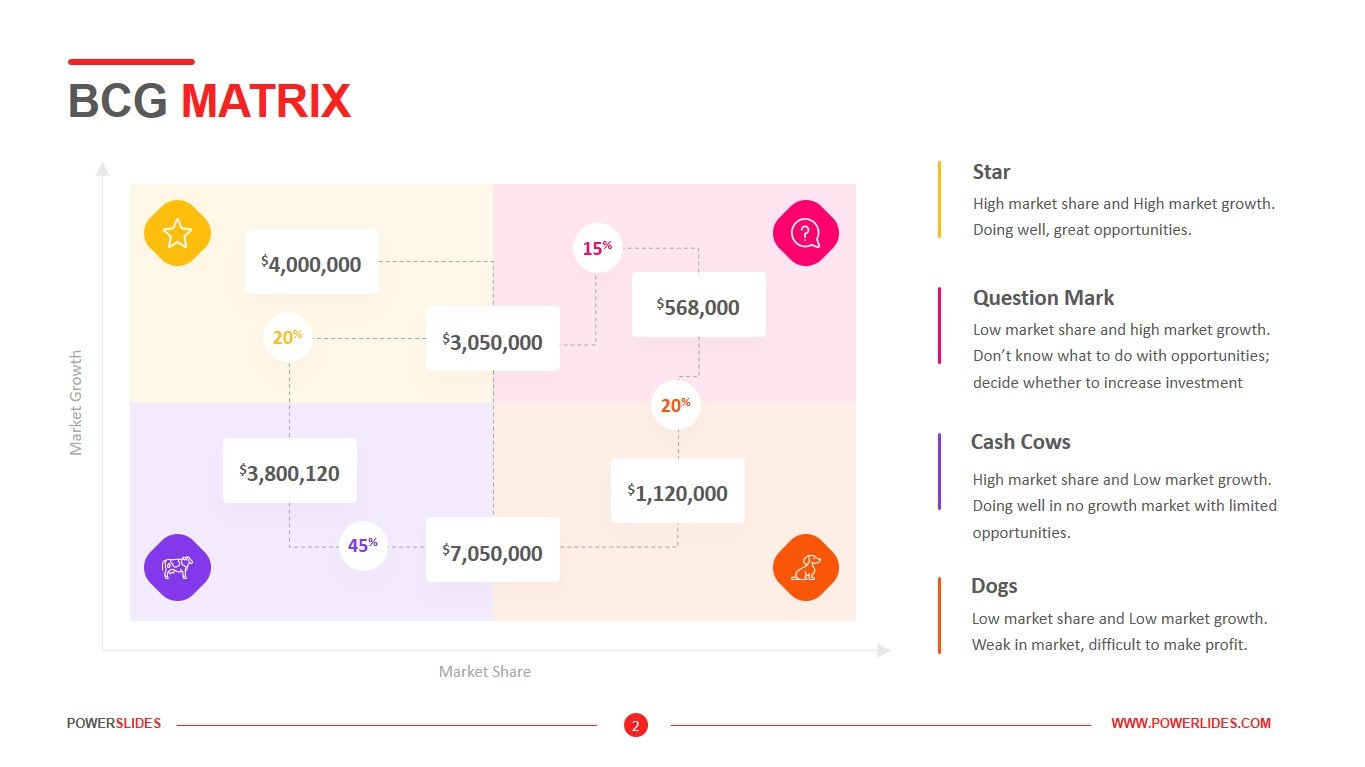
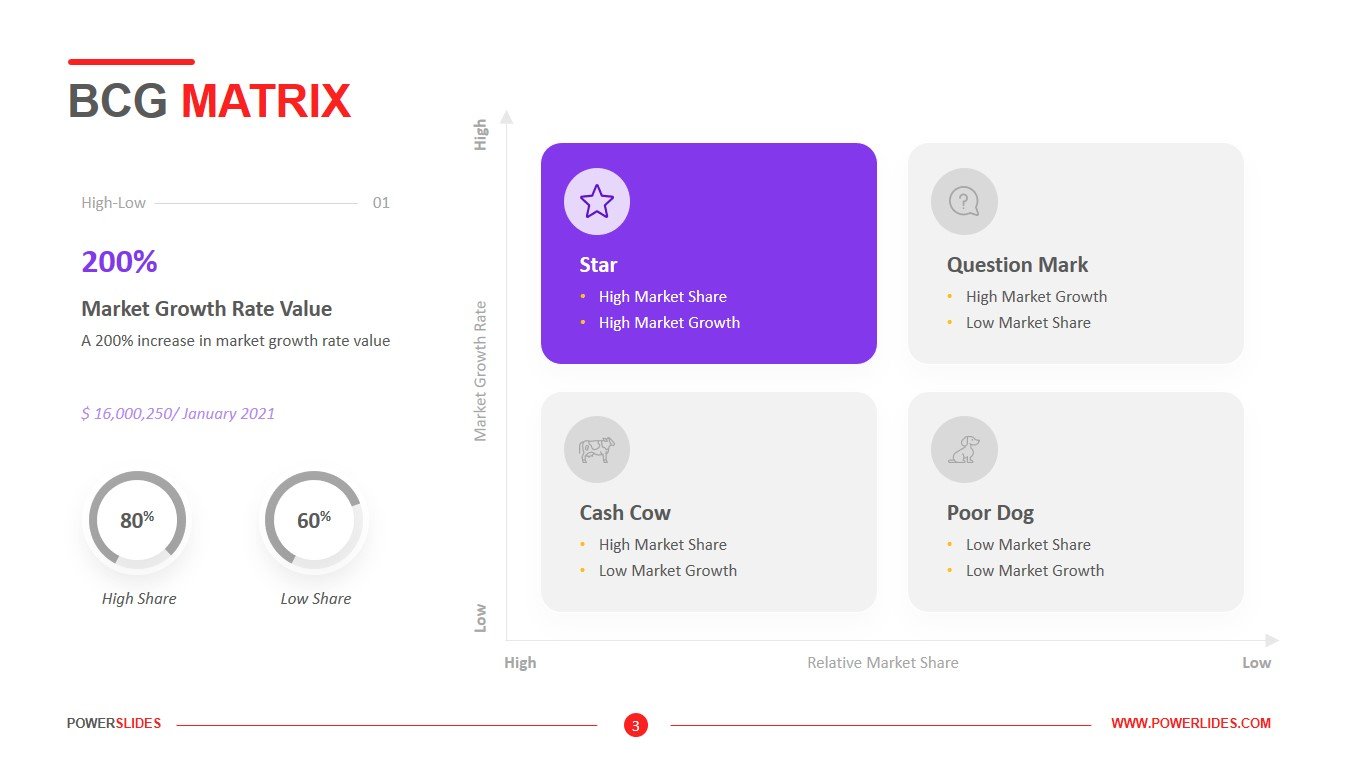
To analyze your own company, first, you will need data on the relative market share and growth rate of your products or services. When examining market growth, you need to objectively determine your competitive advantage over your largest competitor and think in terms of growth over the next three years. If your market is extremely fragmented, however, you can use absolute market share instead. Next, you can either draw a BCG matrix or plot on a PowerPoint chart. In this four-quadrant BCG matrix template, market share is shown on the horizontal line (low left, high right) and growth rate is found along the vertical line (low bottom, high top). The four quadrants are designated Stars (upper left), Question Marks (upper right), Cash Cows (lower left) and Dogs (lower right).
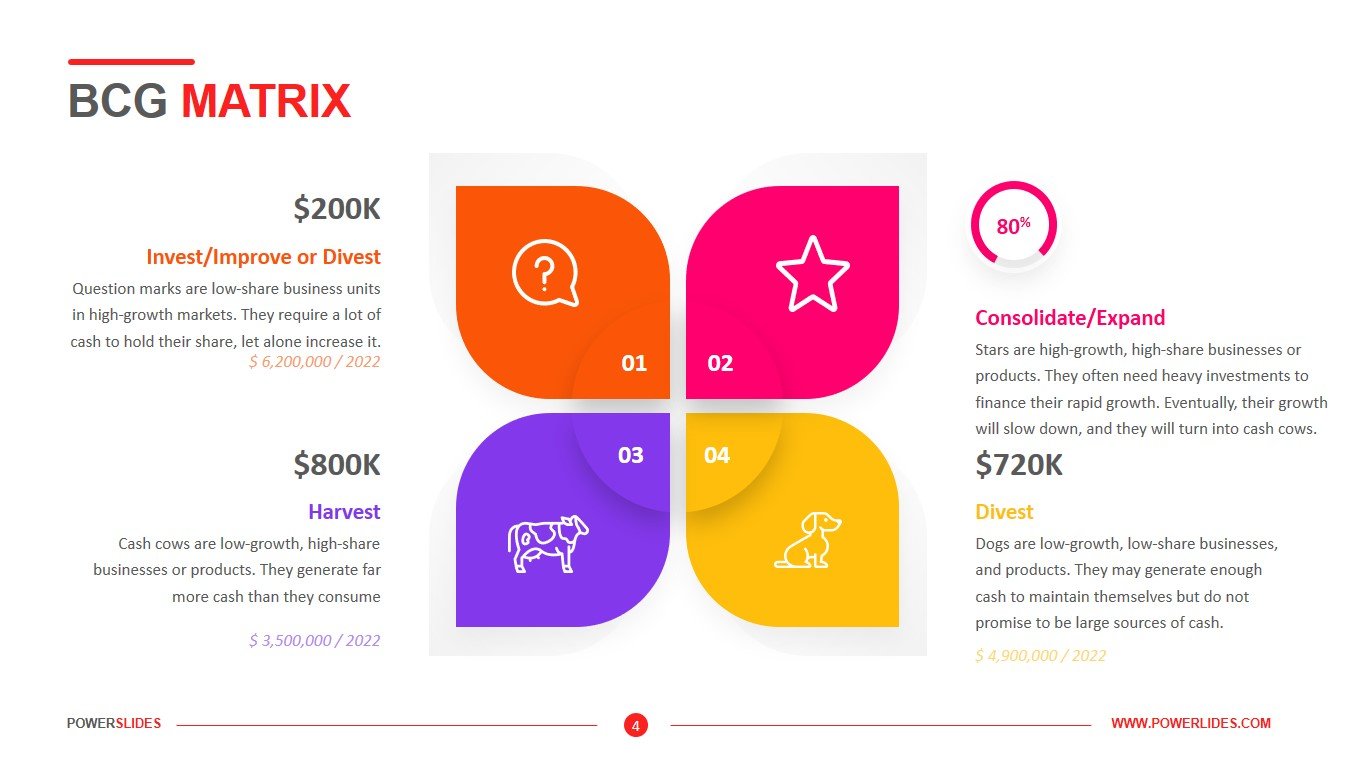
The business units or products that have the best market share and generate the most cash are considered stars. A key tenet of BCG strategy for growth is for companies to invest in stars. A cash cow is a market leader that generates more cash than it consumes. Cash cows are business units or products that have a high market share but low growth prospects. Companies are advised to invest in cash cows to maintain the current level of productivity or to milk the gains passively. Dogs, or pets as they are sometimes referred to, are units or products that have both a low market share and a low growth rate. These business units are prime candidates for divestiture. Question Marks: These parts of a business have high growth prospects but a low market share. Companies are advised to invest in question marks if the product has the potential for growth, or to sell if it does not.
BCG Matrix template consists of four slides that are designed in a modern style and in a vibrant color scheme. The slides are primarily useful for commercial directors, sales managers and marketers. Also, startups can use this template when preparing information about competitors in the market and determining the category of their new product – Stars, Question Marks, Cash Cows, Dogs. Also, this template will be useful for company executives when preparing a strategic plan for the sale of a company. If necessary, you can independently edit the slides according to your requirements.


